Sphingolipid Analysis Indicate Lactosylceramide as a Potential Biomarker of Inflammatory Bowel Disease in Children

 ,
,
Abstract
1. Introduction
2. Materials and Methods
2.1. The Study Groups
2.2. Collection of Samples for Analysis
2.3. Sphingolipids Measurement
2.4. Measurement of Blood and Fecal Inflammatory Markers
2.5. Statistical Analysis
3. Results
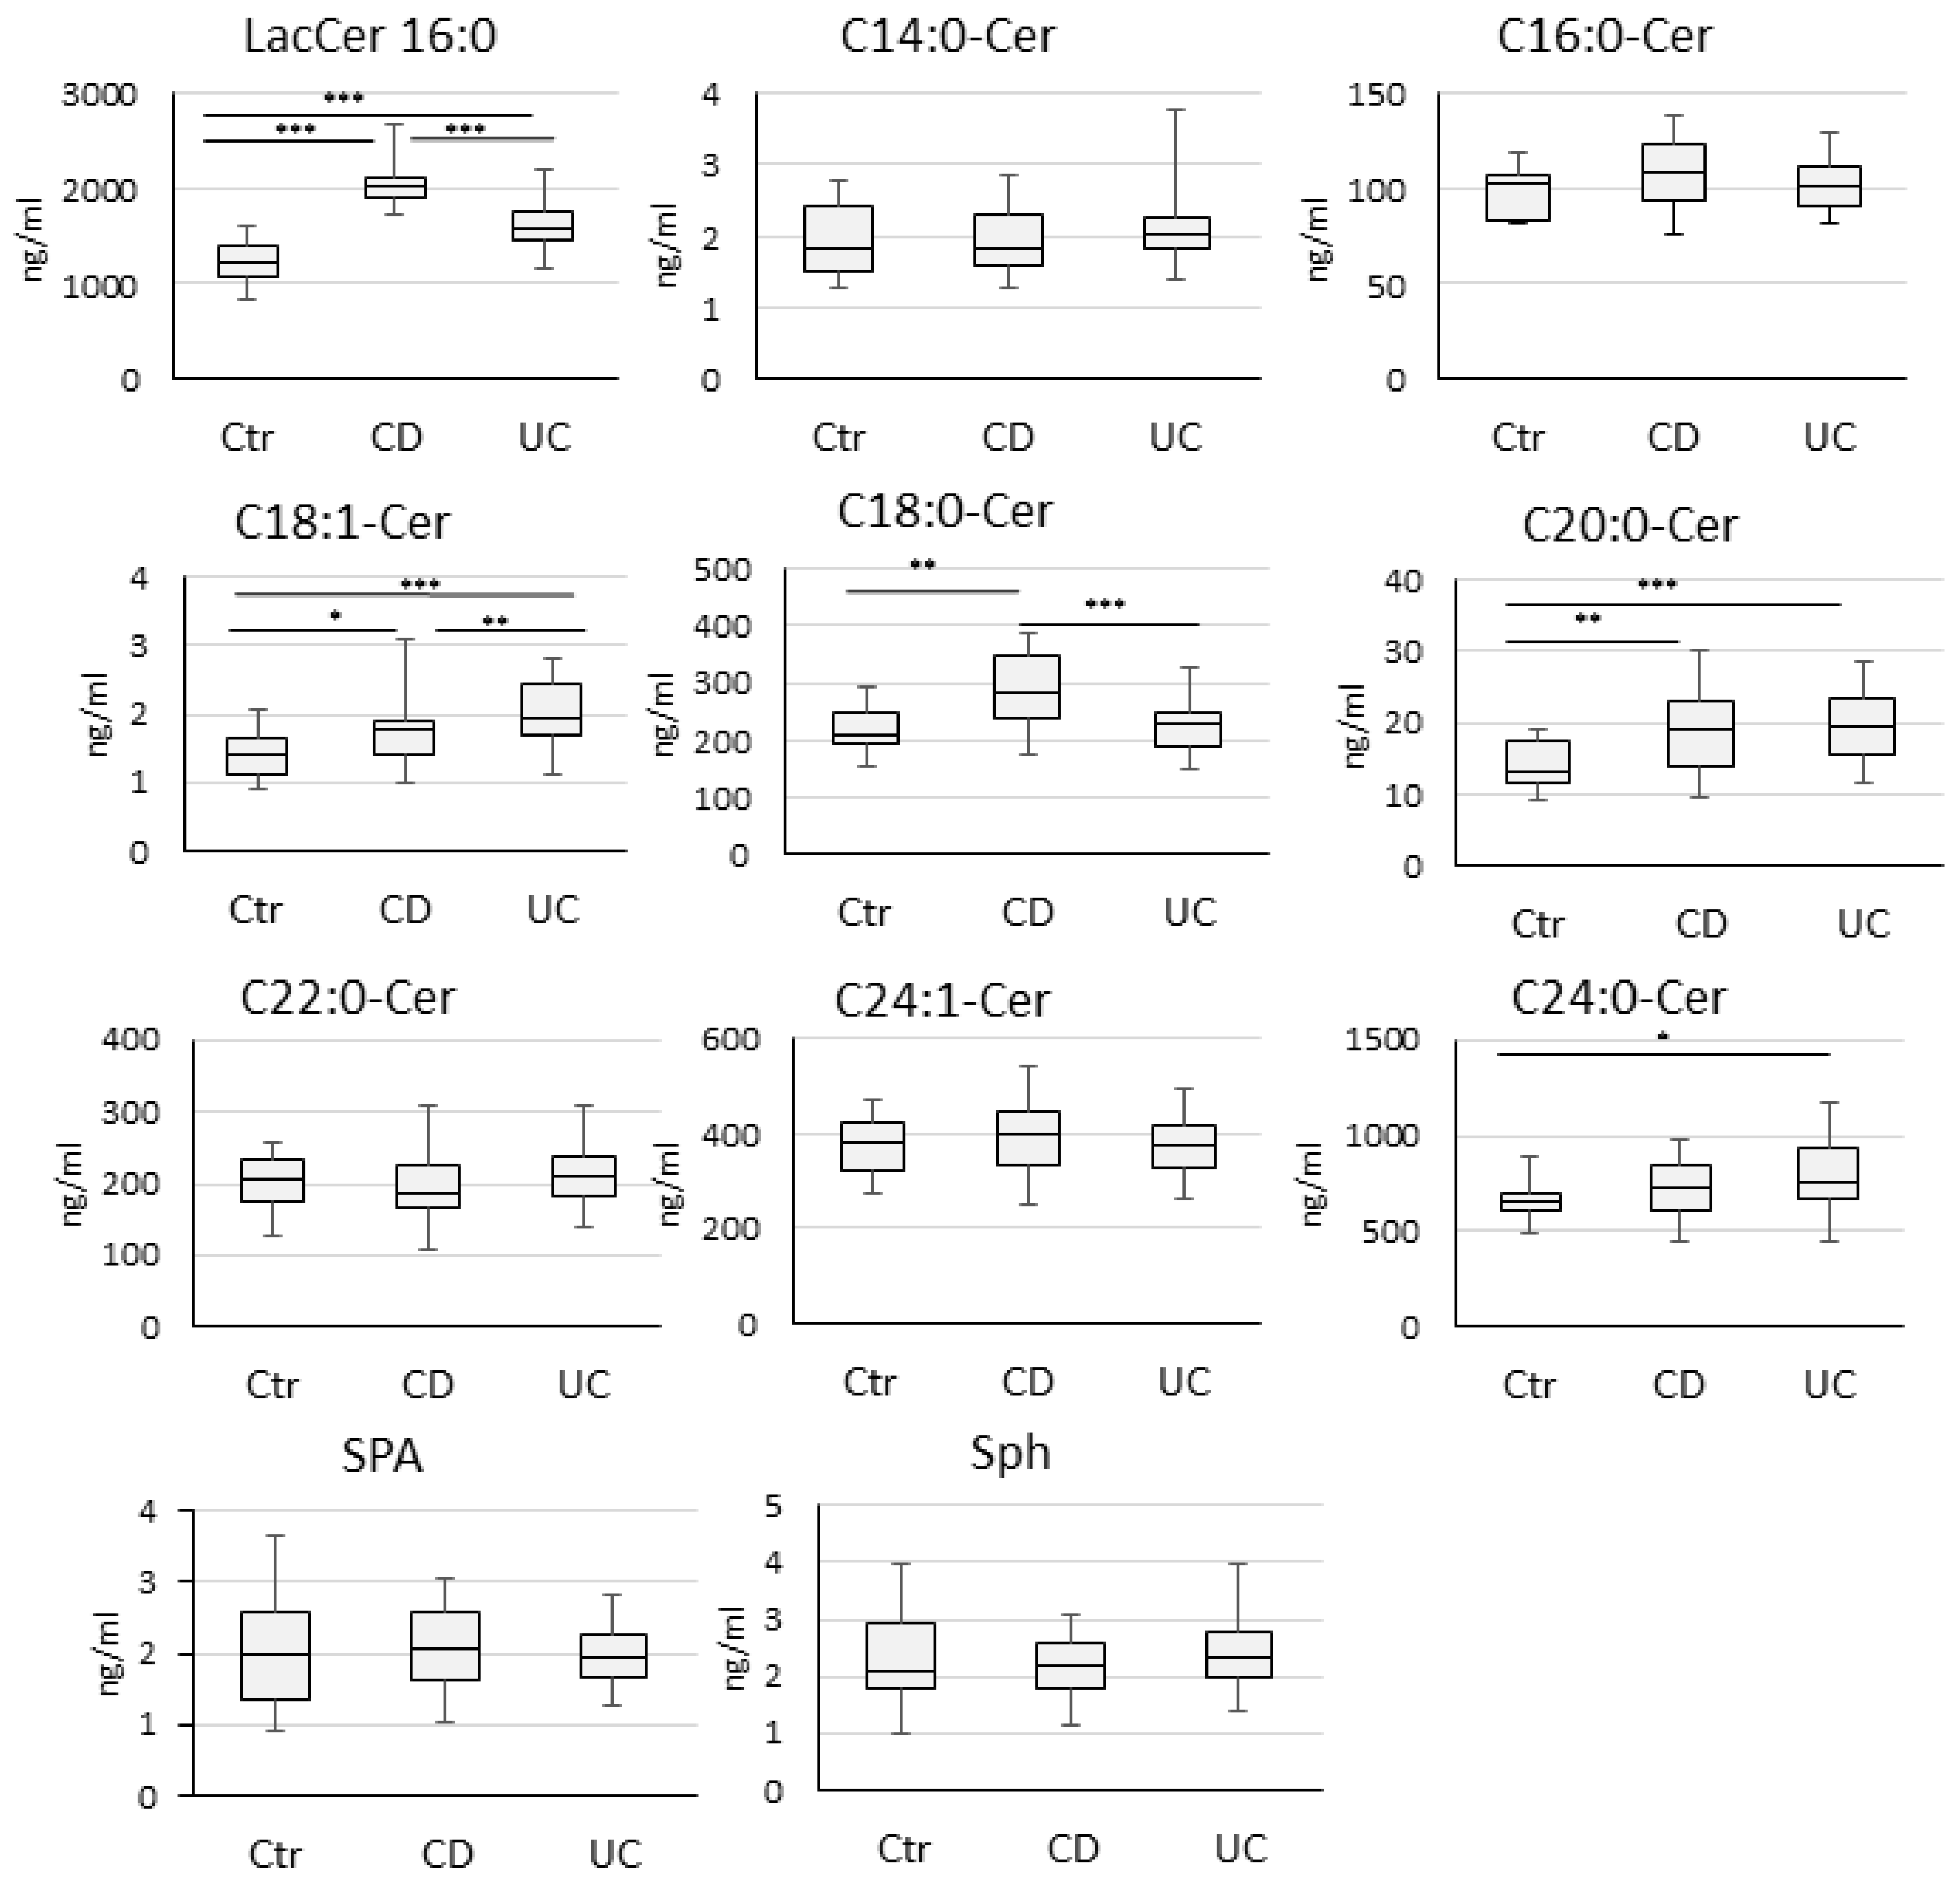
3.1. Sphingolipid Concentration in Crohn’s Disease, Ulcerative Colitis and Control Group
3.2. Correlation between Sphingolipids and the Inflammatory Parameters
4. Discussion
5. Conclusions
Supplementary Materials
Author Contributions
Funding
Conflicts of Interest
References
- Levine, A.; Koletzko, S.; Turner, D.; Escher, J.C.; Cucchiara, S.; de Ridder, L.; Kolho, K.L.; Veres, G.; Russell, R.K.; Paerregaard, A.; et al. ESPGHAN revised porto criteria for the diagnosis of inflammatory bowel disease in children and adolescents. J. Pediatr. Gastroenterol. Nutr. 2014, 58, 795–806. [Google Scholar] [CrossRef] [PubMed]
- Daniluk, U.; Daniluk, J.; Krasnodebska, M.; Lotowska, J.M.; Sobaniec-Lotowska, M.E.; Lebensztejn, D.M. The combination of fecal calprotectin with ESR, CRP and albumin discriminates more accurately children with Crohn’s disease. Adv. Med. Sci. 2019, 64, 9–14. [Google Scholar] [CrossRef] [PubMed]
- Daniluk, U.; Daniluk, J.; Kucharski, R.; Kowalczyk, T.; Pietrowska, K.; Samczuk, P.; Filimoniuk, A.; Kretowski, A.; Lebensztejn, D.; Ciborowski, M. Untargeted Metabolomics and Inflammatory Markers Profiling in Children With Crohn’s Disease and Ulcerative Colitis-A Preliminary Study. Inflamm. Bowel. Dis. 2019, 25, 1120–1128. [Google Scholar] [CrossRef] [PubMed]
- Bazarganipour, S.; Hausmann, J.; Oertel, S.; El-Hindi, K.; Brachtendorf, S.; Blumenstein, I.; Kubesch, A.; Sprinzl, K.; Birod, K.; Hahnefeld, L.; et al. The Lipid Status in Patients with Ulcerative Colitis: Sphingolipids are Disease-Dependent.Regulated. J. Clin. Med. 2019, 8, 971. [Google Scholar] [CrossRef] [PubMed]
- Diab, J.; Hansen, T.; Goll, R.; Stenlund, H.; Ahnlund, M.; Jensen, E.; Moritz, T.; Florholmen, J.; Forsdahl, G. Lipidomics in Ulcerative Colitis Reveal Alteration in Mucosal Lipid Composition Associated with the Disease State. Inflamm. Bowel Dis. 2019, 25, 1780–1787. [Google Scholar] [CrossRef] [PubMed]
- Chatterjee, S.; Pandey, A. The Yin and Yang of lactosylceramide metabolism: Implications in cell function. Biochim. Biophys. Acta 2008, 1780, 370–382. [Google Scholar] [CrossRef] [PubMed]
- Chatterjee, S.B.; Hou, J.; Bandaru, V.V.R.; Pezhouh, M.K.; Syed Rifat Mannan, A.A.; Sharma, R. Lactosylceramide synthase β-1,4-GalT-V: A novel target for the diagnosis and therapy of human colorectal cancer. Biochem. Biophys. Res. Commun. 2019, 508, 380–386. [Google Scholar] [CrossRef] [PubMed]
- Nakayama, H.; Yoshizaki, F.; Prinetti, A.; Sonnino, S.; Mauri, L.; Takamori, K.; Ogawa, H.; Iwabuchi, K. Lyn-coupled LacCer-enriched lipid rafts are required for CD11b/CD18-mediated neutrophil phagocytosis of nonopsonized microorganisms. J. Leukoc. Biol. 2008, 83, 728–741. [Google Scholar] [CrossRef] [PubMed]
- Pannu, R.; Singh, A.K.; Singh, I. A novel role of lactosylceramide in the regulation of tumor necrosis factor alpha-mediated proliferation of rat primary astrocytes. Implications for astrogliosis following neurotrauma. J. Biol. Chem. 2005, 280, 13742–13751. [Google Scholar] [CrossRef]
- Bielawski, J.; Pierce, J.S.; Snider, J.; Rembiesa, B.; Szulc, Z.M.; Bielawska, A. Comprehensive quantitative analysis of bioactive sphingolipids by high-performance liquid chromatography-tandem mass spectrometry. Methods Mol. Biol. 2009, 579, 443–467. [Google Scholar]
- Stevens, C.R.; Oberholzer, V.G.; Walker-Smith, J.A.; Phillips, A.D. Lactosylceramide in inflammatory bowel disease: A biochemical study. Gut 1988, 29, 580–587. [Google Scholar] [CrossRef]
- Filimoniuk, A.; Daniluk, U.; Samczuk, P.; Wasilewska, N.; Jakimiec, P.; Kucharska, M.; Lebensztejn, D.M.; Ciborowski, M. Metabolomic profiling in children with inflammatory bowel disease. Adv. Med. Sci. 2020, 65, 65–70. [Google Scholar] [CrossRef]
- Bhunia, A.K.; Arai, T.; Bulkley, G.; Chatterjee, S. Lactosylceramide mediates tumor necrosis factor-alpha-induced intercellular adhesion molecule-1 (ICAM-1) expression and the adhesion of neutrophil in human umbilical vein endothelial cells. J. Biol. Chem. 1998, 273, 34349–34357. [Google Scholar] [CrossRef]
- Chatterjee, S.B.; Dey, S.; Shi, W.Y.; Thomas, K.; Hutchins, G.M. Accumulation of glycosphingolipids in human atherosclerotic plaque and unaffected aorta tissues. Glycobiology 1997, 7, 57–65. [Google Scholar] [CrossRef] [PubMed]


| Characteristic | UC | CD | Ctr | p |
|---|---|---|---|---|
| N° of pts | 39 | 34 | 24 | NA |
| Age (median years) | 14 (4–17) | 13.5 (6–17) | 11.5 (4–17) | NS |
| Gender (male) | 18 | 22 | 13 | NS |
| Disease activity index – median (range) | PUCAI 45 (10–75) | PCDAI 25 (5–55) | NA | NA |
| Paris classification (No. of pts) | ||||
| Location - L1/L2/L3 | NA | 17/3/14 | NA | NA |
| Behavior - B1/B2/B2B3 | NA | 11/20/3 | NA | NA |
| Growth - G0/G1 | NA | 22/12 | NA | NA |
| Extent - E1/E2/E3/E4 | 9/8/9/13 | NA | NA | NA |
| SES-CD | NA | 11.5 (0–31) | NA | NA |
| Mayo endoscopic score I/II/III | 6/16/17 | NA | NA | NA |
| ESR (mm/h); median (range) | 17 (2–130) | 38 (2–120) | 2 (2–13) | <0.00001 a |
| CRP (mg/l); median (range) | 3.7 (0.1–299) | 24.5 (0.67–342) | 0.3 (0.3–1.7) | <0.00001 a |
| fCal (µg/g); median (range) | 1789 (18.6–3405) | 1928 (522–3479) | 16 (3.8–64) | <0.00001 a |
| Marker | AUC | SE | 95% C.I. (AUC) | p | Cut-Off | Sensit | Specific | PPV | NPV | ACC |
|---|---|---|---|---|---|---|---|---|---|---|
| 1/ CD vs Ctr | ||||||||||
| C16:0-LacCer | 1.0 | 0 | (1.0–1.0) | <0.000001 | >1724.595 | 100% | 100% | 100% | 100% | 100% |
| C18:1-Cer | 0.694 | 0.081 | (0.535–0.854) | <0.05 | >1.375 | 84.4% | 50.0% | 77.1% | 61.5% | 72.9% |
| C18:0-Cer | 0.783 | 0.067 | (0.652–0.915) | <0.00001 | >226.648 | 87.5% | 62.5% | 82.4% | 71.4% | 79.2% |
| C20:0-Cer | 0.736 | 0.071 | (0.597–0.876) | <0.001 | >19.206 | 50% | 100% | 100% | 50% | 66.7% |
| 2/ UC vs Ctr | ||||||||||
| C16:0-LacCer | 0.882 | 0.051 | (0.781–0.982) | <0.000001 | >1279.717 | 97.4% | 68.8% | 88.1% | 91.7% | 88.9% |
| C18:1-Cer | 0.826 | 0.059 | (0.711–0.941) | <0.000001 | >1.66 | 78.9% | 75.0% | 88.2% | 60.0% | 77.8% |
| C24:0-Cer | 0.694 | 0.073 | (0.55–0.838) | <0.01 | >710.722 | 63.2% | 81.3% | 88.9% | 48.1% | 68.5% |
| 3/CD vs UC | ||||||||||
| C16:0-LacCer | 0.84 | 0.049 | (0.745–0.936) | <0.000001 | >1825.359 | 90.6% | 73.7% | 74.4% | 90.3% | 81.4% |
| C18:1-Cer | 0.673 | 0.065 | (0.547–0.8) | <0.01 | >1.914 | 75.0% | 57.9% | 60.0% | 73.3% | 65.7% |
| C18:0-Cer | 0.787 | 0.055 | (0.679–0.895) | <0.00001 | >263.367 | 65.6% | 86.8% | 80.8% | 75.0% | 77.1% |
| Variables | C16:0-LacCer | C18:0-Cer | C18:1-Cer | C20:0-Cer | C24:0-Cer |
|---|---|---|---|---|---|
| CD group | |||||
| CRP | R = 0.198 p = 0.25 | R = 0.136 p = 0.46 | R = 0.038 p = 0.83 | R = 0.109 p = 0.55 | NA |
| ESR | R = 0.253 p = 0.15 | R = 0.580 p = 0.0007 | R = 0.344 p = 0.06 | R = 0.271 p = 0.15 | NA |
| Albumin | R = −0.377 p = 0.036 | R = −0.481 p = 0.006 | R = −0.433 p = 0.01 | R = −0.406 p = 0.023 | NA |
| WBC | R = 0.013 p = 0.94 | R = 0.441 p = 0.01 | R = −0.02 p = 0.89 | R = −0.20 p = 0.25 | NA |
| Hb | R = −0.451 p = 0.01 | R = −0.432 p = 0.01 | R = −0.410 p = 0.02 | R = −0.507 p = 0.003 | NA |
| PLT | R = 0.323 p = 0.07 | R = 0.626 p = 0.0001 | R= 0.548 p = 0.001 | R = 0.099 p = 0.59 | NA |
| fCal | R = 0.070 p = 0.69 | R = 0.293 p = 0.10 | R = 0.147 p = 0.42 | R = 0.127 p = 0.49 | NA |
| PCDAI | R = 0.252 p = 0.14 | R = 0.261 p = 0.15 | R = 0.382 p = 0.03 | R = 0.009 p = 0.959 | NA |
| SES-CD | R = 0.109 p = 0.56 | R = 0.057 p = 0.75 | R = 0.09 p = 0.61 | R = −0.05 p = 0.755 | NA |
| UC group | |||||
| CRP | R = 0.442 p = 0.005 | NA | R = 0.054 p = 0.74 | R = 0.099 p = 0.55 | R = −0.226 p = 0.17 |
| ESR | R = 0.200 p = 0.23 | NA | R = 0.226 p = 0.19 | R = 0.122 p = 0.48 | R = −0.127 p = 0.46 |
| Albumin | R = −0.320 p = 0.049 | NA | R = −0.05 p = 0.73 | R = −0.183 p = 0.27 | R = 0.217 p = 0.19 |
| WBC | R = 0.358 p = 0.027 | NA | R = 0.054 p = 0.74 | R = 0.135 p = 0.41 | R = −0.352 p = 0.03 |
| Hb | R = −0.165 p = 0.319 | NA | R = −0.251 p = 0.12 | R = −0.029 p = 0.85 | R = −0.01 p = 0.91 |
| PLT | R = 0.403 p = 0.012 | NA | R = 0.271 p = 0.09 | R = 0.284 p = 0.08 | R = −0.166 p = 0.31 |
| fCal | R = 0.121 p = 0.46 | NA | R = 0.077 p = 0.64 | R = −0.043 p = 0.79 | R = −0.296 p = 0.07 |
| PUCAI | R = 0.053 p = 0.74 | NA | R = −0.09 p = 0.58 | R = 0.147 p = 0.37 | R = −0.341 p = 0.03 |
| Mayo score | R = −0.13 p = 0.43 | NA | R = −0.149 p = 0.37 | R = −0.05 p = 0.72 | R = −0.126 p = 0.44 |
© 2020 by the authors. Licensee MDPI, Basel, Switzerland. This article is an open access article distributed under the terms and conditions of the Creative Commons Attribution (CC BY) license (http://creativecommons.org/licenses/by/4.0/).
Share and Cite
Filimoniuk, A.; Blachnio-Zabielska, A.; Imierska, M.; Lebensztejn, D.M.; Daniluk, U. Sphingolipid Analysis Indicate Lactosylceramide as a Potential Biomarker of Inflammatory Bowel Disease in Children. Biomolecules 2020, 10, 1083. https://doi.org/10.3390/biom10071083
Filimoniuk A, Blachnio-Zabielska A, Imierska M, Lebensztejn DM, Daniluk U. Sphingolipid Analysis Indicate Lactosylceramide as a Potential Biomarker of Inflammatory Bowel Disease in Children. Biomolecules. 2020; 10(7):1083. https://doi.org/10.3390/biom10071083
Chicago/Turabian StyleFilimoniuk, Aleksandra, Agnieszka Blachnio-Zabielska, Monika Imierska, Dariusz Marek Lebensztejn, and Urszula Daniluk. 2020. "Sphingolipid Analysis Indicate Lactosylceramide as a Potential Biomarker of Inflammatory Bowel Disease in Children" Biomolecules 10, no. 7: 1083. https://doi.org/10.3390/biom10071083
APA StyleFilimoniuk, A., Blachnio-Zabielska, A., Imierska, M., Lebensztejn, D. M., & Daniluk, U. (2020). Sphingolipid Analysis Indicate Lactosylceramide as a Potential Biomarker of Inflammatory Bowel Disease in Children. Biomolecules, 10(7), 1083. https://doi.org/10.3390/biom10071083