Development of Methods Derived from Iodine-Induced Specific Cleavage for Identification and Quantitation of DNA Phosphorothioate Modifications
Abstract
1. Introduction
2. Materials and Methods
2.1. Materials
- E. coli strain DH10B was purchased from Novagen. Salmonella enterica serovar Cerro 87 was supplied by Professor Toshiyuki Murase (Tottori University, Japan), and E. coli strain B7A was obtained from Dr Jaquelyn Fleckenstein (Departments of Medicine and Molecular Sciences, University of Tennessee Health Science Center).
- Mono nucleosides standard samples (A, G, C, T) and PT-modified dinucleotide standard samples (GpsA, GpsT) were synthesized by Sangon Biotech Co. Ltd. (Shanghai, China).
- MicroSpin G-25 columns (GE Healthcare, Pittsburgh, PA, USA).
- Pipettes, tips and microcentrifuge tubes (Eppendorf, Hamburg, Germany).
2.2. Reagents
- Ethanol (Sigma-Aldrich, St. Louis, MO, USA).
- Acetic acid (Sigma-Aldrich, St. Louis, MO, USA).
- I2 (Sigma-Aldrich, St. Louis, MO, USA).
- dNTP (Sigma-Aldrich, St. Louis, MO, USA).
- Nuclease P1 (Sigma-Aldrich, St. Louis, MO, USA).
- DNA ladder (Thermo Fisher Scientific, Waltham, MA, USA).
- DNA Gel Loading Dye (Thermo Fisher Scientific, Waltham, MA, USA).
- Fast AP Thermosensitive Alkaline Phosphatase (Thermo Fisher Scientific, Waltham, MA, USA).
- Klenow Fragment (3′→5′ exo-) (New England BioLabs, Ipswich, MA, USA).
- Buffer 2 (New England BioLabs, Ipswich, MA, USA).
- dATP (New England BioLabs, Ipswich, MA, USA).
- T4 DNA ligase (New England BioLabs, Ipswich, MA, USA).
2.3. Chemicals
- Agarose (Sigma-Aldrich, St. Louis, MO, USA).
- NaCl (Sigma-Aldrich, St. Louis, MO, USA).
- Na2HPO4 (Sigma-Aldrich, St. Louis, MO, USA).
- EDTA (Sigma-Aldrich, St. Louis, MO, USA).
- ZnCl2 (Sigma-Aldrich, St. Louis, MO, USA).
- Thiourea (Sigma-Aldrich, St. Louis, MO, USA).
- Sodium acetate (Sigma-Aldrich, St. Louis, MO, USA).
- Tryptone (Sigma-Aldrich, St. Louis, MO, USA).
- Yeast Extract (Sigma-Aldrich, St. Louis, MO, USA).
- Tris (Sigma-Aldrich, St. Louis, MO, USA).
2.4. Kits
- Bacterial DNA Kit (OMEGA, Norcross, GA, USA).
- Plasmid Mini Kit (OMEGA, Norcross, GA, USA).
- Bacterial DNA Kit (OMEGA, Norcross, GA, USA).
- Cycle Pure Kit (OMEGA, Norcross, GA, USA).
- Quant-iT™ PicoGreen™ dsDNA Assay Kit (Thermo Fisher Scientific, Waltham, MA, USA).
- Quick BluntingTM kit (New England BioLabs, Ipswich, MA, USA).
- NEBNext DNA Library Prep Reagent Set for Illumina (New England BioLabs, Ipswich, MA, USA).
- Equipment
- Horizontal Electrophoresis Systems (BIO-RAD, Hercules, CA, USA).
- T100TM Polymerase Chain Reaction (PCR) Systems (BIO-RAD, Hercules, CA, USA).
- 1260 Infinity II High Performance Liquid Chromatography (HPLC) Systems (Agilent, Palo Alto, CA, USA).
- QQQ 6470 LC-MS/MS Systems (Agilent, Palo Alto, CA, USA).
- Bioanalyzer Instrument 2100 (Agilent, Palo Alto, CA, USA).
- Heated Circulating Baths (Thermo Fisher Scientific, Waltham, MA, USA).
- NanoDrop 2000 (Thermo Fisher Scientific, Waltham, MA, USA).
- Qubit™4 Fluorometer (Thermo Fisher Scientific, Waltham, MA, USA).
- UV Spectrophotometer (HACH, Loveland, CO, USA).
- Constant Temperature Heater (Eppendorf, Hamburg, Germany).
- Sonoplus HD2070 Sonicator (Bandelin, Berlin, Germany).
- SPRIworks Fragment Library System (Beckman, Brea, CA, USA).
- Freeze Dryer (Labconco, Kansas City, MO, USA).
2.5. Primers
- Duplex tag-sequence
- F1: 5‘-Phos/TTTAACCGCGAATTCCAG/ddC/-3′ (DNA, HPLC-purified)
- R1: 5‘-GCTGGAATTCGCGGTTAAAT-3′ (DNA, HPLC-purified)
- Enriched PCR primers
- F2: 5‘-CAAGCAGAAGACGGAATACGA-3′ (DNA, PAGE-purified)
- R2: 5‘-AATGATACGGCGACCACCGAGATCTACACTCTTTCCCTACACGACG
- CTCTTCCGATCTGCTGGAATTCGCGGTTAAAT-3′ (DNA, PAGE-purified)
2.6. Methods
2.6.1. Sample Preparation (Using E. coli B7A as an Example)
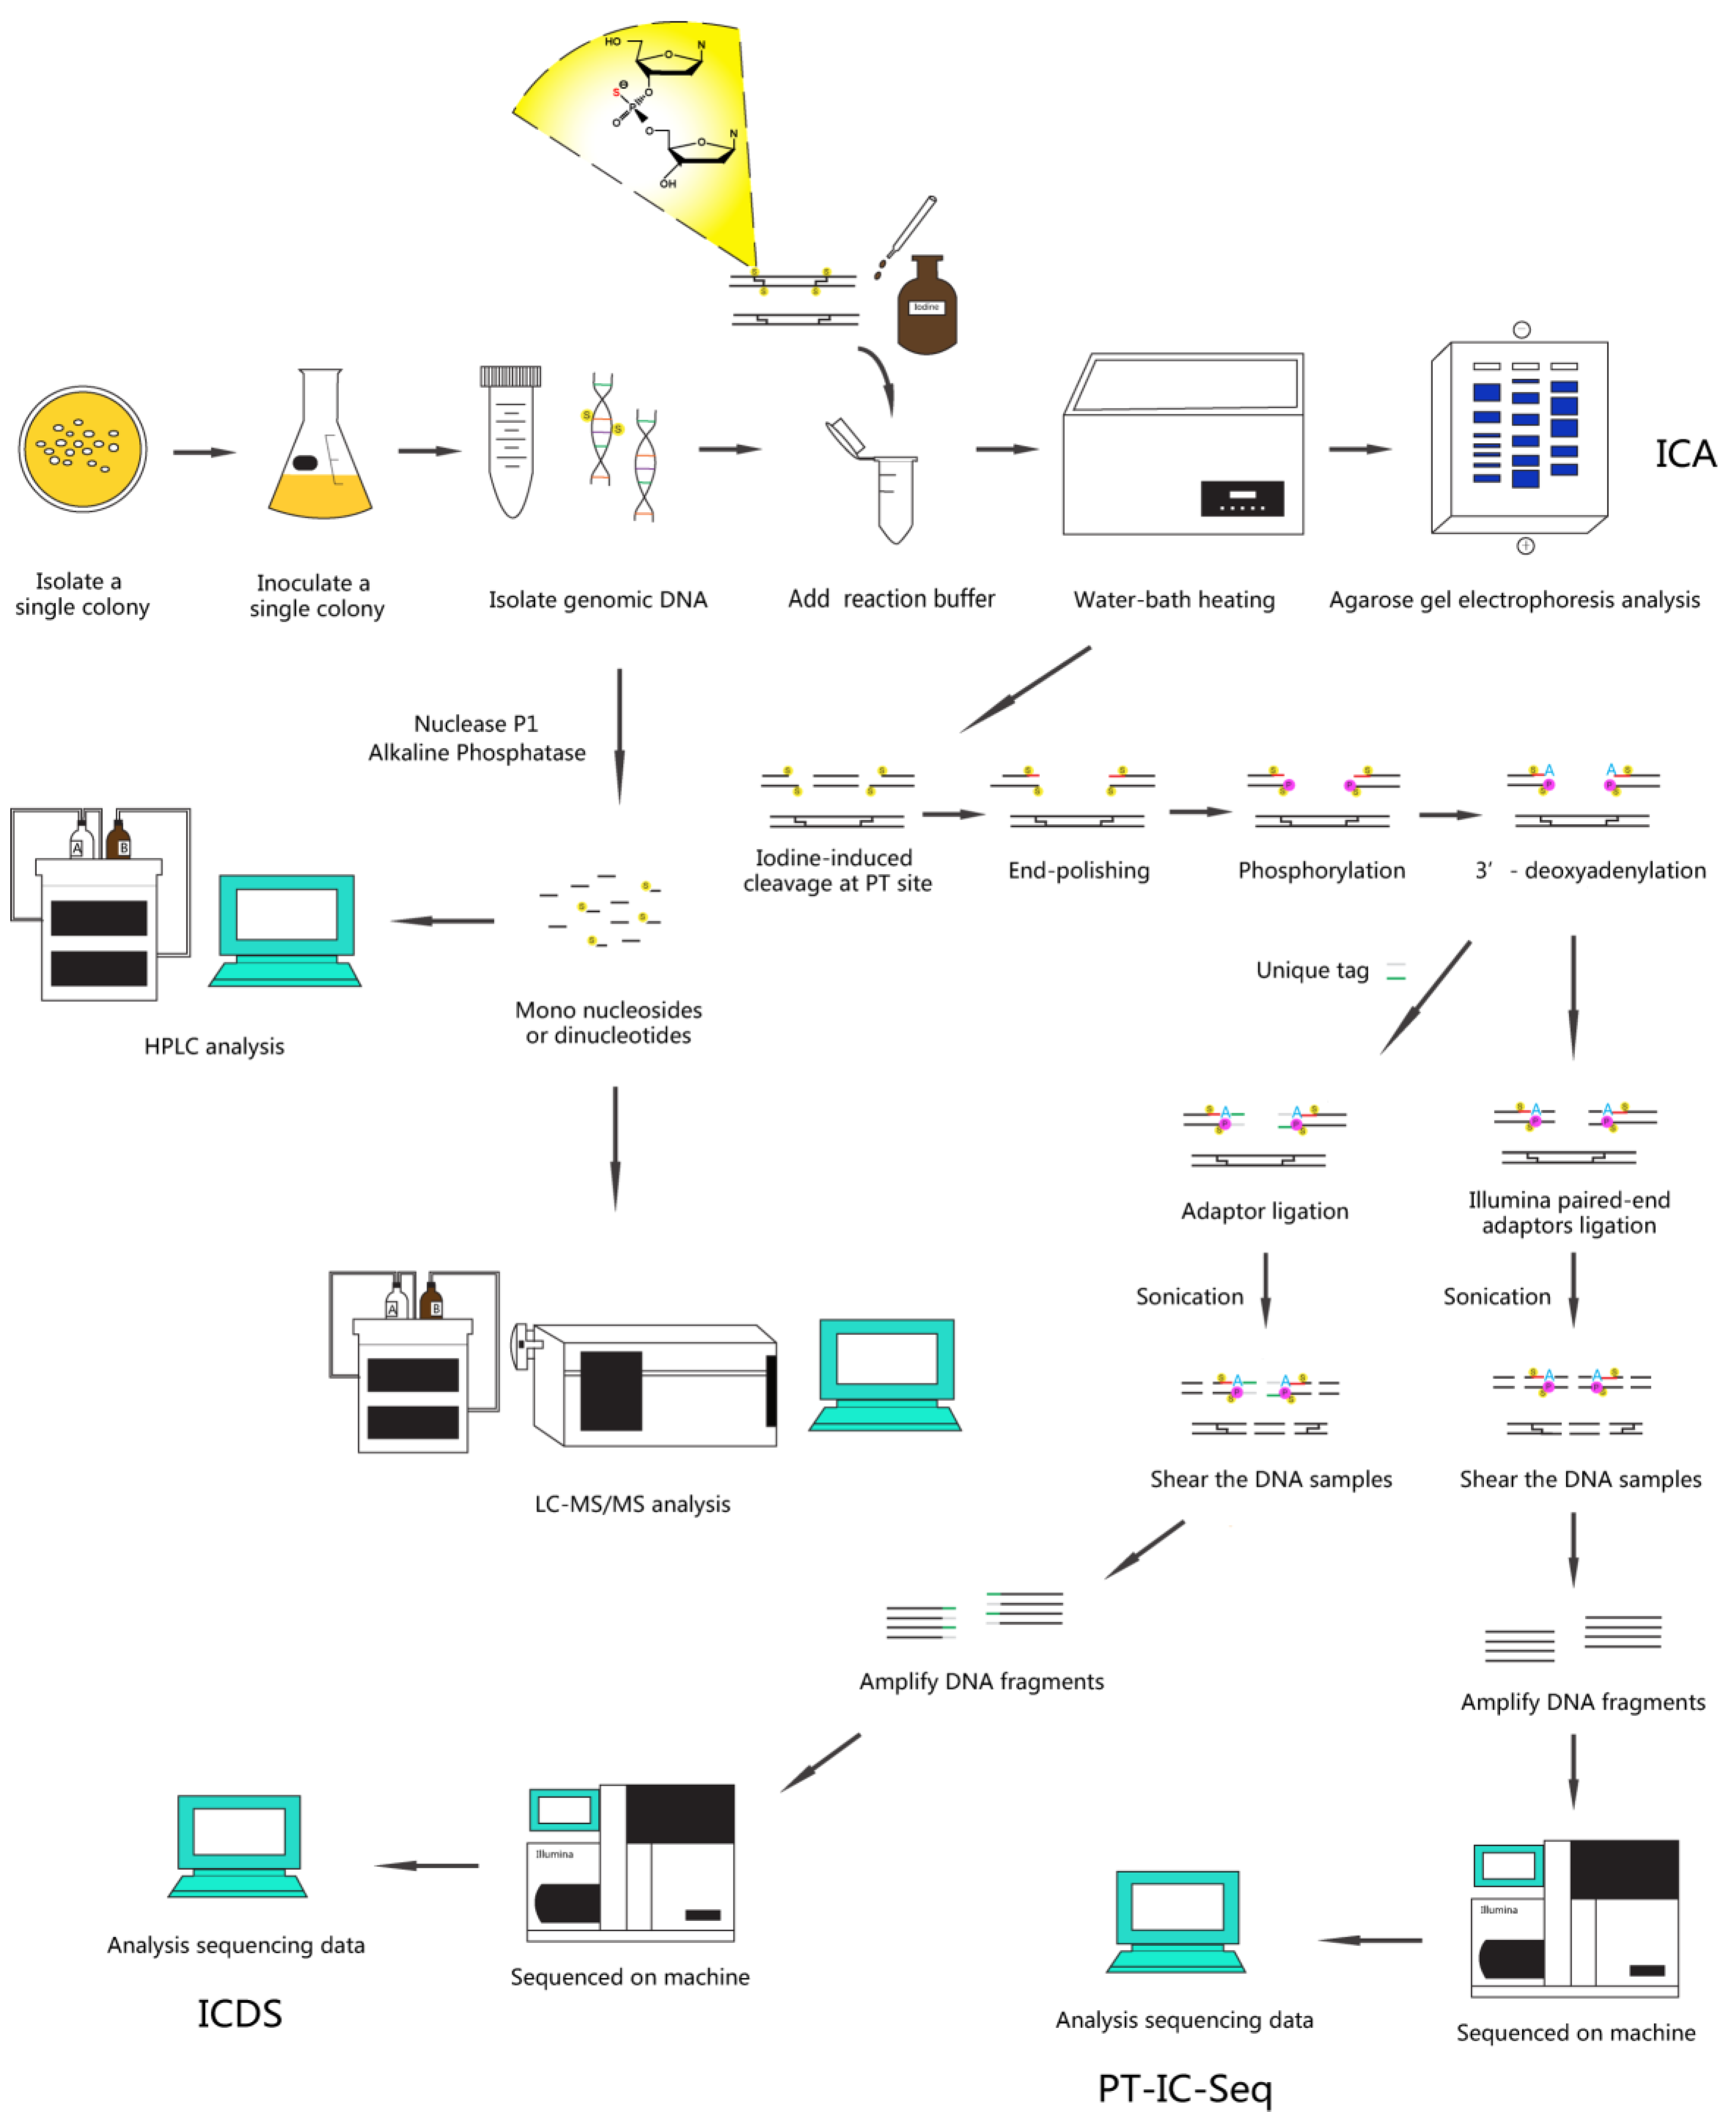
- Isolate a single colony from a freshly streaked selective plate and regrown in Luria-Bertani (LB) medium at 37 °C for overnight or to logarithmic phase.
- Harvest cells by centrifugation at 10,000 rpm for 2 min.
- Aspirate and discard the media.
- Extract gDNA using the Bacterial DNA Kit according to the manufacturer’s instructions.
- Store eluted DNA at −80 °C until ready for use in following experiments.
- [Note: For optimal DNA yields, the starting culture volume should be based on culture cell density. From experience, the cell density at 600 nm (OD600) of 2.0~3.0 is recommended.]
2.6.2. ICA Assay
- Prepare the 10 × ICA Reaction Buffer (500 mM Na2HPO4, pH 9.0, 30 mM iodine).
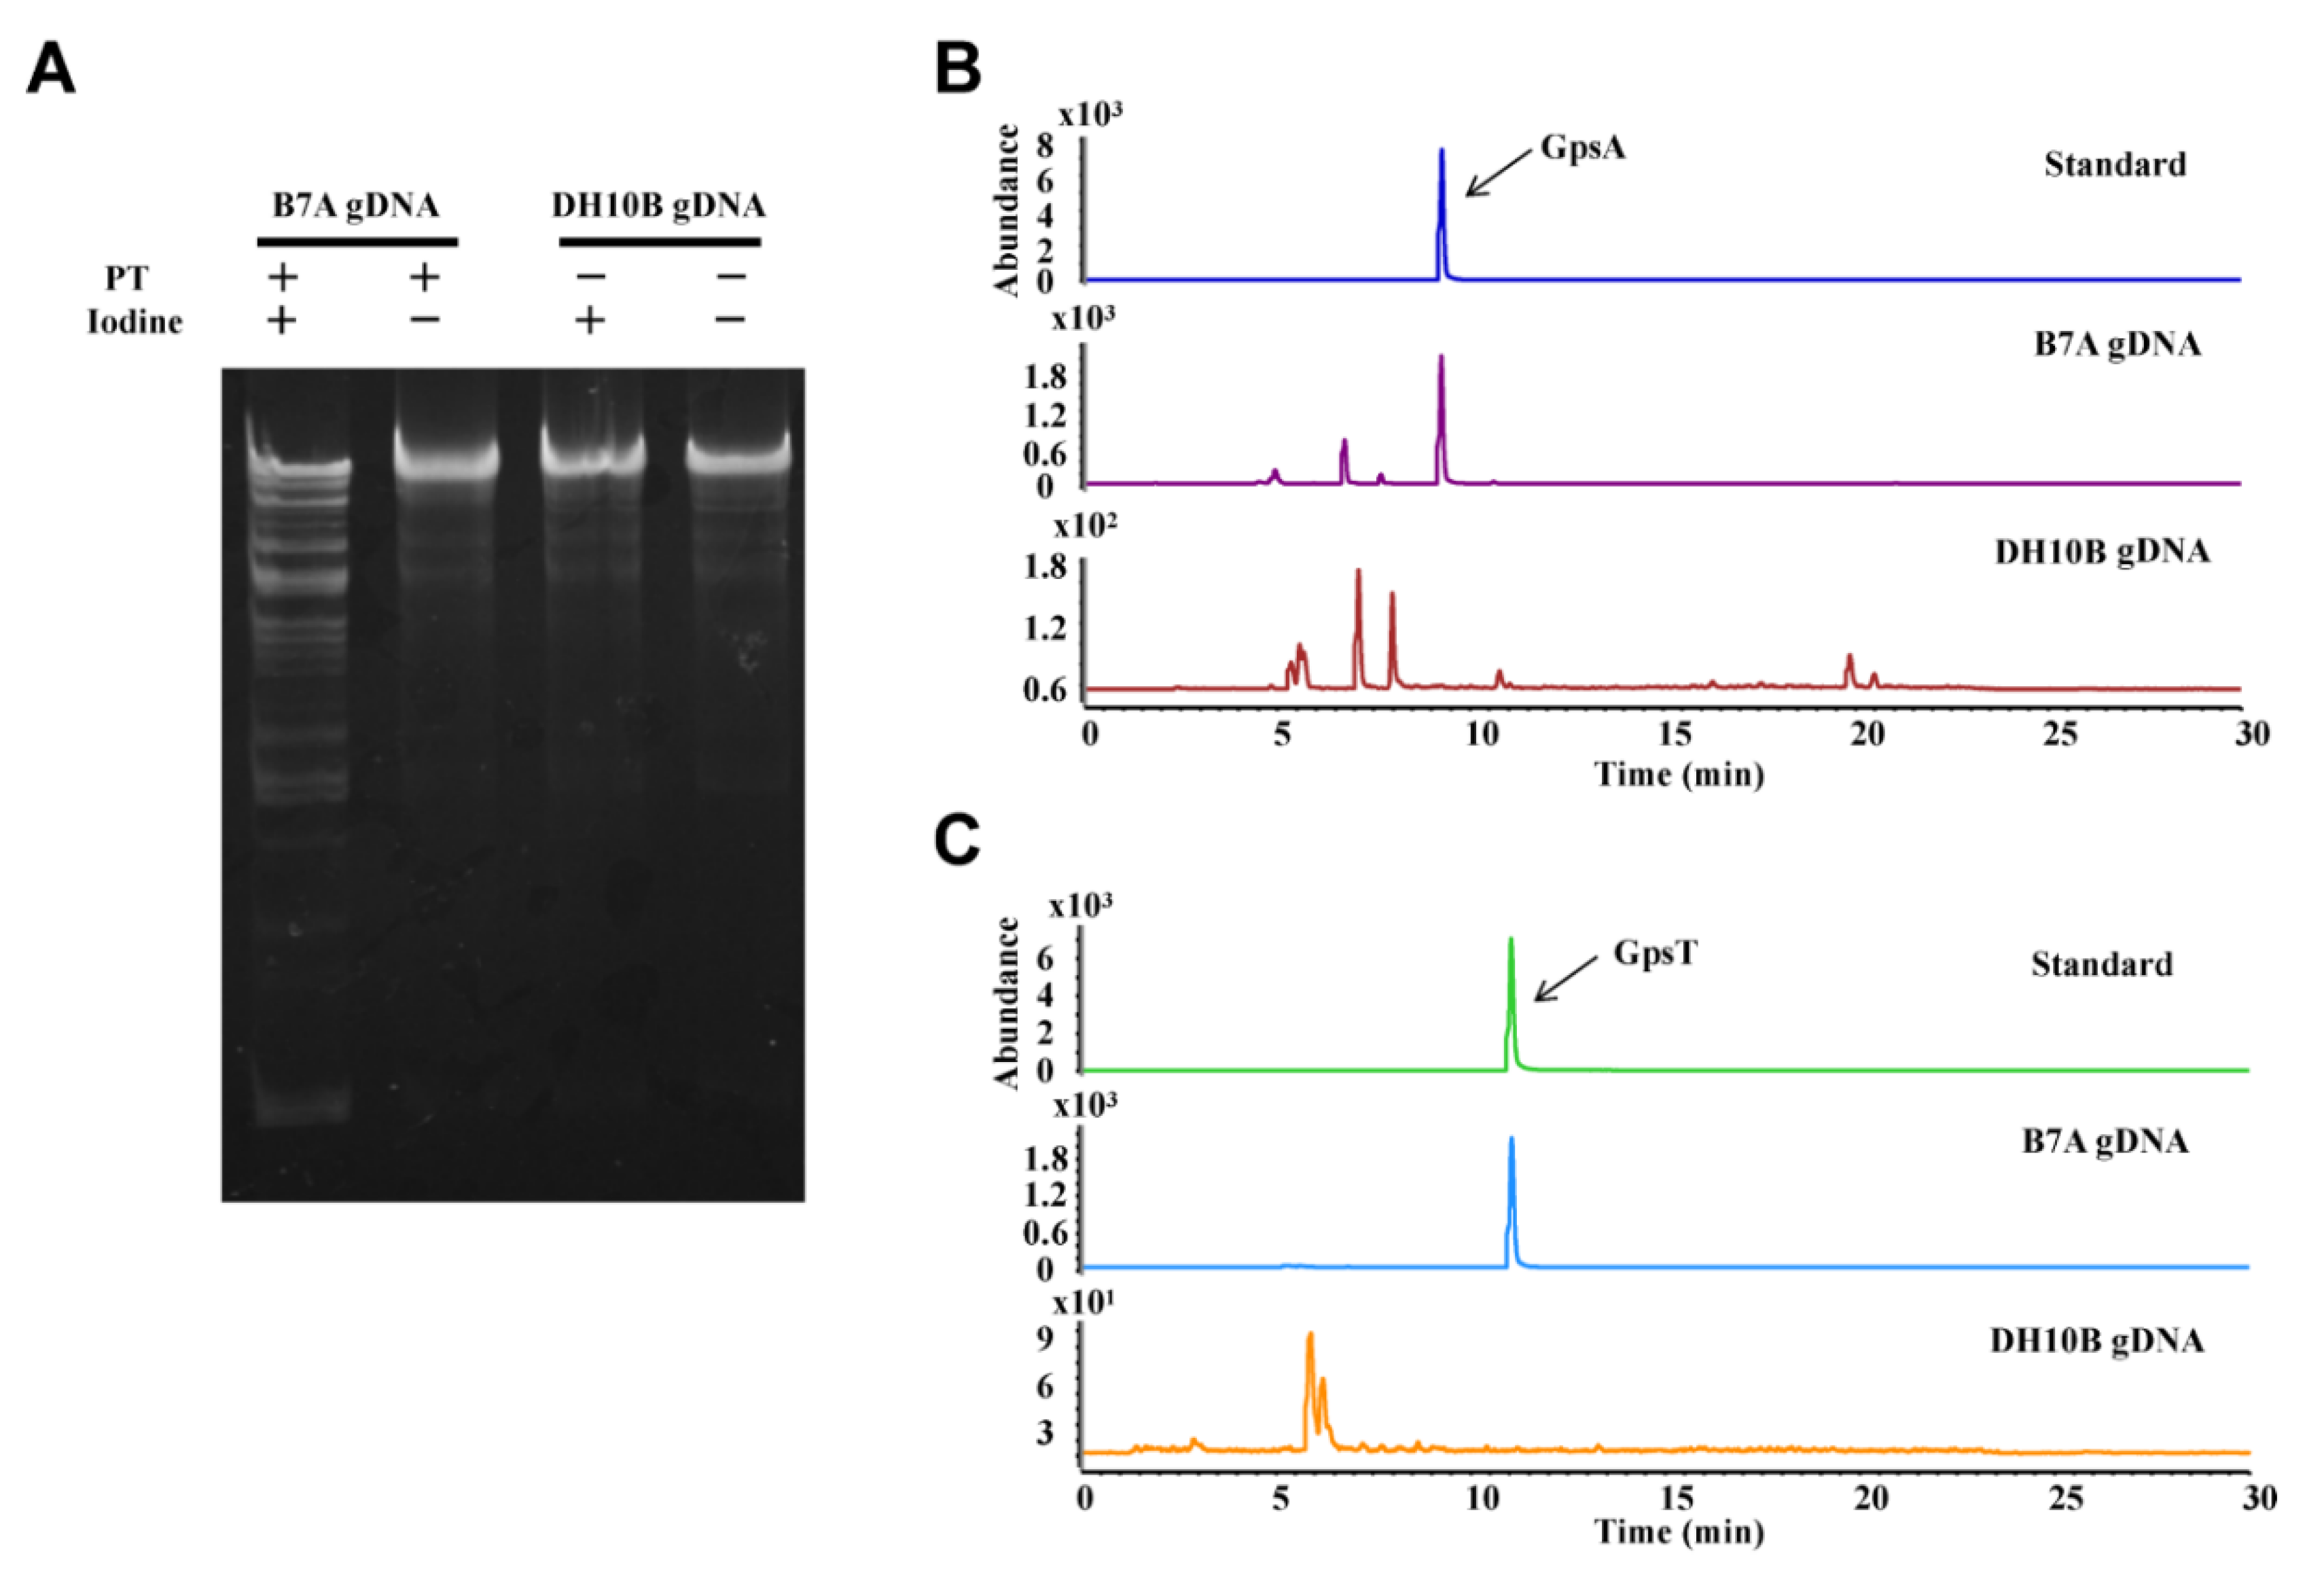
- Add ~1 μg gDNA with 1 × ICA Reaction Buffer to clean microcentrifuge tube. Mix well, and incubate at 65 °C for 10 min and then slow cooled (0.1 °C/s) to 4 °C using a thermal cycler.
- Analyze reaction sample using ethidium bromide-stained 1.0% agarose gel electrophoresis in 1 × TAE buffer containing 50 μM thiourea.
- At the same time, analyze the above samples using the LC-MS/MS method (see Quantification of PT modifications in DNA by LC-MS/MS section).
- [Note: Always prepare a fresh iodine for every use, and confirm slow cooling process. Reduce voltage and increase gel running times possible during electrophoresis. These tips may yield better results.]
2.6.3. Establishment of Standard Curve
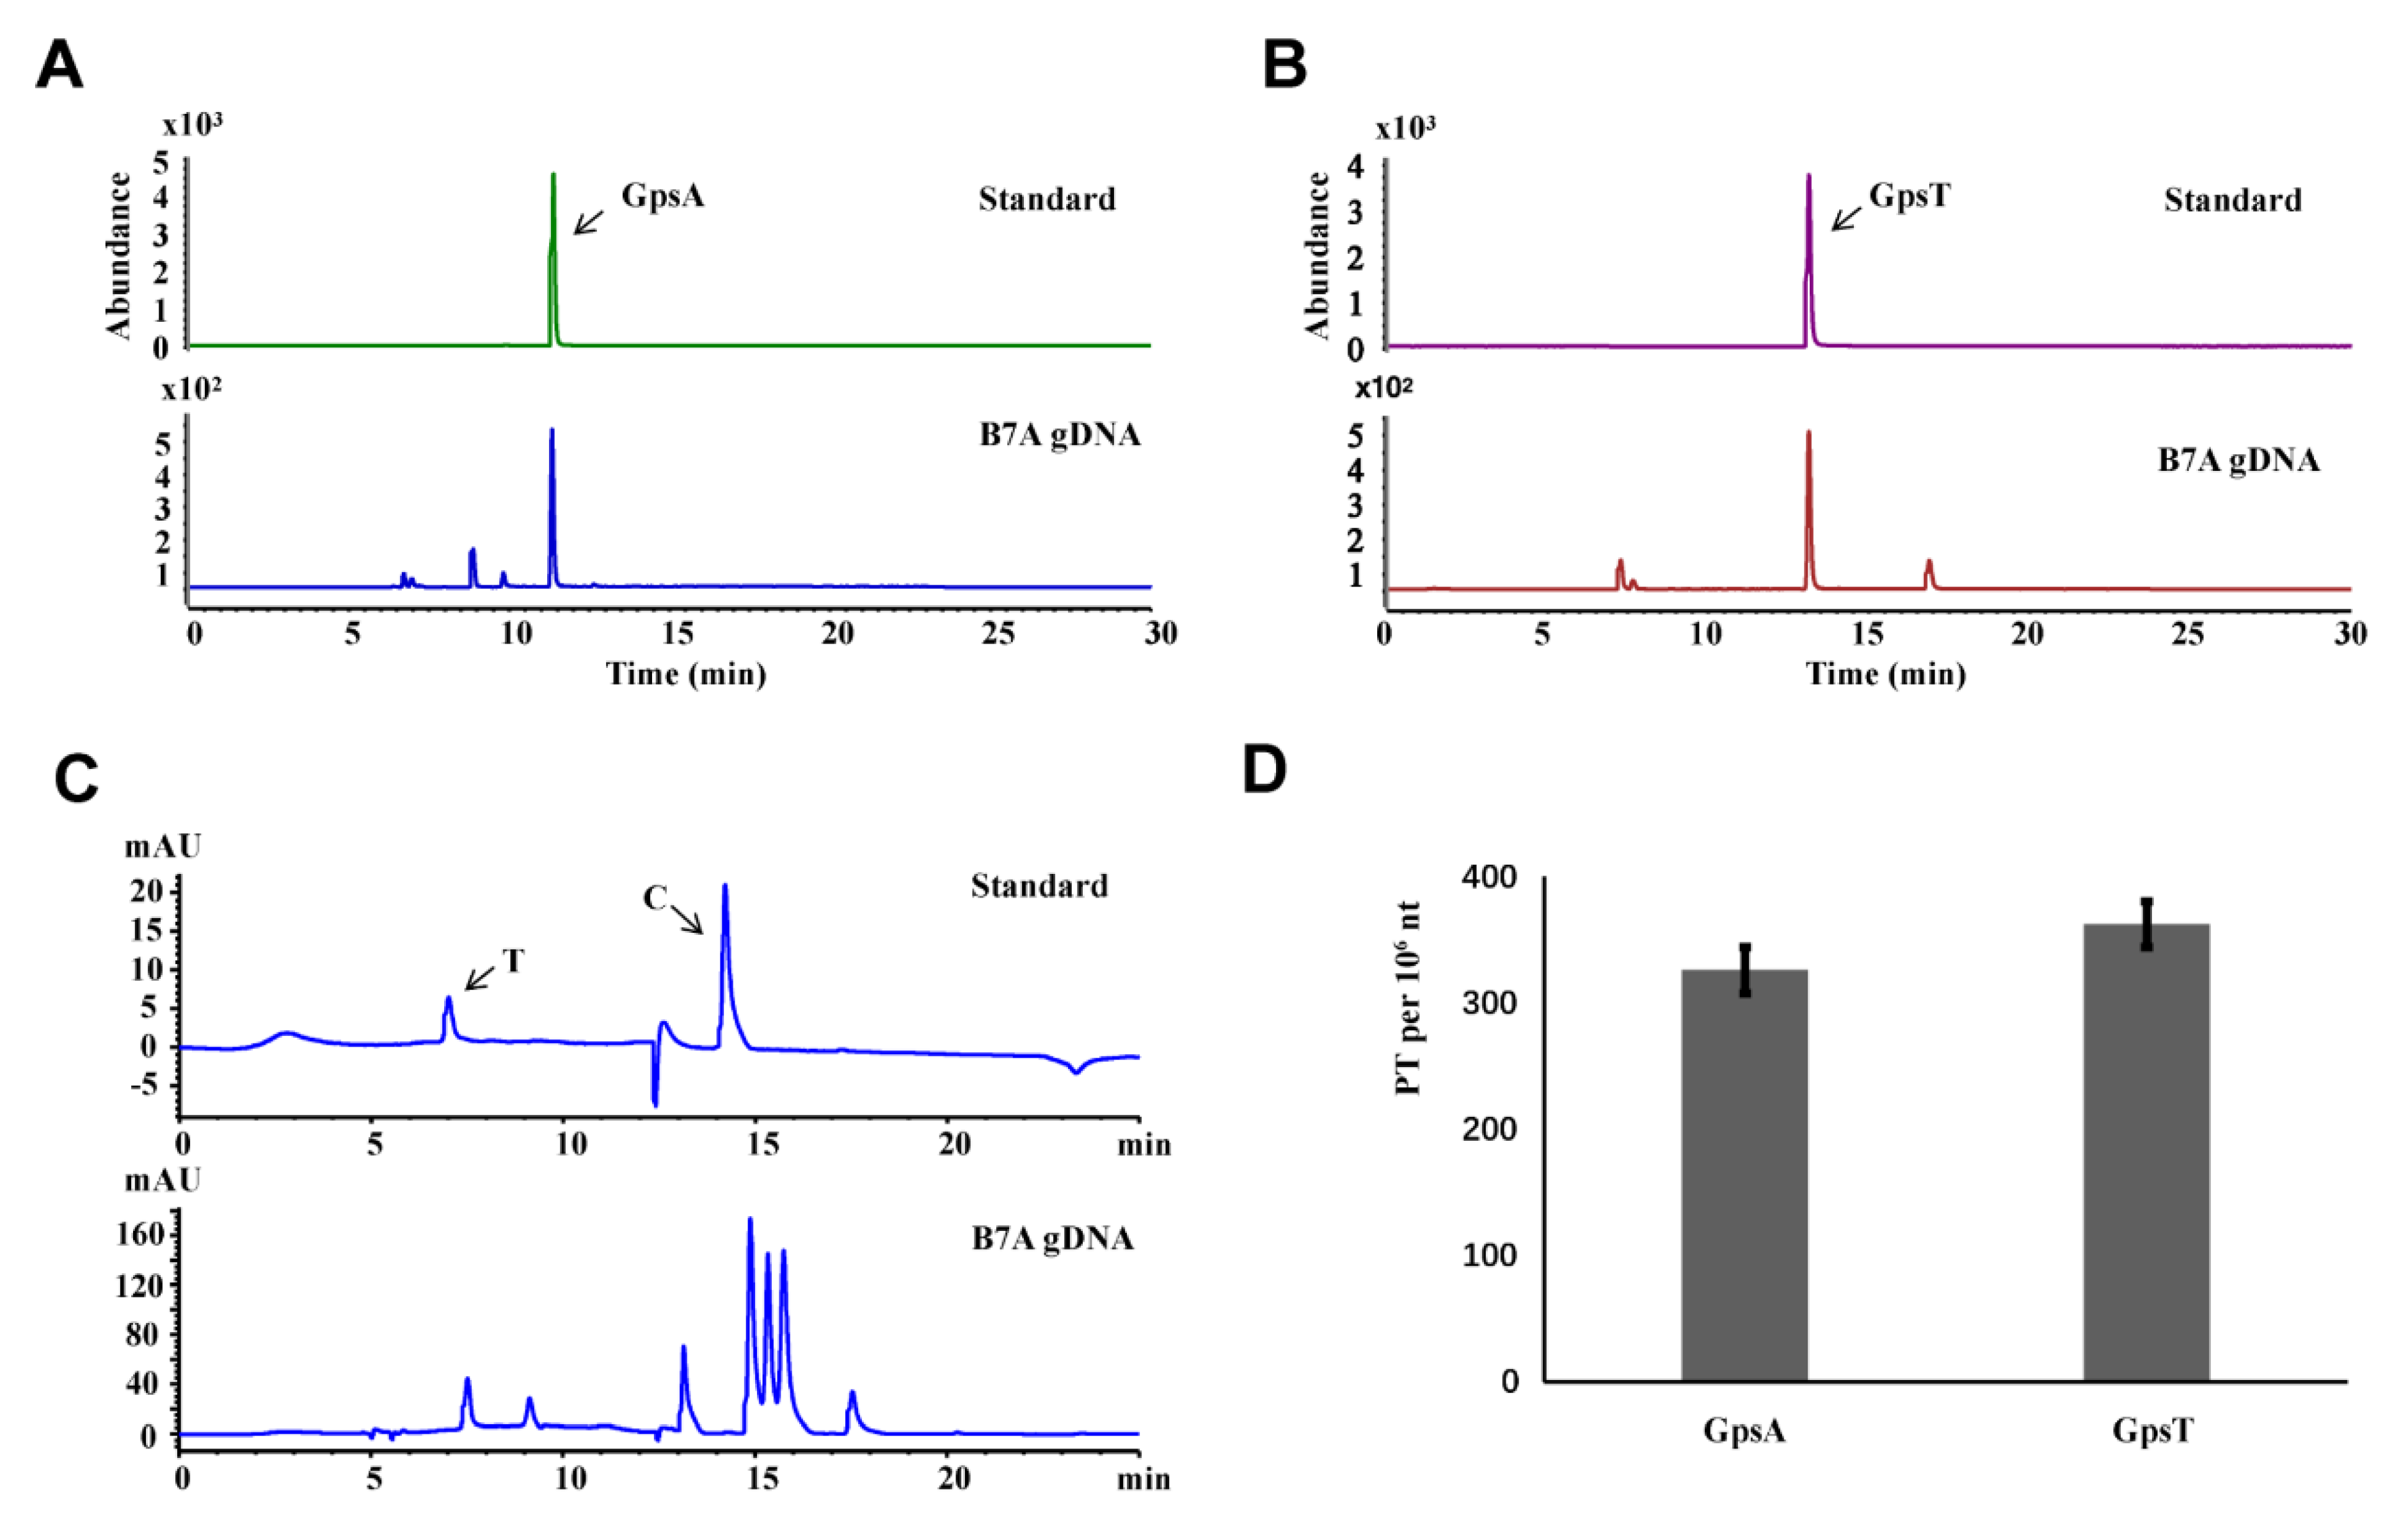
- Dilute the mono nucleosides standards (C and T) to six different concentrations (0 ng/μL, 2 ng/μL, 4 ng/μL, 10 ng/μL, 20 ng/μL, 40 ng/μL).
- [Note: The total number of A is equal to the number of T, and similarly the number of C is equal to the number of G. Thus, we could choose two mono nucleosides to draw the standard curve.]
- Analyze samples using the HPLC system with an Agilent ZORBAX SB-C18 column (3.5 μm, 2.1 × 150 mm), and the conditions as follow:
- Solvent A was 0.1% acetic acid in water and Solvent B was 0.1% acetic acid in acetonitrile; the gradient program was 0–3 min 0.5% B, 3–4 min 0.5–5% B, 4–15 min 5–12% B, 15–16 min 12–30% B, 16–20 min 30% B, 20–21 min 30–0.5% B, and 21–25 min 0.5% B; the flow rate was 0.3 mL/min with elution conducted at 35 °C.
- Analyze the results: with the concentration of mono nucleosides standards (ng/μL) as the abscissa (X) and the peak area values of HPLC as the ordinate (Y), the standard curve was drawn.
- [Note: Always prepare a fresh set of standards and record the samples volume for every use.]
- Dilute the Rp configuration of the PT-modified dinucleotide standards to seven different concentrations (0 fmol/μL, 2 fmol/μL, 10 fmol/μL, 20 fmol/μL, 40 fmol/μL, 100 fmol/μL, 200 fmol/μL).
- Add ~100 fmol/μL the Sp configuration of PT-modified dinucleotides to each standard used as internal reference.
- Analyze samples using the LC-MS/MS (see section Quantification of PT modifications in DNA by LC-MS/MS), and the analysis of results as follow:
- With the concentration of Rp configuration of the PT-modified dinucleotide (fmol/μL) as the abscissa (X) and the ratio of the standard peak area to internal reference peak area values measured by LC-MS/MS as the ordinate (Y), the standard curve was drawn.
- [Note: Always prepare a fresh set of standards and record the samples volume for every use.]
2.6.4. Quantification of PT Modifications in DNA by LC-MS/MS
- Prepare the nuclease P1 Hydrolysis Buffer (0.5 mM ZnCl2, 30 mM sodium acetate, pH 5.3).
- Add ~20 μg purified DNA, 2 U of nuclease P1 and Hydrolysis Buffer to a clean microcentrifuge tube. Mix well, and incubate at 50 °C for 2 h using a thermal cycler.
- Then mix in 100 mM Tris-HCl, pH 8.0 and 15 U of FastAP Alkaline Phosphatase, and incubate at 37 °C for 2 h for the totally dephosphorylation.
- Remove the enzymes by ultrafiltration at 10,000 rpm for 10 min.
- [Note: This step is critical for removal of enzymes that may interfere with follow-up experiments.]
- Add ~200 μL deionized water to ultrafiltration tube and repeat step 4 until all the sample has been transferred to the collection tube.
- Collect the filtrate in a clean microcentrifuge tube and dry the sample.
- [Note: For subsequent LC-MS/MS analysis, the volume of sample is as small as possible. Concentrated sample using the Freeze Dryer may yield better results.]
- Resuspend and elute the sample from step 6 in 40 μL deionized water.
- Analyze sample quantitatively by LC-MS/MS system with an electrospray ionization source in positive mode as described previously [2], and the parameters as follow:
- Gas flow, 10 L/min; nebulizer pressure, 30 psi; drying gas temperature, 325 °C; and capillary voltage, 3100 V. Multiple reaction monitoring mode was used for detection of product ions derived from the precursor ions, with all instrument parameters optimized for maximal sensitivity (retention time in min, precursor ion m/z, product ion m/z, fragmentor voltage, collision energy): GpsA, 9.4, 597, 136, 120 V, 40 V; GpsT, 11.2, 588, 152, 110 V, 17 V.
- Analyze the results according to standard curves: the hydrolyzed mono nucleotides were quantified by HPLC according to the standard curve of mono nucleosides. Meanwhile, the PT-modified dinucleotides were quantified by LC-MS/MS according to the standard curve of dinucleotides. Thus, the number of PT-modified dinucleotides in a unit length of DNA can be calculated.
2.6.5. ICDS Assay
- Cleave ~20 μg purified gDNA by iodine as described above in ICA methods.
- Remove residual iodine and salts using MicroSpin G-25 columns.
- [Note: This step is critical for removal of residual iodine and salts that may interfere with follow-up experiments.]
- Add 10 U of FastAP Alkaline Phosphatase to the sample at 37 °C for 1h for remove terminal phosphate groups.
- Inactivate the enzyme by heating at 75 °C for 5 min and slow cooled (0.1 °C/s) to 4 °C to assure proper complementary re-annealing.
- Clean up the sample using the Cycle Pure Kit and elute it in 30 μL MilliQ water.
- Blunt end of the break sites using the Quick BluntingTM Kit at room temperature for 30 min.
- Inactivate the enzyme by heating at 75 °C for 10 min and slow cooled as before.
- Clean up and elute the sample as before.
- Then mix in 1x NEB Buffer 2, 0.1 mM dATP and 15 U of Klenow Fragment (3′→5′ exo-) and incubate at 37 °C for 30 min for the 3′-deoxyadenylation (namely A-tailing).
- Inactivate the enzyme by heating at 75 °C for 20 min and slow cooled as before.
- Clean up and elute the sample as before.
- Combine 3 μM of custom duplex tag-sequence (see Primers section) with 3′-deoxyadenylated ends by T4 DNA ligase at 16 °C for 16 h.
- Inactivate the enzyme by heating at 75 °C for 10 min and slow cooled as before.
- Clean up and elute the sample as before.
- [Note: The quality of the DNA samples was measured using NanoDrop 2000 and their concentration was measured using the Quant-iT™ PicoGreen™ dsDNA Assay Kit.]
- Shear the DNA samples to fragment lengths between 150 and 350 bp by sonication, and then ligate standard Illumina sequencing adaptor using the SPRIworks Fragment Library System.
- [Note: To fragment the DNA samples to a size range of 150–350 bp, using a probe sonicator at an amplitude of 20% with 20 s “ON” and 10 s “OFF” (10 min total), while on ice to avoid excessive heat.]
- Concentrate samples using the Freeze Dryer and elute it in 30 μL MilliQ water.
- Enrich the iodine-cleaved DNA linked unique tag by PCR amplification for 15 cycles using F2 and R2 as the primers.
- [Note: During the PCR amplification, one of the primers used matches the marked segments attached to the ends of cleavage by iodine (F2), while the other matches the standard Illumina sequencing adaptor (R2). This allows only fragments containing the iodine-cleaved ends to be amplified, which achieves the enrichment of the PT-modified molecules.]
- Sequence the libraries constructed from step 17 on the Illumina HiSeq X Ten platform.
- [Note: Agilent Technologies 2100 Bioanalyzer is used to confirm successful library generation and Life Technologies Qubit 3.0 Fluorometer for quantification.]
- Analyze the ICDS sequencing data, and the details as follow:
- After completing Illumina sequencing, the reads containing tag were trimmed for adaptor and tag and done quality control as follows:
- Clipping the adapter sequences.
- Removing non-A, G, C, T bases of the 5′ end.
- Trimming low-quality base (less than Q20).
- Removing reads with more than 10% of “N” calls.
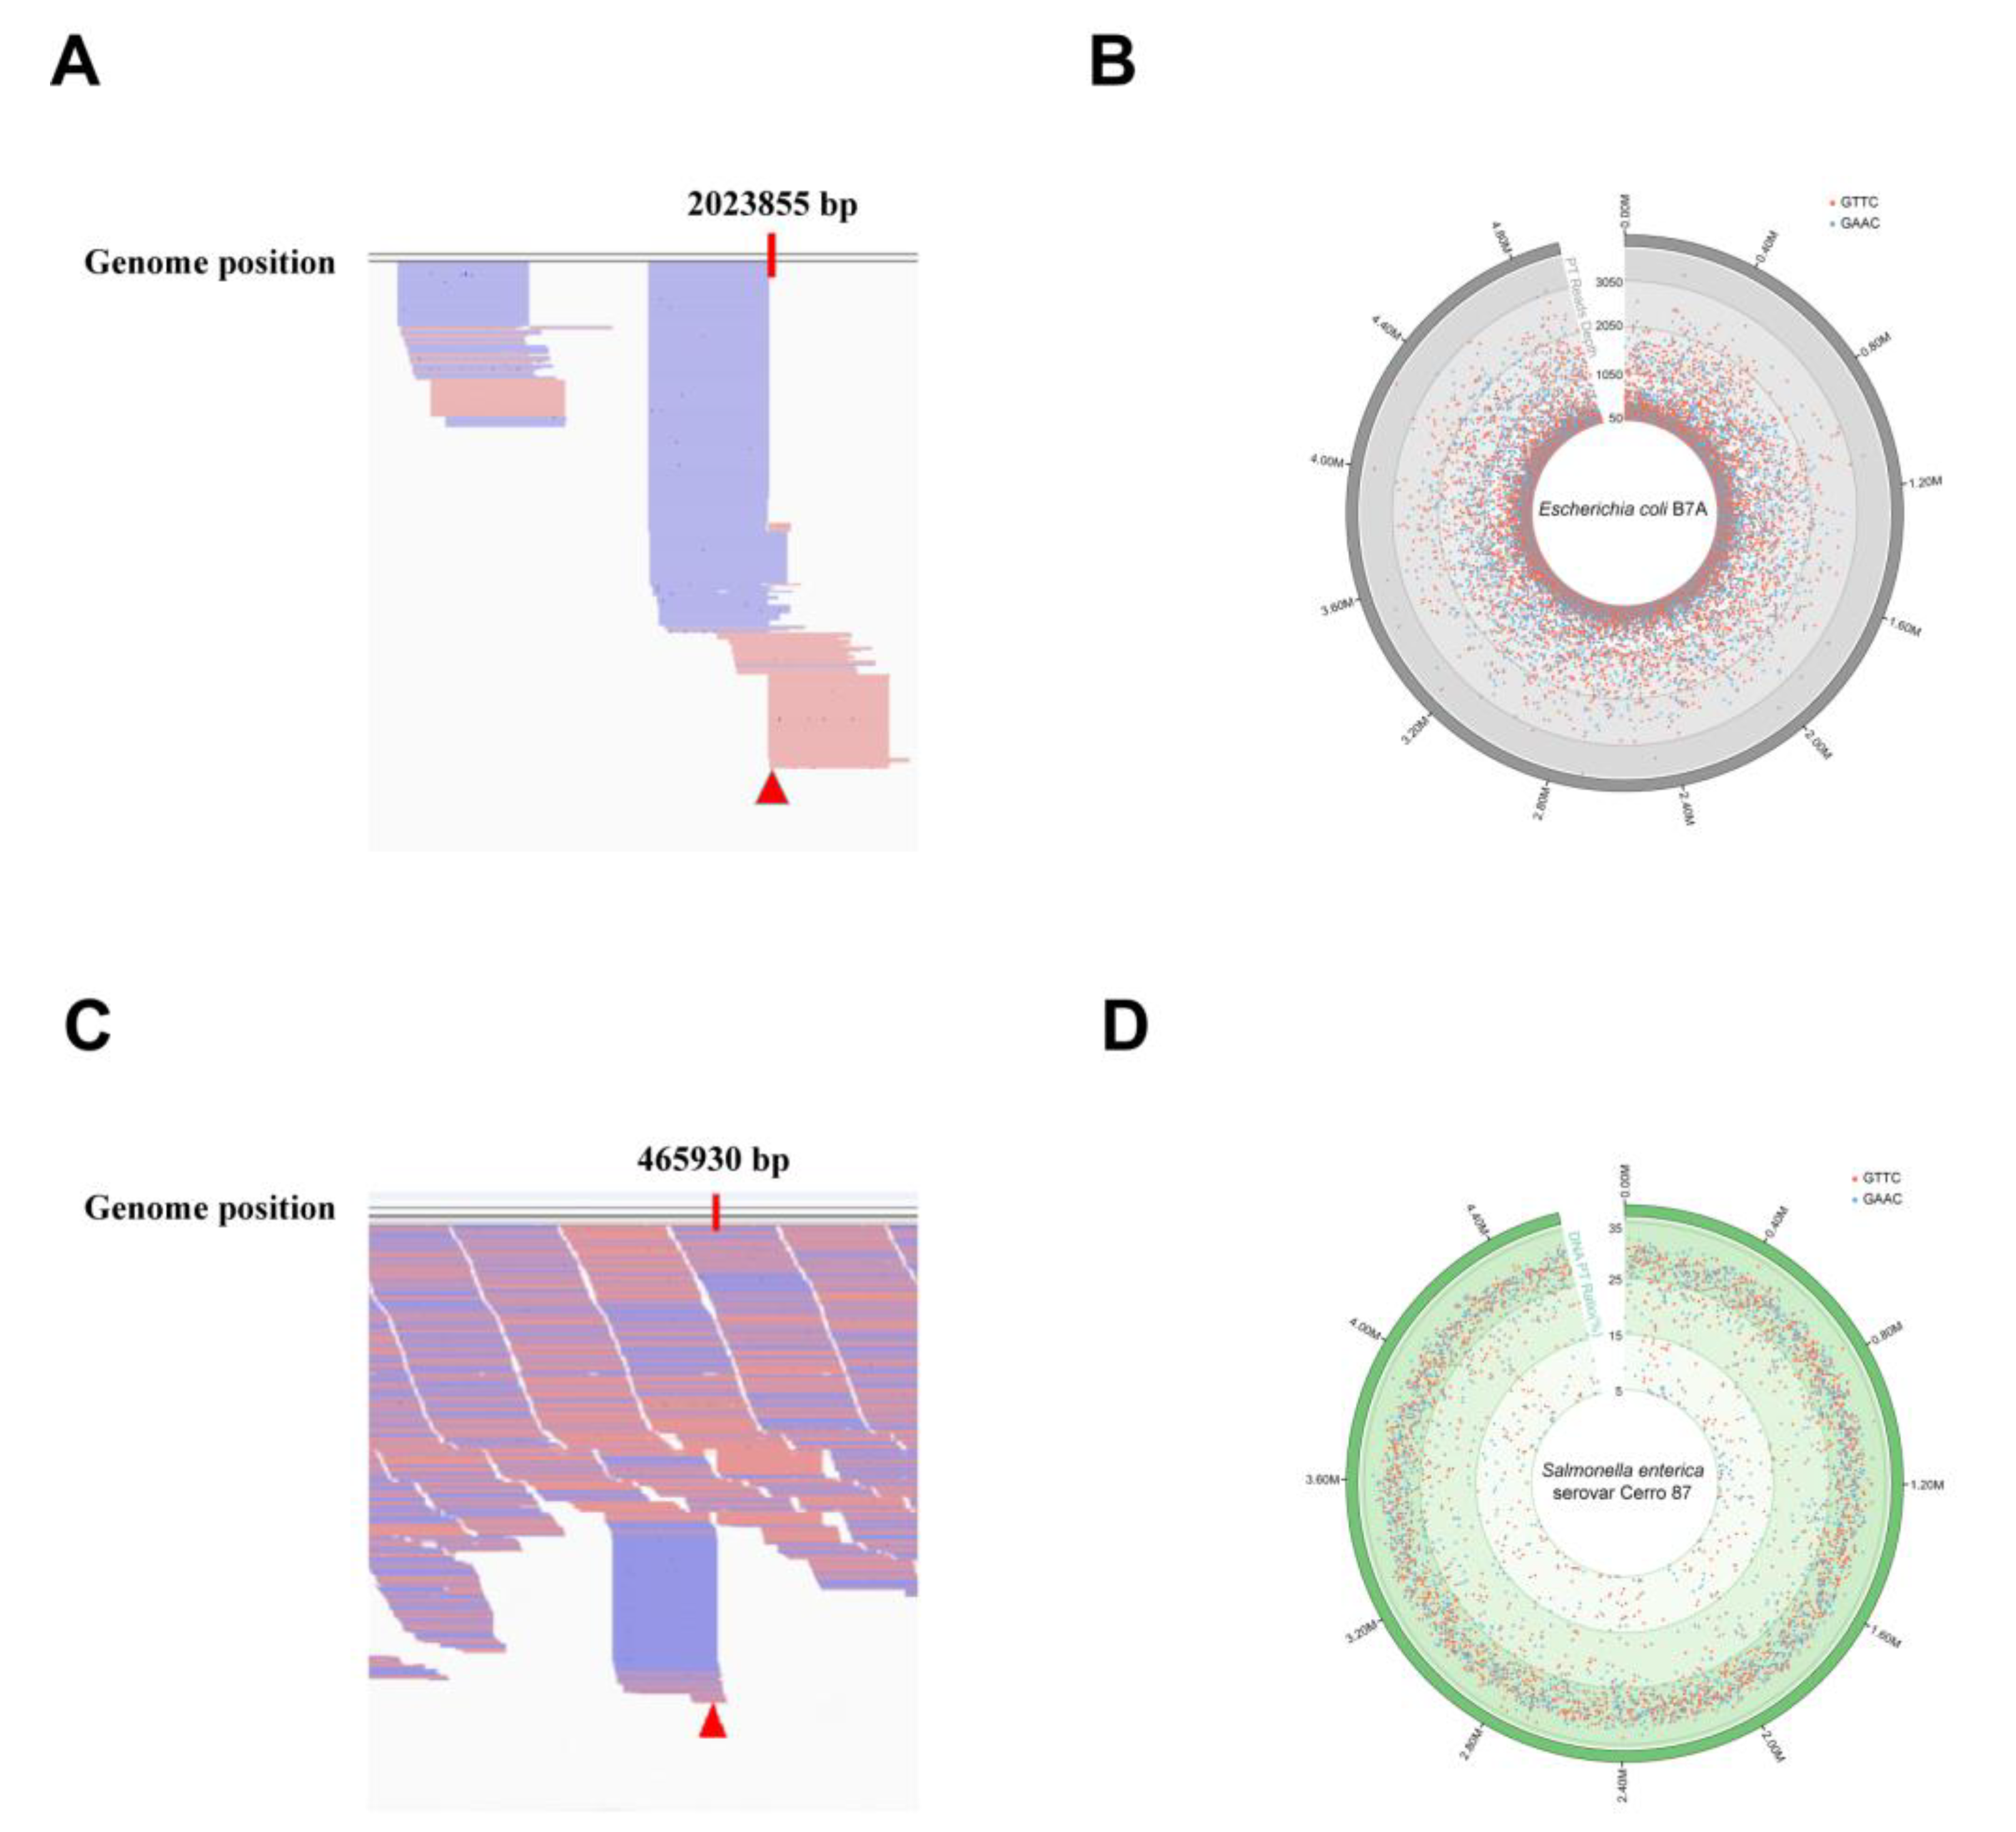
- Filtering small fragments with less than 25 bp after clipping the adapter sequences and quality control, and then aligned to reference genomes by Burrows-Wheeler Aligner (BWA) and the position-wise coverage values were calculated by using the custom python script. The GAAC/GTTC sites will be defined as PT-modified sites if their reads above 50 and ended at this site. Meanwhile, 10 non-GAAC/GTTC sites were randomly selected as control.
2.6.6. PT-IC-Seq Assay
- Cleave ~20 μg purified gDNA by iodine as described above in ICA methods.
- Remove residual iodine and salts using MicroSpin G-25 columns.
- [Note: This step is critical for removal of residual iodine and salts that may interfere with follow-up experiments.]
- Shear the DNA samples to fragment lengths of 150–350 bp by sonication.
- [Note: To fragment the DNA samples to a size range of 150–350 bp, using a probe sonicator as before.]
- According to instructions provided with the NEBNext DNA Library Prep Reagent Set for Illumina, the resulting fragments were end-repaired, adenylated at the 3′ ends and ligated to Illumina paired-end adaptors.
- Amplify DNA fragments by PCR for 15 cycles using standard Illumina adapter-specific primers.
- Sequence the libraries constructed from step 5 on the Illumina HiSeq X Ten platform.
- [Note: Agilent Technologies 2100 Bioanalyzer is used to confirm successful library generation and Life Technologies Qubit 3.0 Fluorometer for quantification.]
- Analyze the PT-IC-Seq data, and the details as follow:
- All sequencing reads were trimmed for adaptor and low-quality bases and aligned to reference genomes by BWA for creating Sequence Alignment/Map (SAM) files. Then, SAM files were converted to Binary Alignment/Map (BAM) files that were piled up using samtools and the results were visually performed using the Integrated Genomics Viewer 2.3 software (IGV; Broad Institute, Cambridge, MA, USA). Meanwhile, the position-wise reads number obtained from fragment terminals and across the same site were calculated respectively by using the custom python script. The PT modification frequency of each GAAC/GTTC sites were calculated by the number of reads ended at this site divided by all of the number of reads ended and crossed the same sites. To eliminate the false-ended reads arising from random shearing the DNA, 10 non-GAAC/GTTC sites used as the control and their average PT modification frequency were calculated and used them as thresholds. The modification ratios at each PT sites in the whole genome will be calculated and analyzed if the modification frequency of those sites were above the set thresholds.
3. Results
3.1. ICA Assay
3.2. Establishment of Standard Curve
3.3. Quantification of PT Modifications in DNA by LC-MS/MS
3.4. ICDS Assay
3.5. PT-IC-Seq Assay
4. Discussion
5. Conclusions
Supplementary Materials
Author Contributions
Funding
Acknowledgments
Conflicts of Interest
References
- Weigele, P.; Raleigh, E.A. Biosynthesis and Function of Modified Bases in Bacteria and Their Viruses. Chem. Rev. 2016, 116, 12655–12687. [Google Scholar] [CrossRef]
- Wang, L.; Chen, S.; Xu, T.; Taghizadeh, K.; Wishnok, J.S.; Zhou, X.; You, D.; Deng, Z.; Dedon, P.C. Phosphorothioation of DNA in bacteria by dnd genes. Nat. Chem. Biol. 2007, 3, 709–710. [Google Scholar] [CrossRef]
- Wang, L.; Chen, S.; Vergin, K.L.; Giovannoni, S.J.; Chan, S.W.; DeMott, M.S.; Taghizadeh, K.; Cordero, O.X.; Cutler, M.; Timberlake, S.; et al. DNA phosphorothioation is widespread and quantized in bacterial genomes. Proc. Natl. Acad. Sci. USA 2011, 108, 2963–2968. [Google Scholar] [CrossRef]
- Sun, Y.; Kong, L.; Wu, G.; Cao, B.; Pang, X.; Deng, Z.; Dedon, P.C.; Zhang, C.; You, D. DNA Phosphorothioate Modifications Are Widely Distributed in the Human Microbiome. Biomolecules 2020, 10, 1175. [Google Scholar] [CrossRef] [PubMed]
- Ou, H.-Y.; He, X.; Shao, Y.; Tai, C.; Rajakumar, K.; Deng, Z. dndDB: A Database Focused on Phosphorothioation of the DNA Backbone. PLoS ONE 2009, 4, e5132. [Google Scholar] [CrossRef]
- Zhou, X.; Deng, Z.; Firmin, J.L.; Hopwood, D.A.; Kieser, T. Site-specific degradation ofStreptomyces lividansDNA during electrophoresis in buffers contaminated with ferrous iron. Nucleic Acids Res. 1988, 16, 4341–4352. [Google Scholar] [CrossRef]
- Zhou, X.; He, X.; Liang, J.; Li, A.; Xu, T.; Kieser, T.; Helmann, J.D.; Deng, Z. A novel DNA modification by sulphur. Mol. Microbiol. 2005, 57, 1428–1438. [Google Scholar] [CrossRef]
- Ray, T.; Weaden, J.; Dyson, P. Tris-dependent site-specific cleavage of Streptomyces lividans DNA. FEMS Microbiol. Lett. 1992, 96, 247–252. [Google Scholar] [CrossRef]
- Xu, T.; Liang, J.; Chen, S.; Wang, L.; He, X.; You, D.; Wang, Z.; Zhongli, X.; Xu, Z.; Zhou, X.; et al. DNA phosphorothioation in Streptomyces lividans: Mutational analysis of the dnd locus. BMC Microbiol. 2009, 9, 1–8. [Google Scholar] [CrossRef] [PubMed]
- Tong, T.; Chen, S.; Wang, L.; Tang, Y.; Ryu, J.Y.; Jiang, S.; Wu, X.; Chen, C.; Luo, J.; Deng, Z.; et al. Occurrence, evolution, and functions of DNA phosphorothioate epigenetics in bacteria. Proc. Natl. Acad. Sci. USA 2018, 115, E2988–E2996. [Google Scholar] [CrossRef] [PubMed]
- You, D.; Wang, L.; Yao, F.; Zhou, A.X.; Deng, Z. A Novel DNA Modification by Sulfur: DndA Is a NifS-like Cysteine Desulfurase Capable of Assembling DndC as an Iron-Sulfur Cluster Protein inStreptomyces lividans. Biochemistry 2007, 46, 6126–6133. [Google Scholar] [CrossRef]
- Yao, F.; Xu, T.; Zhou, X.; Deng, Z.; You, D. Functional analysis of spfD gene involved in DNA phosphorothioation in Pseudomonas fluorescens Pf0-1. FEBS Lett. 2009, 583, 729–733. [Google Scholar] [CrossRef] [PubMed]
- Chen, F.; Lin, K.; Zhang, Z.; Chen, L.; Shi, X.; Cao, C.; Wang, Z.; Liang, J.; Deng, Z.; Wu, G. Purification, crystallization and preliminary X-ray analysis of the DndE protein from Salmonella enterica serovar Cerro 87, which is involved in DNA phosphorothioation. Acta Crystallogr. Sect. F Struct. Biol. Cryst. Commun. 2011, 67, 1440–1442. [Google Scholar] [CrossRef] [PubMed]
- Hu, W.; Wang, C.; Liang, J.; Zhang, T.; Hu, Z.; Wang, Z.; Lan, W.; Li, F.; Wu, H.; Ding, J.; et al. Structural insights into DndE from Escherichia coli B7A involved in DNA phosphorothioation modification. Cell Res. 2012, 22, 1203–1206. [Google Scholar] [CrossRef] [PubMed]
- Cheng, Q.; Cao, B.; Yao, F.; Li, J.; Deng, Z.; You, D. Regulation of DNA phosphorothioate modifications by the transcriptional regulator DptB in Salmonella. Mol. Microbiol. 2015, 97, 1186–1194. [Google Scholar] [CrossRef] [PubMed]
- Wang, Y.; Kong, L.; Zheng, T.; Li, J.; Sun, Y.; You, D. The transcriptional regulator SpfB negatively regulates DNA phosphorothioate modification in Pseudomonas fluorescens Pf0-1. Acta Microbiol. Sin. 2019, 59, 851–862. [Google Scholar] [CrossRef]
- Cao, B.; Zheng, X.; Cheng, Q.; Yao, F.; Zheng, T.; Babu, I.R.; Zhou, H.; Dedon, P.; You, D. In vitro analysis of phosphorothioate modification of DNA reveals substrate recognition by a multiprotein complex. Sci. Rep. 2015, 5, 12513. [Google Scholar] [CrossRef]
- Cao, B.; Cheng, Q.; Gu, C.; Yao, F.; DeMott, M.S.; Zheng, X.; Deng, Z.; Dedon, P.C.; You, D. Pathological phenotypes andin vivo DNA cleavage by unrestrained activity of a phosphorothioate-based restriction system in Salmonella. Mol. Microbiol. 2014, 93, 776–785. [Google Scholar] [CrossRef]
- Eckstein, F.; Gish, G. Phosphorothioates in molecular biology. Trends Biochem. Sci. 1989, 14, 97–100. [Google Scholar] [CrossRef]
- Braasch, D.; Corey, D.R. Locked nucleic acid (LNA): Fine-tuning the recognition of DNA and RNA. Chem. Biol. 2001, 8, 1–7. [Google Scholar] [CrossRef]
- Gish, G.; Eckstein, F. DNA and RNA sequence determination based on phosphorothioate chemistry. Science 1988, 240, 1520–1522. [Google Scholar] [CrossRef] [PubMed]
- Nakamaye, K.L.; Gish, G.; Eckstein, F.; Vosberg, H.-P. Direct sequencing of polymerase chain reaction amplified DNA fragments through the incorporation of deoxynucleoside α-thiotriphosphates. Nucleic Acids Res. 1988, 16, 9947–9959. [Google Scholar] [CrossRef]
- Mag, M.; Lüking, S.; Engels, J.W.; Silke, L. Synthesis and selective cleavage of an oligodeoxynucleotide containing a bridged intemucleotide 5′-phosphorothioate linkage. Nucleic Acids Res. 1991, 19, 1437–1441. [Google Scholar] [CrossRef] [PubMed]
- Alexeeva, E.V.; Shpanchenko, O.V.; Dontsova, O.A.; Bogdanov, A.A.; Meritaus, K.H. Interaction of mRNA With the Escherichia Coli Ribosome: Accessibility of Phosphorothioate-Containing mRNA Bound to Ribosomes for Iodine Cleavage. Nucleic Acids Res. 1996, 24, 2228–2235. [Google Scholar] [CrossRef] [PubMed][Green Version]
- Shpanchenko, O.V.; Dontsova, O.A.; Bogdanov, A.A.; Nierhaus, K.H. Structure of 5S rRNA within the Escherichia coli ribosome: Iodine-induced cleavage patterns of phosphorothioate derivatives. RNA 1998, 4, 1154–1164. [Google Scholar] [CrossRef]
- Blanusa, M.; Schenk, A.; Sadeghi, H.; Marienhagen, J.; Schwaneberg, U. Phosphorothioate-based ligase-independent gene cloning (PLICing): An enzyme-free and sequence-independent cloning method. Anal. Biochem. 2010, 406, 141–146. [Google Scholar] [CrossRef]
- Cao, B.; Chen, C.; DeMott, M.S.; Cheng, Q.; Clark, T.A.; Xiong, X.; Zheng, X.; Butty, V.; Levine, S.S.; Yuan, G.; et al. Genomic mapping of phosphorothioates reveals partial modification of short consensus sequences. Nat. Commun. 2014, 5, 1–13. [Google Scholar] [CrossRef]
- Zheng, T.; Jiang, P.; Cao, B.; Cheng, Q.; Kong, L.; Zheng, X.; Hu, Q.; You, D. DndEi Exhibits Helicase Activity Essential for DNA Phosphorothioate Modification and ATPase Activity Strongly Stimulated by DNA Substrate with a GAAC/GTTC Motif. J. Biol. Chem. 2015, 291, 1492–1500. [Google Scholar] [CrossRef]
- Xu, T.; Yao, F.; Zhou, X.; Deng, Z.; You, D. A novel host-specific restriction system associated with DNA backbone S-modification in Salmonella. Nucleic Acids Res. 2010, 38, 7133–7141. [Google Scholar] [CrossRef]
- Ahlgren, N.A.; Chen, Y.; Needham, D.M.; Parada, A.E.; Sachdeva, R.; Trinh, V.; Chen, T.; Fuhrman, J.A. Genome and epigenome of a novel marine Thaumarchaeota strain suggest viral infection, phosphorothioation DNA modification and multiple restriction systems. Environ. Microbiol. 2017, 19, 2434–2452. [Google Scholar] [CrossRef]
- Li, J.; Chen, Y.; Zheng, T.; Kong, L.; Zhu, S.; Sun, Y.; Deng, Z.; Yang, L.; You, D. Quantitative mapping of DNA phosphorothioatome reveals phosphorothioate heterogeneity of low modification frequency. PLoS Genet. 2019, 15, e1008026. [Google Scholar] [CrossRef]
- Carell, T.; Brandmayr, C.; Hienzsch, A.; Müller, M.; Pearson, D.; Reiter, V.; Thoma, I.; Thumbs, P.; Wagner, M. Structure and Function of Noncanonical Nucleobases. Angew. Chem. Int. Ed. 2012, 51, 7110–7131. [Google Scholar] [CrossRef]
- Jones, P.A. Functions of DNA methylation: Islands, start sites, gene bodies and beyond. Nat. Rev. Genet. 2012, 13, 484–492. [Google Scholar] [CrossRef] [PubMed]
- Chen, K.; Zhao, B.S.; He, C. Nucleic Acid Modifications in Regulation of Gene Expression. Cell Chem. Biol. 2016, 23, 74–85. [Google Scholar] [CrossRef]
- Jaenisch, R.; Bird, A. Epigenetic regulation of gene expression: How the genome integrates intrinsic and environmental signals. Nat. Genet. 2003, 33, 245–254. [Google Scholar] [PubMed]
- Li, E.; Beard, C.; Jaenisch, R. Role for DNA methylation in genomic imprinting. Nat. Cell Biol. 1993, 366, 362–365. [Google Scholar] [CrossRef]
- Robertson, K.D. DNA methylation and human disease. Nat. Rev. Genet. 2005, 6, 597–610. [Google Scholar] [CrossRef] [PubMed]
- Chen, Y.; Zheng, T.; Li, J.; Cui, J.; Deng, Z.; You, D.; Yang, L. Novel Iodine-induced Cleavage Real-time PCR Assay for Accurate Quantification of Phosphorothioate Modified Sites in Bacterial DNA. Sci. Rep. 2019, 9, 7485. [Google Scholar] [CrossRef]


Publisher’s Note: MDPI stays neutral with regard to jurisdictional claims in published maps and institutional affiliations. |
© 2020 by the authors. Licensee MDPI, Basel, Switzerland. This article is an open access article distributed under the terms and conditions of the Creative Commons Attribution (CC BY) license (http://creativecommons.org/licenses/by/4.0/).
Share and Cite
Zhu, S.; Zheng, T.; Kong, L.; Li, J.; Cao, B.; DeMott, M.S.; Sun, Y.; Chen, Y.; Deng, Z.; Dedon, P.C.; et al. Development of Methods Derived from Iodine-Induced Specific Cleavage for Identification and Quantitation of DNA Phosphorothioate Modifications. Biomolecules 2020, 10, 1491. https://doi.org/10.3390/biom10111491
Zhu S, Zheng T, Kong L, Li J, Cao B, DeMott MS, Sun Y, Chen Y, Deng Z, Dedon PC, et al. Development of Methods Derived from Iodine-Induced Specific Cleavage for Identification and Quantitation of DNA Phosphorothioate Modifications. Biomolecules. 2020; 10(11):1491. https://doi.org/10.3390/biom10111491
Chicago/Turabian StyleZhu, Sucheng, Tao Zheng, Lingxin Kong, Jinli Li, Bo Cao, Michael S. DeMott, Yihua Sun, Ying Chen, Zixin Deng, Peter C. Dedon, and et al. 2020. "Development of Methods Derived from Iodine-Induced Specific Cleavage for Identification and Quantitation of DNA Phosphorothioate Modifications" Biomolecules 10, no. 11: 1491. https://doi.org/10.3390/biom10111491
APA StyleZhu, S., Zheng, T., Kong, L., Li, J., Cao, B., DeMott, M. S., Sun, Y., Chen, Y., Deng, Z., Dedon, P. C., & You, D. (2020). Development of Methods Derived from Iodine-Induced Specific Cleavage for Identification and Quantitation of DNA Phosphorothioate Modifications. Biomolecules, 10(11), 1491. https://doi.org/10.3390/biom10111491


