Assessment of Fibrinogen Macromolecules Interaction with Red Blood Cells Membrane by Means of Laser Aggregometry, Flow Cytometry, and Optical Tweezers Combined with Microfluidics

 , ,
, ,  ,
,  and
and 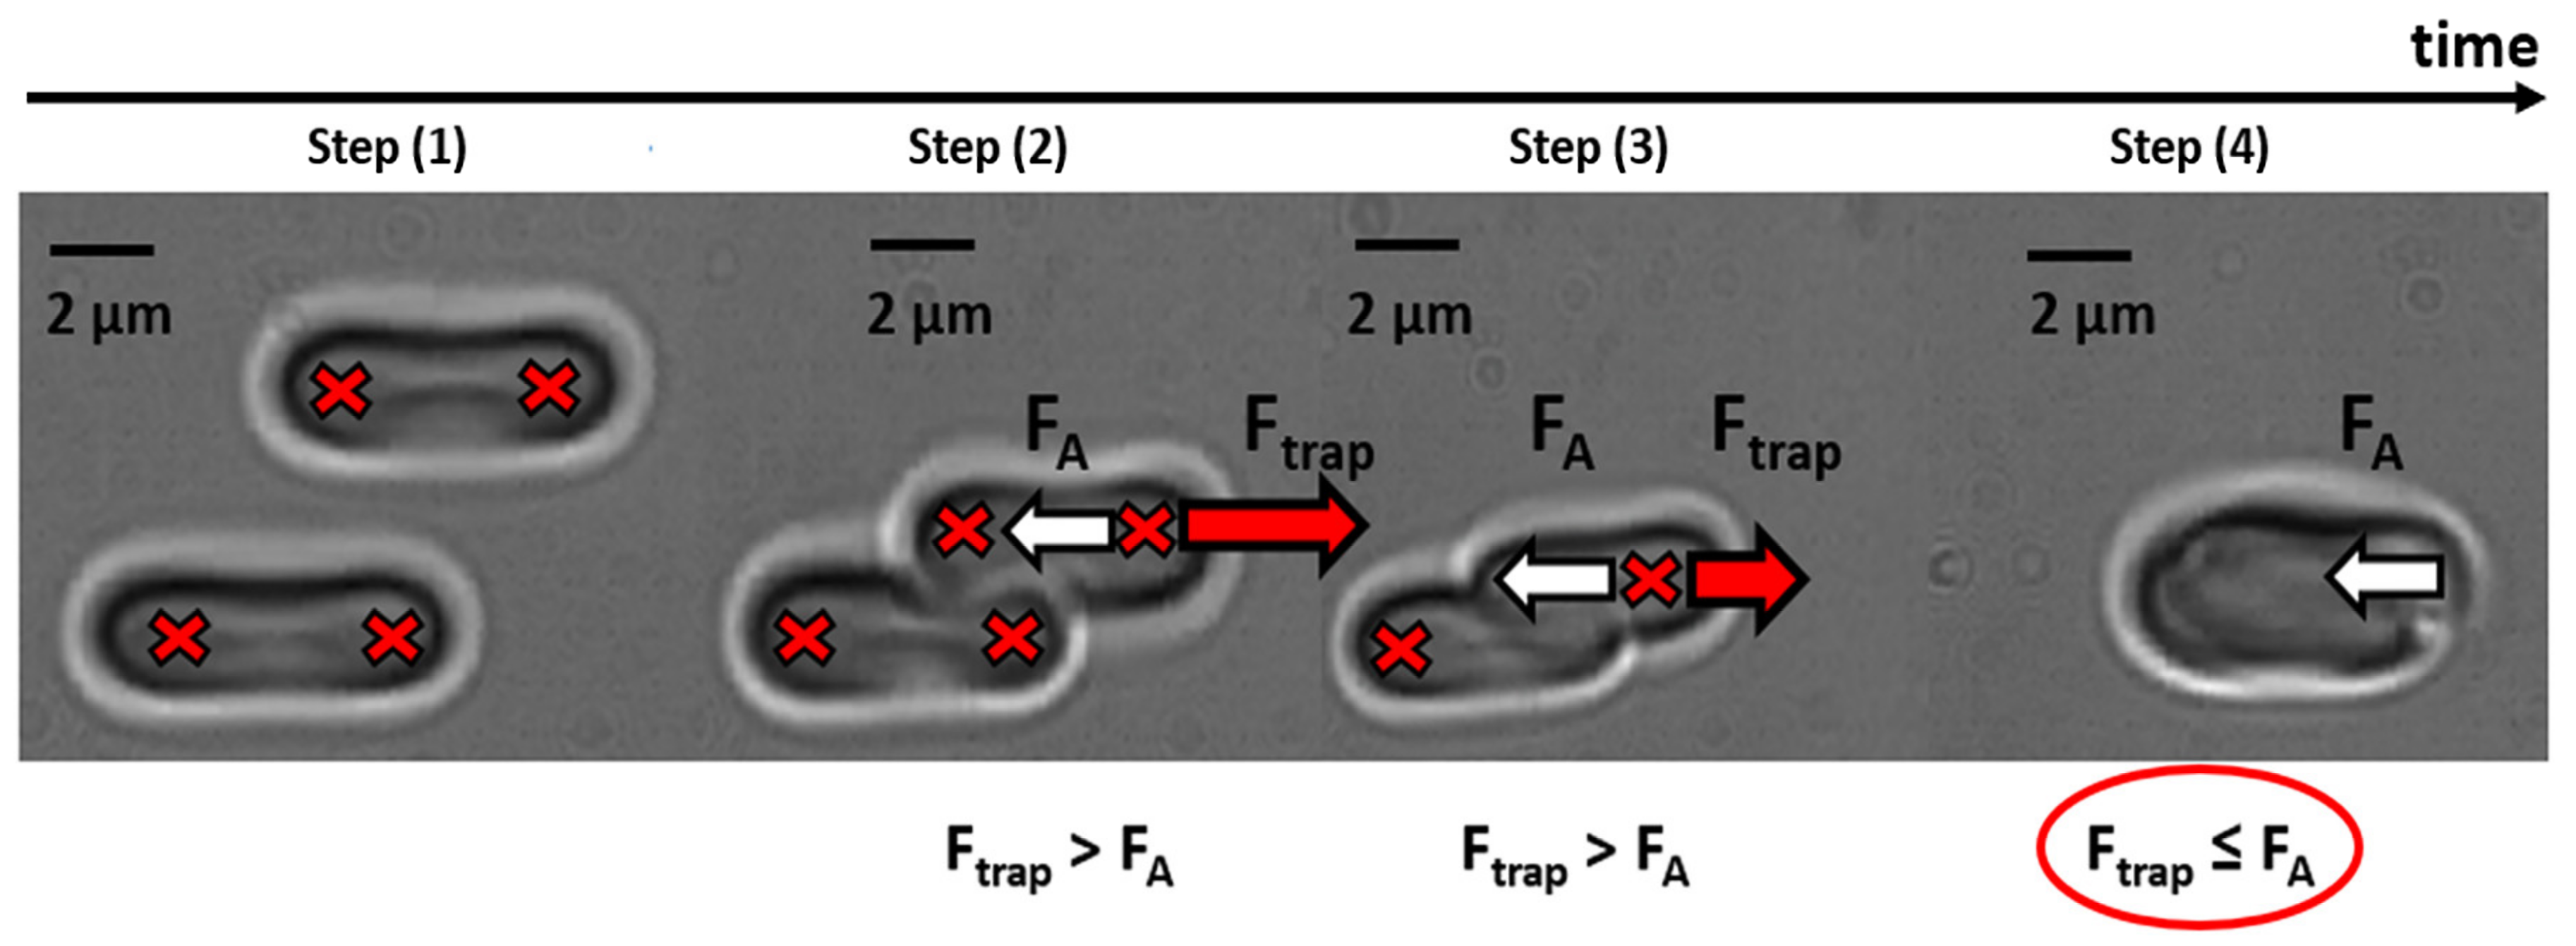
Abstract
1. Introduction
2. Materials and Methods
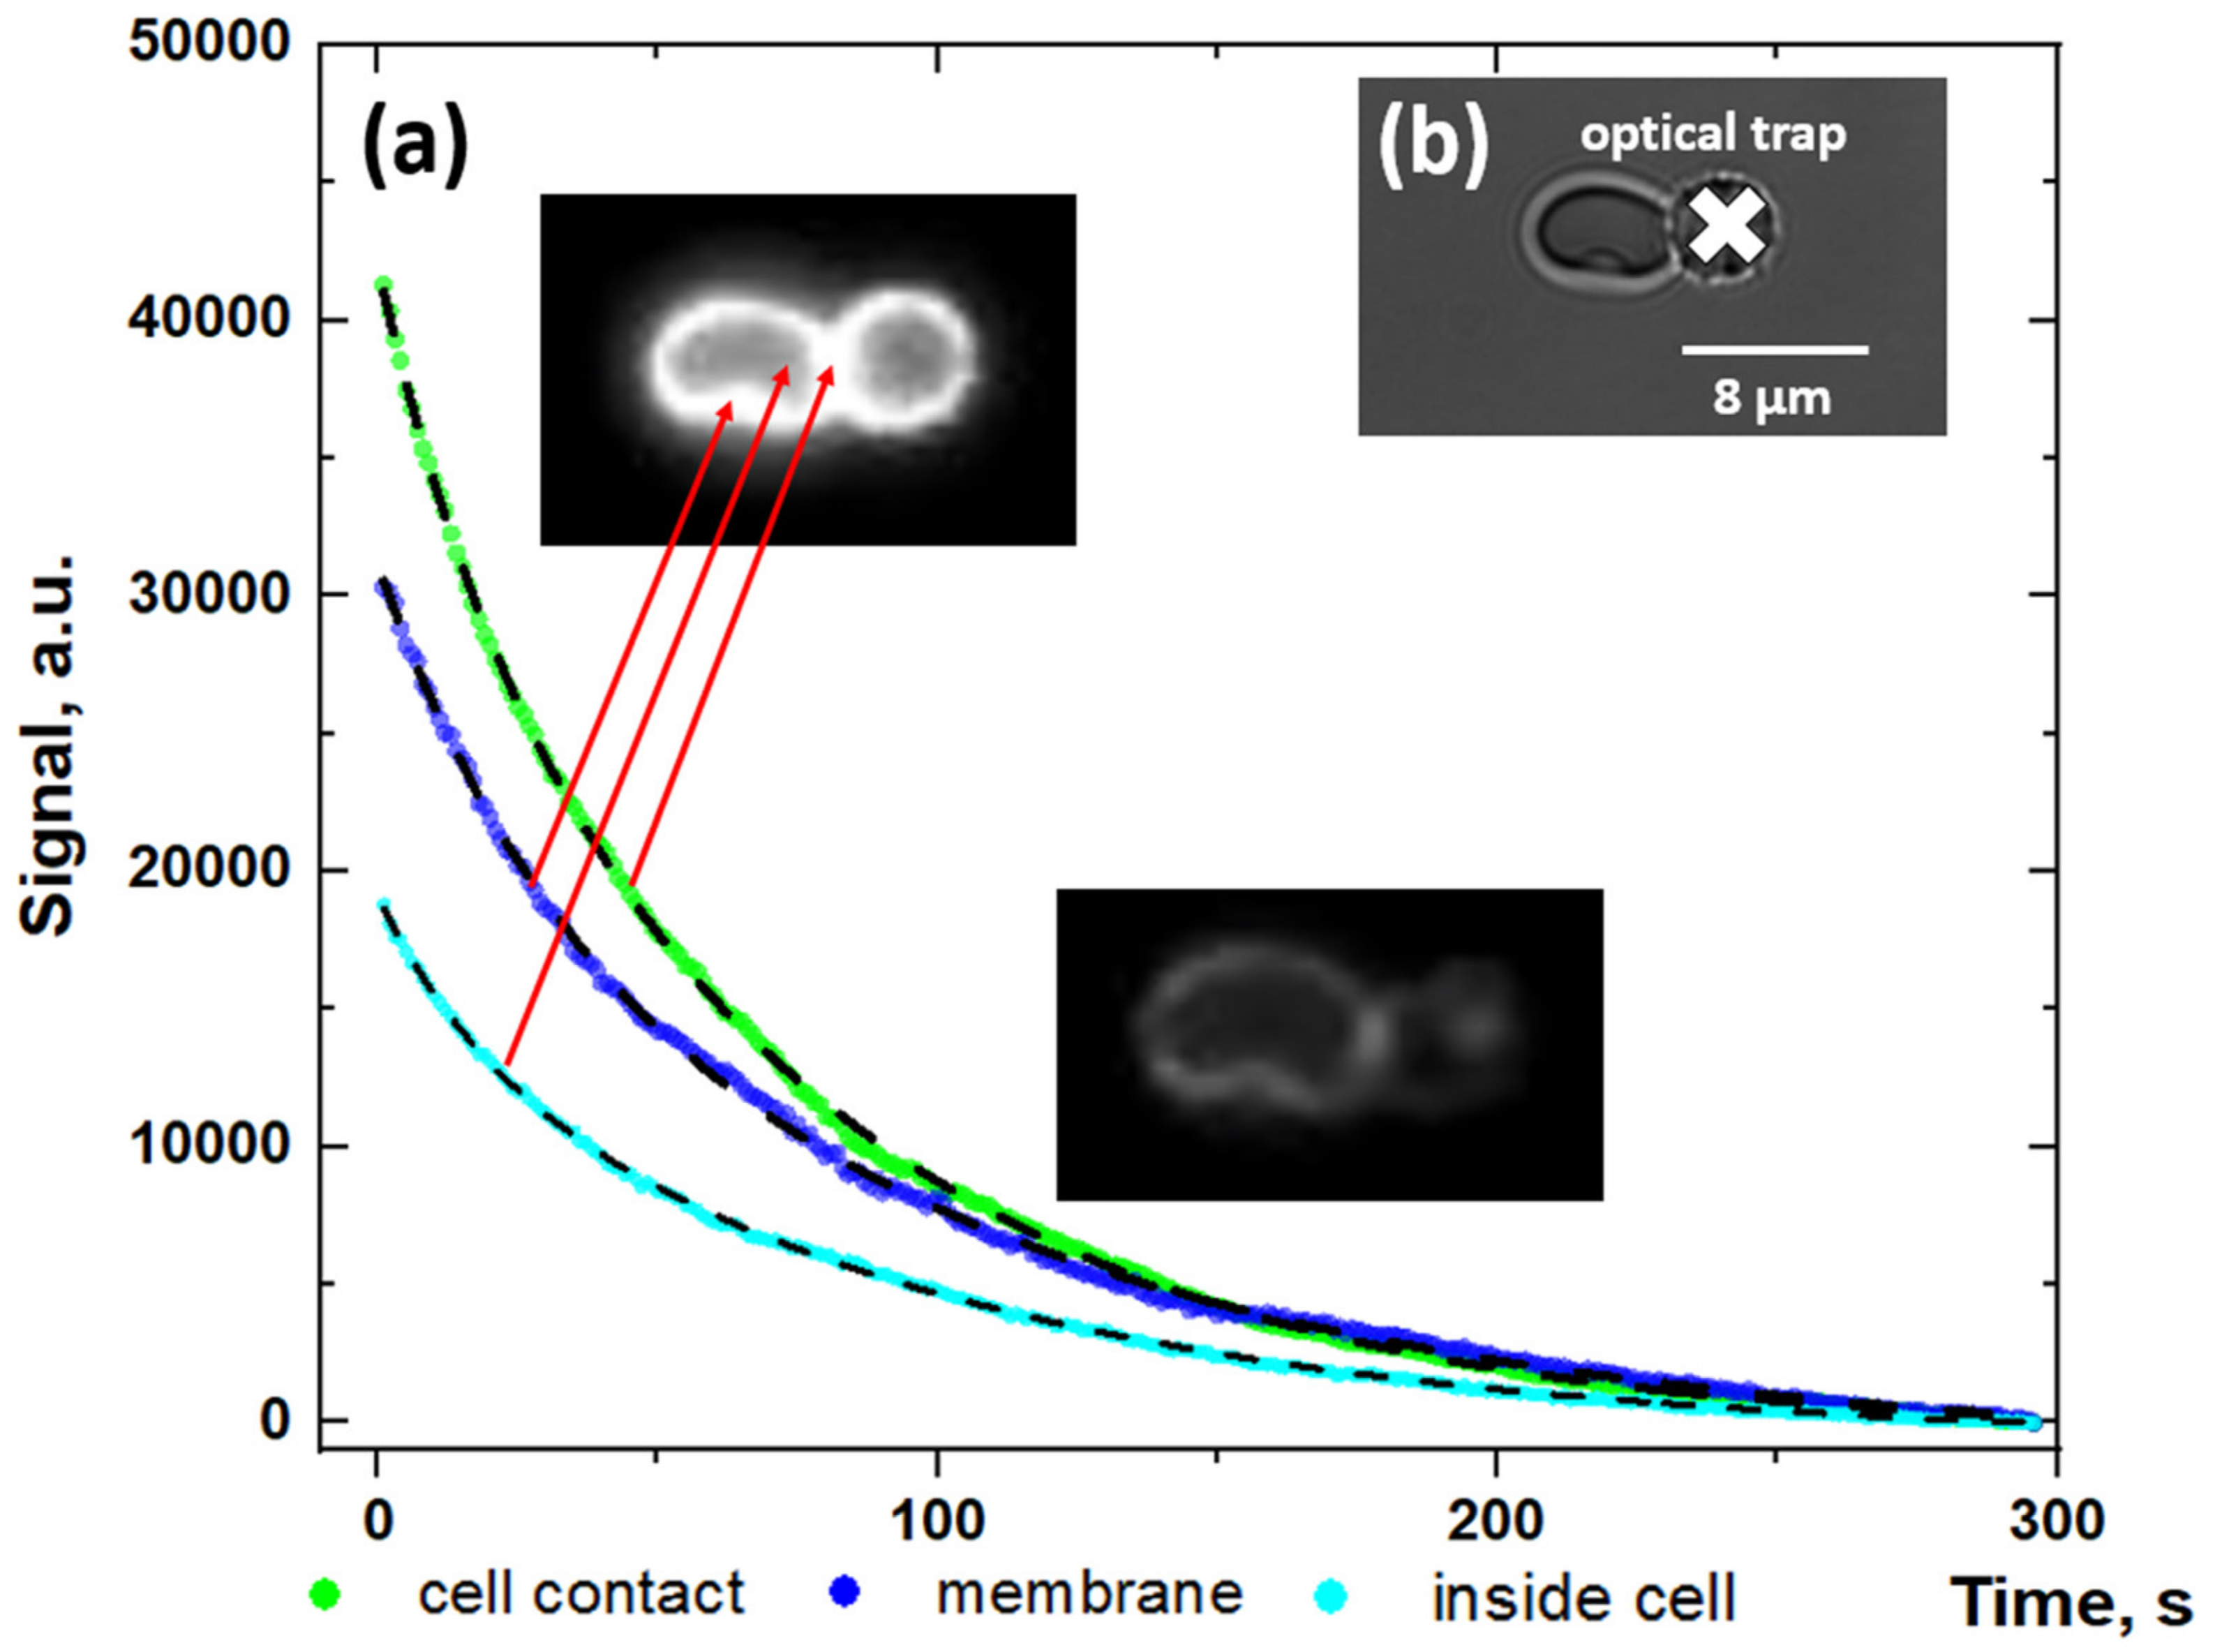
2.1. Protocol of the Microscopic Studies of Alexa488-Labeled Fibrinogen Adsorption onto RBC Membrane
2.2. The Protocol of Cells Preparation for the Measurements of Hydrodynamic Strength of RBC Aggregates Using Laser Aggregometry
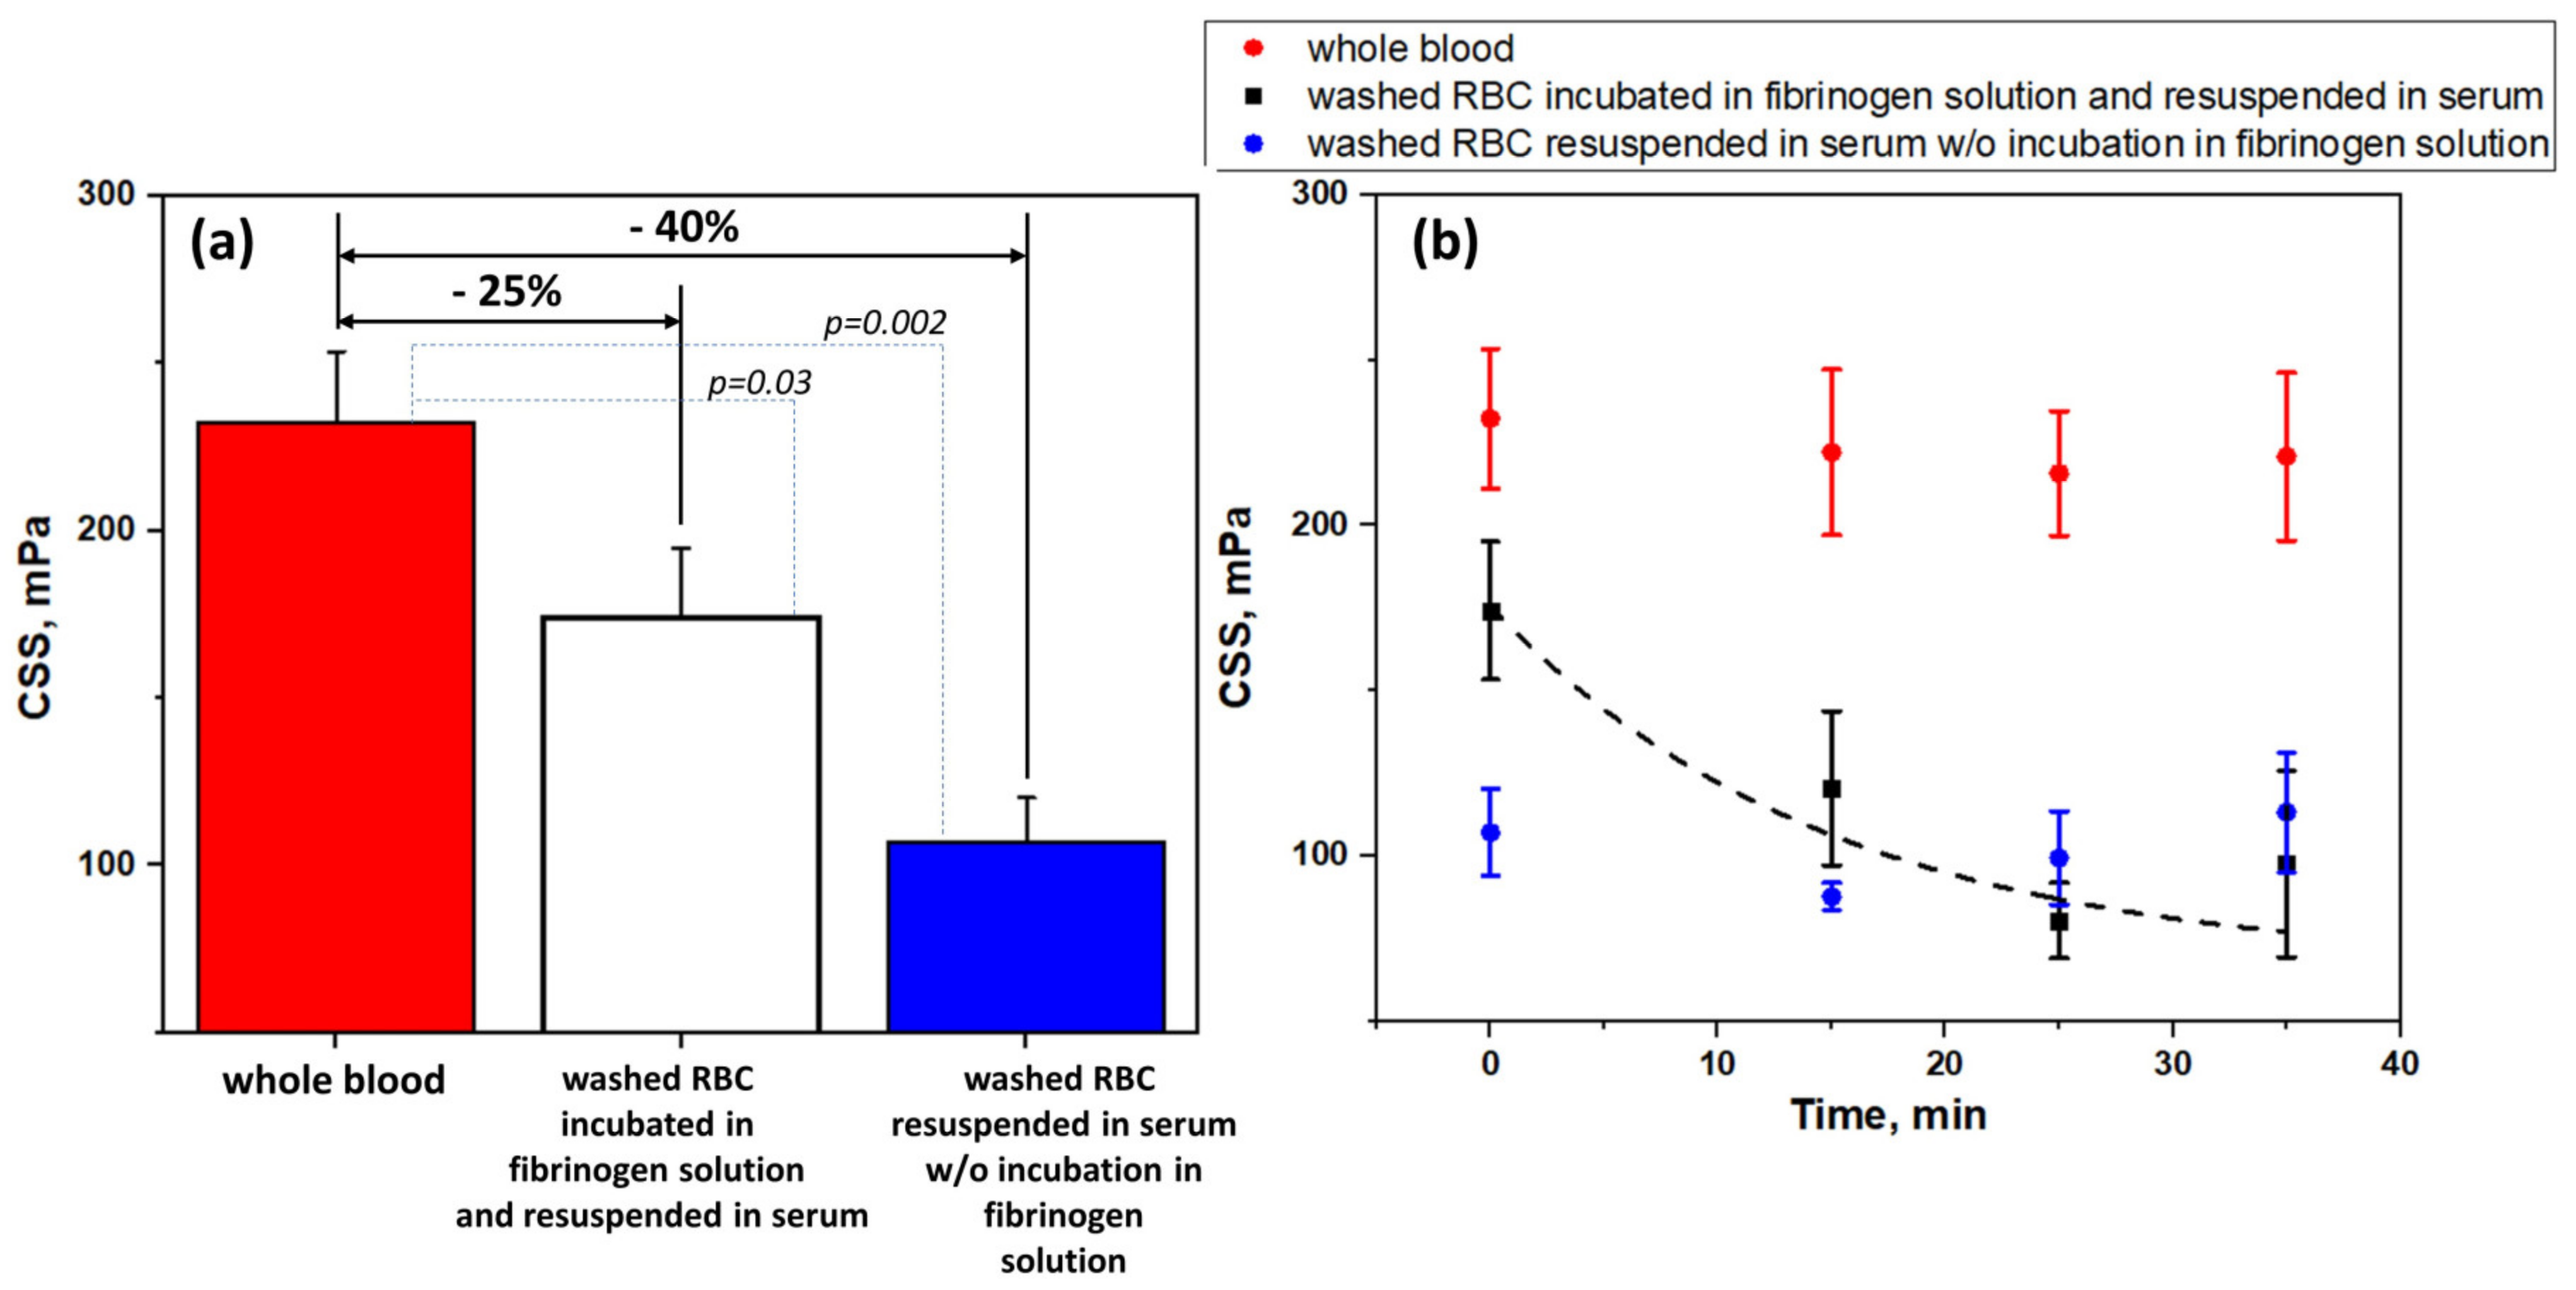
2.3. Laser Aggregometry Measurements. Critical Shear Stress
2.4. Optical Tweezers Measurements of Interaction Forces Between Individual RBC
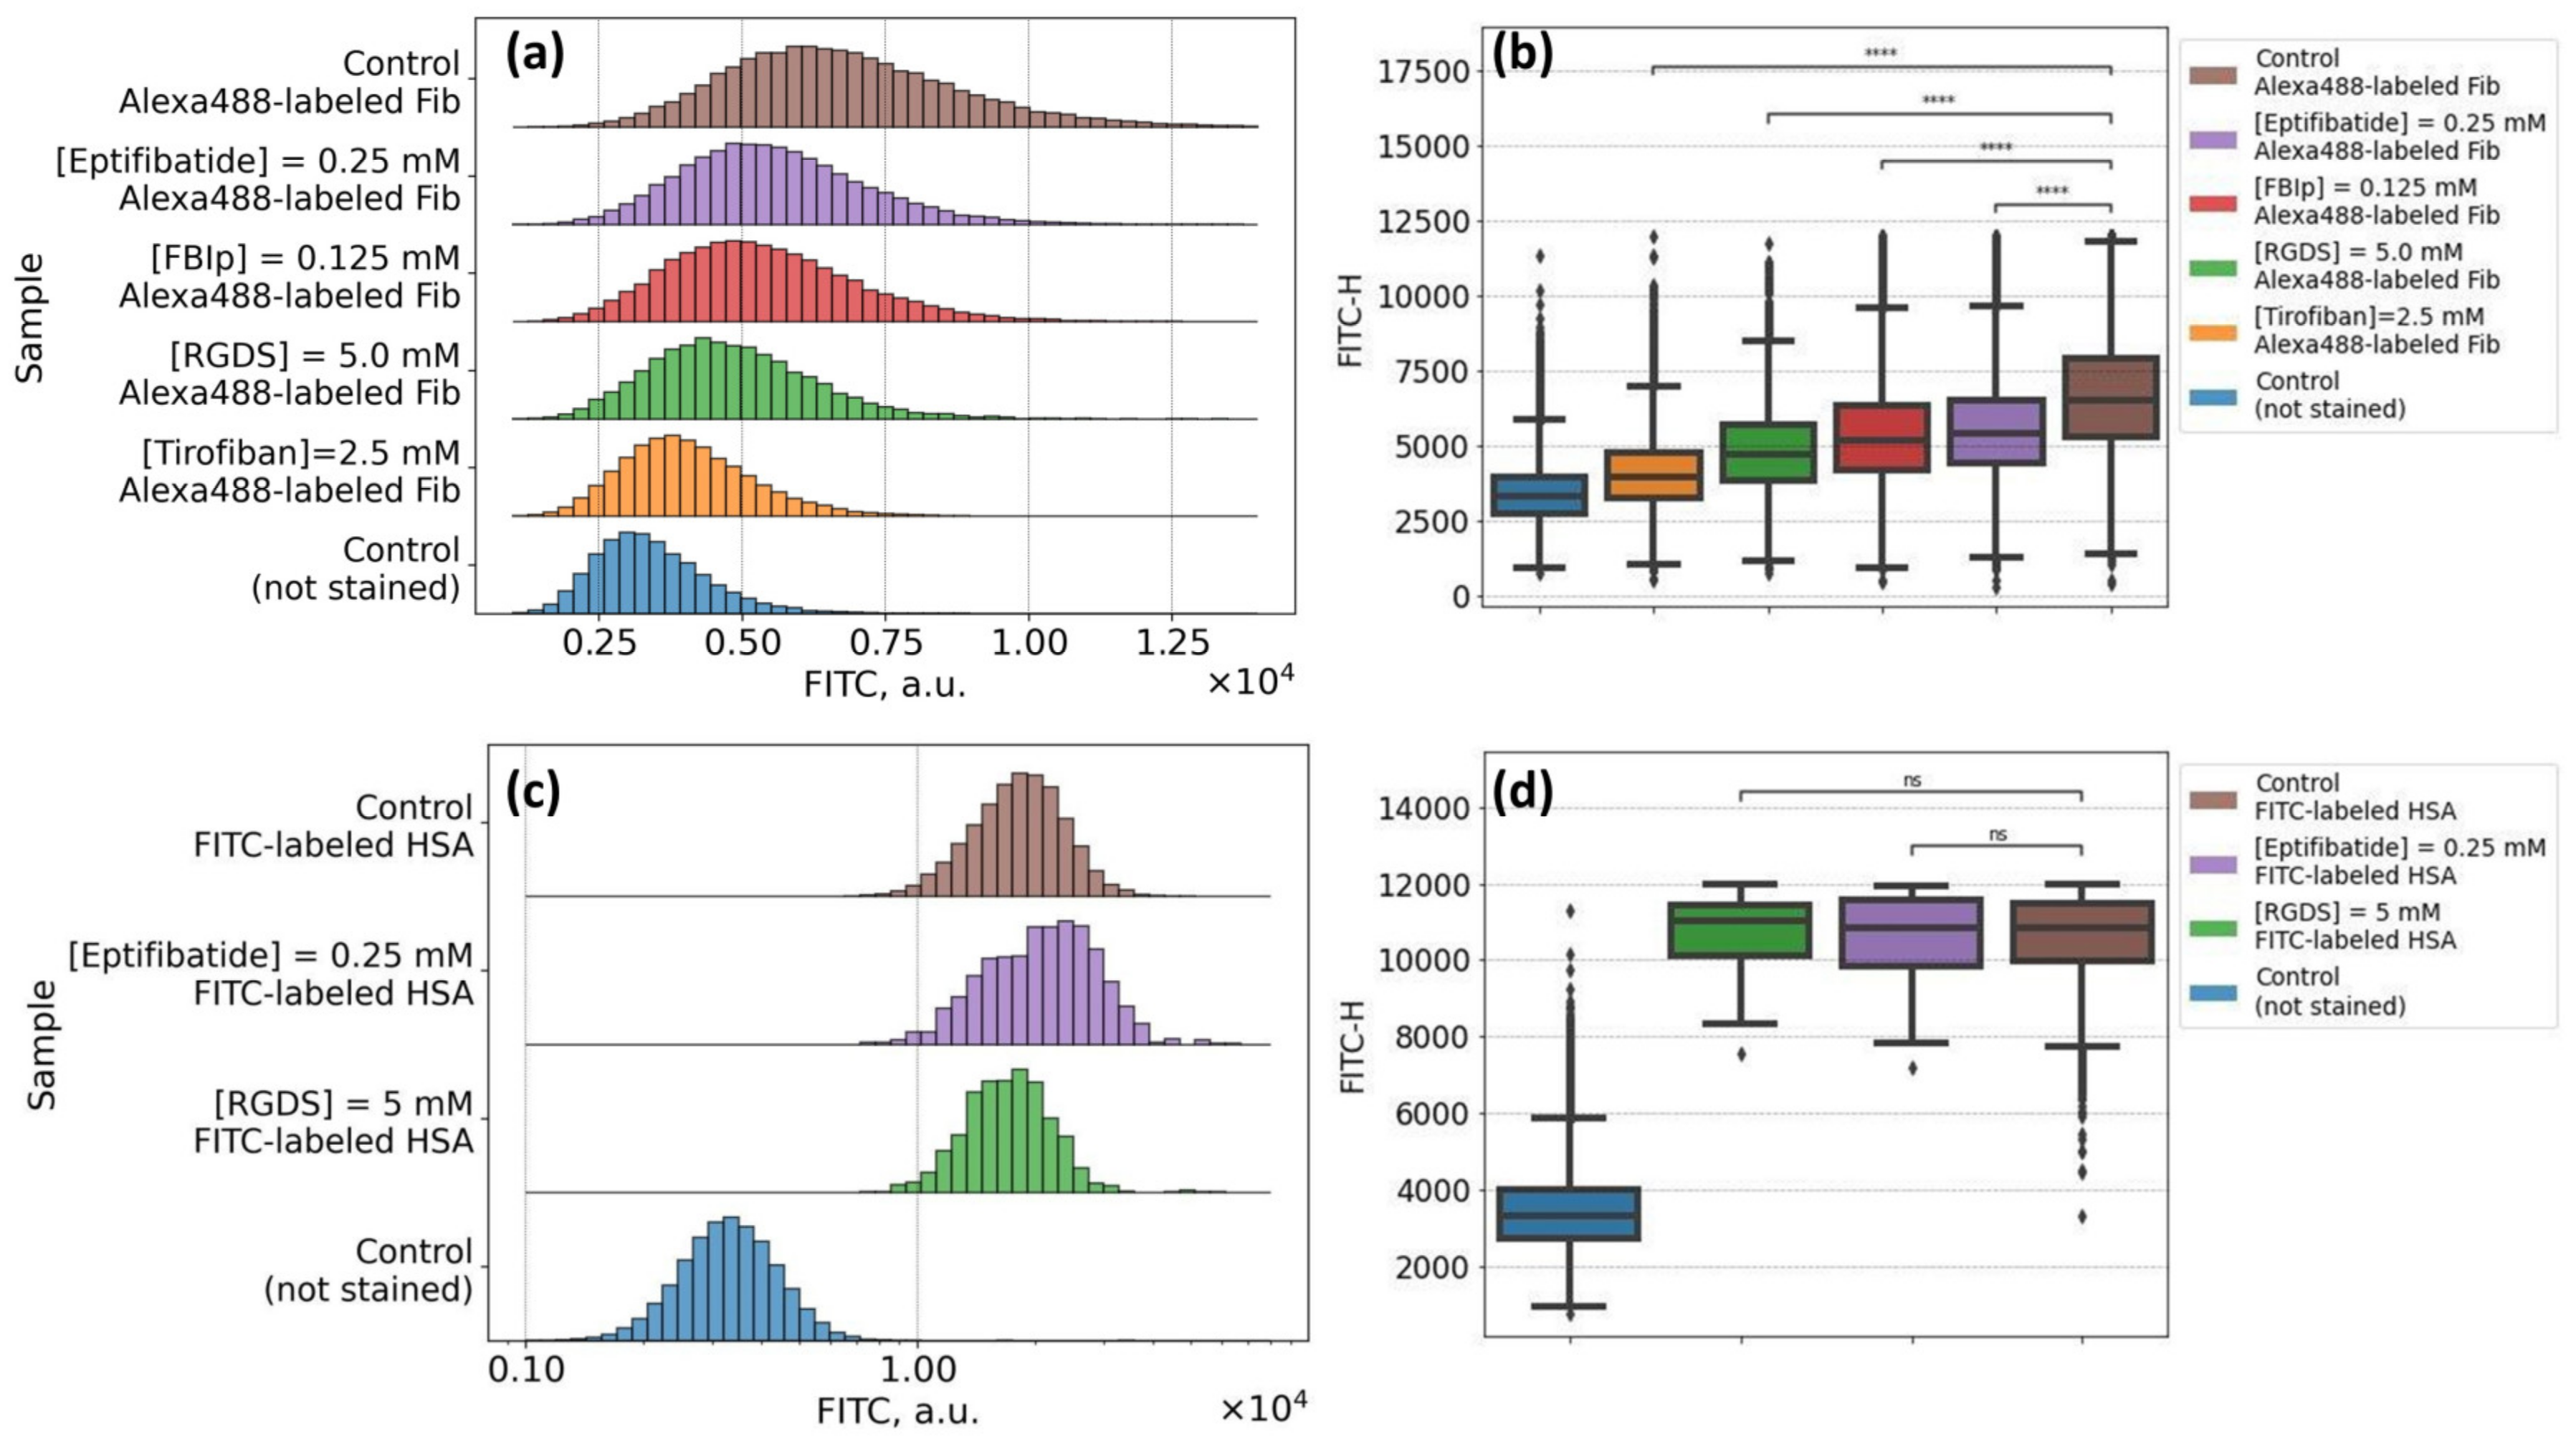
2.5. The Protocol of the Flow Cytometry Assay of the Specific Mechanisms of Alexa488-Labeled Fibrinogen Adsorption onto RBC Membrane
2.6. Statistics and Data Presentation
3. Results
3.1. Microscopy Visualization of Fibrinogen Macromolecules Adsorption onto RBC Membrane: Role of Fibrinogen Adsorption and Desorption in the Process of RBC Aggregation
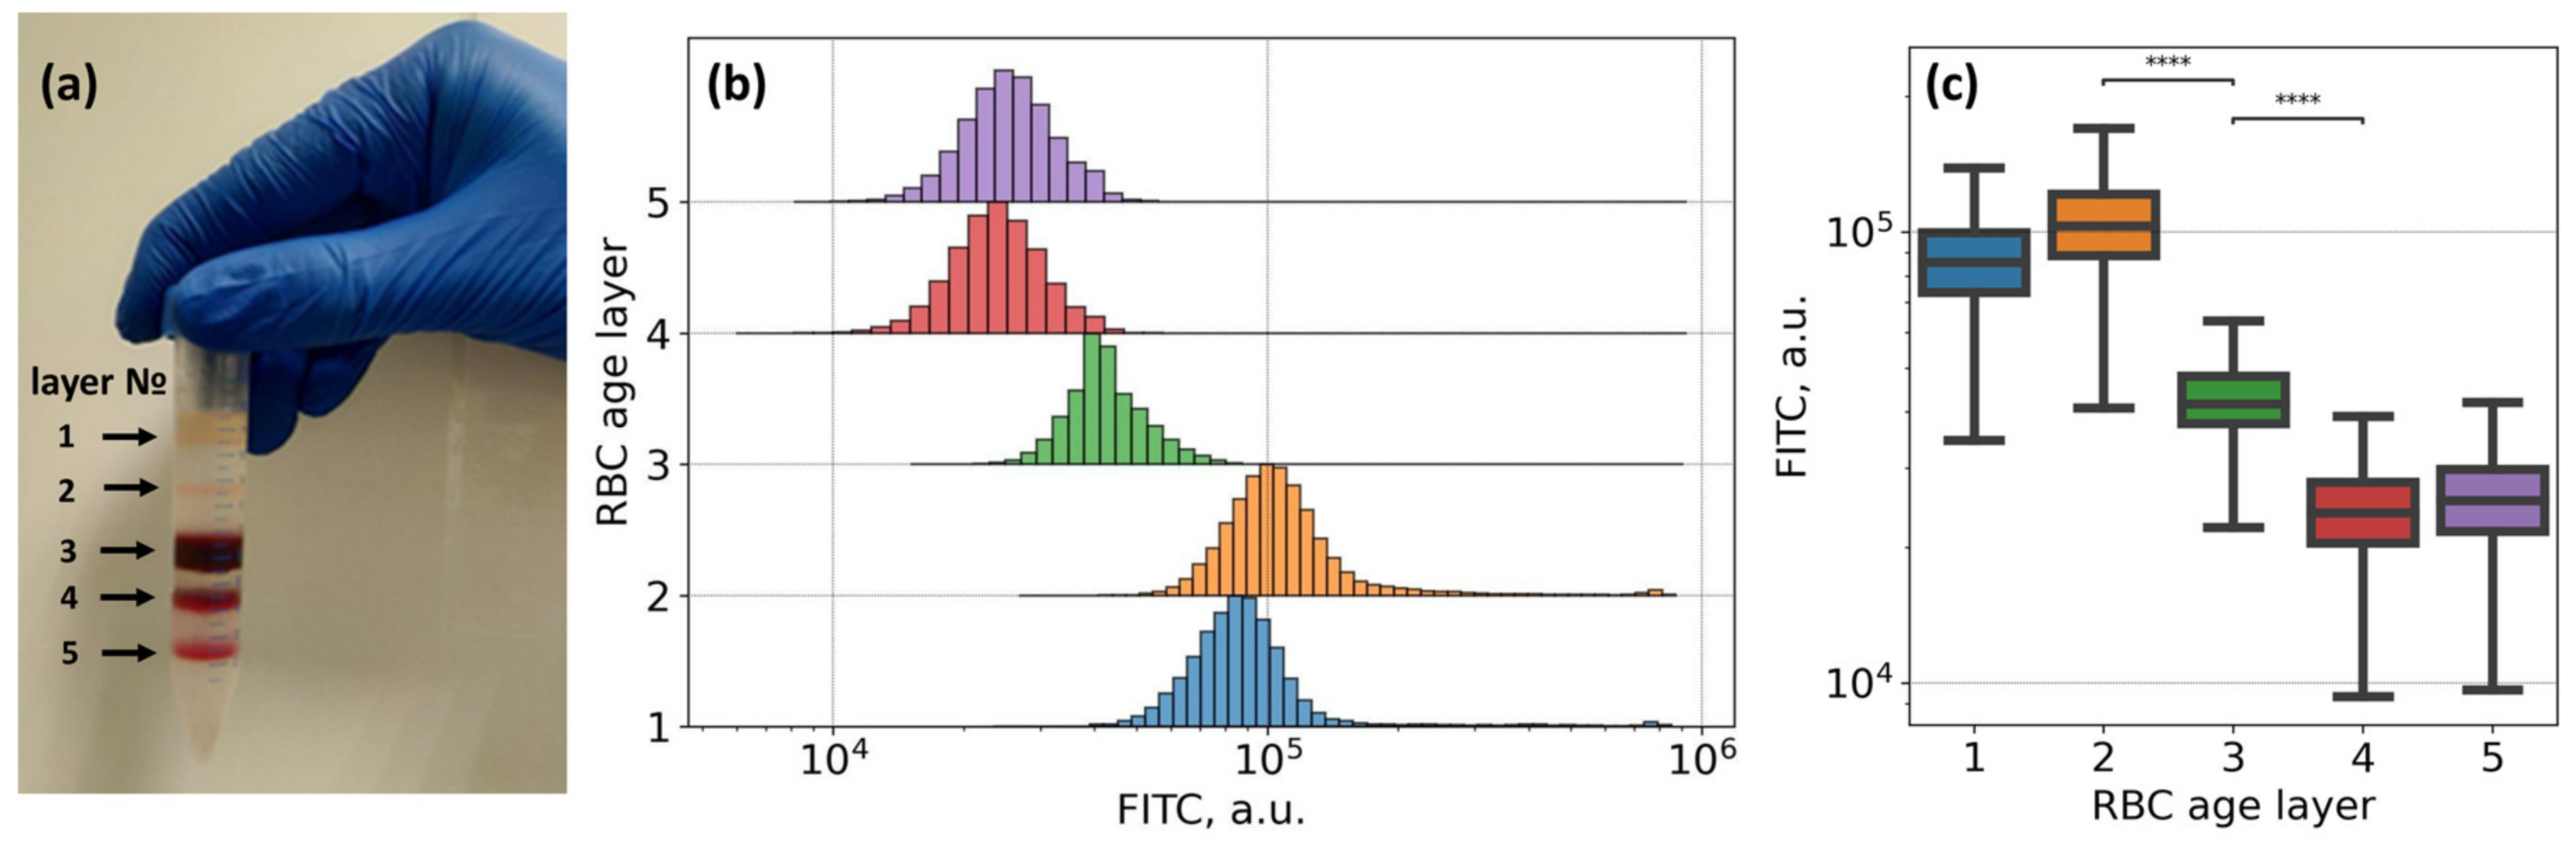
3.2. Mechanisms of Fibrinogen Macromolecules Adsorption onto RBC Membrane Revealed by Flow Cytometry: Effects of Glycoproteins Inhibition and RBC Ageing
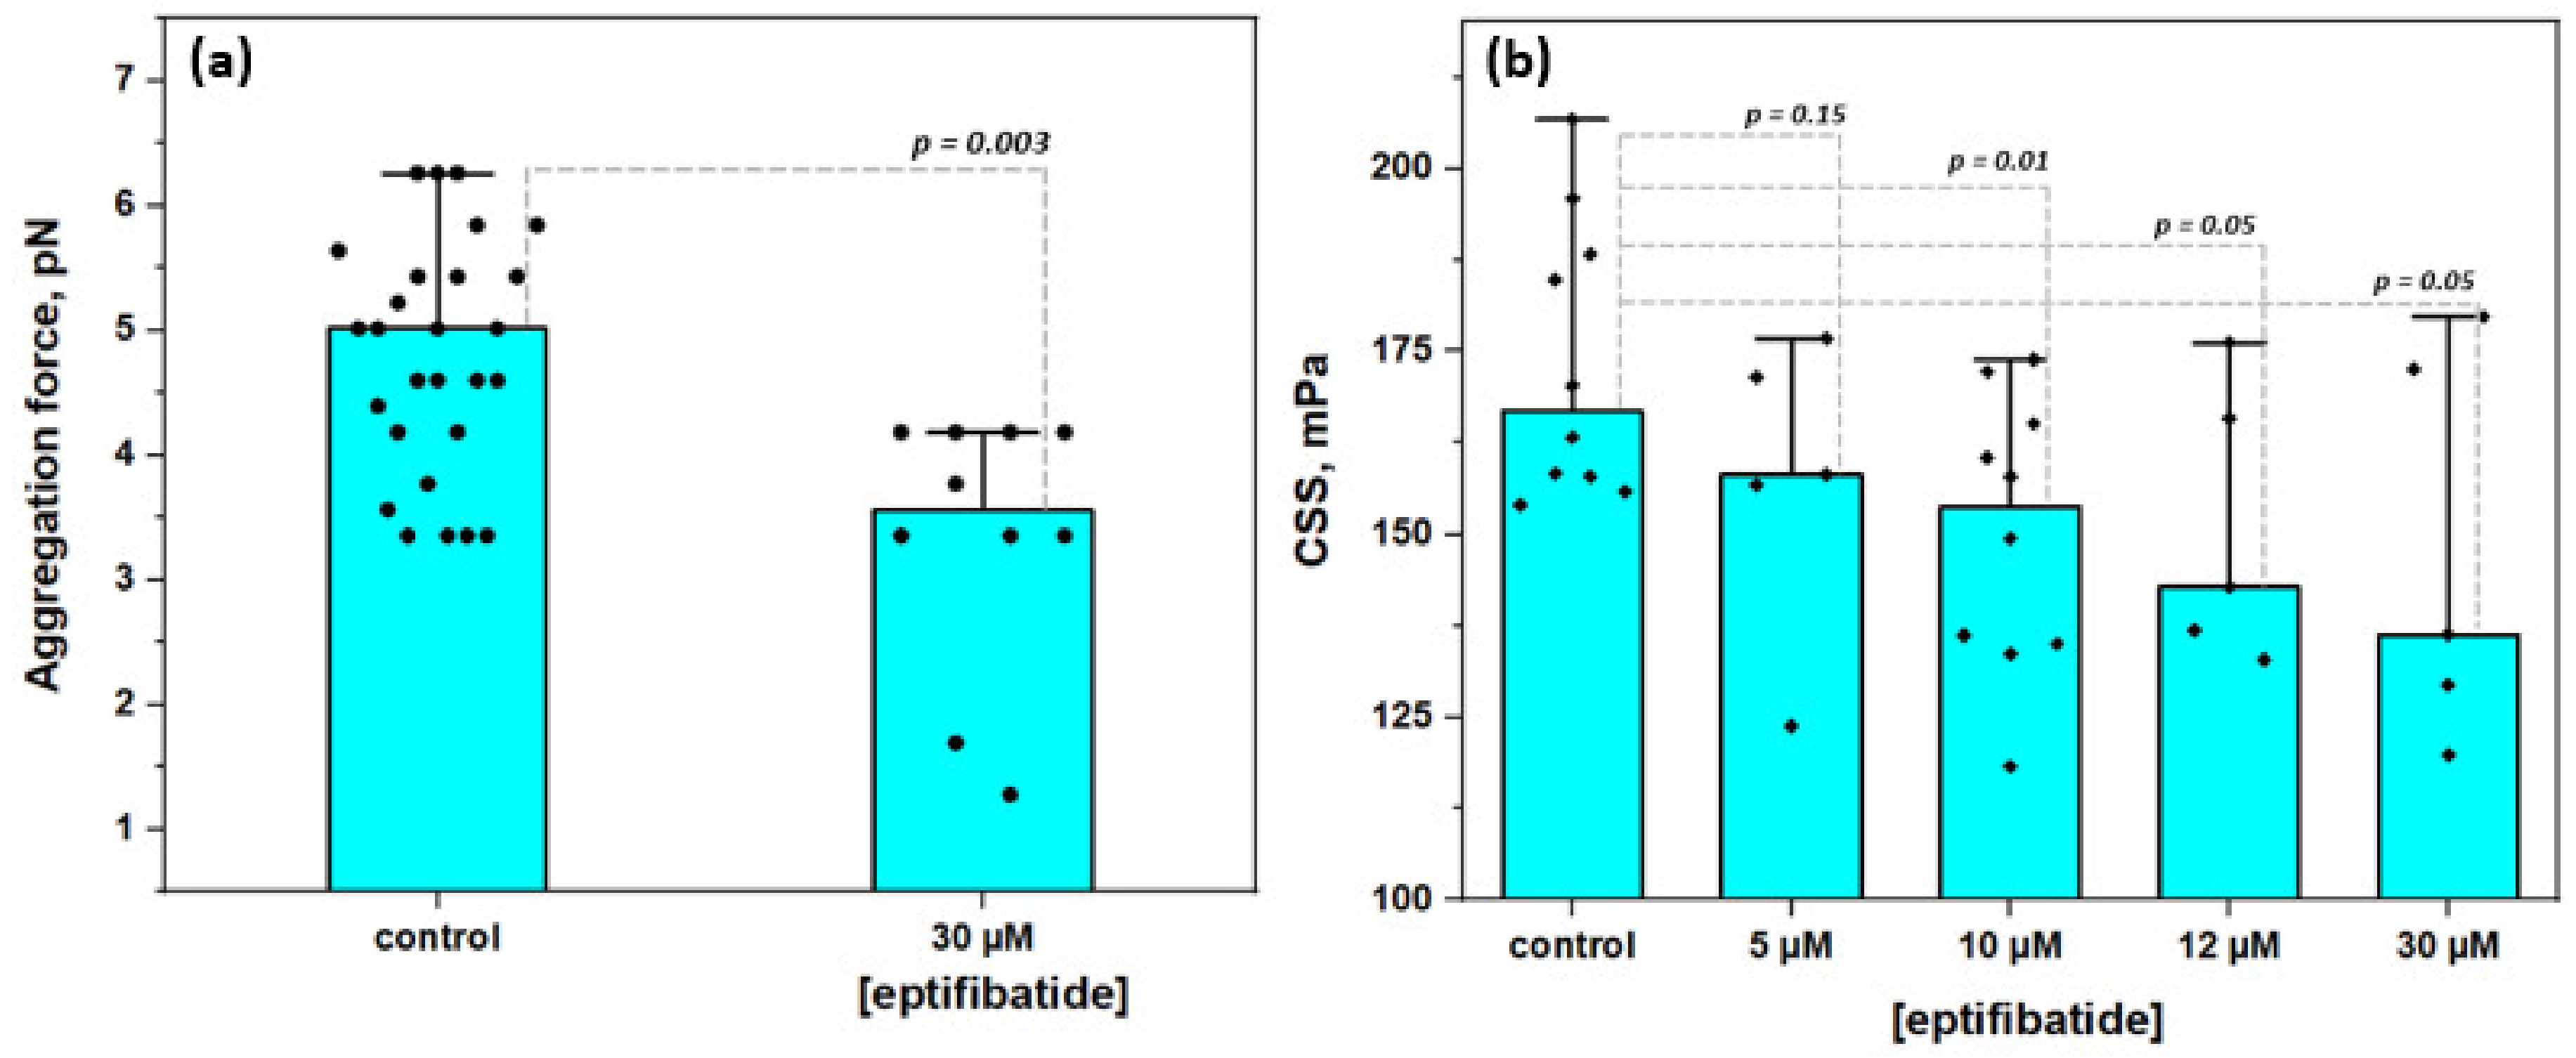
3.3. Effects of Glycoproteins IIbIIIa Inhibition on RBC Aggregation
4. Discussion
5. Conclusions
Supplementary Materials
Author Contributions
Funding
Acknowledgments
Conflicts of Interest
References
- Wagner, C.; Steffen, P.; Svetina, S. Aggregation of red blood cells: From rouleaux to clot formation. Comptes Rendus Phys. 2013, 14, 459–469. [Google Scholar] [CrossRef]
- Brun, J.F.; Varlet-Marie, E.; Richou, M.; Mercier, J.; Raynaud De Mauverger, E. Blood rheology as a mirror of endocrine and metabolic homeostasis in health and disease. Clin. Hemorheol. Microcirc. 2018, 69, 239–265. [Google Scholar] [CrossRef] [PubMed]
- Richardson, K.J.; Kuck, L.; Simmonds, M.J. Beyond oxygen transport: Active role of erythrocytes in the regulation of blood flow. Am. J. Physiol. Heart Circ. Physiol. 2020. [Google Scholar] [CrossRef] [PubMed]
- Baskurt, O.K.; Meiselman, H.J. Blood Rheology and Hemodynamics. Semin. Thromb. Hemost. 2003, 29, 435–450. [Google Scholar] [CrossRef] [PubMed]
- Baskurt, O.K.; Meiselman, H.J. Hemodynamic effects of red blood cell aggregation. Indian J. Exp. Biol. 2007, 45, 25–31. [Google Scholar]
- Sherwood, J.M.; Holmes, D.; Kaliviotis, E.; Balabani, S. Spatial distributions of red blood cells significantly alter local haemodynamics. PLoS ONE 2014, 9. [Google Scholar] [CrossRef]
- Panteleev, M.A.; Dashkevich, N.M.; Ataullakhanov, F.I. Hemostasis and thrombosis beyond biochemistry: roles of geometry, flow and diffusion. Thromb. Res. 2015, 136, 699–711. [Google Scholar] [CrossRef]
- Brust, M.; Aouane, O.; Thiebaud, M.; Flormann, D.; Verdier, C.; Kaestner, L.; Laschke, M.W.; Selmi, H.; Benyoussef, A.; Podgorski, T.; et al. The plasma protein fibrinogen stabilizes clusters of red blood cells in microcapillary flows. Sci. Rep. 2014, 4, 1–6. [Google Scholar] [CrossRef]
- Tutwiler, V.; Litvinov, R.I.; Lozhkin, A.P.; Peshkova, A.D.; Lebedeva, T.; Ataullakhanov, F.I.; Spiller, K.L.; Cines, D.B.; Weisel, J.W. Kinetics and mechanics of clot contraction are governed by the molecular and cellular composition of the blood. Blood 2016, 127, 149–160. [Google Scholar] [CrossRef]
- Baskurt, O.K.; Neu, B.; Meiselman, H. Red Blood Cell Aggregation; CRC Press: Boca Raton, FL, USA, 2012; ISBN 9781439841815. [Google Scholar]
- Nemeth, N.; Deak, A.; Szentkereszty, Z.; Peto, K. Effects and influencing factors on hemorheological variables taken into consideration in surgical pathophysiology research. Clin. Hemorheol. Microcirc. 2018, 69, 133–140. [Google Scholar] [CrossRef]
- Weng, X.; Cloutier, G.; Beaulieu, R.; Roederer, G.O. Influence of acute-phase proteins on erythrocyte aggregation. Am. J. Physiol. 1996, 271, H2346–H2352. [Google Scholar] [CrossRef] [PubMed]
- Ami, R.B.; Barshtein, G.; Zeltser, D.; Goldberg, Y.; Shapira, I.; Roth, A.; Keren, G.; Miller, H.; Prochorov, V.; Eldor, A.; et al. Parameters of red blood cell aggregation as correlates of the inflammatory state. Am. J. Physiol. Heart Circ. Physiol. 2001, 280, H1982–H1988. [Google Scholar] [CrossRef]
- Goldin, Y.; Tulshinski, T.; Arbel, Y.; Rogowski, O.; Ami, R.B.; Serov, J.; Halperin, P.; Shapira, I.; Berliner, S. Rheological consequences of acute infections: The rheodifference between viral and bacterial infections. Clin. Hemorheol. Microcirc. 2007, 36, 111–119. [Google Scholar] [PubMed]
- Xue, S.; Lee, B.K.; Shin, S. Disaggregating shear stress: The roles of cell deformability and fibrinogen concentration. Clin. Hemorheol. Microcirc. 2013, 55, 231–240. [Google Scholar] [CrossRef] [PubMed]
- Adar, T.; Ben-Ami, R.; Elstein, D.; Zimran, A.; Berliner, S.; Yedgar, S.; Barshtein, G. Aggregation of red blood cells in patients with Gaucher disease. Br. J. Haematol. 2006, 134, 432–437. [Google Scholar] [CrossRef]
- Lip, G.Y.H. Fibrinogen and cardiovascular disorders. Q. J. Med. 1995, 88, 155–165. [Google Scholar] [CrossRef]
- Lugovtsov, A.E.; Gurfinkel, Y.I.; Ermolinskiy, P.B.; Maslyanitsina, A.I.; Dyachuk, L.I.; Priezzhev, A.V. Optical assessment of alterations of microrheologic and microcirculation parameters in cardiovascular diseases. Biomed. Opt. Express 2019, 10, 3974. [Google Scholar] [CrossRef]
- Berliner, J.A.; Navab, M.; Fogelman, A.M.; Frank, J.S.; Demer, L.L.; Edwards, P.A.; Watson, D.; Lusis, A.J. Atherosclerosis: Basic Mechanisms. Circulation 1995, 91, 2488–2496. [Google Scholar] [CrossRef]
- Zorio, E.; Murado, J.; Arizo, D.; Rueda, J.; Corella, D.; Simó, M.; Vayá, A. Haemorheological parameters in young patients with acute myocardial infarction. Clin. Hemorheol. Microcirc. 2008, 39, 33–41. [Google Scholar] [CrossRef]
- Mantskava, M.; Momtselidze, N.; Pargalava, N.; Mchedlishvili, G. Hemorheological disorders in patients with type 1 or 2 diabetes mellitus and foot gangrene. Clin. Hemorheol. Microcirc. 2006, 35, 307–310. [Google Scholar]
- Singh, M.; Shin, S. Changes in erythrocyte aggregation and deformability in diabetes mellitus: A brief review. Indian J. Exp. Biol. 2009, 47, 7–15. [Google Scholar]
- Grobler, C.; Maphumulo, S.C.; Grobbelaar, L.M.; Bredenkamp, J.C.; Laubscher, G.J.; Lourens, P.J.; Steenkamp, J.; Kell, D.B.; Pretorius, E. Covid-19: The rollercoaster of fibrin (ogen), d-dimer, von willebrand factor, p-selectin and their interactions with endothelial cells, platelets and erythrocytes. Int. J. Mol. Sci. 2020, 21, 5168. [Google Scholar] [CrossRef] [PubMed]
- Rampling, M.W.W.; Meiselman, H.J.; Neu, B.; Baskurt, O.K. Influence of cell-specific factors on red blood cell aggregation. Biorheology 2004, 41, 91–112. [Google Scholar] [CrossRef] [PubMed]
- Minetti, G.; Egée, S.; Mörsdorf, D.; Steffen, P.; Makhro, A.; Achilli, C.; Ciana, A.; Wang, J.; Bouyer, G.; Bernhardt, I.; et al. Red cell investigations: Art and artefacts. Blood Rev. 2013, 27, 91–101. [Google Scholar] [CrossRef] [PubMed]
- Kikuchi, Y.; Koyama, T. Red blood cell deformability and protein adsorption on red blood cell surface. Am. J. Physiol. 1984, 247, H739–H747. [Google Scholar] [CrossRef] [PubMed]
- Pretini, V.; Koenen, M.H.; Kaestner, L.; Fens, M.H.A.M.; Schiffelers, R.M.; Bartels, M.; van Wijk, R. Red blood cells: Chasing interactions. Front. Physiol. 2019, 10, 1–17. [Google Scholar] [CrossRef]
- Maeda, N.; Seike, M.; Kume, S.; Takaku, T.; Shiga, T. Fibrinogen—Induced erythrocyte aggregation: Erythrocyte-binding site in the fibrinogen molecule. Biochim. Biophys. Acta 1987, 904, 81–91. [Google Scholar] [CrossRef]
- Wick, T.M.; Moake, J.L.; Udden, M.M.; Mclntire, L. V Unusually Large von Willebrand Factor Multimers Preferentially Promote Young Sickle and Nonsickle Erythrocyte Adhesion to Endothelial Cells. Am. J. Hematol. 1993, 292, 284–292. [Google Scholar] [CrossRef]
- Lominadze, D.; Dean, W.L. Involvement of fibrinogen specific binding in erythrocyte aggregation. FEBS Lett. 2002, 517, 41–44. [Google Scholar] [CrossRef]
- Carvalho, F.A.; Connell, S.; Miltenberger-Miltenyi, G.; Pereira, S.V.; Tavares, A.; Ariëns, R.A.S.; Santos, N.C. Atomic force microscopy-based molecular recognition of a fibrinogen receptor on human erythrocytes. ACS Nano 2010, 4, 4609–4620. [Google Scholar] [CrossRef]
- De Oliveira, S.; de Almeida, V.V.; Calado, A.; Rosário, H.S.; Saldanha, C. Integrin-associated protein (CD47) is a putative mediator for soluble fibrinogen interaction with human red blood cells membrane. Biochim. Biophys. Acta Biomembr. 2012, 1818, 481–490. [Google Scholar] [CrossRef] [PubMed]
- Sokolova, I.A.; Muravyov, A.V.; Khokhlova, M.D.; Rikova, S.Y.; Lyubin, E.V.; Gafarova, M.A.; Skryabina, M.N.; Fedyanin, A.A.; Kryukova, D.V.; Shahnazarov, A.A. An effect of glycoprotein IIb/IIIa inhibitors on the kinetics of red blood cells aggregation. Clin. Hemorheol. Microcirc. 2014, 57, 291–302. [Google Scholar] [CrossRef] [PubMed]
- Sokolova, I.; Gafarova, M.; Khokhlova, M.; Muravyev, A.; Lyubin, E.; Skryabina, M.; Fedyanin, A.; Krasnova, T.; Shahnazarov, A. Glycoprotein IIB-IIIA inhibitor, monafram decelerate the early phase of red blood cells aggregation. J. Cell. Biotechnol. 2016, 2, 15–22. [Google Scholar] [CrossRef]
- Bennett, J.S. Structure and function of the platelet integrin α IIb β 3. J. Clin. Invest. 2005, 115, 3363–3369. [Google Scholar] [CrossRef]
- Hynes, R.O. Integrins: A Family of Cell Surface Receptors. Cell 1987, 48, 549–554. [Google Scholar] [CrossRef]
- Holmes, M.B.; Sobel, B.E.; Schneider, D.J. Variable Responses to Inhibition of Fibrinogen Binding Induced by Tirofiban and Eptifibatide in Blood from Healthy Subjects. Am. J. Cardiol. 1999, 84, 203–207. [Google Scholar] [CrossRef]
- Schneider, D.J.; Aggarwal, A. Development of glycoprotein IIb-IIIa antagonists: Translation of pharmacodynamic effects into clinical benefit. Expert Rev. Cardiovasc. Ther. 2004, 2, 903–913. [Google Scholar] [CrossRef]
- Gawaz, M.; Borst, O. Targeted antiplatelet therapy: novel treatment options for ischaemic heart disease. Eur. Heart J. 2017, 39, 1–2. [Google Scholar] [CrossRef]
- Rathod, K.; Antoniou, S.; Avari, P.; Ding, N.; Wright, P.; Knight, C.; Jain, A.; Mathur, A.; Smith, E.; Weerackody, R.; et al. Eptifibatide is associated with significant cost savings and similar clinical outcomes to abciximab when used during primary percutaneous coronary intervention for ST-elevation myocardial infarction: An observational cohort study of 3863 patients. JRSM Cardiovasc. Dis. 2017, 6, 1–8. [Google Scholar] [CrossRef] [PubMed]
- Roffi, M.; Chew, D.P.; Mukherjee, D.; Bhatt, D.L.; White, J.A.; Heeschen, C.; Hamm, C.W.; Moliterno, D.J.; Califf, R.M.; White, H.D.; et al. Platelet Glycoprotein IIb/IIIa Inhibitors Reduce Mortality in Coronary Syndromes. Clin. Investig. Rep. 2001, 104, 2767–2772. [Google Scholar] [CrossRef]
- Tuchin, V.V.; Xu, X.; Wang, R.K. Dynamic optical coherence tomography in studies of optical clearing, sedimentation, and aggregation of immersed blood. Appl. Opt. 2002, 41, 258. [Google Scholar] [CrossRef] [PubMed]
- Chung, S.M.; Oh, J.H.; Moon, J.S.; Kim, Y.K.; Yoon, J.S.; Won, K.C.; Lee, H.W. Critical shear stress is associated with diabetic kidney disease in patients with type 2 Diabetes. Sci. Rep. 2018, 8, 1–7. [Google Scholar] [CrossRef] [PubMed]
- Yakimov, B.P.; Gogoleva, M.A.; Semenov, A.N.; Rodionov, S.A.; Novoselova, M.V.; Gayer, A.V.; Bernakevich, A.I.; Fadeev, V.V.; Armaganov, A.G.; Drachev, V.P.; et al. Label-free characterization of white blood cells using fluorescence lifetime imaging and flow-cytometry: molecular heterogeneity and erythrophagocytosis. Biomed. Opt. Express 2019, 10, 4220–4236. [Google Scholar] [CrossRef] [PubMed]
- Bronkhorst, P.J.H.J.; Grimbergen, J.; Brakenhoff, G.J.J.; Heethaar, R.M.M.; Sixma, J.J.J. The mechanism of red cell (dis)aggregation investigated by means of direct cell manipulation using multiple optical trapping. Br. J. Haematol. 1997, 96, 256–258. [Google Scholar] [CrossRef] [PubMed]
- Fontes, A.; Fernandes, H.P.; de Thomaz, A.A.; Barbosa, L.C.; Barjas-Castro, M.L.; Cesar, C.L. Measuring electrical and mechanical properties of red blood cells with double optical tweezers. J. Biomed. Opt. 2008, 13, 14001. [Google Scholar] [CrossRef] [PubMed][Green Version]
- Khokhlova, M.D.; Lyubin, E.V.; Zhdanov, A.G.; Rykova, S.Y.; Sokolova, I.A.; Fedyanin, A.A. Normal and system lupus erythematosus red blood cell interactions studied by double trap optical tweezers: direct measurements of aggregation forces. J. Biomed. Opt. 2012, 17, 25001. [Google Scholar] [CrossRef] [PubMed]
- Zhu, R.; Avsievich, T.; Popov, A.; Meglinski, I. Optical Tweezers in Studies of Red Blood Cells. Cells 2020, 9, 545. [Google Scholar] [CrossRef]
- Lee, K.; Shirshin, E.; Rovnyagina, N.; Yaya, F.; Boujja, Z.; Priezzhev, A.; Wagner, C. Dextran adsorption onto red blood cells revisited: single cell quantification by laser tweezers combined with microfluidics. Biomed. Opt. Express 2018, 9, 2755–2764. [Google Scholar] [CrossRef]
- Lee, K.; Wagner, C.; Priezzhev, A.V. Assessment of the “cross-bridge”—Induced interaction of red blood cells by optical trapping combined with microfluidics. J. Biomed. Opt. 2017, 22. [Google Scholar] [CrossRef]
- Lee, S.J.; Jo, H.H.; Lim, K.S.; Lim, D.; Lee, S.; Lee, J.H.; Kim, W.D.; Jeong, M.H.; Lim, J.Y.; Kwon, I.K.; et al. Heparin coating on 3D printed poly (l-lactic acid) biodegradable cardiovascular stent via mild surface modification approach for coronary artery implantation. Chem. Eng. J. 2019, 378, 122116. [Google Scholar] [CrossRef]
- Liu, X.; Gao, C.; Yuan, J.; Xiang, T.; Gong, Z.; Luo, H.; Jiang, W.; Song, Y.; Huang, J.; Quan, W.; et al. Subdural haematomas drain into the extracranial lymphatic system through the meningeal lymphatic vessels. Acta Neuropathol. Commun. 2020, 8, 16. [Google Scholar] [CrossRef] [PubMed]
- De Vries, J.J.; Hoppenbrouwers, T.; Martinez-Torres, C.; Majied, R.; Özcan, B.; van Hoek, M.; Leebeek, F.W.G.; Rijken, D.C.; Koenderink, G.H.; de Maat, M.P.M. Effects of diabetes mellitus on fibrin clot structure and mechanics in a model of acute neutrophil extracellular traps (NETs) formation. Int. J. Mol. Sci. 2020, 21, 7107. [Google Scholar] [CrossRef] [PubMed]
- Olorundare, O.E.; Peyruchaud, O.; Albrecht, R.M.; Mosher, D.F. Assembly of a fibronectin matrix by adherent platelets stimulated by lysophosphatidic acid and other agonists. Blood 2001, 98, 117–124. [Google Scholar] [CrossRef]
- Bennett, J.S. Structural Biology of Glycoprotein IIb-IIIa. Trends Cardiovasc. Med. 1996, 6, 31–36. [Google Scholar] [CrossRef]
- Baskurt, O.K.; Boynard, M.; Cokelet, G.C.; Connes, P.; Cooke, B.M.; Forconi, S.; Liao, F.; Hardeman, M.R.; Jung, F.; Meiselman, H.J.; et al. New guidelines for hemorheological laboratory techniques. Clin. Hemorheol. Microcirc. 2009, 42, 75–97. [Google Scholar] [CrossRef]
- Shin, S.; Hou, J.X.; Suh, J.S. Measurement of cell aggregation characteristics by analysis of laser-backscattering in a microfluidic rheometry. Korea Aust. Rheol. J. 2007, 19, 61–66. [Google Scholar]
- Shin, S.; Nam, J.H.; Hou, J.X.; Suh, J.S. A transient, microfluidic approach to the investigation of erythrocyte aggregation: The threshold shear-stress for erythrocyte disaggregation. Clin. Hemorheol. Microcirc. 2009, 42, 117–125. [Google Scholar] [CrossRef]
- Lee, K.; Priezzhev, A.; Shin, S.; Yaya, F.; Meglinsky, I. Characterization of shear stress preventing red blood cells aggregation at the individual cell level: The temperature dependence. Clin. Hemorheol. Microcirc. 2016, 64, 853–857. [Google Scholar] [CrossRef]
- Lee, K.; Kinnunen, M.; Khokhlova, M.D.; Lyubin, E.V.; Priezzhev, A.V.; Meglinski, I.; Fedyanin, A.A.; Meglinsky, I.; Fedyanin, A.A. Optical tweezers study of red blood cell aggregation and disaggregation in plasma and protein solutions. J. Biomed. Opt. 2016, 21. [Google Scholar] [CrossRef]
- Maklygin, A.Y.; Priezzhev, A.V.; Karmenian, A.; Nikitin, S.Y.; Obolenskii, I.S.; Lugovtsov, A.E. Measurement of interaction forces between red blood cells in aggregates by optical tweezers. Quantum Electron. 2012, 42, 500–504. [Google Scholar] [CrossRef]
- Dimitrova, M.N.; Matsumura, H.; Dimitrova, A.; Neitchev, V.Z. Interaction of albumins from different species with phospholipid liposomes. Multiple binding sites system. Int. J. Biol. Macromol. 2000, 27, 187–194. [Google Scholar] [CrossRef]
- Brown, E.A. The adsorption of serum albumin by human erythrocytes. J. Cell. Comp. Physiol. 1956, 47, 167–176. [Google Scholar] [CrossRef] [PubMed]
- Janzen, J.; Brooks, D.E. Do plasma proteins adsorb to red cells? Clin. Hemorheol. 1989, 9, 695–714. [Google Scholar] [CrossRef]
- Carvalho, F.A.; de Oliveira, S.; Freitas, T.; Gonçalves, S.; Santos, N.C. Variations on fibrinogen-erythrocyte interactions during cell aging. PLoS ONE 2011, 6, e18167. [Google Scholar] [CrossRef] [PubMed]
- Waugh, R.E.; Narla, M.; Jackson, C.W.; Mueller, T.J.; Suzuki, T.; Dale, G.L. Rheologic properties of senescent erythrocytes—Loss of surface-area and volume with red-blood-cell age. Blood 1992, 79, 1351–1358. [Google Scholar] [CrossRef]
- Lutz, H.U.; Stammler, P.; Fasler, S.; Ingold, M.; Fehr, J. Density separation of human red blood cells on self forming PercollR gradients: correlation with cell age. BBA Gen. Subj. 1992, 1116, 1–10. [Google Scholar] [CrossRef]
- Huang, Y.X.; Wu, Z.J.; Mehrishi, J.; Huang, B.T.; Chen, X.Y.; Zheng, X.J.; Liu, W.J.; Luo, M. Human red blood cell aging: Correlative changes in surface charge and cell properties. J. Cell. Mol. Med. 2011, 15, 2634–2642. [Google Scholar] [CrossRef]
- De Mel, A.; Cousins, B.G.; Seifalian, A.M. Surface modification of biomaterials: A quest for blood compatibility. Int. J. Biomater. 2012, 2012, 1–8. [Google Scholar] [CrossRef]
- Prihandana, G.S.; Sanada, I.; Ito, H.; Noborisaka, M.; Kanno, Y.; Suzuki, T.; Miki, N. Antithrombogenicity of fluorinated diamond-like carbon films coated nano porous polyethersulfone (PES) membrane. Materials 2013, 6, 4309–4323. [Google Scholar] [CrossRef]
- Ben-Ami, R.; Barshtein, G.; Mardi, T.; Deutch, V.; Elkayam, O.; Yedgar, S.; Berliner, S. A synergistic effect of albumin and fibrinogen on immunoglobulin-induced red blood cell aggregation. Am. J. Physiol. Heart Circ. Physiol. 2003, 285, H2663–H2669. [Google Scholar] [CrossRef]
- Chung, D.W.; Davie, E.W. γ and γ Chains of Human Fibrinogen Are Produced by Alternative mRNA Processing. Biochemistry 1984, 23, 4232–4236. [Google Scholar] [CrossRef] [PubMed]
- Guedes, A.F.; Carvalho, F.A.; Domingues, M.M.; Macrae, F.L.; McPherson, H.R.; Sabban, A.; Martins, I.C.; Duval, C.; Santos, N.C. Impact of γ’γ’ fibrinogen interaciton with red blood cells on fibrin clots. Nanomedicine 2018, 13, 2491–2505. [Google Scholar] [CrossRef] [PubMed]
- Telen, M.J. Red blood cell surface adhesion molecules: Their possible roles in normal human physiology and disease. Semin. Hematol. 2000, 37, 130–142. [Google Scholar] [CrossRef]
- Hermand, P.; Gane, P.; Huet, M.; Jallu, V.; Kaplan, C.; Sonneborn, H.H.; Cartron, J.P.; Bailly, P. Red cell ICAM-4 is a novel ligand for platelet-activated αIIbβ3 integrin. J. Biol. Chem. 2003, 278, 4892–4898. [Google Scholar] [CrossRef] [PubMed]
- Chaar, V.; Picot, J.; Renaud, O.; Bartolucci, P.; Nzouakou, R.; Bachir, D.; Galactéros, F.; Colin, Y.; le van Kim, C.; el Nemer, W. Aggregation of mononuclear and red blood cells through an α4β1-Lu/basal cell adhesion molecule interaction in sickle cell disease. Haematologica 2010, 95, 1841–1848. [Google Scholar] [CrossRef] [PubMed]
- Oldenborg, P.-A. Role of CD47 as a Marker of Self on Red Blood Cells. Science 2000, 288, 2051–2054. [Google Scholar] [CrossRef]
- Brittain, J.E.; Mlinar, K.J.; Anderson, C.S.; Orringer, E.P.; Parise, L.V. Integrin-associated protein is an adhesion receptor on sickle red blood cells for immobilized thrombospondin. Blood 2001, 97, 2159–2164. [Google Scholar] [CrossRef]
- Crosnier, C.; Bustamante, L.Y.; Bartholdson, S.J.; Bei, A.K.; Theron, M.; Uchikawa, M.; Mboup, S.; Ndir, O.; Kwiatkowski, D.P.; Duraisingh, M.T.; et al. Basigin is a receptor essential for erythrocyte invasion by Plasmodium falciparum. Nature 2011, 480, 534–537. [Google Scholar] [CrossRef]
- Ulrich, H.; Pillat, M.M. CD147 as a Target for COVID-19 Treatment: Suggested Effects of Azithromycin and Stem Cell Engagement. Stem Cell Rev. Rep. 2020, 16, 434–440. [Google Scholar] [CrossRef]
- Kucukal, E.; Man, Y.; Quinn, E.; Tewari, N.; An, R.; Ilich, A.; Key, N.S.; Little, J.A.; Gurkan, U.A. Red blood cell adhesion to ICAM-1 is mediated by fibrinogen and is associated with right-to-left shunts in sickle cell disease. Blood Adv. 2020, 4, 3688–3698. [Google Scholar] [CrossRef]
- Ihanus, E.; Uotila, L.M.; Toivanen, A.; Varis, M.; Gahmberg, C.G. Red-cell ICAM-4 is a ligand for the monocyte/macrophage integrin CD11c/CD18: Characterization of the binding sites on ICAM-4. Blood 2007, 109, 802–810. [Google Scholar] [CrossRef]
- Bratosin, D.; Mazurier, J.; Tissier, J.P.; Estaquier, J.; Huart, J.J.; Ameisen, J.C.; Aminoff, D.; Montreuil, J. Cellular and molecular mechanisms of senescent erythrocyte phagocytosis by macrophages. A review. Biochimie 1998, 80, 173–195. [Google Scholar] [CrossRef]
- Burger, P.; de Korte, D.; van den Berg, T.K.; van Bruggen, R. CD47 in erythrocyte ageing and clearance-the Dutch point of view. Transfus. Med. Hemother. 2012, 39, 348–352. [Google Scholar] [CrossRef] [PubMed]
- Azouzi, S.; Romana, M.; Arashiki, N.; Takakuwa, Y.; el Nemer, W.; Peyrard, T.; Colin, Y.; Amireault, P.; le van Kim, C. Band 3 phosphorylation induces irreversible alterations of stored red blood cells. Am. J. Hematol. 2018, 93, E110–E112. [Google Scholar] [CrossRef] [PubMed]
- Sheremet’ev, Y.A.; Popovicheva, A.N.; Rogozin, M.M.; Levin, G.Y. Red blood cell aggregation, disaggregation and aggregate morphology in autologous plasma and serum in diabetic foot disease. Clin. Hemorheol. Microcirc. 2019, 72, 221–227. [Google Scholar] [CrossRef] [PubMed]
- Armstrong, J.K.; Wenby, R.B.; Meiselman, H.J.; Fisher, T.C. The hydrodynamic radii of macromolecules and their effect on red blood cell aggregation. Biophys. J. 2004, 87, 4259–4270. [Google Scholar] [CrossRef] [PubMed]
- Flormann, D.; Kuder, E.; Lipp, P.; Wagner, C.; Kaestner, L. Is there a role of C-reactive protein in red blood cell aggregation? Int. J. Lab. Hematol. 2015, 37, 474–482. [Google Scholar] [CrossRef]
- Chien, S.; Jan, K.M. Red cell aggregation by macromolecules: roles of surface adsorption and electrostatic repulsion. J. Supramol. Struct. 1973, 1, 385–409. [Google Scholar] [CrossRef]
- Neu, B.; Wenby, R.; Meiselman, H.J. Effects of dextran molecular weight on red blood cell aggregation. Biophys. J. 2008, 95, 3059–3065. [Google Scholar] [CrossRef]
- Sakai, H.; Sato, A.; Takeoka, S.; Tsuchida, E. Mechanism of flocculate formation of highly concentrated phospholipid vesicles suspended in a series of water-soluble biopolymers. Biomacromolecules 2009, 10, 2344–2350. [Google Scholar] [CrossRef]
- Connes, P.; Simmonds, M.J.; Brun, J.F.; Baskurt, O.K. Exercise hemorheology: Classical data, recent findings and unresolved issues. Clin. Hemorheol. Microcirc. 2013, 53, 187–199. [Google Scholar] [CrossRef] [PubMed]
- Guedes, A.F.; Moreira, C.; Nogueira, J.B.; Santos, N.C.; Carvalho, F.A. Fibrinogen-erythrocyte binding and hemorheology measurements in the assessment of essential arterial hypertension patients. Nanoscale 2019, 11, 2757–2766. [Google Scholar] [CrossRef] [PubMed]
- Gafarova, M.E.; Rykova, S.Y.; Khokhlova, M.D.; Lubin, E. V Red blood cell (dis)aggregation: Effect of inhibition of fibrinogen binding. Ser. Biomech. 2012, 27, 69–73. [Google Scholar]


Publisher’s Note: MDPI stays neutral with regard to jurisdictional claims in published maps and institutional affiliations. |
© 2020 by the authors. Licensee MDPI, Basel, Switzerland. This article is an open access article distributed under the terms and conditions of the Creative Commons Attribution (CC BY) license (http://creativecommons.org/licenses/by/4.0/).
Share and Cite
Semenov, A.N.; Lugovtsov, A.E.; Shirshin, E.A.; Yakimov, B.P.; Ermolinskiy, P.B.; Bikmulina, P.Y.; Kudryavtsev, D.S.; Timashev, P.S.; Muravyov, A.V.; Wagner, C.; et al. Assessment of Fibrinogen Macromolecules Interaction with Red Blood Cells Membrane by Means of Laser Aggregometry, Flow Cytometry, and Optical Tweezers Combined with Microfluidics. Biomolecules 2020, 10, 1448. https://doi.org/10.3390/biom10101448
Semenov AN, Lugovtsov AE, Shirshin EA, Yakimov BP, Ermolinskiy PB, Bikmulina PY, Kudryavtsev DS, Timashev PS, Muravyov AV, Wagner C, et al. Assessment of Fibrinogen Macromolecules Interaction with Red Blood Cells Membrane by Means of Laser Aggregometry, Flow Cytometry, and Optical Tweezers Combined with Microfluidics. Biomolecules. 2020; 10(10):1448. https://doi.org/10.3390/biom10101448
Chicago/Turabian StyleSemenov, Alexey N., Andrei E. Lugovtsov, Evgeny A. Shirshin, Boris P. Yakimov, Petr B. Ermolinskiy, Polina Y. Bikmulina, Denis S. Kudryavtsev, Peter S. Timashev, Alexei V. Muravyov, Christian Wagner, and et al. 2020. "Assessment of Fibrinogen Macromolecules Interaction with Red Blood Cells Membrane by Means of Laser Aggregometry, Flow Cytometry, and Optical Tweezers Combined with Microfluidics" Biomolecules 10, no. 10: 1448. https://doi.org/10.3390/biom10101448
APA StyleSemenov, A. N., Lugovtsov, A. E., Shirshin, E. A., Yakimov, B. P., Ermolinskiy, P. B., Bikmulina, P. Y., Kudryavtsev, D. S., Timashev, P. S., Muravyov, A. V., Wagner, C., Shin, S., & Priezzhev, A. V. (2020). Assessment of Fibrinogen Macromolecules Interaction with Red Blood Cells Membrane by Means of Laser Aggregometry, Flow Cytometry, and Optical Tweezers Combined with Microfluidics. Biomolecules, 10(10), 1448. https://doi.org/10.3390/biom10101448