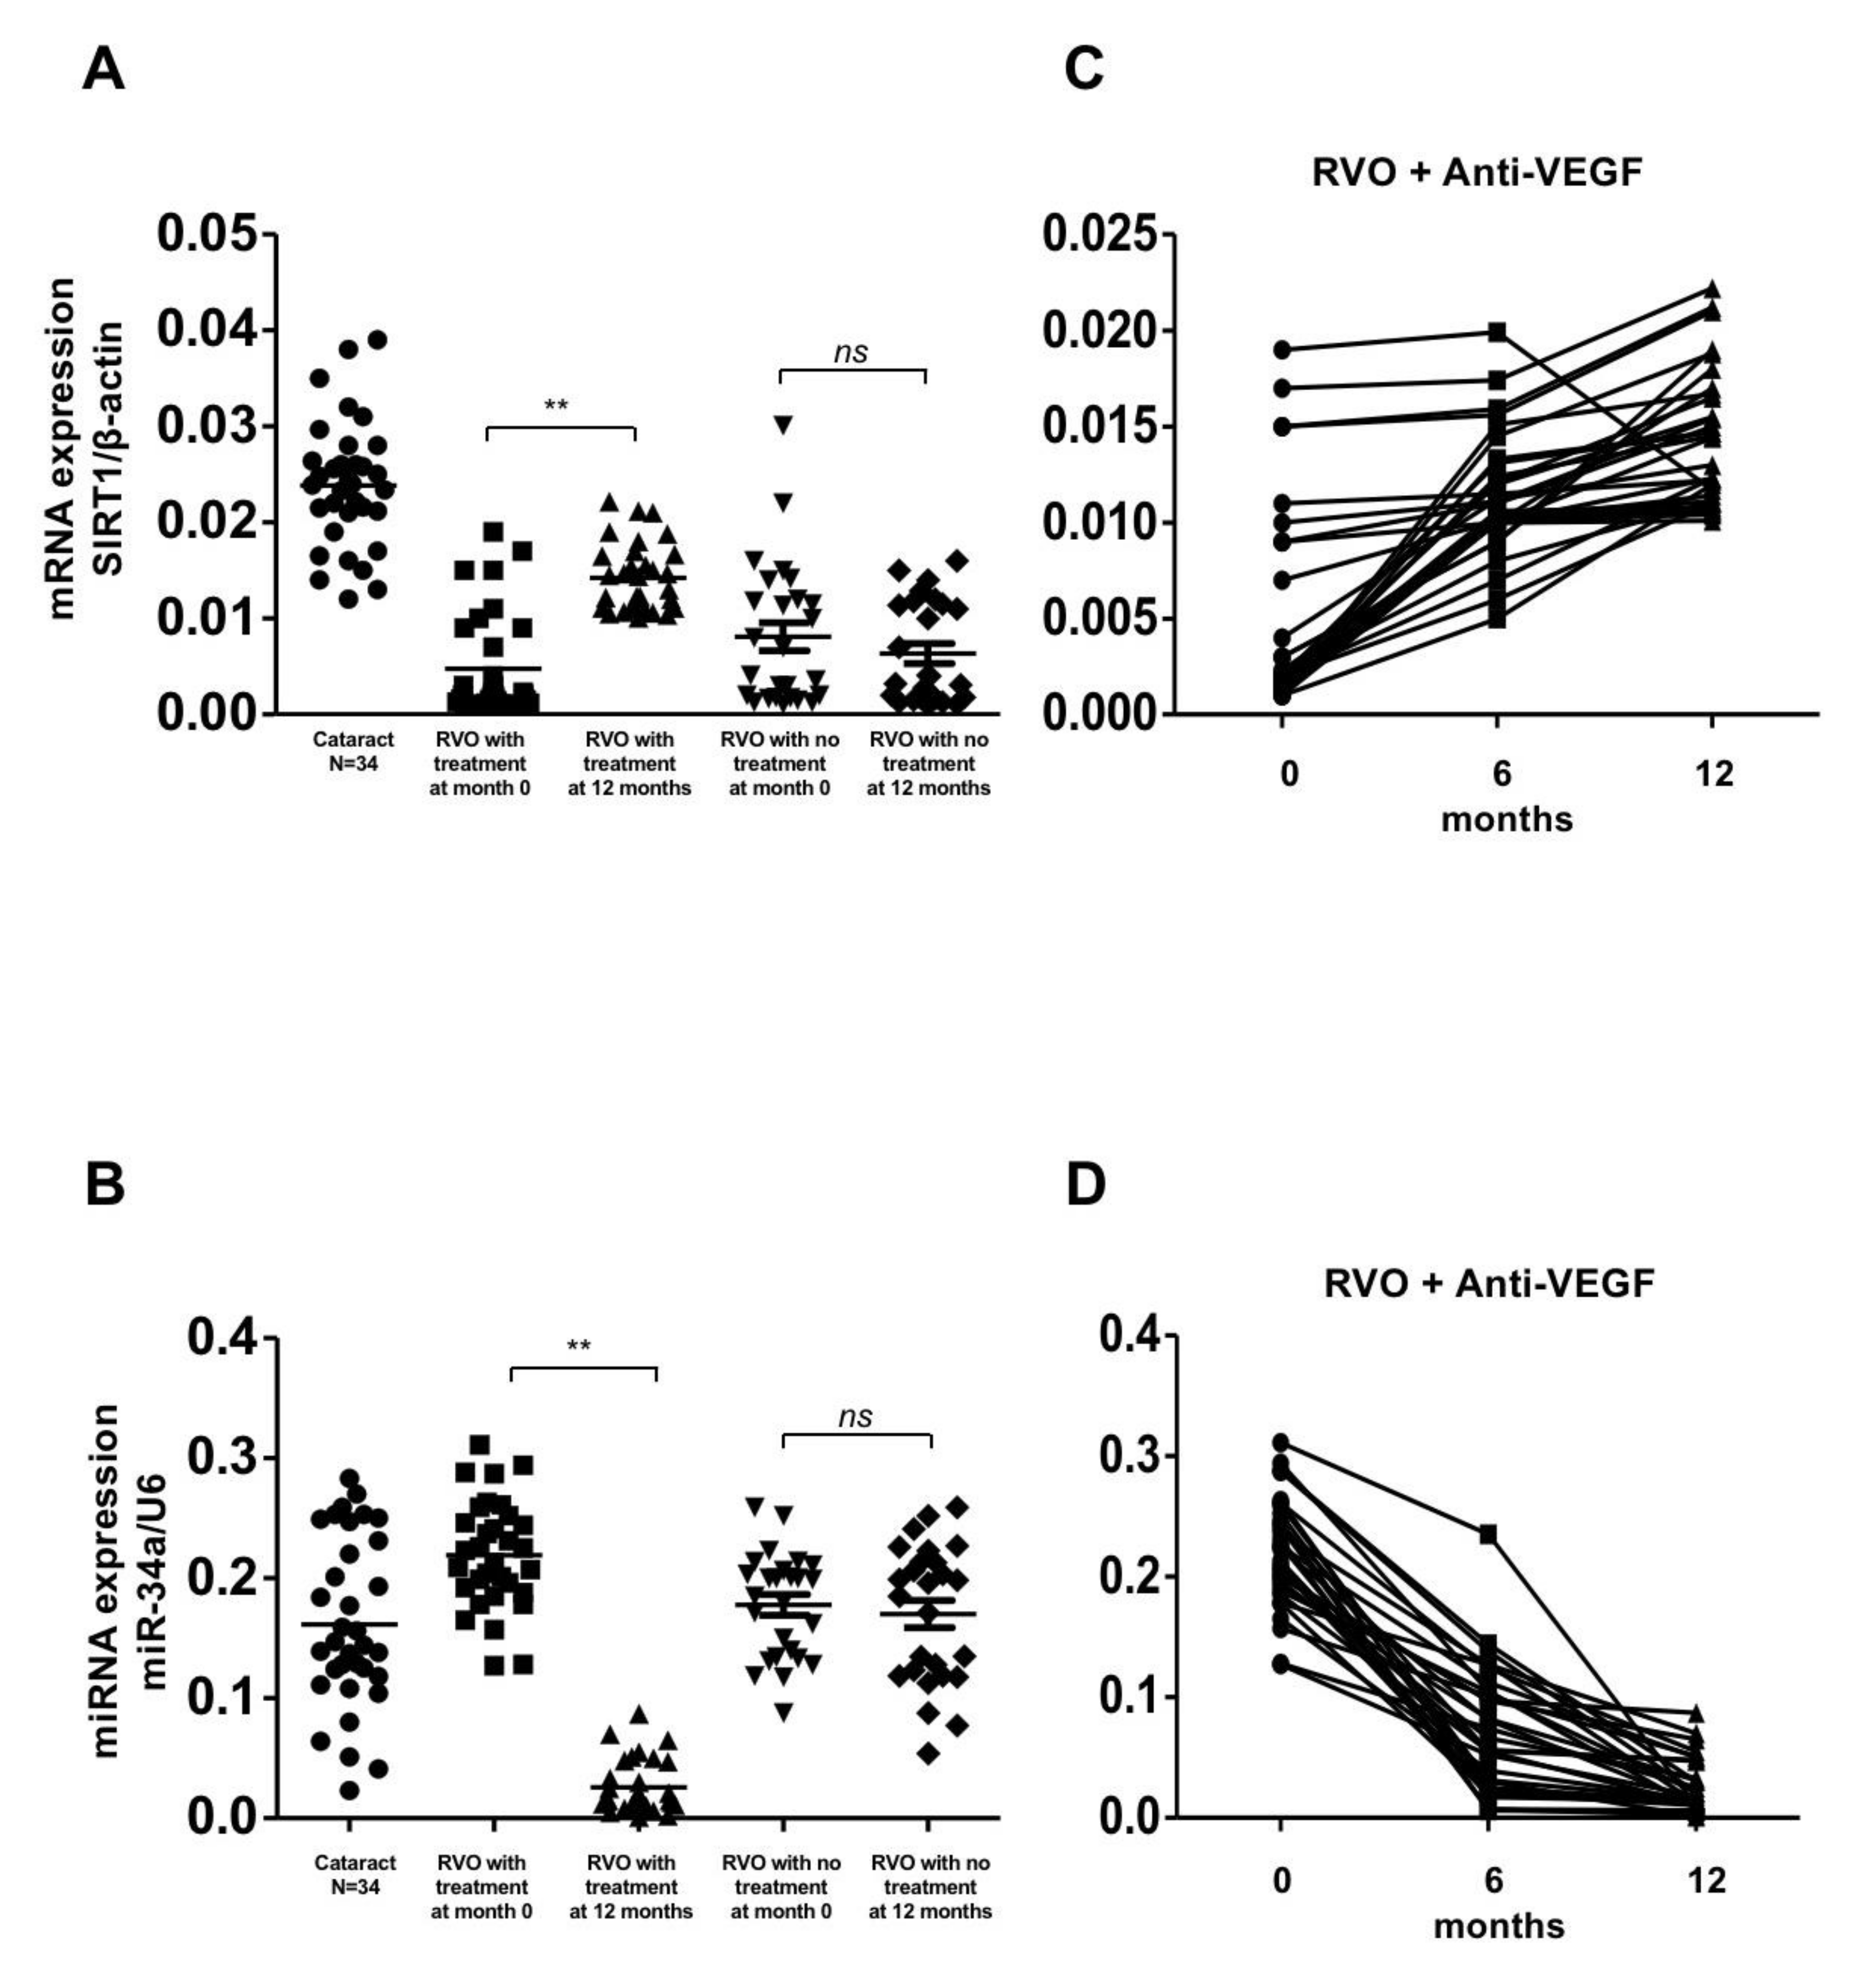
Figure 1.
Gene expression of SIRT1 and miR-34a in patients with retinal vein occlusion (RVOs) under anti-vascular endothelial growth factor(aVEGF) therapy, without therapy, and controls. (A) Gene expression of SIRT1 were lower in patients with RVOs than controls at baseline (0.005 ± 0.005, 0.008 ± 0.007, and 0.024 ± 0.007, respectively, p < 0.05). One year later, the expression increased in patients who received aVEGF therapy (0.014 ± 0.004, ** p < 0.01) but remained in patients without therapy (0.006 ± 0.005, ns: difference was not significant). (B) Gene expressions of miR-34a were higher in patients with RVOs than controls at baseline (0.219 ± 0.045, 0.178 ± 0.044, and 0.162 ± 0.071, respectively, p < 0.05). One year later, the expression decreased in patients who received aVEGF therapy (0.026 ± 0.022, ** p < 0.01) but remained in patients without therapy (0.170 ± 0.058, ns: difference was not significant). (C) There was a gradually increasing trend of SIRT1 gene expression in RVO patients who received aVEGF therapy 6 months and 12 months after intervention. (D) There was a gradually decreasing trend of miR-34a gene expression in RVO patients who received aVEGF therapy 6 months and 12 months after intervention.
![Biomolecules 10 01414 g001]()
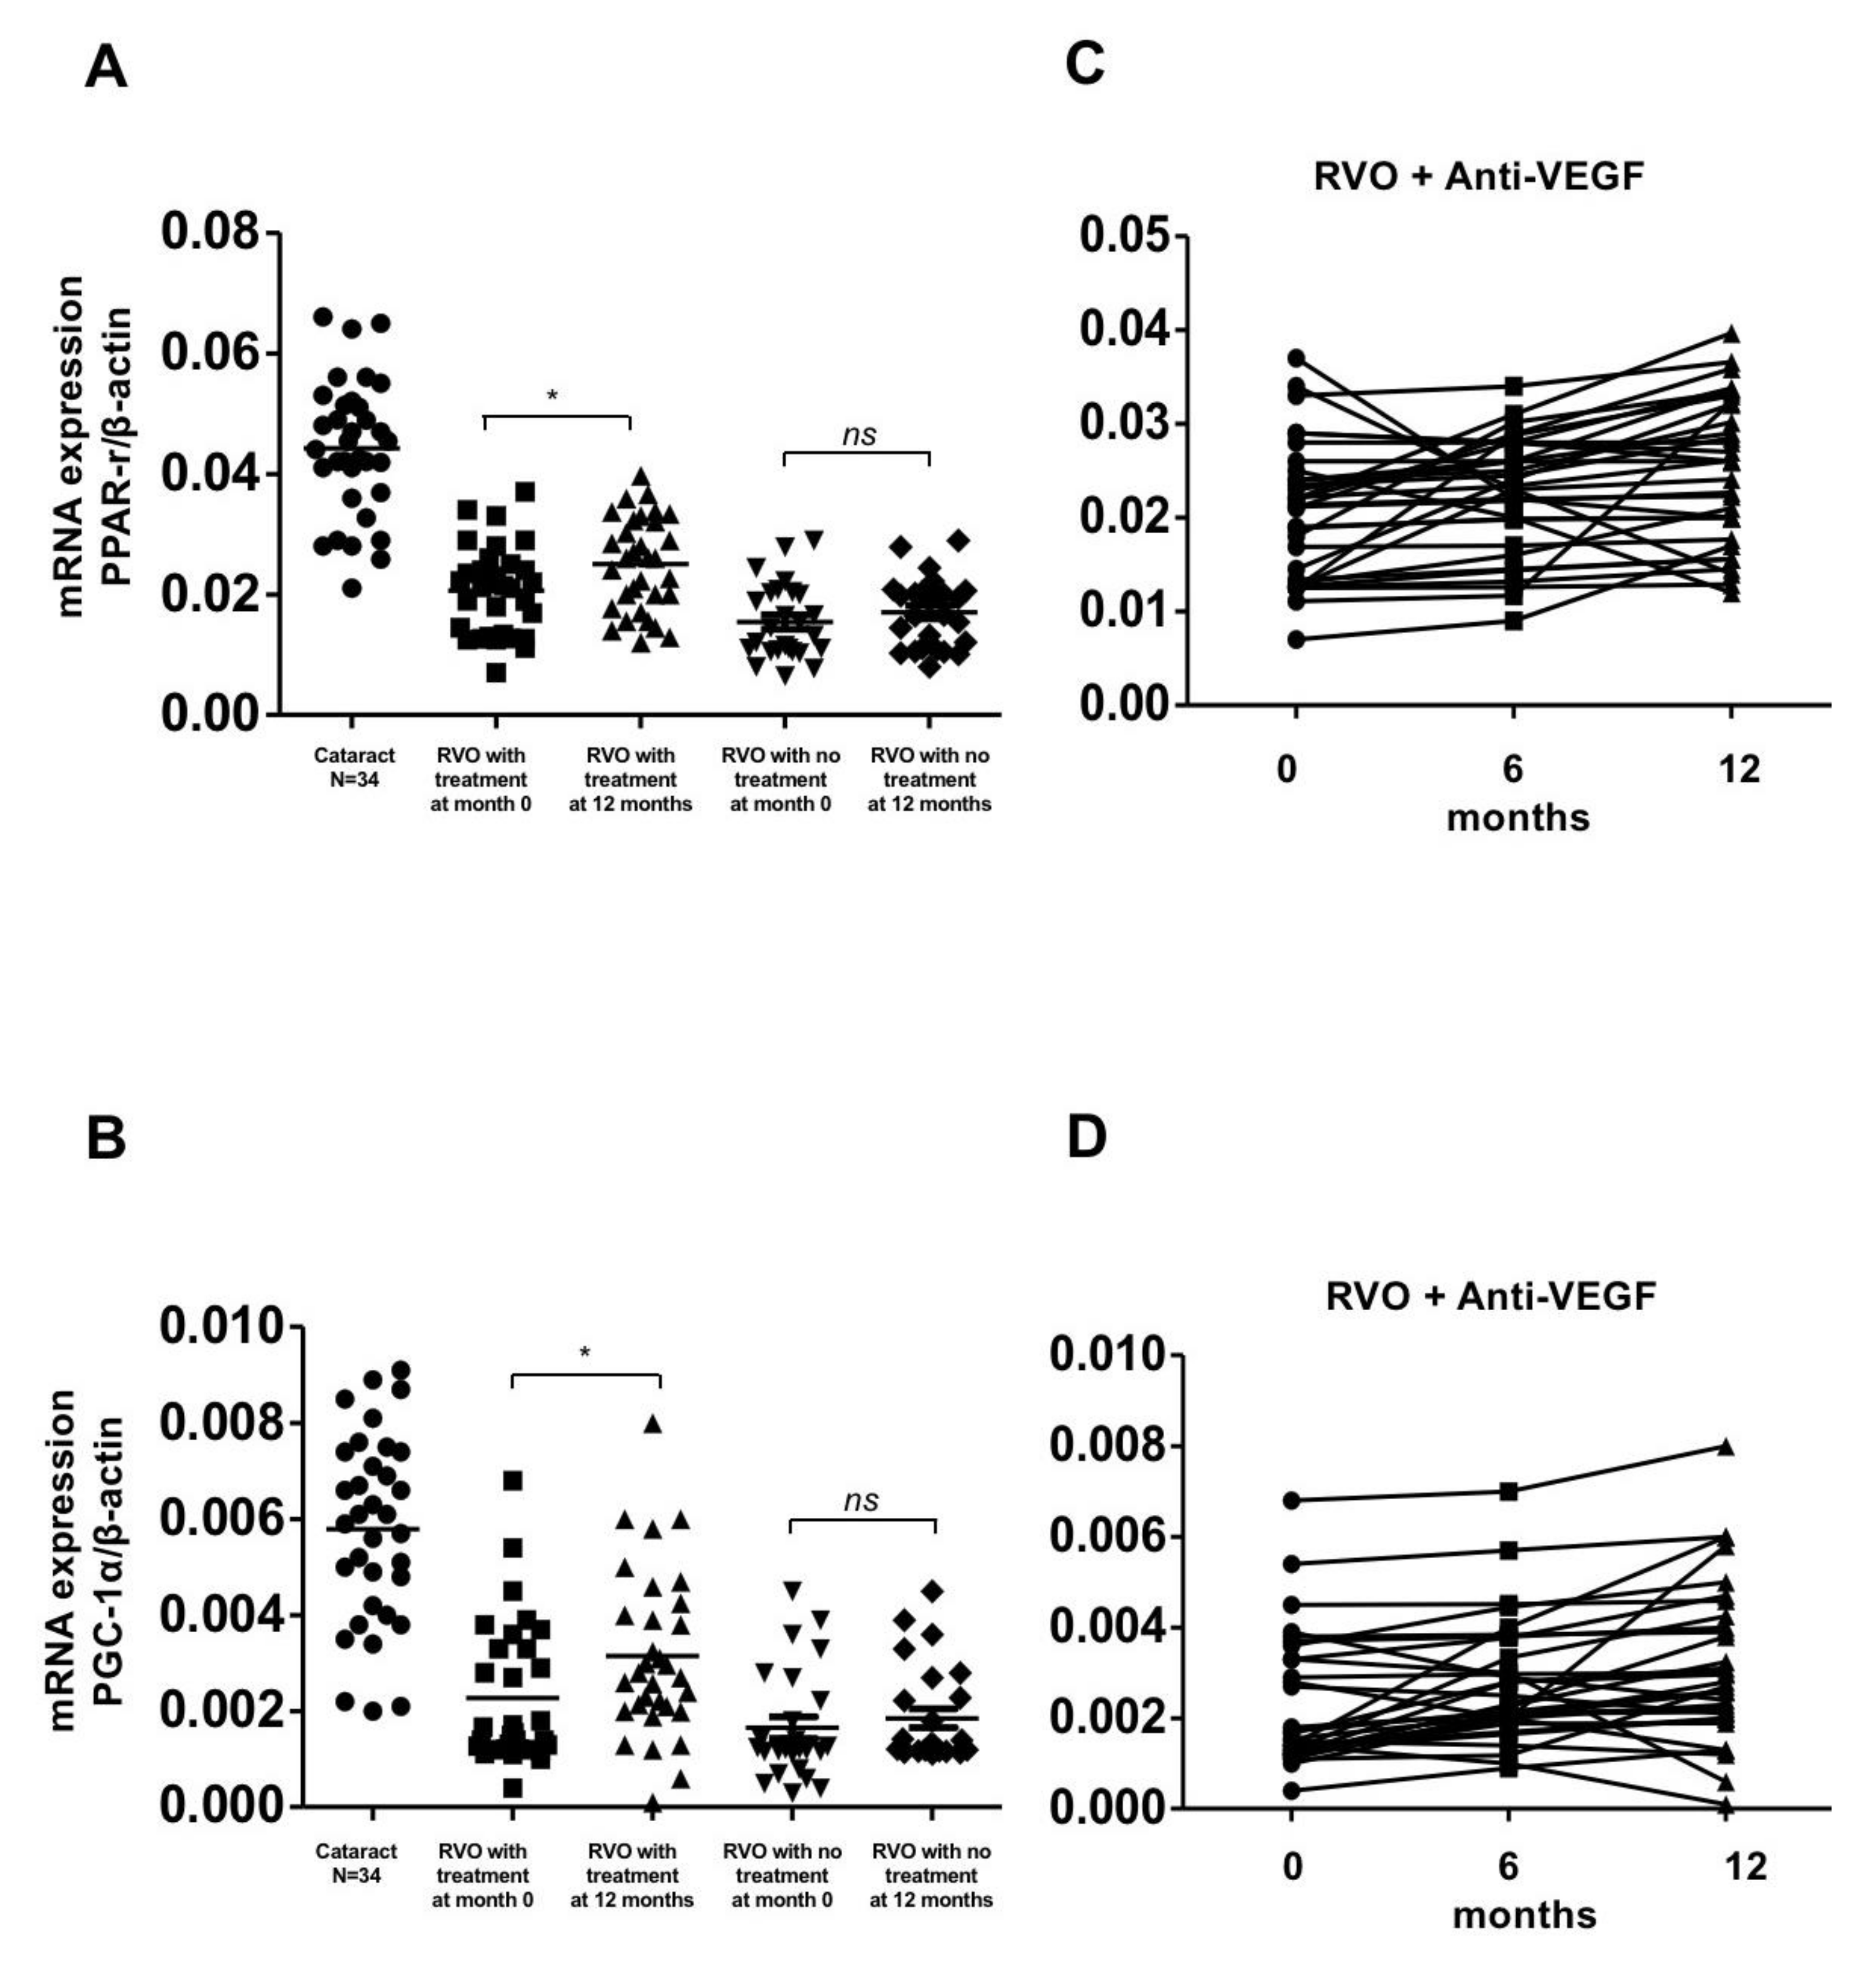
Figure 2.
Gene expression of PPAR-r and PGC-1α in patients with retinal vein occlusion (RVOs) under anti-vascular endothelial growth factor (aVEGF) therapy, without therapy, and controls. (A) Gene expression of PPAR-r were lower in patients with RVOs than controls at baseline (0.020 ± 0.007, 0.015 ± 0.006, and 0.044 ± 0.011, respectively, * p < 0.05). One year later, the expression increased in patients who received aVEGF therapy (0.025 ± 0.008, * p < 0.05) but remained in patients without therapy (0.017 ± 0.006, ns: difference was not significant). (B) Gene expression of PGC-1α were lower in patients with RVOs than controls at baseline (0.002 ± 0.001, 0.002 ± 0.001, and 0.006 ± 0.002, respectively, * p < 0.05). One year later, the expression increased in patients who received aVEGF therapy (0.003 ± 0.002, * p < 0.05) but remained in patients without therapy (0.002 ± 0.001, ns: difference was not significant). (C) There was a gradually increasing trend of PPAR-r gene expression in RVO patients who received aVEGF therapy 6 months and 12 months after intervention. (D) There was a gradually increasing trend of PGC-1α gene expression in RVO patients who received aVEGF therapy 6 months and 12 months after intervention.
![Biomolecules 10 01414 g002]()
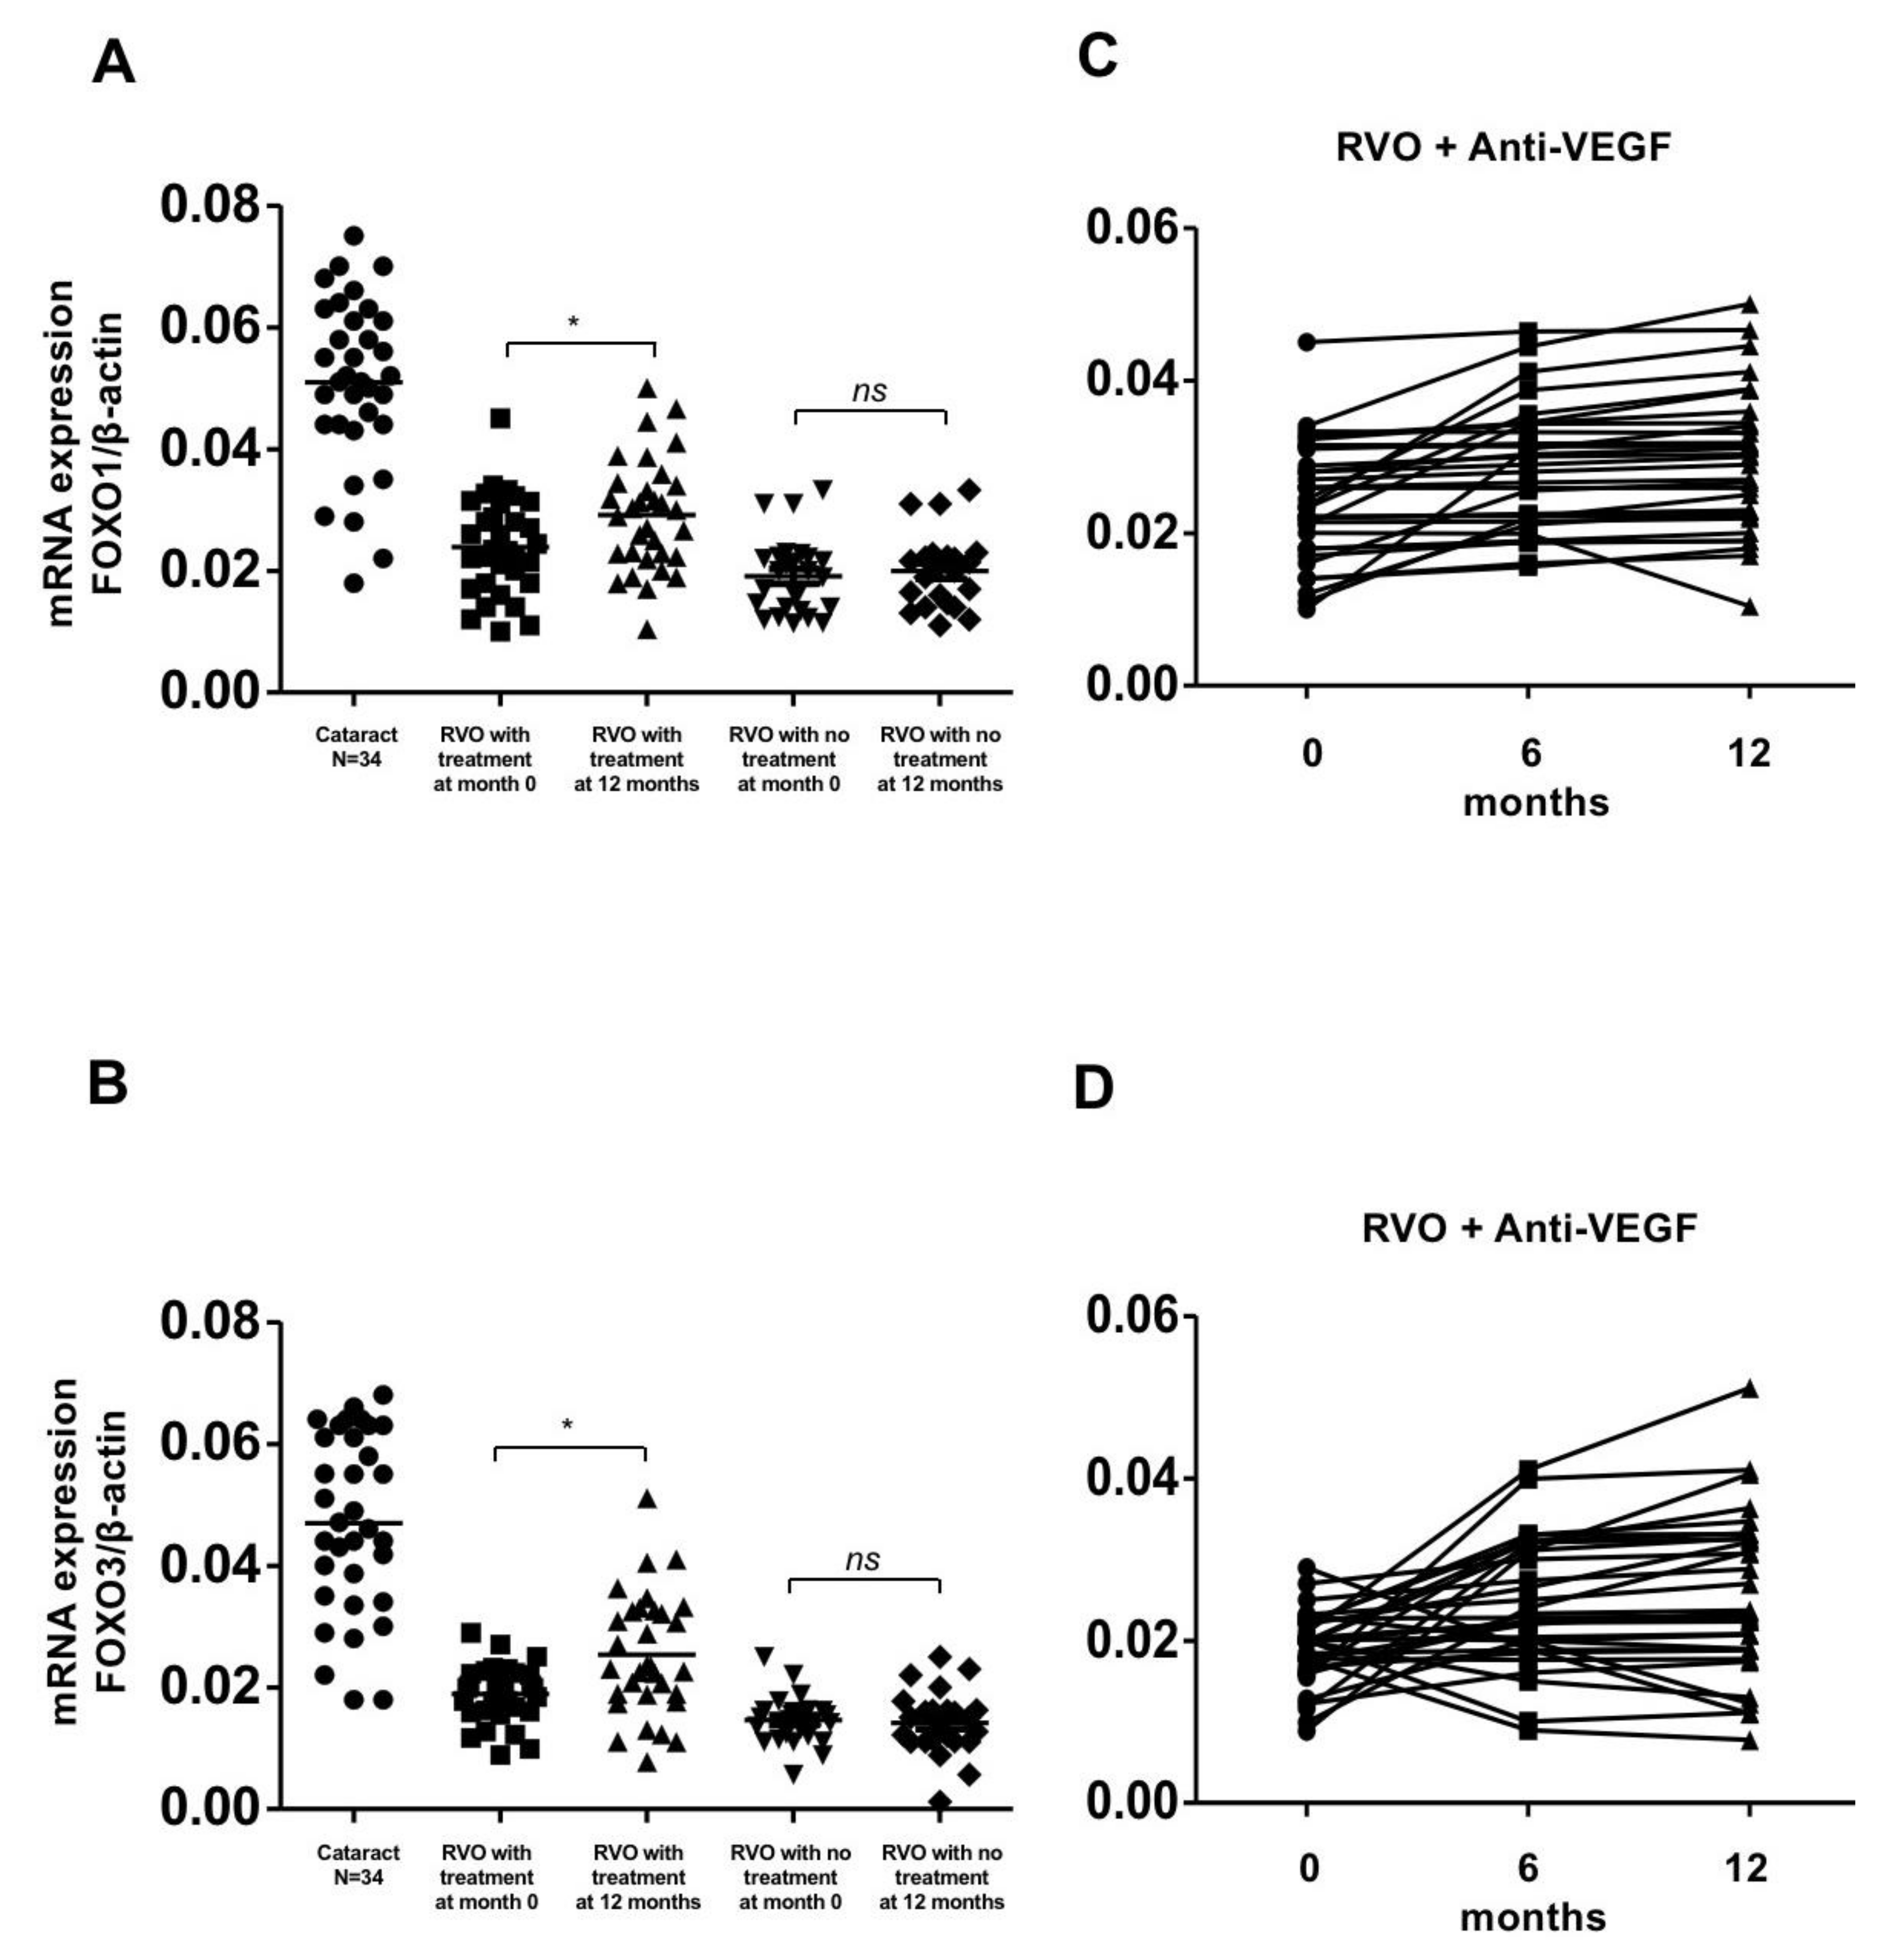
Figure 3.
Gene expression of FOXO-1 and FOXO-3 in patients with retinal vein occlusion (RVOs) under anti-vascular endothelial growth factor (aVEGF) therapy, without therapy, and controls. (A) Gene expression of FOXO-1 were lower in patients with RVOs than controls at baseline (0.024 ± 0.008, 0.002 ± 0.006 and 0.051 ± 0.014, respectively, * p < 0.05). One year later, the expression increased in patients who received aVEGF therapy (0.029 ± 0.009, * p < 0.05) but remained in patients without therapy (0.020 ± 0.006, ns: difference was not significant). (B) Gene expression of FOXO-3 were lower in patients with RVOs than controls at baseline (0.020 ± 0.005, 0.015 ± 0.004, and 0.047 ± 0.015, respectively, * p < 0.05). One year later, the expression increased in patients who received aVEGF therapy (0.025 ± 0.010, * p < 0.05) but remained in patients without therapy (0.014 ± 0.005, ns: difference was not significant). (C) There was a gradually increasing trend of FOXO-1 gene expression in RVO patients who received aVEGF therapy 6 months and 12 months after intervention. (D) There was a gradually increasing trend of FOXO-3 gene expression in RVO patients who received aVEGF therapy 6 months and 12 months after intervention.
![Biomolecules 10 01414 g003]()
Figure 4.
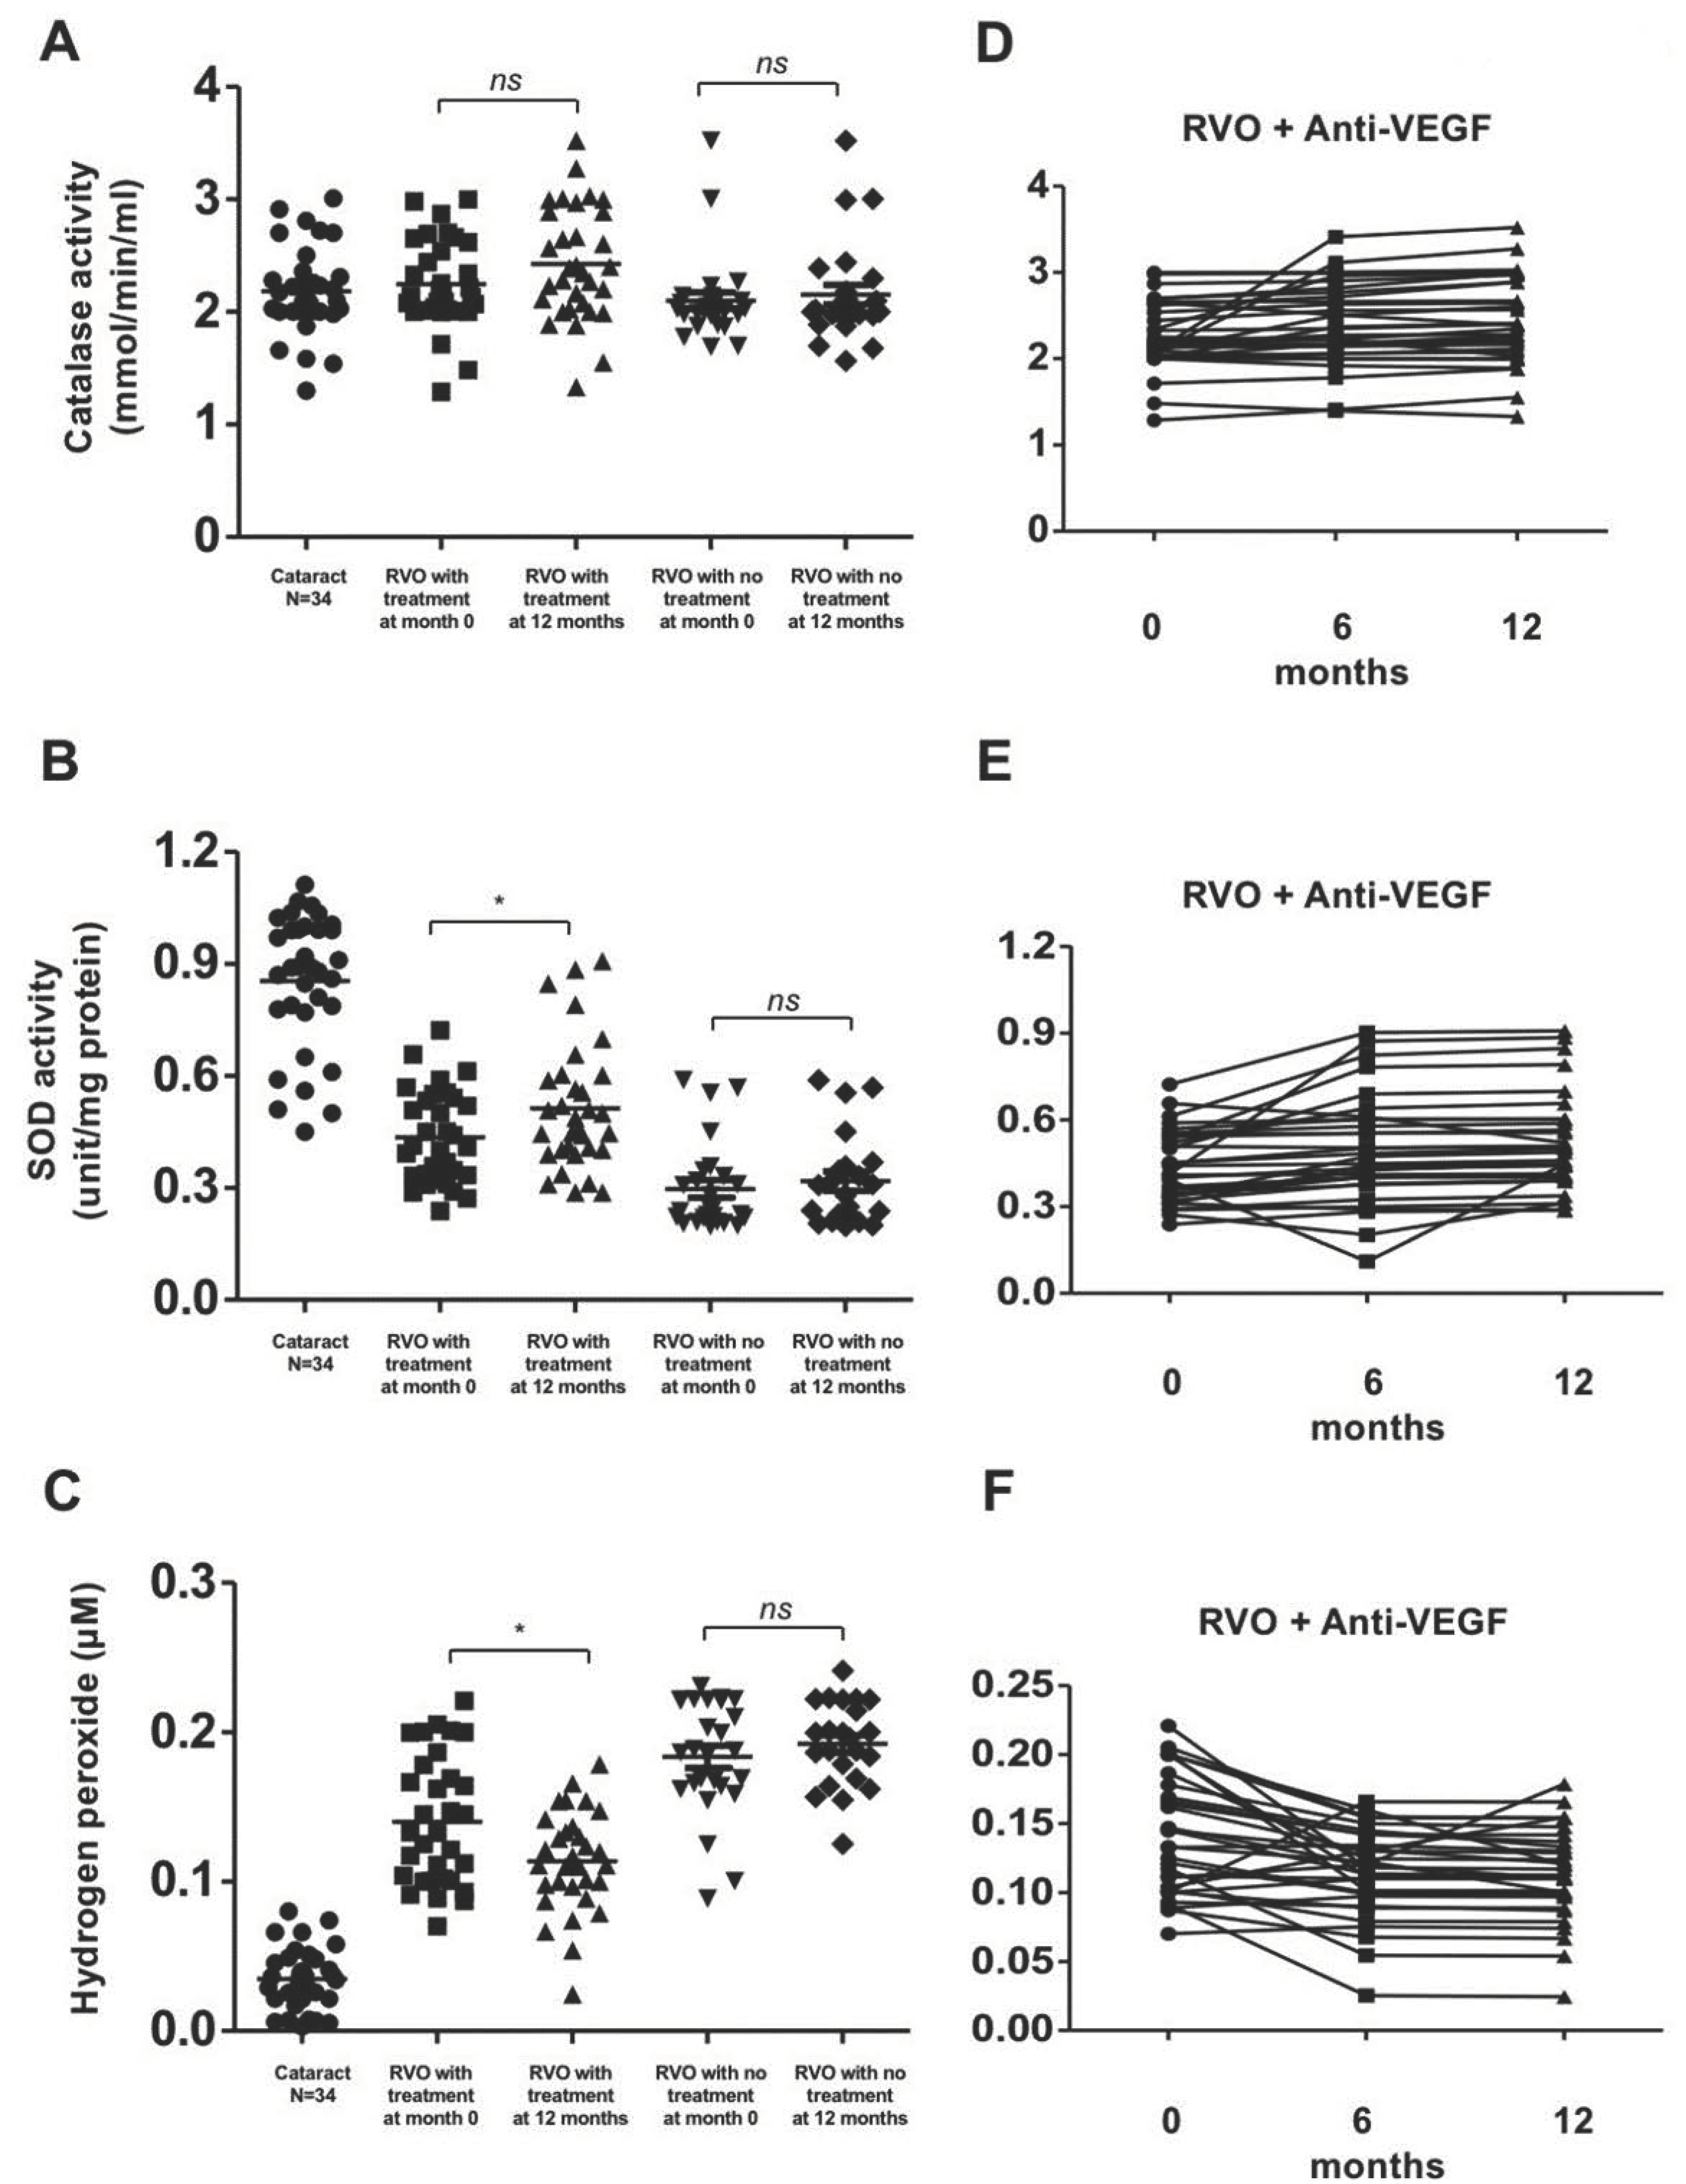
Antioxidant enzyme activity and ROS concentrations in patients with retinal vein occlusion (RVOs) under anti-vascular endothelial growth factor (aVEGF) therapy, without therapy, and controls. (A) There was no difference in activity of serum catalase among the treatment, observation, and control group (2.240 ± 0.390, 2.100 ± 0.378, and 2.183 ± 0.387 mmol/min/mL, respectively, ns: difference was not significant) at baseline. One year later, the activity of serum catalase remained unchanged in patients who received aVEGF therapy or not (2.430 ± 0.503 and 2.152 ± 0.441 mmol/min/mL, ns: differences were all nonsignificant). (B) The activities of SOD were lower in patients with RVOs than controls at baseline (0.435 ± 0.124, 0.297 ± 0.118, and 0.854 ± 0.181 unit/mg, respectively, * p < 0.05). One year later, the activity increased in patients who received aVEGF therapy (0.512 ± 0.168, * p < 0.05) but remained in patients without therapy (0.318 ± 0.123, ns: difference was not significant). (C) The concentrations of hydrogen peroxide were significantly higher in patients with RVOs than controls at baseline (0.140 ± 0.043, 0.184 ± 0.038, and 0.035 ± 0.020 uM, respectively, * p < 0.05). One year later, the concentration decreased in patients who received aVEGF therapy (0.114 ± 0.033uM, * p < 0.05) but remained in patients without therapy (0.198 ± 0.028 uM, ns: difference was not significant). (D) The activity of serum catalase remained unchanged in RVO patients who received aVEGF therapy 6 months and 12 months after intervention. (E) There was a gradually increasing trend of SOD activity in RVO patients who received aVEGF therapy 6 months and 12 months after intervention. (F) There was a gradually decreasing trend of hydrogen peroxide concentration in RVO patients who received aVEGF therapy 6 months and 12 months after intervention.
Figure 4.
Antioxidant enzyme activity and ROS concentrations in patients with retinal vein occlusion (RVOs) under anti-vascular endothelial growth factor (aVEGF) therapy, without therapy, and controls. (A) There was no difference in activity of serum catalase among the treatment, observation, and control group (2.240 ± 0.390, 2.100 ± 0.378, and 2.183 ± 0.387 mmol/min/mL, respectively, ns: difference was not significant) at baseline. One year later, the activity of serum catalase remained unchanged in patients who received aVEGF therapy or not (2.430 ± 0.503 and 2.152 ± 0.441 mmol/min/mL, ns: differences were all nonsignificant). (B) The activities of SOD were lower in patients with RVOs than controls at baseline (0.435 ± 0.124, 0.297 ± 0.118, and 0.854 ± 0.181 unit/mg, respectively, * p < 0.05). One year later, the activity increased in patients who received aVEGF therapy (0.512 ± 0.168, * p < 0.05) but remained in patients without therapy (0.318 ± 0.123, ns: difference was not significant). (C) The concentrations of hydrogen peroxide were significantly higher in patients with RVOs than controls at baseline (0.140 ± 0.043, 0.184 ± 0.038, and 0.035 ± 0.020 uM, respectively, * p < 0.05). One year later, the concentration decreased in patients who received aVEGF therapy (0.114 ± 0.033uM, * p < 0.05) but remained in patients without therapy (0.198 ± 0.028 uM, ns: difference was not significant). (D) The activity of serum catalase remained unchanged in RVO patients who received aVEGF therapy 6 months and 12 months after intervention. (E) There was a gradually increasing trend of SOD activity in RVO patients who received aVEGF therapy 6 months and 12 months after intervention. (F) There was a gradually decreasing trend of hydrogen peroxide concentration in RVO patients who received aVEGF therapy 6 months and 12 months after intervention.
![Biomolecules 10 01414 g004]()
Figure 5.
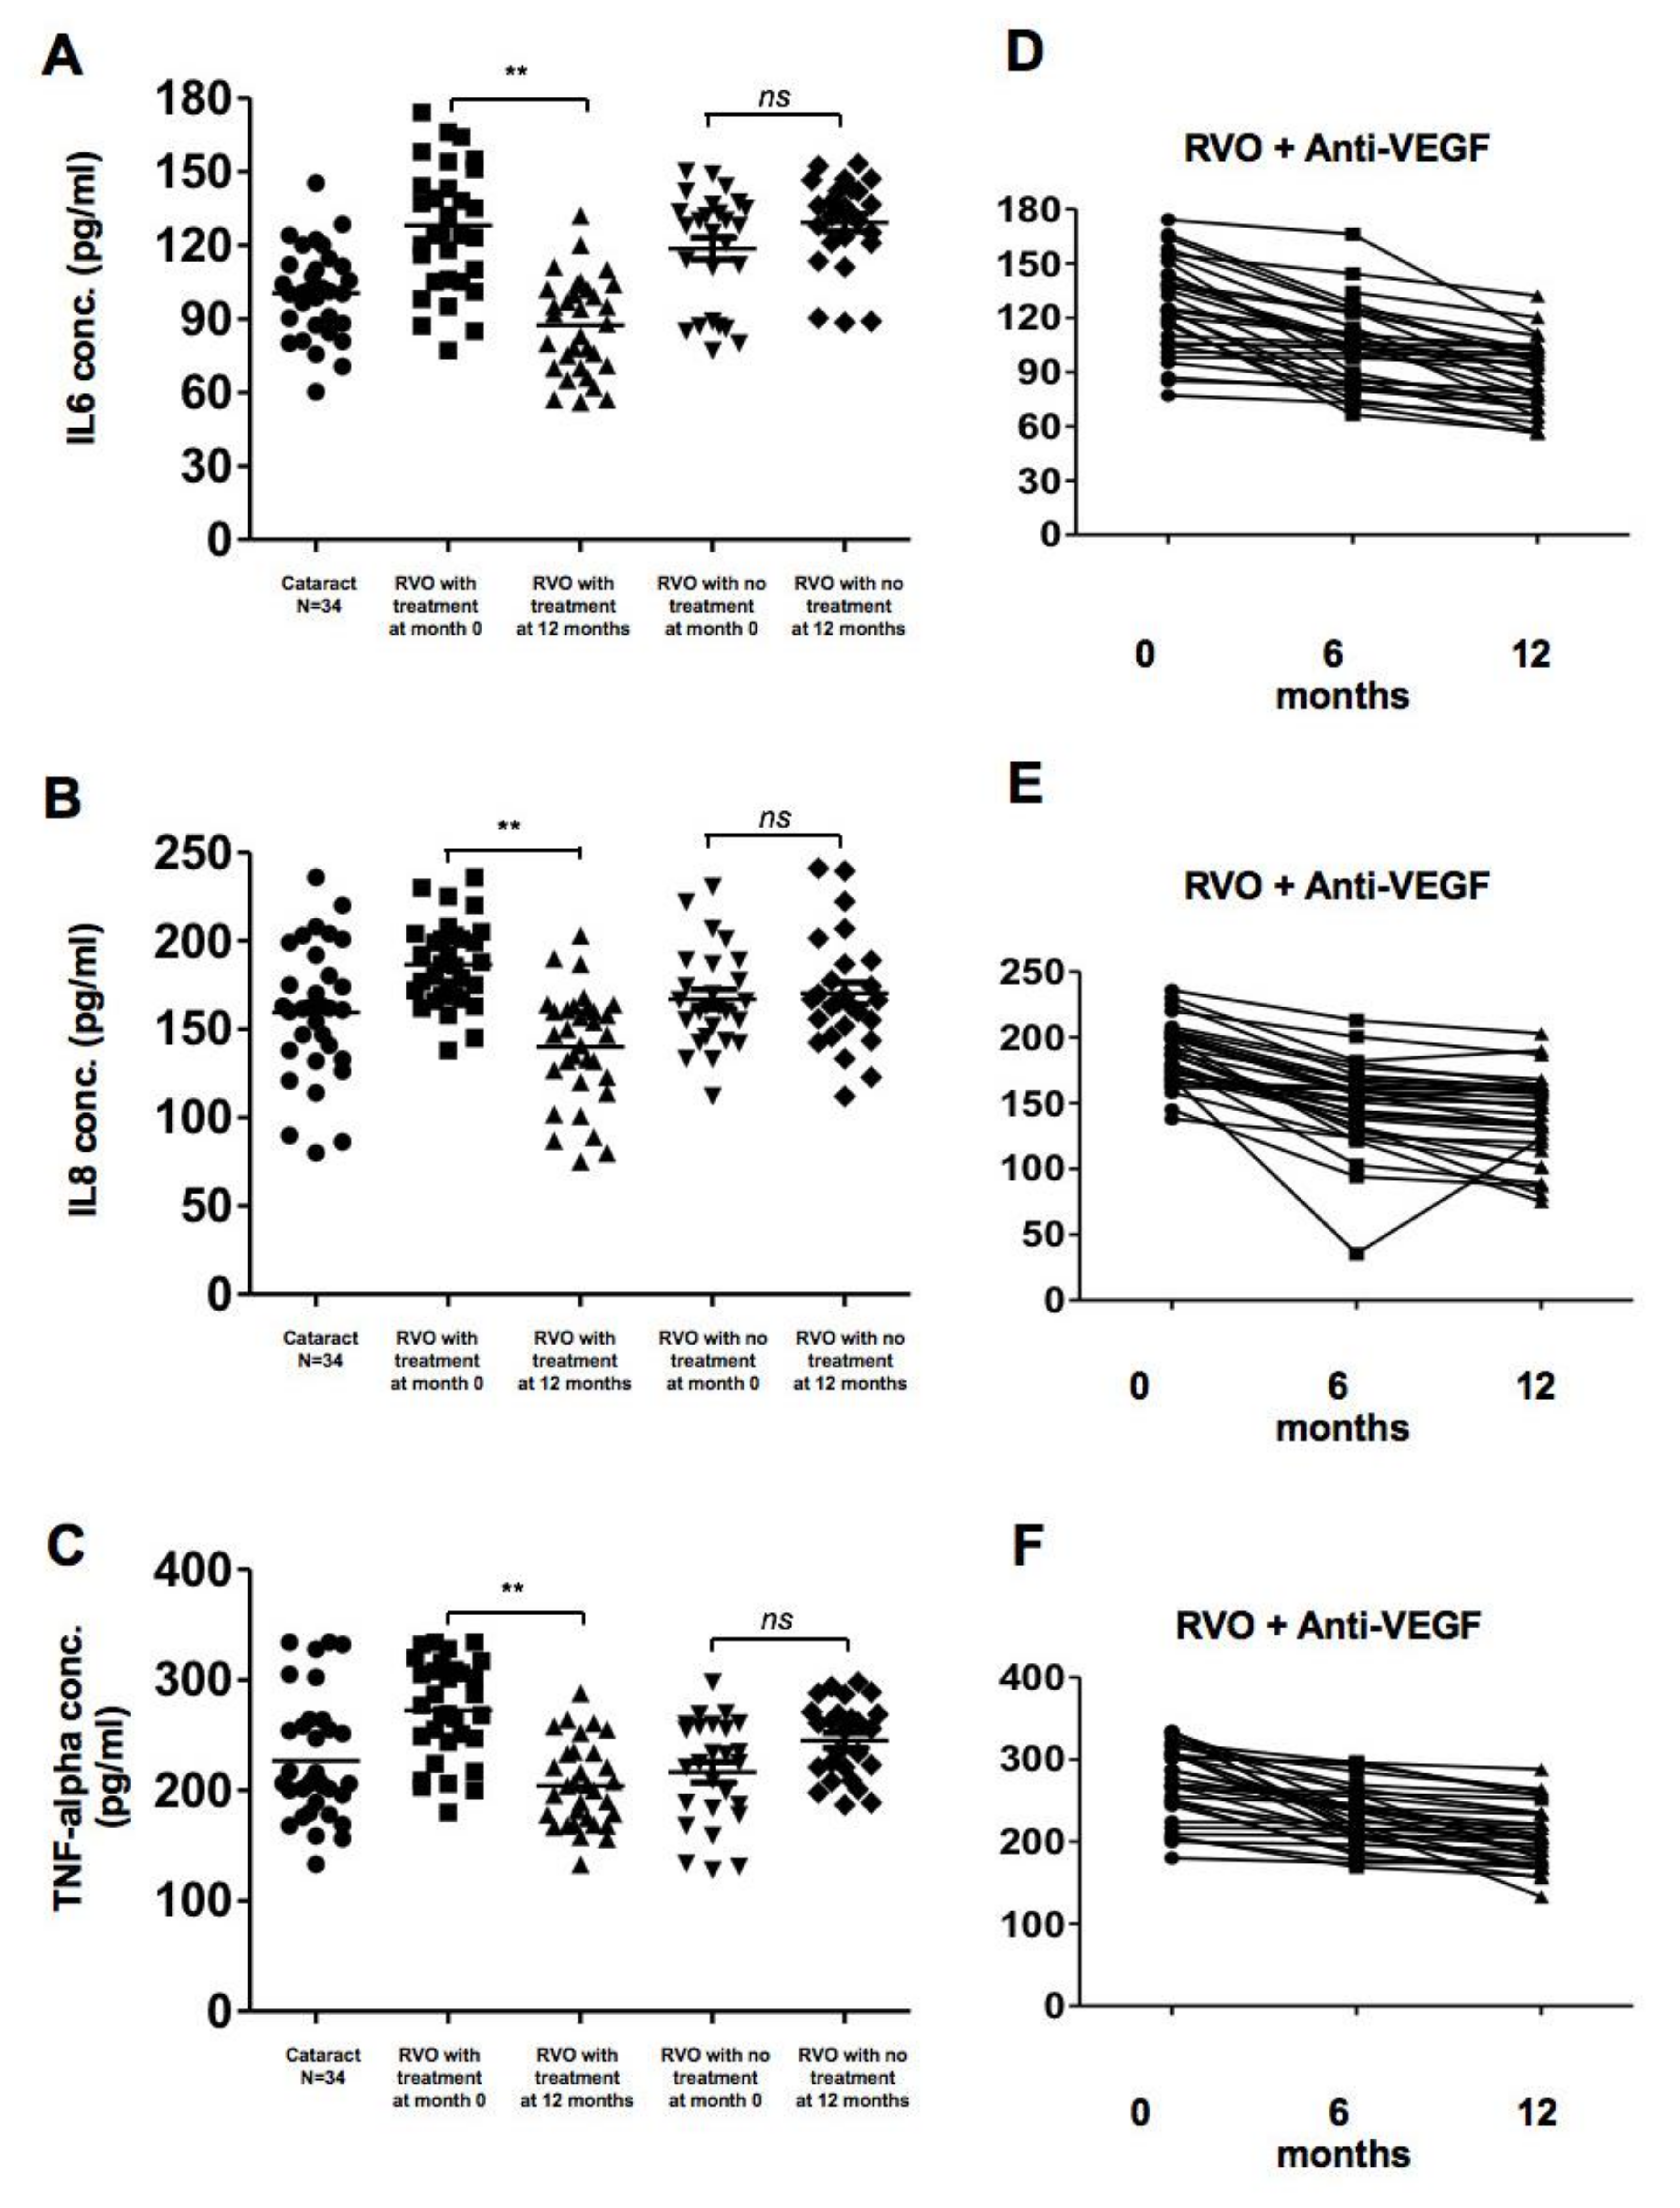
Concentrations of pro-inflammatory cytokines in patients with retinal vein occlusion (RVOs) under anti-vascular endothelial growth factor (aVEGF) therapy, without therapy, and controls. (A) The concentrations of interleukin (IL)-6 were significantly higher in patients with RVOs than controls at baseline (128.0 ± 27.3, 118.6 ± 23.3, and 100.5 ± 18.25 pg/mL, respectively, p < 0.05). One year later, the concentration decreased in patients who received aVEGF therapy (87.31 ± 19.53, ** p < 0.01) but remained in patients without therapy (129.2 ± 18.3, ns: difference was not significant). (B) The concentrations of IL-8 were higher but not statistically significant in patients with RVO an macular edema than those without macular edema and controls at baseline (186.6 ± 23.6, 167.0 ± 27.9, and 159.5 ± 38.1 pg/mL, respectively, ns: difference was not significant). One year later, the concentration decreased in patients who received aVEGF therapy (140.2 ± 32.0 pg/mL, ** p < 0.01) but remained in patients without therapy (170.3 ± 32.0 pg/mL, ns: difference was not significant). (C) The concentrations of Tumor Necrosis Factor-alpha were significantly higher in patients with RVO an macular edema than those without macular edema and controls at baseline (272.4 ± 45.0, 216.4 ± 47.3, and 226.7 ± 55.5 pg/mL, respectively, p < 0.05). One year later, the concentration decreased in patients who received aVEGF therapy (204.3 ± 37.75 pg/mL, ** p < 0.01) but remained in patients without therapy (245.3 ± 34.4 pg/mL, ns: difference was not significant). (D) There was a gradually decreasing trend of IL-6 concentration in RVO patients who received aVEGF therapy 6 months and 12 months after intervention. (E) There was a gradually decreasing trend of IL-8 concentration in RVO patients who received aVEGF therapy 6 months and 12 months after intervention. (F) There was a gradually decreasing trend of Tumor Necrosis Factor-alpha concentration in RVO patients who received aVEGF therapy 6 months and 12 months after intervention.
Figure 5.
Concentrations of pro-inflammatory cytokines in patients with retinal vein occlusion (RVOs) under anti-vascular endothelial growth factor (aVEGF) therapy, without therapy, and controls. (A) The concentrations of interleukin (IL)-6 were significantly higher in patients with RVOs than controls at baseline (128.0 ± 27.3, 118.6 ± 23.3, and 100.5 ± 18.25 pg/mL, respectively, p < 0.05). One year later, the concentration decreased in patients who received aVEGF therapy (87.31 ± 19.53, ** p < 0.01) but remained in patients without therapy (129.2 ± 18.3, ns: difference was not significant). (B) The concentrations of IL-8 were higher but not statistically significant in patients with RVO an macular edema than those without macular edema and controls at baseline (186.6 ± 23.6, 167.0 ± 27.9, and 159.5 ± 38.1 pg/mL, respectively, ns: difference was not significant). One year later, the concentration decreased in patients who received aVEGF therapy (140.2 ± 32.0 pg/mL, ** p < 0.01) but remained in patients without therapy (170.3 ± 32.0 pg/mL, ns: difference was not significant). (C) The concentrations of Tumor Necrosis Factor-alpha were significantly higher in patients with RVO an macular edema than those without macular edema and controls at baseline (272.4 ± 45.0, 216.4 ± 47.3, and 226.7 ± 55.5 pg/mL, respectively, p < 0.05). One year later, the concentration decreased in patients who received aVEGF therapy (204.3 ± 37.75 pg/mL, ** p < 0.01) but remained in patients without therapy (245.3 ± 34.4 pg/mL, ns: difference was not significant). (D) There was a gradually decreasing trend of IL-6 concentration in RVO patients who received aVEGF therapy 6 months and 12 months after intervention. (E) There was a gradually decreasing trend of IL-8 concentration in RVO patients who received aVEGF therapy 6 months and 12 months after intervention. (F) There was a gradually decreasing trend of Tumor Necrosis Factor-alpha concentration in RVO patients who received aVEGF therapy 6 months and 12 months after intervention.
![Biomolecules 10 01414 g005]()
Figure 6.
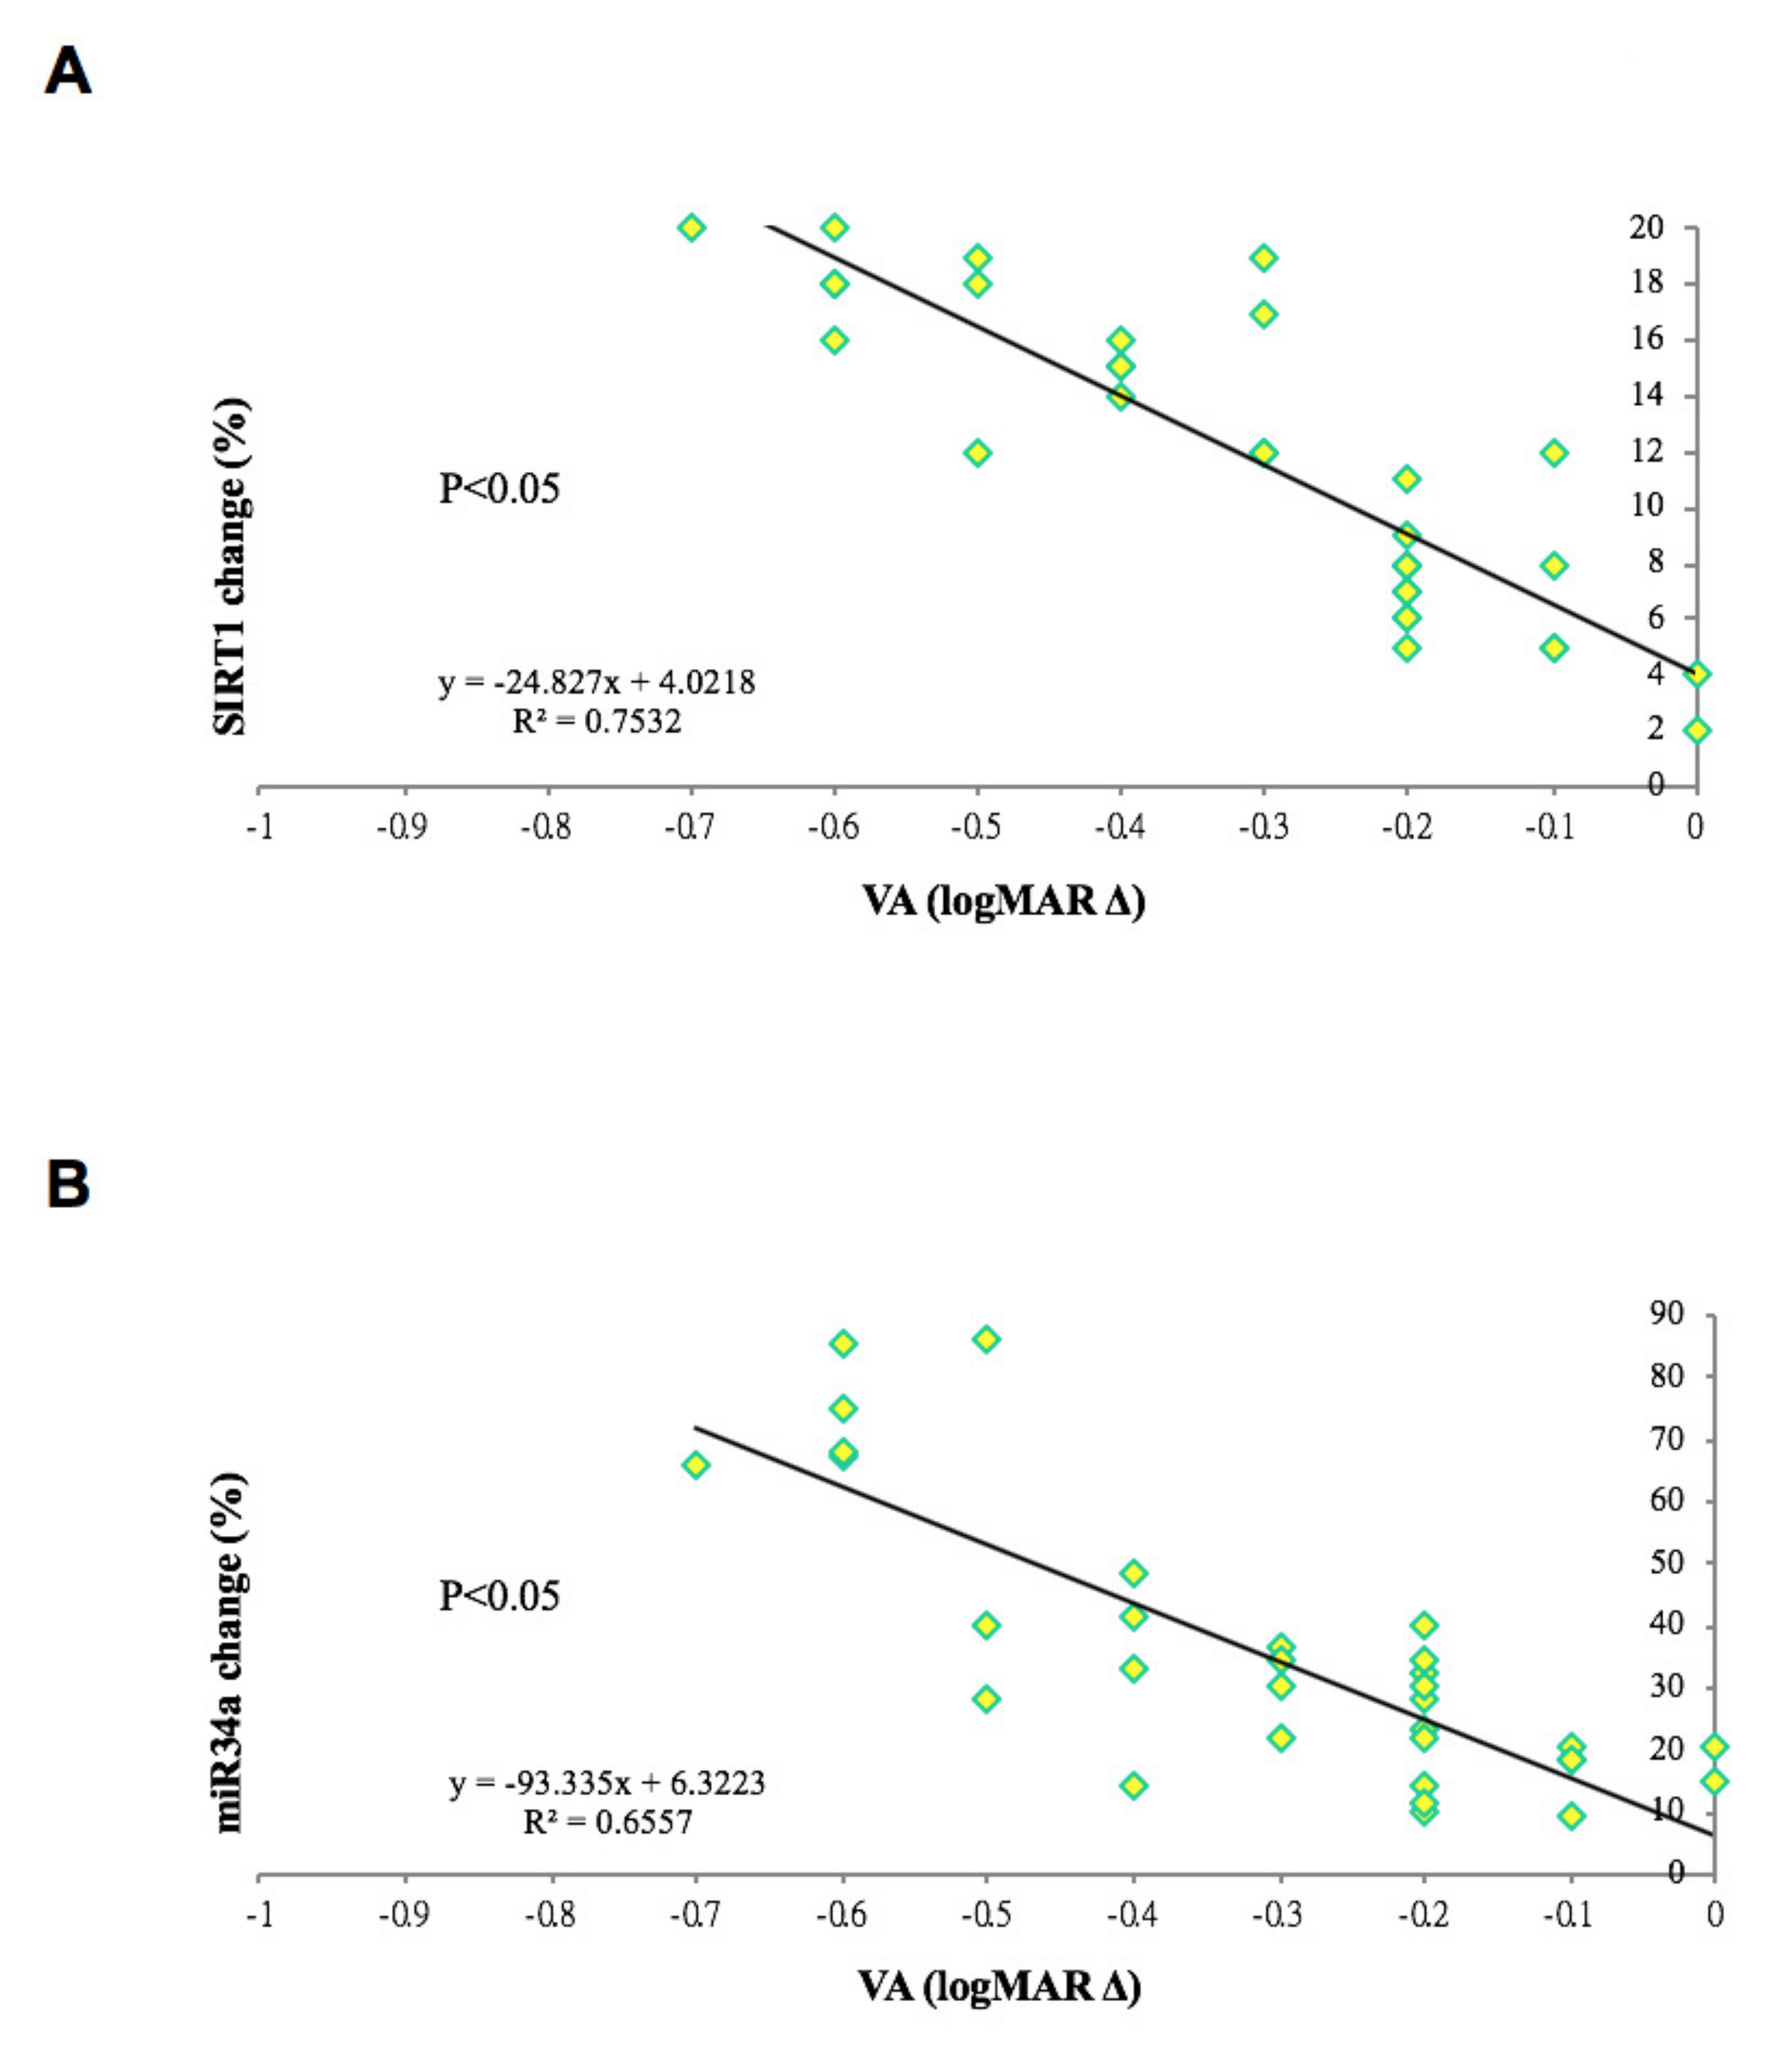
Correlation between changes in gene expression and visual outcome of patients with retinal vein occlusions and macular edema. (A) The absolute difference of SIRT1 gene expression (in percentage) was positively correlation to the improvement of visual acuity between base line and 1-year outcome in patients with retinal vein occlusion and secondary macular edema. (R2 = 0.7532, p < 0.05). (B) The absolute difference of miR-34a gene expression (in percentage) was positively correlation to the improvement of visual acuity between base line and 1-year outcome in patients with retinal vein occlusion and secondary macular edema. (R2 = 0.6557, p < 0.05).
Figure 6.
Correlation between changes in gene expression and visual outcome of patients with retinal vein occlusions and macular edema. (A) The absolute difference of SIRT1 gene expression (in percentage) was positively correlation to the improvement of visual acuity between base line and 1-year outcome in patients with retinal vein occlusion and secondary macular edema. (R2 = 0.7532, p < 0.05). (B) The absolute difference of miR-34a gene expression (in percentage) was positively correlation to the improvement of visual acuity between base line and 1-year outcome in patients with retinal vein occlusion and secondary macular edema. (R2 = 0.6557, p < 0.05).
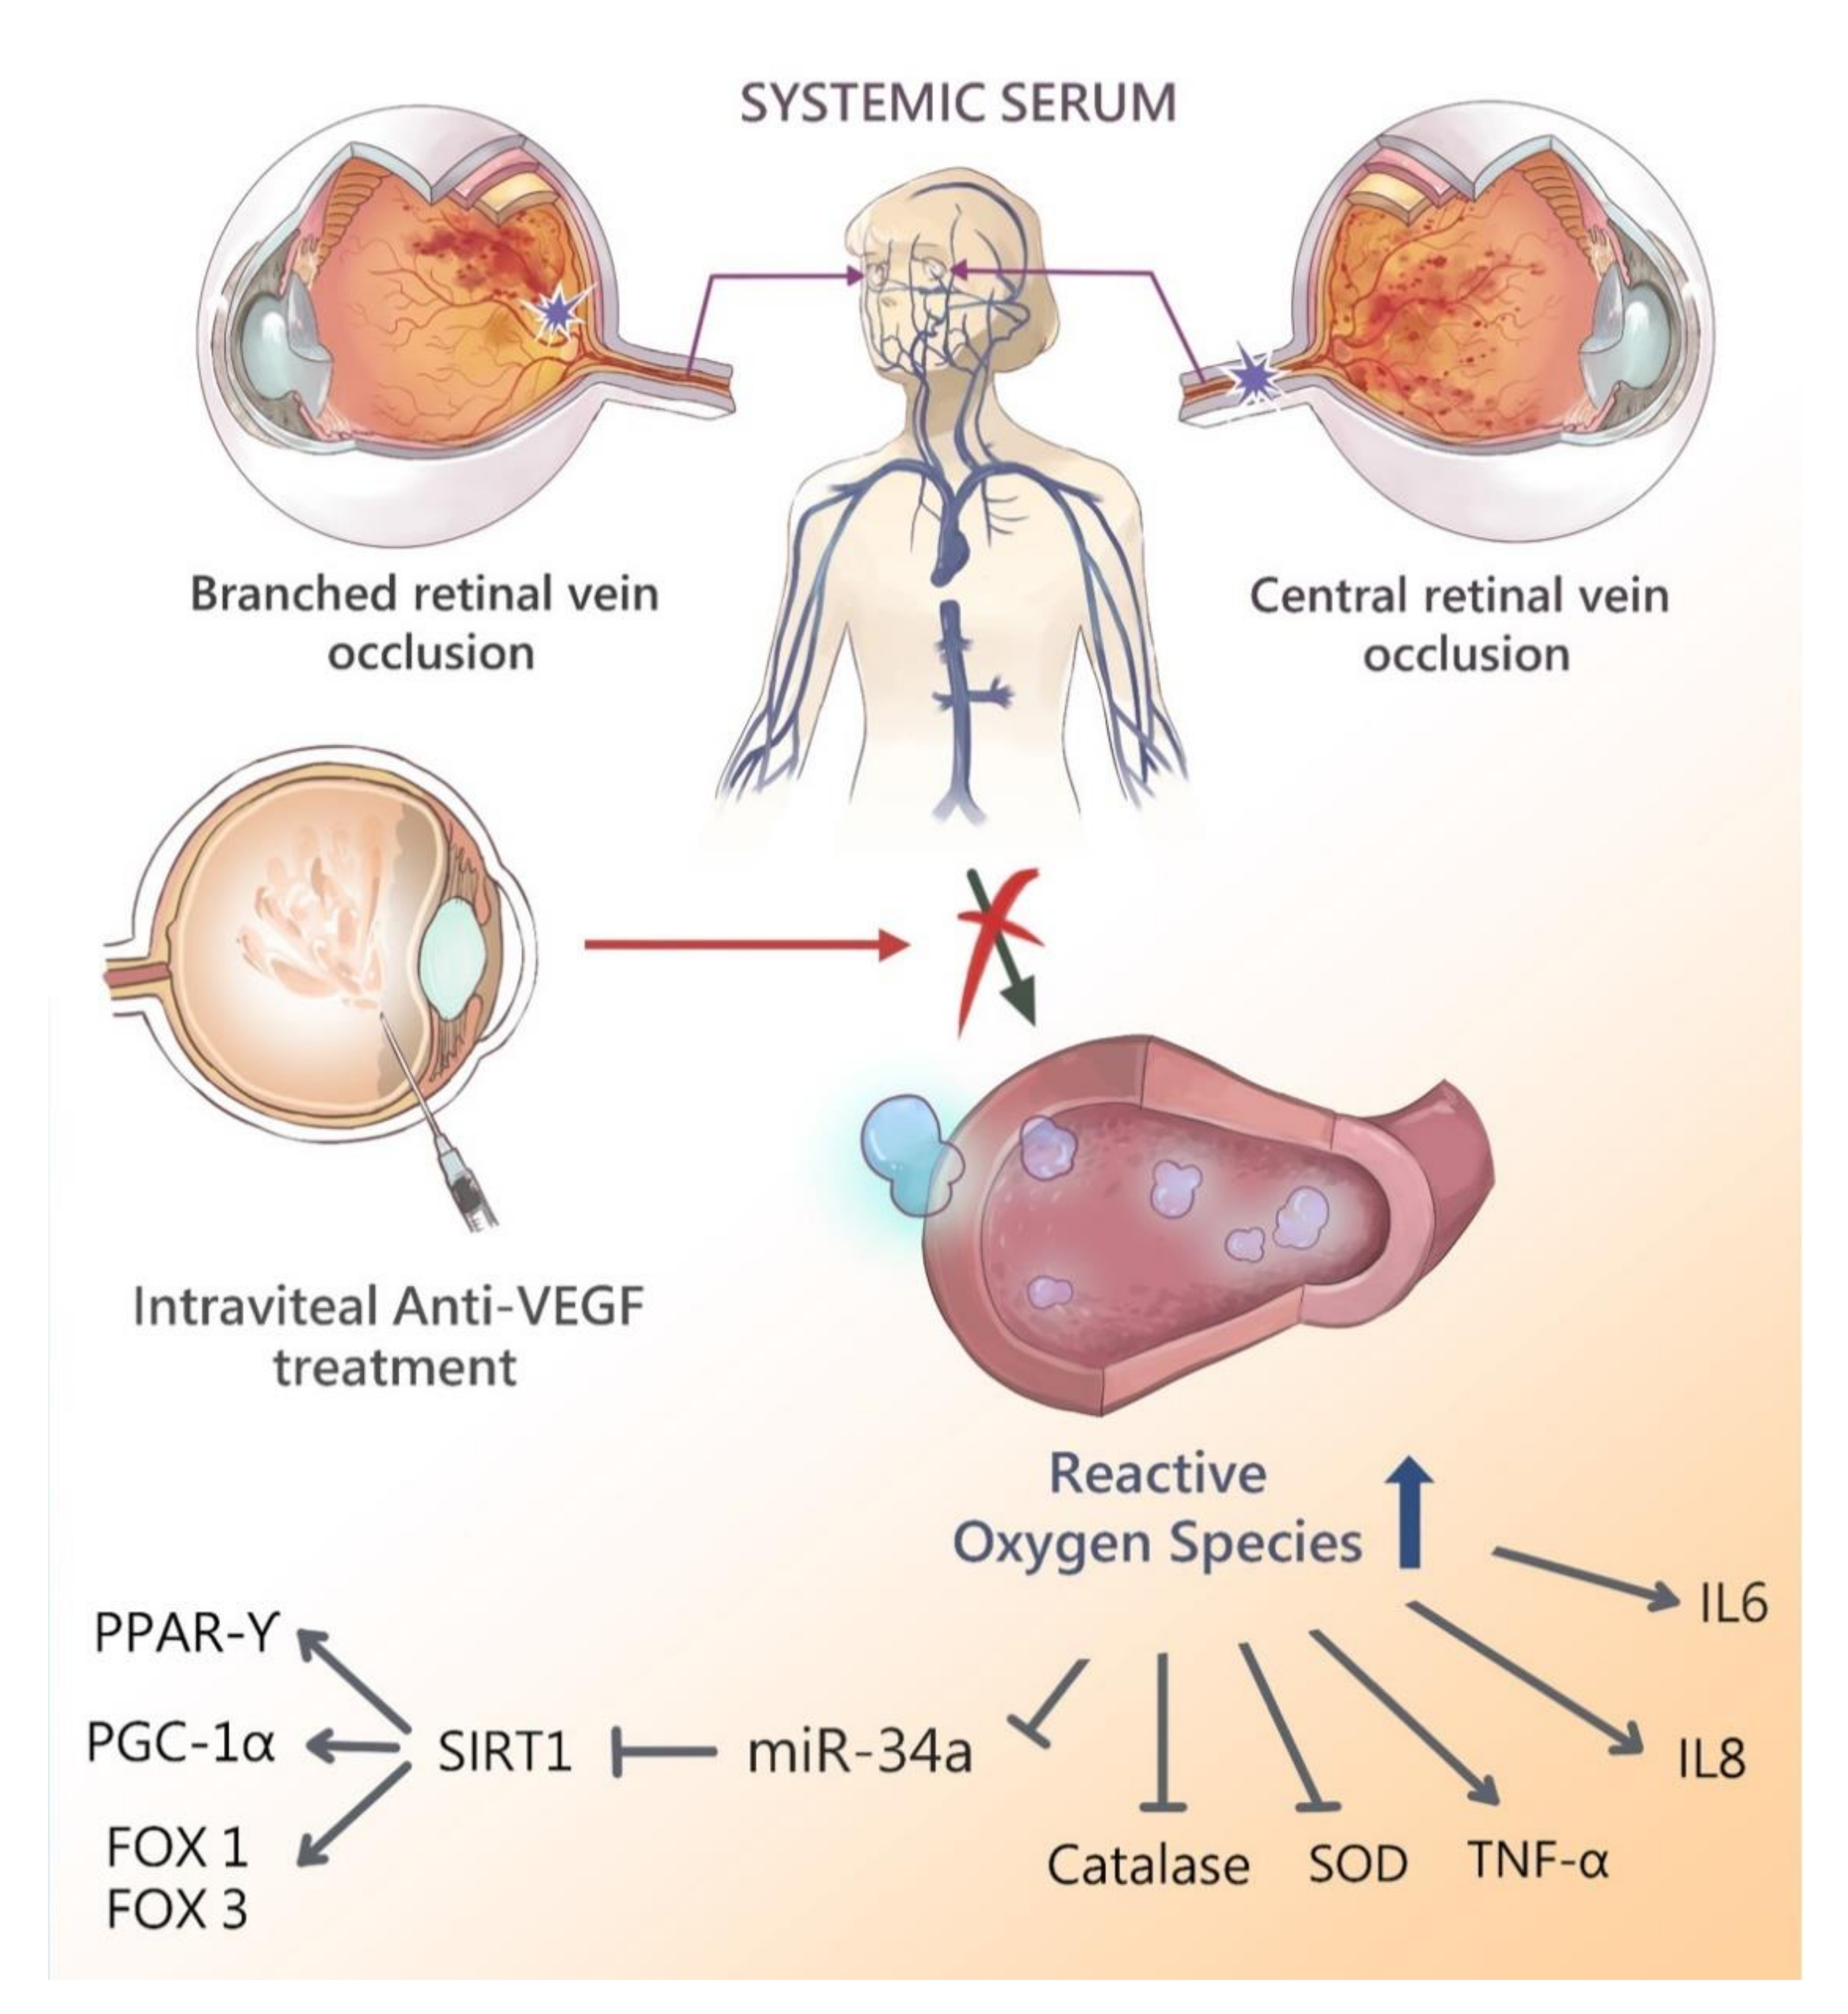
Figure 7.
Schematic diagram showing the possible epigenetic regulation in patients with retinal vein occlusions after intravitreal anti-vascular endothelial growth factor therapy. Retinal vein occlusion leads to elevation of reactive oxygen species and release to serum due to impaired blood-retinal-barrier. Antioxidant enzymes such as SIRT1 and SOD are decreased due to the serum oxidative stress scavenge by those enzymes. Downstream antioxidant enzymes PPAR-r, PGC-1α, FOXO1, and FOXO3 are also decreased. Pro-inflammatory cytokine including IL-6, IL-8 and TNF-α are elevated. Intravitreal anti-VEGF treatment reduces the ROS concentration (e.g., H2O2) and improves activities of various antioxidants enzymes, enhance gene expression of SIRT1 and miR-34a, and subsequently up-regulates PPAR-r, PGC1-α, FOXO1, FOXO3 expression. The cytokine expression of IL-6, IL-8 and TNF-α are decreased after intravitreal anti-vascular endothelial growth factor therapy.
Table 1.
Primers for real time PCR.
Table 1.
Primers for real time PCR.
| Gene | Sense | Anti-Sense |
|---|
| miR-34a | 5′-CGGTATCATTTGGCAGTGTCT-3′ | 5′-GTGCAGGGTCCGAGGT-3′ |
| SIRT1 | 5′-TGTGGTAGAGCTTGCATTGATCTT-3′ | 5′-GGCCTGTTGCTCTCCTCAT-3′ |
| PPAR-r | 5′-AGTGTGAATTACAGCAAATCTCTGTTTT-3′ | 5′-GCACCATGCTCTGGGTCAA-3′ |
| PGC-1α | 5′-CCGCACGCACCGAAA-3′ | 5′-TCGTGCTGATATTCCTCGTAGCT-3′ |
| FOXO1 | 5′-ATGGTCAAGAGCGTGCCC-3′ | 5′-GATTGAGCATCCACCAAG-3′ |
| FOXO3 | 5′-TCTCCCGTCAGCCAGTCTAT-3′ | 5′-AGTCACTGGGGAACTTGTCG-3′ |
| β-actin | 5′-CGGGAAATCGTGCGTGAC-3′ | 5′-TGCCCAGGAAGGAAGGCT-3′ |
Table 2.
Clinical characteristics of study population.
Table 2.
Clinical characteristics of study population.
| | Cataract (Reference Values) n = 34 | Treatment Group (CME Due to RVO Underwent IVI Ranibizumab) n = 32 | No Treatment Group n = 26 |
| | BRVO (with CME) n = 20 | CRVO (Ischemic)
n = 7 | CRVO (Non-Ischemic) n = 5 | RVO without CME |
| Age, years | 73.1 ± 6.2 | 78.4 ± 2.6 | 77.3 ± 3.2 | 76.2 ± 3.8 | 70.3 ± 3.4 |
| Female/Male | 18/16 | 11/9 | 5/2 | 2/3 | 15/11 |
| Body mass index, kg/m2 | 23.8 ± 2.2 | 23.7 ± 2.8 | 23.9 ± 3.9 | 24.6 ± 3.2 | 22.1 ± 3.5 |
| Hypertension | 17 | 13 | 7 | 5 | 10 |
| Diabetes mellitus | 0 | 0 | 0 | 0 | 0 |
| Alzheimer’s disease | 0 | 0 | 0 | 0 | 0 |
| Parkinson disease | 0 | 0 | 0 | 0 | 0 |
| eGFR, mL/min/1.73 m2 | 63.1 ± 3.5 | 61.5 ± 4.8 | 63.4 ± 5.6 | 63.4 ± 5.6 | 64.2 ± 3.6 |
| ACE inhibitor/ARB use | 16 | 12 | 6 | 4 | 10 |

 ,
, 


