Article

Database NORAD-Atomic-Data for Atomic Processes in Plasma

Department of Astronomy, The Ohio State University, Columbus, OH 43210, USA
Atoms 2020, 8(4), 68; https://doi.org/10.3390/atoms8040068
Submission received: 26 July 2020 / Revised: 19 September 2020 / Accepted: 22 September 2020 / Published: 7 October 2020
(This article belongs to the Special Issue Development and Perspectives of Atomic and Molecular Databases)

Abstract

:
The online atomic database of NORAD-Atomic-Data, where NORAD stands for Nahar OSU Radiative, is part of the data sources of the two international collaborations of the Opacity Project (OP) and the Iron Project (IP). It contains large sets of parameters for the dominant atomic processes in astrophysical plasmas, such as, (i) photo-excitation, (ii) photoionization, (iii) electron–ion recombination, (iv) electron–impact excitations. The atomic parameters correspond to tables of energy levels, level-specific total photoionization cross-sections, partial photoionization cross-sections of all bound states for leaving the residual ion in the ground state, partial cross-sections of the ground state for leaving the ion in various excited states, total level-specific electron–ion recombination rate coefficients that include both the radiative and dielectronic recombination, total recombination rate coefficients summed from contributions of an infinite number of recombined states, total photo-recombination cross-sections and rates with respect to photoelectron energy, transition probabilities, lifetimes, collision strengths. The database was created after the first two atomic databases, TOPbase under the OP and TIPbase under the IP. Hence the contents of NORAD-Atomic-Data are either new or from repeated calculations using a much larger wave function expansion making the data more complete. The results have been obtained from the R-matrix method using the close-coupling approximation developed under the OP and IP, and from atomic structure calculations using the program SUPERSTRUCTURE. They have been compared with available published results which have been obtained theoretically and experimentally, and are expected to be of high accuracy in general. All computations were carried out using the computational facilities at the Ohio Supercomputer Center (OSC) starting in 1990. At present it contains atomic data for 154 atomic species, 98 of which are lighter atomic species with nuclear charge Z ≤ 28 and 56 are heavier ones with Z > 28. New data are added with publications.

1. Introduction: NORAD-ATOMIC-DATA

The online atomic database NORAD-Atomic-Data [1] was established at the Ohio State University in 2007 at the suggestion of astronomers and initiative of Dr. C. Allende Prieto. The database is accessible from links provided at various database pages, such as International Atomic Energy Agency [2], CfA-Harvard University [3]. Current data at NORAD-Atomic-Data are for 154 atoms and ions, presented on the website [1] in two tables, Table 1 containing 98 ions with 1 Z 28 and Table 2 55 ions with 28 < Z 92 from published papers. All data files at NORAD-Atomic-Data are in standard ASCII format. They can be downloaded for direct use in models and for diagnostics of astrophysical and laboratory plasmas.
A large part of the data in NORAD-Atomic-Data was obtained from research under two international collaborations, The Opacity Project (OP) [4] (UK, USA, Germany, France, Venezuela, Canada) and Iron Project (IP) [5] (UK, USA, Germany, France, Belgium, Venezuela). The OP [4] ran during 1983–2007 and restarted in 2011, and the IP [5] started in 1993 and is continuing. The aims of the OP ‘and IP are to (i) study in detail the atomic radiative and collisional processes of elements that are abundant in astrophysical plasmas, (ii) compute large volume high precision atomic data with consideration of a large number of energy levels, typically n 10, and (iii) apply the computed data to solve long-standing astrophysical problems, such as stellar plasma opacity. NORAD-Atomic-Data is the follow-up of the two atomic databases. TOPbase [6,7], which provides energy levels, oscillator strengths and photoionization cross sections in LS coupling, was obtained for the first time for many atoms and ions under the OP. The second database is the TIPbase [8] which provides collision strengths and atomic data for the radiative processes of a limited number of atomic systems obtained with fine structure.
NORAD contains a vast number of parameters for the four dominant atomic processes, which are described below, involving the interaction of a photon or electron and an ion that contribute the most to the spectra of astrophysical and laboratory plasmas. These parameters have been obtained mainly from the R-matrix method using R-matrix package of codes developed under the OP and IP [9,10,11] and their extensions for theoretical spectroscopy in LS coupling (e.g., [12]), for fine structure splitting of transitions (e.g., [13]), for fine structure spectroscopy (e.g., [14,15]), from the unified method for electron–ion recombination calculations (e.g., [16,17,18]), and from atomic structure calculations using the code SUPERSTRUCTURE (SS) [19,20]. The large-scale computations are carried out using high-performance computational facilities at the Ohio Supercomputer Center (OSC) where the codes were installed by the OSU group of the OP and the IP team in 1990. The atomic processes and the relevant atomic quantities available at NORAD-Atomic-Data are described below:

1.1. Photoexcitation and De-Excitation

These processes of an ion X + Z of charge Z (zero for a neutral) are:
X + Z + h ν X + Z *
The relevant parameters are
  • Line strength (S),
  • Oscillator strength (f),
  • Radiative decay rate (A-value)
  • Lifetimes
The database contains data for transitions of the following types: allowed electric dipole (E1) of the same (LS-allowed) and different (intercombination) spin multiplicities, electric quadrupole (E2), electric octupole (E3), magnetic dipole (M1), and magnetic quadrupole (M2). The data for E1 transitions are obtained mainly from the R-matrix method and its extensions while those for the forbidden transitions have been obtained from Breit–Pauli atomic structure calculations using code SS. Individual transitions form spectral lines, however, data for a large number of transitions are needed to determine the opacity in plasmas, modeling synthetic spectra.

1.2. Photoionization

Photoionization (PI) proceeds directly as
X + Z + h ν X + Z + 1 + e
which provides only the background cross section, and indirectly via formation of an intermediate doubly-excited autoionizing state as
h ν + X + Z ( X + Z ) * * X + Z + 1 + e .
This indirect process introduces a resonance as well as an impact on the background cross-section. The relevant parameters are:
  • Total photoionization cross-section ( σ P I ) of each bound state of the ion, from ground to various excited states, typically with n 10. Total σ P I corresponds to the summed contribution of all ionization channels leaving the residual ion in the ground and various excited states.
  • Partial photoionization cross-section ( σ P I ) for all bound states of the ion for leaving the residual ion in the ground state only.
  • Partial photoionization cross-sections ( σ P I ) corresponding to leaving the residual ion in the ground and various excited states. NORAD-Atomic-Data provides these cross-sections only for the ground level of the ion. Photoionization resonances are often dissolved by plasma density and temperature, resulting in an enhanced continuum background. However, the strong and isolated resonances can be seen in the absorption spectra. Large quantities photoionization cross-section for all possible bound states with a wide range of photon energies are needed to determine the opacity in astrophysical plasmas.

1.3. Electron–Ion Recombination

Electron–ion recombination is the inverse process of photoionization. It can proceed directly, known as radiative recombination (RR), as
X + Z + 1 + e X + Z + h ν ,
which provides only the background recombination rate, and indirectly through an autoionizing state, known as dielectronic recombination (DR), as
e + X + Z ( X + Z 1 ) * * e + X + Z A I X + Z 1 + h ν D R
AI is autoionization, the other decay channel of an autoionizing state leading to ionization instead of radiative stabilization.
Relevant parameters for the process obtained from the unified method of Nahar and Pradhan [16,17] are:
  • Level-specific total recombination (includes both RR and DR) rate coefficients ( α R C ( i ) ) of all bound levels with n 10.
  • Total recombination rate coefficient ( α R C ( T ) ), summed contributions of all levels with n 10 and of levels with 10 < n as function of electron temperature T.
  • Total recombination cross sections ( σ R C ( E ) ) and total recombination rate coefficient ( α R C ( E ) ) with respect to photoelectron energy E. Recombination resonances can be seen in emission spectra as dielectronic recombination lines. Total α R C ( T ) is needed for the determination of ionization fractions in photoionized or collisional plasmas.

1.4. Electron–Impact Excitation (EIE)

EIE describes exciting an electron of the target ion by impact of a projectile electron. The state then drops down by giving out a photon that carries the information of the excitation of the target.
e + X + Z e + X + Z * X + Z + h ν + e .
The excitation can be an autoionizing state which includes a decay channel for autoionization. Relevant parameters are:
  • Collision strength ( Ω ),
  • Effective collision strengths ( γ ),
  • Collision rate coefficients ( q i j ).
Emission lines from levels excited by EIE provides diagnostics of thin plasmas.
Although largely similar, NORAD-Atomic-Data has some differences from TOPbase and TIPbase as explained below.

1.5. The Opacity Project and atomic database TOPbase

The Opacity Project [4] was initiated in 1983 at the plea of astronomers due to the need for accurate atomic data. The comparison of observed and predicted astrophysical spectra suggested a few times greater abundance of metals (elements heavier than Li) compared to model predictions. Under the OP leadership of Michael J. Seaton, the original R-matrix codes (e.g., for collisions [21]) went through massive changes with huge efforts, the introduction of detailed photoionization with resonances. Systematic studies‘ of radiative processes of photoexcitations and photoionization with resonances were carried out for all astrophysically abundant atoms and ions from hydrogen to iron for the first time by a team of 25 investigators in Europe, US, and South America. Extensive volumes of atomic data they computed under the OP by were made available through the database TOPbase in 1993 [6,7]. The results were obtained in LS coupling, so the fine structure splitting of energy levels was not accounted for. However, the effort solved and continues to solve many astrophysical problems and has revealed new features in photoionization.
It may be added that monochromatic opacities of elements from H to Fe obtained using the atomic data of TOPbase are available at the OP Server [22] at OSC.

1.6. The Iron Project and atomic database TIPbase

Following the crucial role played by the OP for radiative atomic processes, the need for high-accuracy collisional atomic data was realized. This initiated the Iron Project in 1991 to study electron impact excitation (EIE) with high accuracy for iron and iron-peak elements that had very limited data due to difficulty in computation arising from their complex atomic structure. In addition to EIE, the IP included computing radiative atomic data with inclusion of the next level of accuracy with fine structure and other relativistic effects. The R-matrix codes were further extended to include relativistic effects in the Breit–Pauli approximation, which was named as the Breit–Pauli R-matrix or Breit–Pauli R-matrix (BPRM) method [5,11]. Extensive volumes of atomic data have been obtained, and continue to be computed, under the IP. The resulting atomic data formed the database TIPbase [8]. However, this database contains only a part of the work carried out under the IP.

1.7. NORAD-ATOMIC-DATA and Atomic Astrophysics and Spectroscopy

The extensive effort at the Oho State University (OSU) resulted in the online database, NORAD-Atomic-Data [1]. It contains data mainly for the radiative processes and limited for the collisional process, obtained beyond TOPbase. and are not available in TOPbase or TIPbase. It has some differences in structure and contents from those of TOPbse and TIPbase. Atomic data in NORAD-Atomic-Data have been obtained by Nahar et al. only, and it is maintained by Nahar, the present author. The main differences are as follows:
-
Significant part of the data corresponds to new and/or improved results over those in TOPbase,
-
The data are of higher accuracy than those in TOPbase,
-
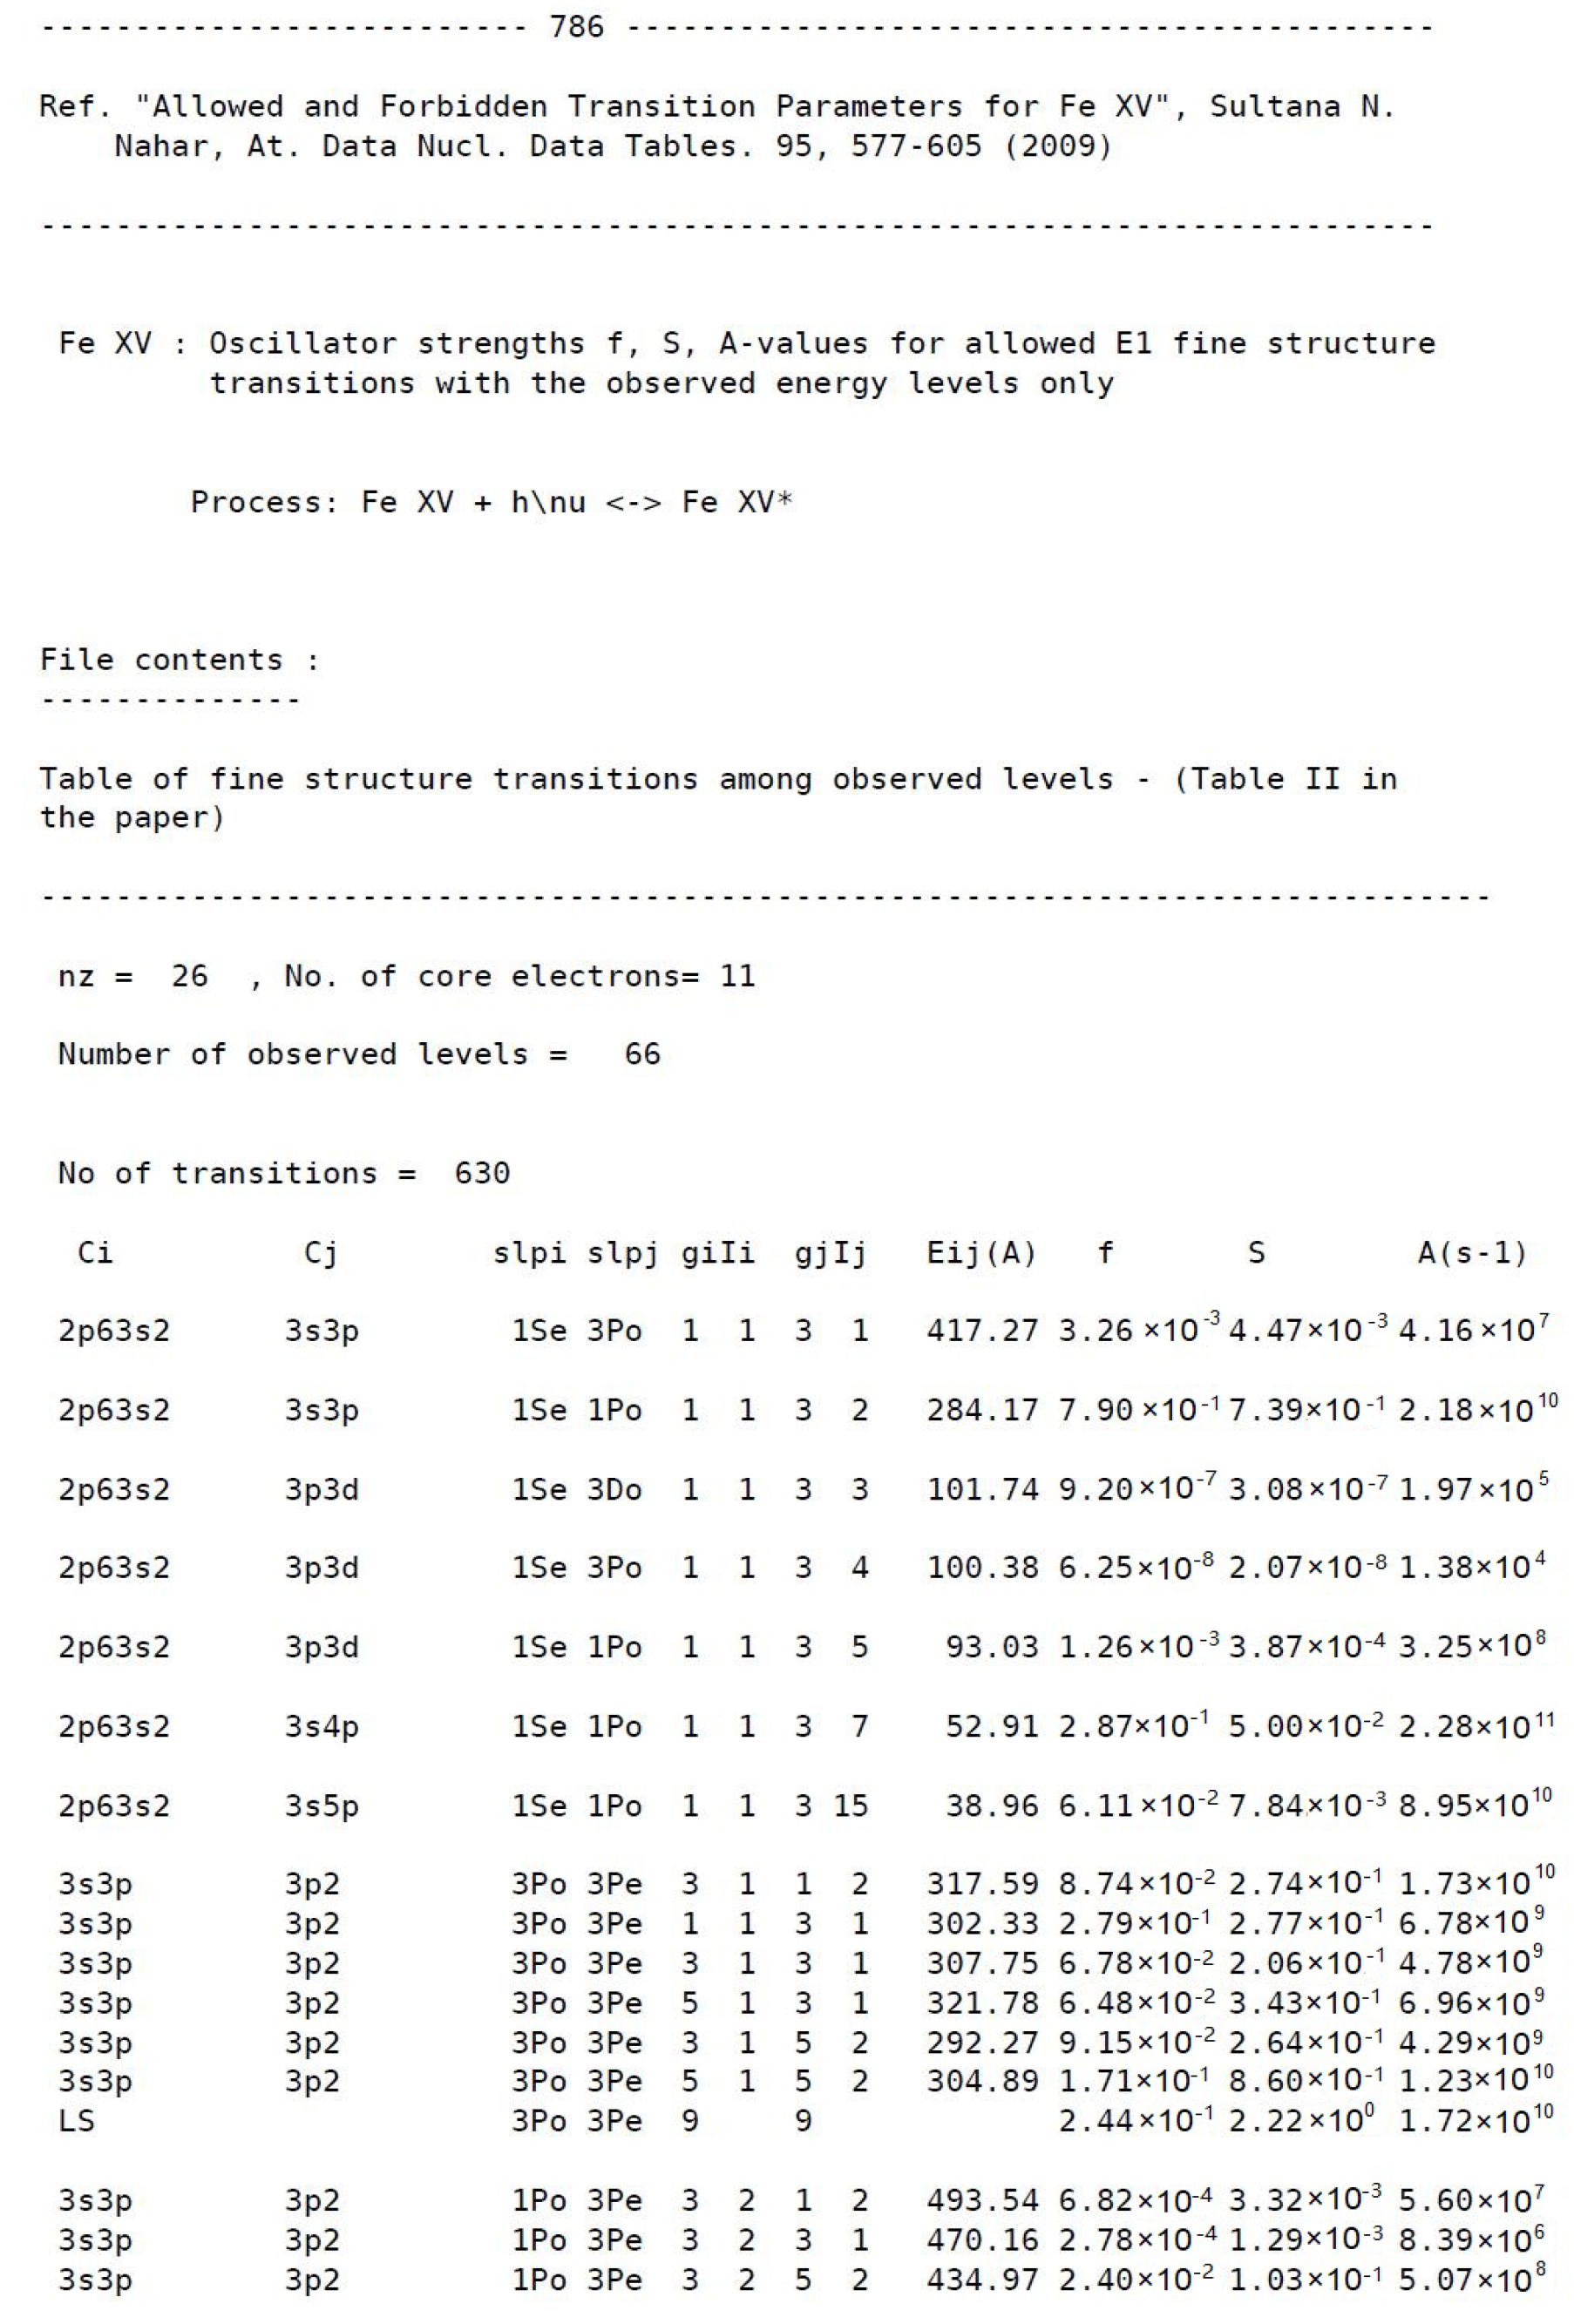
Includes fine structure oscillator strengths of many ions,
-
Contains forbidden transitions, lifetimes,
-
Includes data of the additional atomic process of electron–ion recombination,
-
Contains larger sets (typically up to n = 10 and l 9) of energy levels, photoionization cross-sections, recombination cross sections and rate coefficients needed for complete modeling of astrophysical objects,
-
Contains X-ray transition data for heavier elements (beyond Ni) which are of great interest for various astronomical, biomedical, fusion plasma applications.
The textbook “Atomic Astrophysics and Spectroscopy” [23] is a culmination of findings in atomic processes revealed in the study under the OP and IP. It describes details of atomic physics and their relevance to astronomical applications, interpretation of astrophysical spectra with atomic processes, and forms the bridge between atomic physics and astronomy.

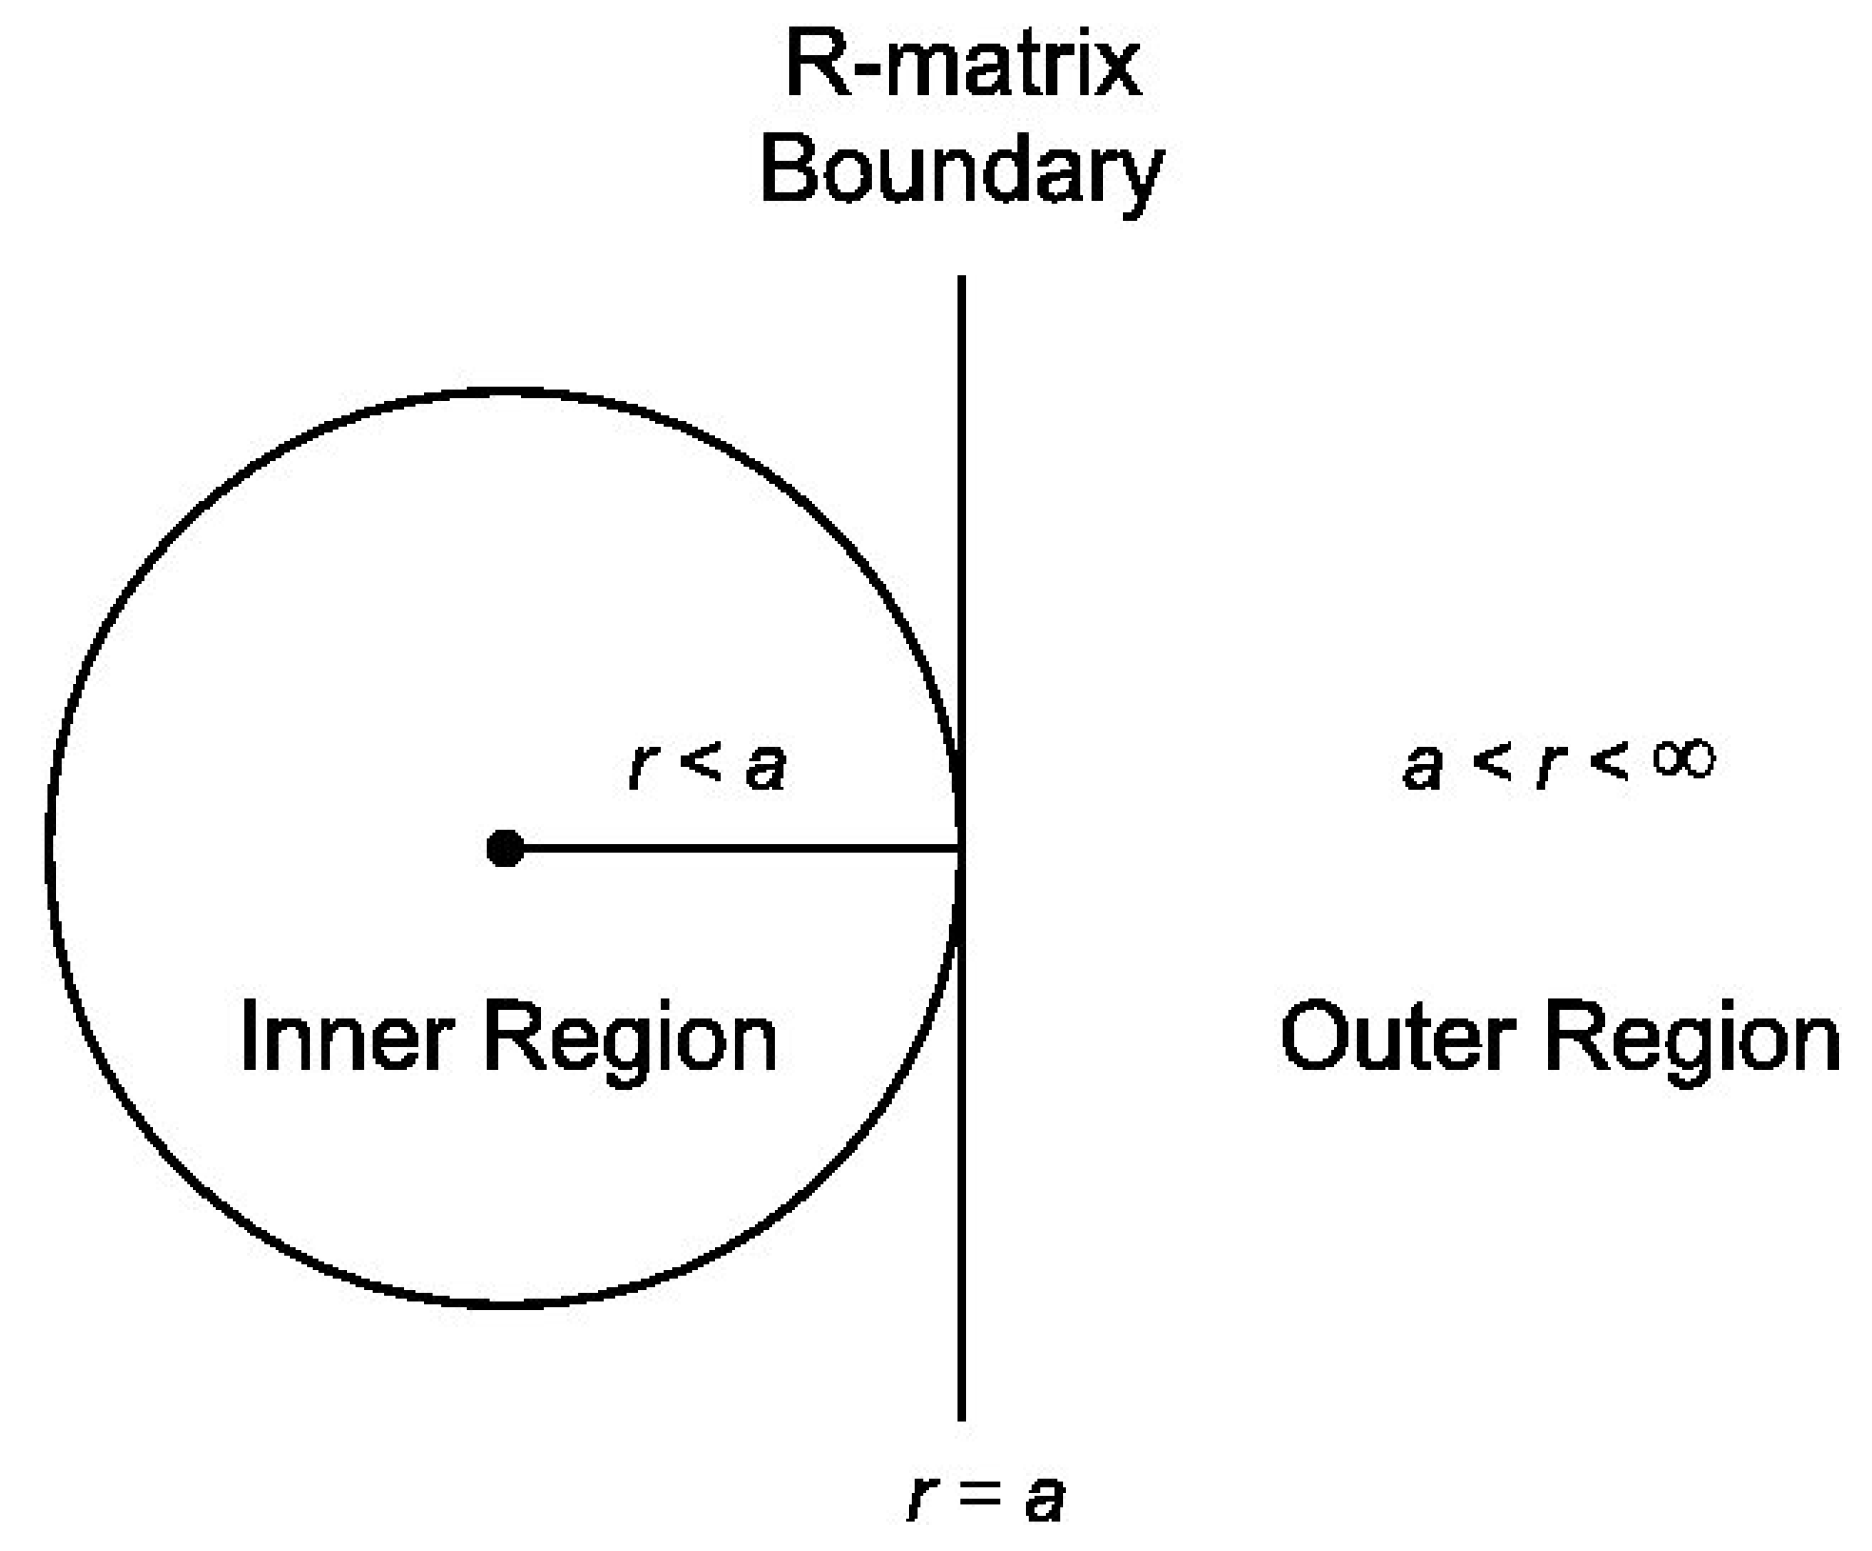
2. Theoretical Approximations

The theoretical background used for obtaining the atomic parameters gives a measure of general consistency and accuracy of the results. Hence a brief outline of the theory and description of definitions of quantities are given here to inform data users. While most of the results in NORAD-Atomic-Data have been obtained from ab initio R-matrix method using the close-coupling (CC) approximation (e.g., [9,21,23]), transition probabilities have also been obtained from atomic structure calculations using the SUPERSTRUCTURE (SS) software. SS is also a part of the R-matrix package of code, providing the initial wave function of the core (also termed as residual or target) ion to initiate R-matrix calculations. The relativistic Hamiltonian in the BPRM method adopted under the IP is given by ([20,23])
H BP = H N R + H mass + H Dar + H so + 1 2 i j N [ g i j ( s o + s o ) + g i j ( s s ) ]
The non-relativistic Hamiltonian is
H N R = i = 1 N i 2 2 Z r i + j > i N 2 r i j ,
where i , j are indices for electrons, r is the distance, and Z is the nuclear charge of the ion. The one-body relativistic correction terms are H m a s s = α 2 4 i p i 4 , H D a r = α 2 4 i 2 Z r i , H s o = Z e 2 2 2 m 2 c 2 r 3 L · S , where α is the fine structure constant, p i is the momentum of electron i, m , e are electron mass and charge, , c are constants, and L , S are the total orbital and total spin angular momenta of the ion. The two-body Breit interaction is H B = i > j [ g i j ( s o + s o ) + g i j ( s s ) ] where various g represent terms of spin–orbit s o , spin–other orbit s o , spin–other spin s s interaction [23]. BPRM includes relativistic contributions from these terms and part of other two-body interaction terms [23].
Wave functions and energies are obtained solving:
H Ψ = E Ψ
in the CC approximation, where the atom/ion described as an (N + 1)-electrons system, the target or the core ion is an N-electrons system, which is interacting with (N + 1)th electron. The total wave function is an expansion (e.g., [9,23])
Ψ E ( e + i o n ) = A i N χ i ( i o n ) θ i + j c j Φ j ( e + i o n ) ,
where χ i represents the core ion wave function, which is typically obtained from SS, θ i represents the interacting electron wave function, which can be free at energy E 0 or bound at E < 0. The sum on i represents the number of core ion states included in the R-matrix calculations. A is the anti-symmetrization operation. Φ j in the bound-channel term (the second term) are the correlation configurations of the (e + ion) system and number of j values depends on the choice of configurations that might contribute significantly for the improvement of energies of the ion.
Complex resonance structures in atomic processes are introduced via channel couplings of the continuum (free) and bound wave function. An electron in a Rydberg state E x ν l > 0 , where E x is an excited core ion energy in Ry and ν l are the effective quantum number and orbital angular momentum of the interacting electron, introduces a Rydberg resonance at E x n l = E * * ( X + ν l ) = E x z 2 / ν 2 where z is the charge of the core ion. The other type of resonance, Seaton’s resonance due to PEC (photo-excitation-of-core) appears when the incident photon energy h ν is equal to E x for a dipole-allowed transition in the core ion. Please note ν with a photon represents photon frequency and is different from effective quantum number ν that appears with angular momentum. The feature of the CC wavefunction which can form resonances naturally is not available in other approximations, e.g., distorted wave Born approximation (DWBA).
Substitution of Ψ E ( e + i o n ) expansion in the Schrodinger equation results in a set of coupled equations, which are solved by the R-matrix method.
In the R-matrix method, the space is divided into two regions, the inner and the outer regions, of a sphere of radius r a with the ion at the center as illustrated in Figure 1. r a is large enough to include electron–electron interaction potential inside and is almost zero outside the boundary. Hence outside potential at r > r a is Coulombic from perturbation of long-range multipole potentials. In the inner region, the radial part F i ( r ) / r of the outer electron wave function ( θ ) is expanded in terms of a basis set, known as the R-matrix basis,
F i = k a k u k ( r i )
that satisfies
d 2 d r 2 l ( l + 1 ) r 2 + V ( r ) + ϵ l k u l k + n λ n l k P n l ( r ) = 0
and is made continuous with Coulomb functions outside r a (see for example [23]). V ( r ) is the potential experienced by the interacting electron, ϵ l k is the energy eigenvalue, and λ n l k are Lagrange multipliers. P n l ( r ) is a bound orbital wave function of the target. Computations using BPRM method involve a number of stages as described in the flowchart of Figure 2.
As shown in Figure 2, R-matrix calculations can have 3 branches to proceed—(1) L S coupling and relativistic Breit–Pauli, (2) large configuration interaction L S coupling, (3) Dirac relativistic. Various stages generate Hamiltonian matrix (H), dipole matrices (D), bound wave functions (B), and continuum wave functions (F). End results are (1) energy levels, (2) oscillator strengths, (3) photoionization cross sections, (4) recombination rate coefficients, and (5) collision strengths, which are applied to astrophysical models.
For atomic structure calculations using SUPERSTRUCTURE, the wave functions and energies are obtained using Thomas–Fermi–Dirac–Amaldi potential. The potential represents atomic electrons as a Fermi sea, constrained by the Pauli exclusion principle, filled in cells up to a the highest Fermi level of momentum:
V ( r ) = Z eff ( λ n l , r ) r = Z r ϕ ( x ) ,
where ϕ ( x ) = e Z r / 2 + λ n l ( 1 e Z r / 2 ) , x = r μ , μ = 0.8853 N N 1 2 / 3 Z 1 / 3 is a constant. The function ϕ ( x ) is a solution of the potential equation [19]. The quantities λ n l are the scaling parameters for the orbitals.
With the wavefunctions, various atomic quantities can be calculated as given below.

2.1. Photoexcitations/ Deexcitations

The radiative transition matrix, T B B = < Ψ B D Ψ B > for dipole allowed transitions with initial and final bound wavefunctions Ψ B and Ψ B , and the dipole operator D = n r n where n is the number of electrons, provides the line strength
S = | < Ψ j D Ψ i > | 2 = Ψ f | j = 1 N r j | Ψ i 2
where Ψ i and Ψ f are initial and final wave functions. Oscillator strengths (f) and the transition probabilities (A-values) for E1 transitions are obtained as
f i j = E j i 3 g i S , A j i ( s e c 1 ) = 0.8032 × 10 10 E j i 3 3 g j S
where E j i is the transition energy and g i is the statistical weight factor. The forbidden transitions obtained using SS are of type (i) electric quadrupole (E2) and (ii) magnetic dipole (M1),
i ) A j i E 2 = 2.6733 × 10 3 E i j 5 g j S E 2 ( i , j ) s 1 , i i ) A j i M 1 = 3.5644 × 10 4 E i j 3 g j S M 1 ( i , j ) s 1 ,
(iii) Electric octupole (E3) and (iv) magnetic quadrupole (M2),
i i i ) A j i E 3 = 1.2050 × 10 3 E i j 7 g j S E 3 ( i , j ) s 1 , i v ) A j i M 2 = 2.3727 × 10 2 s 1 E i j 5 g j S M 2 ( i , j ) .

2.2. Photoionization (PI)

The radiative transition matrix for photoionization, T B F = < Ψ F D Ψ B > is obtained from bound and continuum wave functions which give the line strength using the expression above. Photoionization cross section is obtained as
σ P I = 4 π 3 c 1 g i ω S ,
where ω is the incident photon energy in Rydberg unit.

2.3. Electron–Ion Recombination

Under the unified method, recombination cross section, σ R C , for all bound levels up to n n o (typically n o = 10) is obtained from the principle of detailed balance (Milne relation) as
σ R C = σ P I g i g j h 2 ω 2 4 π 2 m 2 c 2 v 2
where v is the velocity of the photoelectron. The recombination rate coefficient is obtained from the Maxwellian average as
α R C ( T ) = 4 π ( m 2 k T ) 3 / 2 0 v 3 e m v 2 2 k T σ R C d v ,
The recombination rate coefficient in terms of photoelectron energy can be obtained as α R C ( E ) = v σ R C . Contributions from levels n o n can be obtained from the extension of Bell and Seaton theory [24] as described in [17,18]. Radiation damping [25] is included for fine structure levels.

2.4. Electron Impact Excitation (EIE)

The scattering matrix S S L π ( i , j ) for excitation from i to j is obtained from the phase shift of the wave function which gives the EIE collision strength
Ω ( S i L i S j L j ) = 1 2 S L π l i l j ( 2 S + 1 ) ( 2 L + 1 ) | S S L π ( S i L i l i S j L j l j ) | 2 ,
where S L denotes the symmetry of a state, initial or final, with S for the spin multiplicity although conventionally expressed only by S in a symmetry notation and L for the total angular momentum. S with subscripts S L π denotes the scattering matrix, e.g., S S L π ( S i L i l i S j L j l j ) is the scattering matrix for excitation between the two states, ( S i L i l i S j L j l j with partial waves l i and l j . Ω is related to scattering cross-section σ E I E as, σ E I E = π / ( g i k 2 ) Ω a o 2 where π is the standard constant of value 3.14, k is the momentum of the projectile and a o is the Bohr radius. The effective collision strength Υ ( T ) and excitation rate coefficient q i j ( T ) needed for astrophysical models are obtained as
Υ ( T ) = 0 Ω i j ( ϵ j ) e ϵ j / k T d ( ϵ j / k T ) , q i j ( T ) = 8.63 × 10 6 g i T 1 / 2 e E i j / k T Υ ( T ) c m 3 s 1
where E ij = E j E i is in Ry, T is in K, i.e., 1/kT = 157885/T.

3. Data Description of NORAD-Atomic-Data

The NORAD-Atomic-Data webpage [1] contains general information on the data, such as description of the names of the files and notation, accuracy information, and data tables. It has the two data tables, one with nuclear charge Z lower and the other with higher than 28. The elements with Z 28 are H, He, C, N, O, F, Ne, Na, Mg, Al, Si, P, S, Cl, Ar, Ca, Ti, Cr, Fe and Ni. Since data are added with publications, each element has results for one, but typically more, ions and one or more atomic processes of photoexcitation, photoionizaton, electron–ion recombination, and electron impact excitation. As explained above, each process corresponds to the number of data files. The elements with Z > 28 are Br, W, Pt, Au, Pb, U. The atomic data for them contain energies and various types of transitions (E1, E2, E3, M1, M2) of their ions. Files containing K α and K β transitions and lifetimes for levels of these ions, obtained under publications, are expected to be added.
Each row in the atomic data Table 1 and Table 2 specifies the ion spectrum name and provides files for various atomic processes along the columns as shown in Figure 3. The names of the files are defined on the web page. Each atomic data file starts with the reference, the atomic process, contents of the file, description of data, and table of data. Some sample data files are described below.
The tables of calculated energies contain L S states or fine structure levels with spectroscopic identification. The identification is carried out after computation by the R-matrix method. The formats of the tables of energies obtained from the R-matrix method, either in L S coupling or BPRM method, are different from those obtained from SUPERSTRUCTURE. SS assigns a single spectroscopic designation for a level that corresponds to the highest mixing coefficient. Energies in L S coupling approximation obtained from the R-matrix method are also uniquely identified with a single designation but in a different format. These energies are identified based on maximum channel percentage contribution and quantum defects. However, a BPRM level has one or more than one possible designation since contributions to the mixing coefficients outside the R-matrix boundary are not determined.
Table 1 is a table of energies for Fe XIV that have been obtained using the BPRM method [26] and gives an example of the energy format. The levels have been identified with spectroscopic designation and are grouped together as fine structure levels of an L S term. In addition to this format, the energy file also contains the same set of energies but listed in J π order for modeling purposes. All notations in the file are in ASCII.
Tables of transitions, photoionization from the BPRM method and electron–ion recombination from the unified method contain numerical data for direct applications. The files have references at the top and a description of data below it. The initial and final levels of transitions, and levels for which photoionization cross-sections have been obtained from the R-matrix calculations and recombination rates and cross-sections from the unified method are encoded with numbers. These numerical identifications can be easily decoded, following the notes in the file and also matching the number with that in the energy file. A couple of samples of transition data files are given below. A few illustrations of use of photoionization data are given in the next Accuracy section. Table 2 illustrates the numerical format of transitions where transitions in Fe XIV have been chosen. Compared to this numerical format, the SS tables of transitions are more descriptive spectroscopically.
NORAD-Atomic-Data also contains an additional file containing a set of transitions obtained from the BPRM method but with full spectroscopic designation (hence no need to use the energy file) for diagnostics of lines. This set corresponds to transitions among levels that have been observed, for example, the available observed energy levels from the NIST website [27]. Figure 4 gives a screenshot of a sample format of such a table. It presents fine-structure transitions in Fe XV with spectroscopic notation [28] as an example of transitions. Similar to the conventional format in the NIST table, fine structure transitions here have been grouped together as components of a L S multiplet.
References of papers [29,30,31,32,33,34,35,36,37,38,39,40,41,42,43,44,45,46,47,48,49,50,51,52,53,54,55,56,57,58,59,60,61,62,63,64,65,66,67,68,69,70,71,72,73,74,75,76,77,78,79,80,81,82,83,84,85,86,87,88,89,90,91,92,93,94,95,96,97,98,99,100,101,102,103,104,105,106,107,108,109,110,111], which reported the atomic data of various processes in publications are added at end of the references which have been referred to in the text.

4. Accuracy of Data and Benchmarking

As mentioned, the atomic data at NORAD-Atomic-Data correspond to use of the R-matrix method with the close coupling approximation and atomic structure calculations with the Thomas–Fermi–Dirac–Amaldi potential for wave functions and energies. The results have been obtained in several approximations, such as L S coupling, fine structure splitting using algebraic transformation, relativistic Breit–Pauli approximation.
The R-matrix method with the CC approximation is known to be the most powerful approach to study atomic processes. The accuracy of atomic data computed depends on optimizations of a number of factors, such as (i) accuracy on the target or core ion wave functions which initiate the R-matrix computations, (ii) number of core ion excitations included in the wave function expansion, (iii) inclusion of relevant configurations in the bound-channel expansion (the second term of the close-coupling wave function expansion) that contribute to the total wave function expansion, (iv) the size of the R-matrix basis set representing the wave function in the inner region of the R-matrix sphere and (v) the size of the R-matrix sphere. During the study of an atomic process for an ion, a best possible balanced condition with these optimizations, computational power at OSC and time required for completion of computation is reached. Hence, accuracy of the atomic data is ion-specific, that is, it depends on the accuracy of the wave function representing the ion for the atomic process.
The accuracy for the Thomas–Fermi–Dirac–Amaldi potential for atomic structure calculations depends on the number of configurations and scaling of the orbital wave functions. SS can handle fewer of configurations than what R-matrix codes can do. R-matrix codes can get transitions, energies up to n = 10. However, the accuracy of SS can reach to that of program GRASP [112] in the Dirac–Hartree–Fock approximation for many cases, but SS is more robust than other higher accuracy codes in computing data with consistent accuracy except for very weak transitions.
For the extensive amount of work carried out under the OP and IP, the accuracy of data varied from less than 1% to 15% for most cases, but some data had larger differences from the existing accurate data in the literature. Based on the ab initio nature and consideration of a large number of configurations, and inclusion of relativistic effects, the accuracy for the R-matrix results, depending on the ion, can be estimated as follows:
(i)
from less than 1 to 20% in L S coupling approximation,
(ii)
from less than 1 to 50% for fine-structure splitting of LS multiplets using algebraic transformation,
(iii)
from less than 1 to 15% for relativistic Breit–Pauli approximations.
For SS results in the Breit–Pauli approximation, the accuracy has been found to vary between less than 1% and 30–40% for transition rates.
One crucial test of accuracy for theoretical results is done through benchmarking with experimental measurements. Theoretical photoionization cross sections at NORAD-Atomic-Data have been benchmarked with measured spectra of photoionization at different experimental setups as follows:
(1)
with Advanced Light Source (ALS) at Lawrence Berkeley National Lab [113,114,115,116,117],
(2)
with Aarhus University set-up in Denmark [118,119],
(3)
with Orsay Lab at University De Paris-SUD set up in France [120,121],
(4)
with BESSY II set-up in Germany [122,123],
(5)
with pulsed-laser excitation and ionization atoms in an atomic beam at University of Nebraska [124].
Recombination cross-sections from unified method at NORAD-Atomic-Data have been benchmarked with measured spectra at experimental setups as follows:
(1)
CRYRING at Stockholm in Switzerland [125],
(2)
Test Storage Ring (TSR), the heavy ion storage ring at Heidelberg, Germany [126].
Most users of NORAD-Atomic-Data are astronomers. physicists, and engineers. A few examples of applications are given below:
  • Physics: Photoionization cross-sections from NORAD-Atomic-Data were used to benchmark the cross-sections of N IV measured at the synchrotron facility BESSY II setup by Simon et al. [122] (Figure 5)
  • Astronomy: Figure 6 shows that the use of detailed photoionization cross sections [127] available at NORAD for Cr-to-Fe ratio as a probe for chemical evolution between NLTEanalysis of Cr I and Cr II lines resulted in good agreement [128].
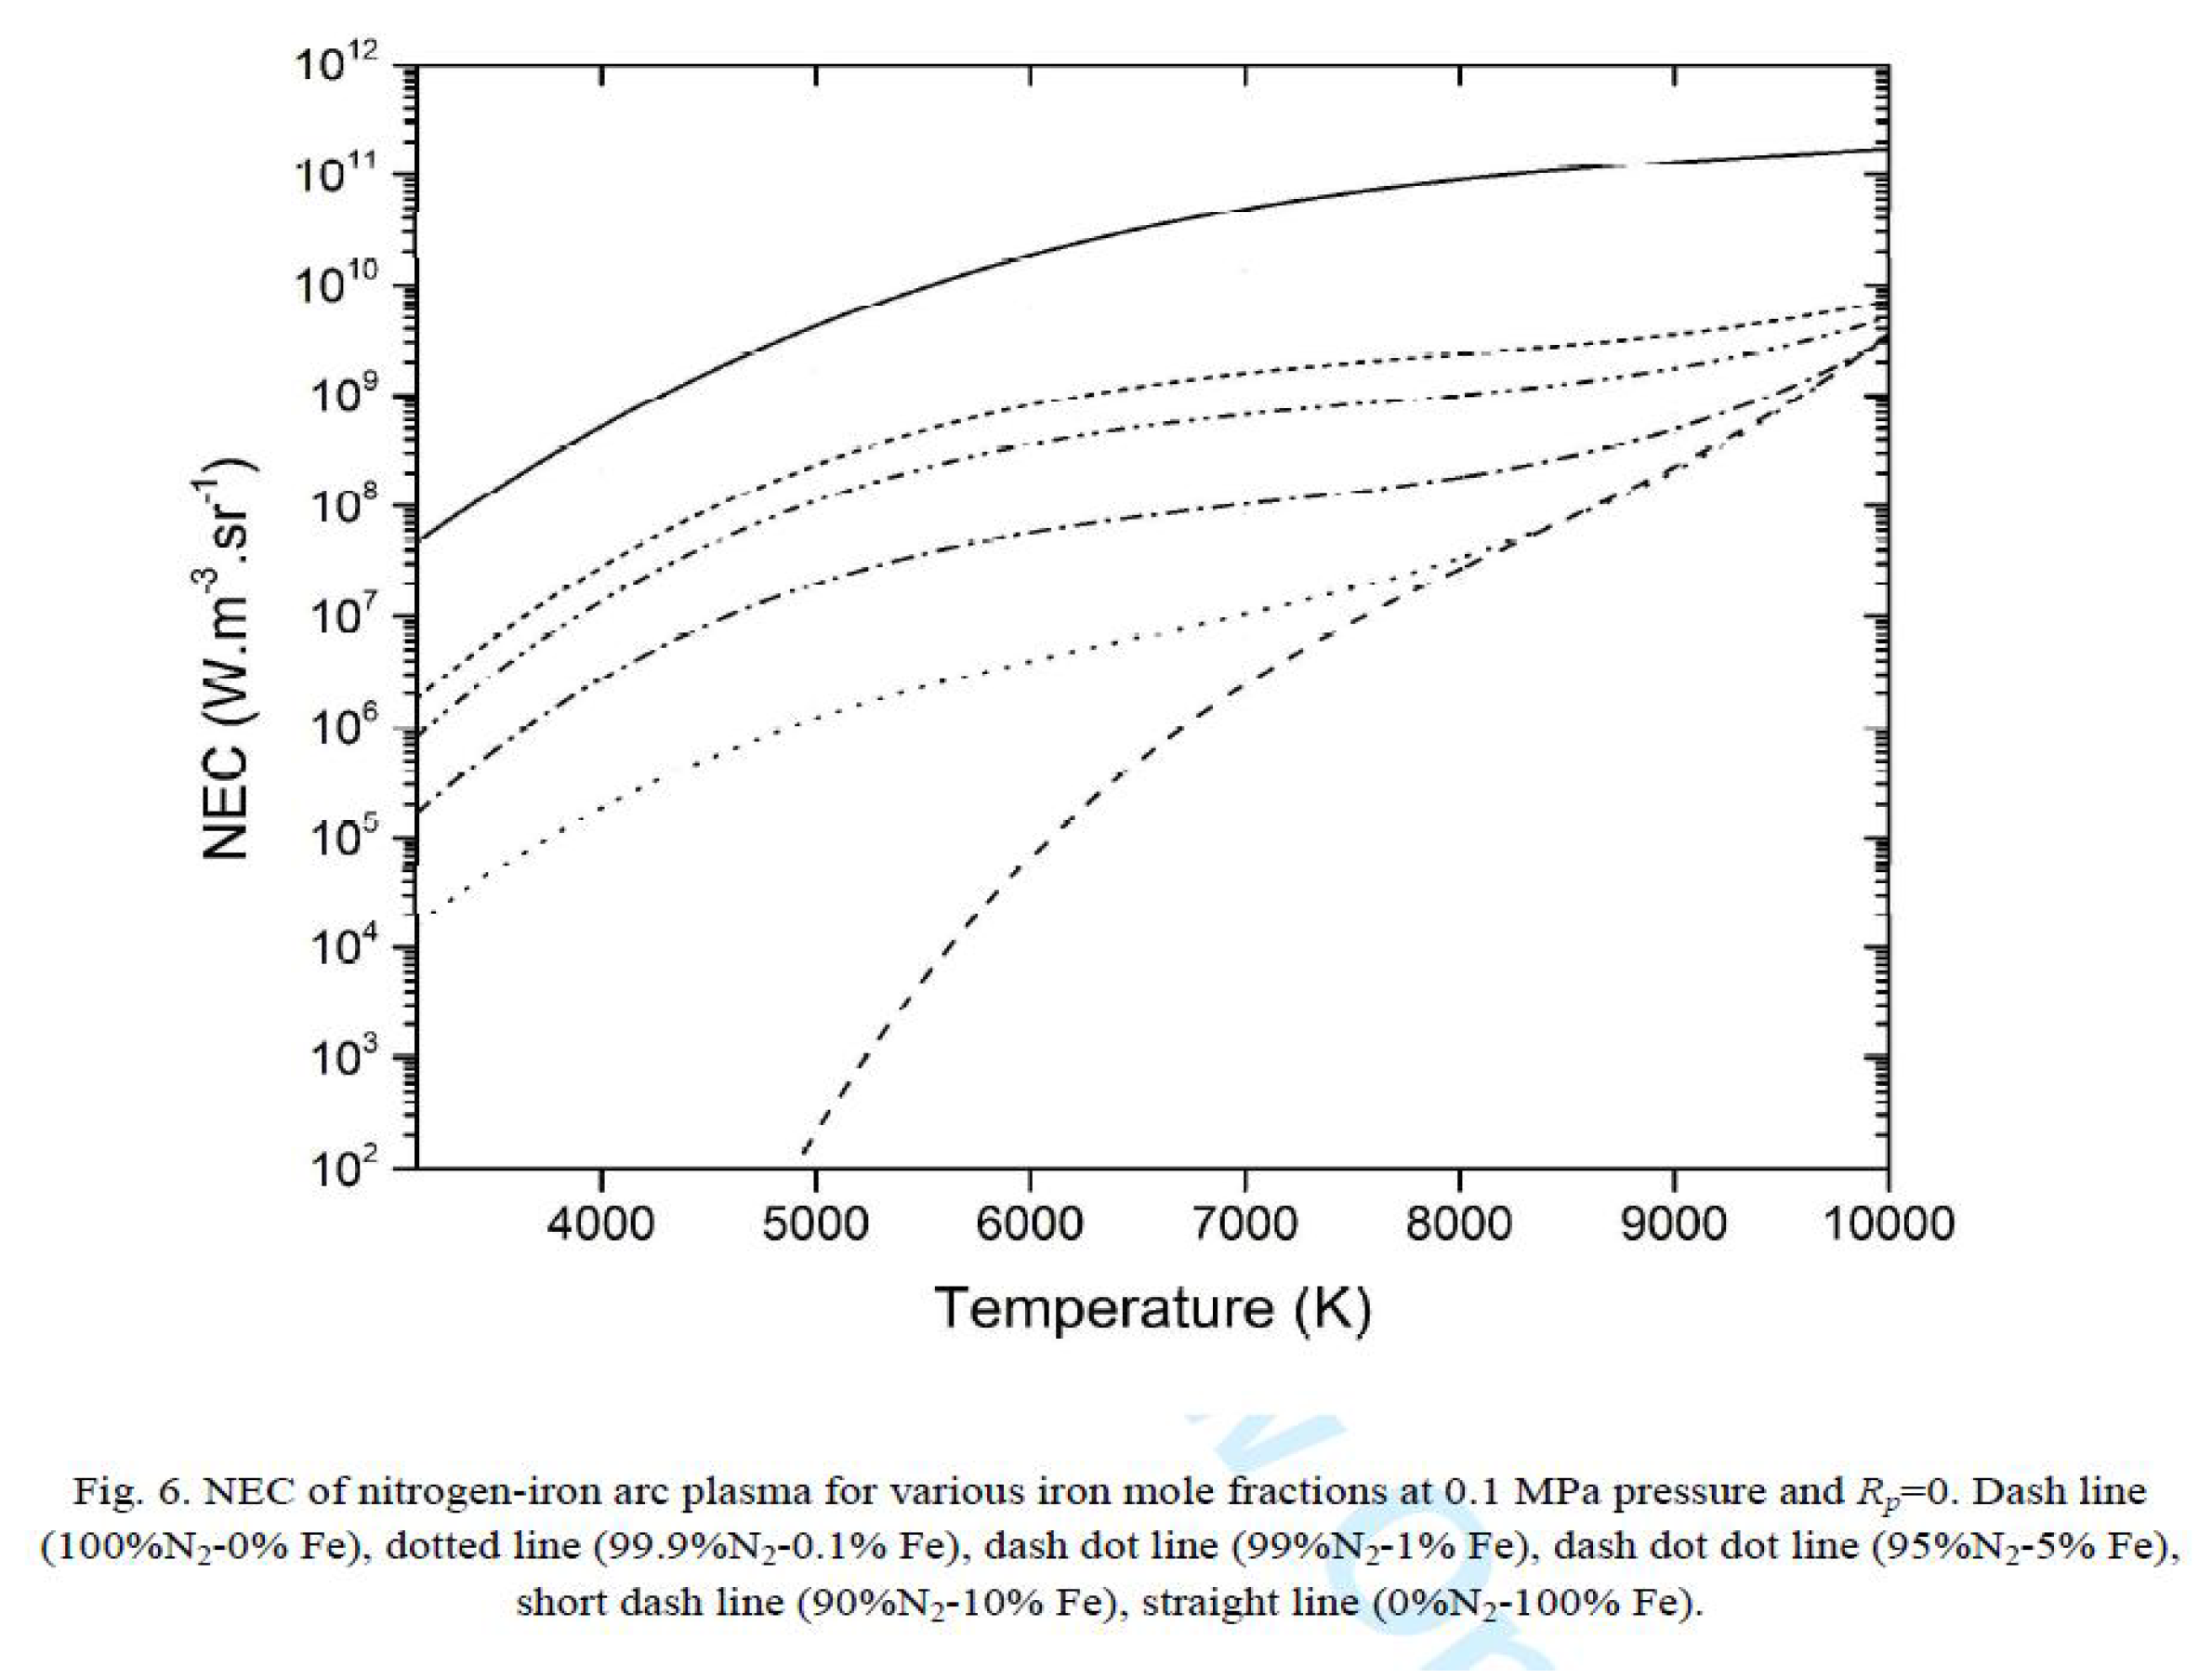
  • Engineering: Adeneh et al. [129] who studied thermodynamic and radiative properties of electrical discharge machining (EDM) plasmas for temperature up to 10,000 K and pressure range 0.1–1 MPa using atomic data from NORAD-Atomic-Data, find an increase in net emission coefficient (NEC) with different amount of iron contamination in nitrogen and sharp cooling of the plasma by iron contamination as shown in Figure 7 taken from [129].

5. Conclusions

An overview on the contents, theoretical outline for the methods used for the data, accuracy and benchmarking of the online database, NORAD-Atomic-Data, is presented. Future directions are:
(i)
include more data with publications,
(ii)
include computer programs that can read the data files and process the data to calculate the quantities of interest,
(iii)
introduce a plotting feature,
(iv)
an option for selection of partial data, such as, for a particular wavelength range.

Funding

This research had partial supports from NASA, NSF, DOE, and Ohio Supercomputer Center.

Acknowledgments

SNN acknowledges support from the Astronomy Department of the Ohio State University for maintaining the database.

Conflicts of Interest

The author declares no conflict of interest.

References

  1. Nahar, S.N. NaharOSURadiative(NORAD)-Atomic-Data. The Ohio State University. 2007. Available online: http://norad.astronomy.osu.edu/ (accessed on 27 September 2020).
  2. IAEA Data page for database links. Available online: https://www-amdis.iaea.org/databases.php (accessed on 27 September 2020).
  3. CfA Harvard Data for database links. Available online: https://www.cfa.harvard.edu/amp/ampdata/databases.html (accessed on 27 September 2020).
  4. The Opacity Project; The Opacity Project Team, Institute of Physics Publishing: London, UK, 1995; Volume 1.
  5. Hummer, D.G.; Berrington, K.A.; Eissner, W.; Pradhan, A.K.; Saraph, H.E.; Tully, J.A. Atomic data from the IRON Project. 1: Goals and methods. Astron. Astrophys. 1993, 279, 298–309. [Google Scholar]
  6. Cunto, W.; Mendoza, C.; Ochsenbein, F.; Zeippen, C.J. TOPbase at the CDS. Astron. Astrophys. 1993, 275, L5–L8. [Google Scholar]
  7. TOPbase. 1992. Available online: http://cdsweb.u-strasbg.fr/topbase/topbase.html (accessed on 27 September 2020).
  8. TIPbase. 2001. Available online: http://cdsweb.u-strasbg.fr/tipbase/home.html (accessed on 27 September 2020).
  9. Seaton, M.J. Atomic data for opacity calculations. I. General description. J. Phys. B 1987, 20, 6363–6378. [Google Scholar] [CrossRef]
  10. Berrington, K.A.; Burke, P.G.; Butler, K.; Seaton, M.J.; Storey, P.J.; Taylor, K.T.; Yan, Y. Atomic data for opacity calculations. II. Computational methods. J. Phys. B 1987, 20, 6379–6397. [Google Scholar] [CrossRef]
  11. Berrington, K.A.; Eissner, W.; Norrington, P.H. RMATRIX1: Belfast atomic R-matrix codes. Comput. Phys. Commun. 1995, 92, 290–420. [Google Scholar] [CrossRef]
  12. Nahar, S.N.; Pradhan, A.K. Atomic Data For Opacity Calculations: XVI. Photoionization and oscillator strengths of Si-like ions Si0, S2+, Ar4+, Ca6+. J. Phys. B 1993, 26, 1109. [Google Scholar] [CrossRef]
  13. Nahar, S.N. Transition probabilities for dipole allowed fine structure transitions in Si-like ions: Si I, S III, Ar V, and Ca VII. Phys. Scr. 1993, 48, 297. [Google Scholar] [CrossRef]
  14. Nahar, S.N.; Pradhan, A.K. Large-scale Breit-Pauli R-matrix calculations for transition probabilities of Fe V. Phys. Scr. 2000, 61, 675–689. [Google Scholar] [CrossRef] [Green Version]
  15. Nahar, S.N. Oscillator Strengths and Transition Probabilities from Breit-Pauli R-matrix Method: Ne IV. At. Data Nucl. Data Tables 2014, 100, 1322–1336. [Google Scholar] [CrossRef]
  16. Nahar, S.N.; Pradhan, A.K. Electron-ion recombination in the close coupling approximation. Phys. Rev. Lett. 1992, 68, 1488–1491. [Google Scholar] [CrossRef] [Green Version]
  17. Nahar, S.N.; Pradhan, A.K. Unified Treatment of Electron-Ion Recombination in the Close Coupling Approximation. Phys. Rev. A 1994, 49, 1816. [Google Scholar] [CrossRef] [PubMed] [Green Version]
  18. Nahar, S.N. Total electron-ion recombination for Fe III. Phys. Rev. A 1996, 53, 2417–2424. [Google Scholar] [CrossRef] [PubMed] [Green Version]
  19. Eissner, W.; Jones, M.; Nussbaumer, H. Techniques for the calculation of atomic structures and radiative data including relativistic corrections. Comput. Phys. Commun. 1974, 8, 270–306. [Google Scholar] [CrossRef]
  20. Nahar, S.N.; Eissner, W.; Chen, G.X.; Pradhan, A.K. Atomic data from the Iron Project-LIII. Relativistic allowed and forbidden transitionstic probabilities for Fe XVII. Astron. Astrophys. 2003, 408, 789–8016. [Google Scholar] [CrossRef] [Green Version]
  21. Burke, P.G.; Robb, W.D. R-matrix theory of atomic processes. Adv. At. Mol. Phys. 1975, 11, 143–214. [Google Scholar]
  22. OPServer Site. Available online: http://opacities.osc.edu (accessed on 27 September 2020).
  23. Pradhan, A.K.; Nahar, S.N. Atomic Astrophysics and Spectroscopy; Cambridge University Press: Cambridge, UK, 2011. [Google Scholar]
  24. Bell, R.H.; Seaton, M.J. Dielectronic recombination: I. General theory. J. Phys. B 1985, 18, 1589–1629. [Google Scholar] [CrossRef]
  25. Zhang, H.L.; Nahar, S.N.; Pradhan, A.K. Close coupling R-matrix calculations for electron-ion recombination cross sections. J. Phys. B 1999, 32, 1459–1479. [Google Scholar] [CrossRef] [Green Version]
  26. Nahar, S.N. Fine structure transitions in Fe XIV. New Astron. 2013, 21, 8–16. [Google Scholar] [CrossRef]
  27. NIST. Available online: https://physics.nist.gov/PhysRefData/ASD/levels_form.html (accessed on 27 September 2020).
  28. Nahar, S.N. Allowed and Forbidden Transition Parameters for Fe XV. At. Data Nucl. Data Tables 2009, 95, 577–605. [Google Scholar] [CrossRef] [Green Version]
  29. Nahar, S.N.; Pradhan, A.K.; Montenegro, M. Resonant theranostics: A New Nano-Biotechnological Method for Cancer Treatment Using X-ray Spectroscopy of Nanoparticles. In Simulations in Nanobiotechnology; Eom, K., Ed.; CRC Press-Taylor & Francis Group: Boca Raton, FL, USA, 2011; pp. 305–330. [Google Scholar]
  30. Nahar, S.N. Characteristic features in photoionization of Fe XIX. New Astron. 2019, 73, 101277. [Google Scholar] [CrossRef]
  31. Nahar, S.N. Photoionization of fine structure levels of Ne III. New Astron. 2019, 67, 97–102. [Google Scholar]
  32. Nahar, S.N. Photoionization of Ca XV with high energy features. New Astron. 2017, 51, 69–73. [Google Scholar]
  33. Nahar, S.N. Photoionization cross sections of ground and excited levels of P II. New Astron. 2017, 50, 19–24. [Google Scholar]
  34. Nahar, S.N.; Pradhan, A.K. Reply to Comment by Blancard et al. (2016) on “Large Enhancement in High-Energy Photoionization of Fe XVII and Missing Continuum Plasma Opacity”. Phys. Rev. Lett. 2016, 117, 249502. [Google Scholar] [PubMed]
  35. Nahar, S.N.; PRadhan, A.K. Large enhancements in high-energy photoionization of Fe XVII and missing continuum plasma opacity. Phys. Rev. Lett. 2016, 116, 235003. [Google Scholar]
  36. Nahar, S.N. Photoionization and electron-ion recombination of Ti I. New Astron. 2016, 46, 1–8. [Google Scholar]
  37. Bailey, J.E.; Nagayama, T.; Loisel, G.P.; Rochau, G.A.; Blancard, C.; Colgan, J.; Cosse, P.; Faussurier, G.; Fontes, C.J.; Gilleron, F.; et al. A higher-than-predicted measurement of iron opacity at solar interior temperatures. Lett. Nat. 2015, 517, 56–59. [Google Scholar]
  38. Nahar, S.N. Photoionization of Ar XVI and Ar XVII. J. Quant. Spectrosc. Radiat. Transf. 2013, 117, 15–20. [Google Scholar]
  39. Nahar, S.N. Photoionization and Electron-Ion Recombination of Fe XVII for high temperature plasmas. J. Quant. Spectrosc. Radiat. Transf. 2012, 113, 1762–1770. [Google Scholar]
  40. Nahar, S.N.; Pradhan, A.K.; Chen, G.X.; Eissner, W. Highly Excited Core Resonances in Photoionization of Fe XVII: Implications for Plasma Opacities. Phys. Rev. A 2011, 83, 053417. [Google Scholar]
  41. Nahar, S.N. High Accuracy Radiative Data for Plasma Opacities. Can. J. Phys. 2011, 89, 439–449. [Google Scholar] [CrossRef]
  42. Nahar, S.N.; Montenegro, M.; Eissner, W.; Pradhan, A.K. Low Energy Fine Structure Resonances in Photoionization of O II. Phys. Rev. A Brief Rep. 2010, 82, 065401. [Google Scholar] [CrossRef] [Green Version]
  43. Nahar, S.N. Photoionization and electron ion recombination of He I. New Astron. 2010, 15, 417–426. [Google Scholar] [CrossRef] [Green Version]
  44. Nahar, S.N. Electron-Ion Recombination and Photoionization of Fe XXI. J. Quant. Spectrosc. Radiat. Transf. 2008, 109, 2731–2742. [Google Scholar] [CrossRef] [Green Version]
  45. Nahar, S.N. Photoionization cross sections of Fe XXI. J. Quant. Spectrosc. Radiat. Transf. 2008, 109, 2417–2426. [Google Scholar] [CrossRef] [Green Version]
  46. Nahar, S.N. Electron-Ion Recombination Rate Coefficients and Photoionization Cross Sections for Al XI, Al XII, Si XII, Si XIV for UV and X-ray modeling. New Astron. 2008, 13, 619–638. [Google Scholar] [CrossRef] [Green Version]
  47. Nahar, S.N. Electron-Ion Recombination Rate Coefficients and Photoionization Cross Sections for S XIV and S XV for X-ray and UV modeling. Open Astron. J. 2008, I, 1–26. [Google Scholar] [CrossRef] [Green Version]
  48. Nahar, S.N. Electron-Ion Recombination Rate Coefficients and Photoionization Cross Sections for Astrophysically Abundant Elements. XII. Na IX, Na X, Mg X, and Mg XI for UV and X-ray modeling. Astrophys. J. Suppl. 2006, 167, 315. [Google Scholar] [CrossRef] [Green Version]
  49. Nahar, S.N. Electron-Ion Recombination Rate Coefficients and Photoionization Cross Sections for Astrophysically Abundant Elements. XI. N V-VI and F VII-VIII for UV and X-ray modeling. Astrophys. J. Suppl. 2006, 164, 280. [Google Scholar] [CrossRef] [Green Version]
  50. Nahar, S.N.; Pradhan, A.K. Electron-Ion Recombination Rate Coefficients and Photoionization Cross Sections for Astrophysically Abundant Elements. X. Ne VIII and Ne IX for UV and X-ray modeling. Astrophys. J. Suppl. 2006, 162, 417. [Google Scholar] [CrossRef] [Green Version]
  51. Nahar, S.N. Electron-Ion Recombination Rate Coefficients and Photoionization Cross Sections for Astrophysically Abundant Elements. IX. Ni XXVI and Ni XXVII for UV and X-ray modeling. Astrophys. J. Suppl. 2005, 158, 80. [Google Scholar] [CrossRef] [Green Version]
  52. Nahar, S.N.; Pradhan, A.K. Self-Consistent R-matrix Approach To Photoionization And Unified Electron-Ion Recombination. In Special Issue on Photoeffect; Radiation Physics and Chemistry; Pratt, R.H., Manson, S.T., Eds.; Elsevier: Amsterdam, The Netherlands, 2004; Volume 70, pp. 323–344. [Google Scholar]
  53. Nahar, S.N. Electron-Ion Recombination Rate Coefficients and Photoionization Cross Sections for Astrophysically Abundant Elements VIII. Ar XIII with new features. Astrophys. J. Suppl. 2004, 156, 93–103. [Google Scholar] [CrossRef]
  54. Delahaye, F.; Nahar, S.N.; Pradhan, A.K.; Zhang, H.L. Resolution and accuracy of resonances in R-matrix cross sections. J. Phys. B 2004, 37, 2585. [Google Scholar] [CrossRef] [Green Version]
  55. Nahar, S.N.; Pradhan, A.K. Electron-Ion Recombination Rate Coefficients, Photoionization Cross Sections for Astrophysically Abundant Elements. VII. Relativistic calculations for O VI and O VII for UV and X-ray modeling. Astrophys. J. Suppl. 2003, 149, 239. [Google Scholar] [CrossRef]
  56. Pradhan, A.K.; Chen, G.X.; Delahaye, F.; Nahar, S.N.; Oelgoetz, J. X-ray absorption via Kα resonance complexes in oxygen ions. Mon. Not. R. Astron. Soc. 2003, 341, 1268. [Google Scholar] [CrossRef] [Green Version]
  57. Nahar, S.N.; Bautista, M.A. Electron-Ion Recombination Rate Coefficients and Photoionization Cross Sections for Astrophysically Abundant Elements VI. Ni II. Astrophys. J. Suppl. 2001, 137, 201. [Google Scholar] [CrossRef] [Green Version]
  58. Zhang, H.L.; Nahar, S.N.; Pradhan, A.K. Relativistic close coupling calculations for photoionization and recombination of Ne-like Fe XVII. Phys. Rev. A 2001, 64, 032719. [Google Scholar] [CrossRef] [Green Version]
  59. Nahar, S.N.; Pradhan, A.K.; Zhang, H.L. Electron-Ion Recombination Rate Coefficients and Photoionization Cross Sections for Astrophysically Abundant Elements. V. Relativistic Calculations for Fe XXIV and Fe XXV for X-ray Modeling. Astrophys. J. Suppl. 2001, 133, 255–267. [Google Scholar] [CrossRef] [Green Version]
  60. Nahar, S.N.; Pradhan, A.K.; Zhang, H.L. Electron-Ion Recombination Rate Coefficients and Photoionization Cross Sections for Astrophysically Abundant Elements IV. Relativistic calculations for C IV and C V for UV and X-ray modeling. Astrophys. J. Suppl. 2000, 131, 375–389. [Google Scholar] [CrossRef] [Green Version]
  61. Nahar, S.N. Electron-Ion Recombination Rate Coefficients and Photoionization Cross Sections for Astrophysically Abundant Elements III. Si-Sequence Ions: Si I, S III, Ar V, Ca VII, Fe XIII. Astrophys. J. Suppl. 2000, 126, 537. [Google Scholar] [CrossRef] [Green Version]
  62. Nahar, S.N.; Bautista, M.A. Electron-ion recombination of Fe V. Astrophys. J. Suppl. 1999, 120, 327. [Google Scholar] [CrossRef] [Green Version]
  63. Nahar, S.N. Electron-Ion Recombination Rate Coefficients, Photoionization Cross Sections, and Ionization Fractions for Astrophysically Abundant Elements II. Oxygen Ions. Astrophys. J. Suppl. 1999, 120, 131. [Google Scholar] [CrossRef] [Green Version]
  64. Nahar, S.N.; Bautista, M.A.; Pradhan, A.K. Electron-ion recombination of Fe IV. Phys. Rev. A 1998, 58, 4593. [Google Scholar] [CrossRef] [Green Version]
  65. Nahar, S.N. Photoionization cross sections and oscillator strengths for oxygen ions: O I-O VIII. Phys. Rev. A 1998, 58, 3766–3782. [Google Scholar] [CrossRef] [Green Version]
  66. Nahar, S.N.; Bautista, M.A.; Pradhan, A.K. Electron-ion recombination of neutral iron. Astrophys. J. 1997, 479, 497. [Google Scholar] [CrossRef] [Green Version]
  67. Nahar, S.N. Electron-ion recombination of Fe II. Phys. Rev. A 1997, 55, 1980–1987. [Google Scholar] [CrossRef]
  68. Nahar, S.N. Photoionization cross sections and oscillator strengths for Fe III. Phys. Rev. A 1996, 53, 1545–1552. [Google Scholar] [CrossRef] [Green Version]
  69. Nahar, S.N. Electron-ion recombination rate coefficients for Si I, Si II, S II, S III, C II, and C-like ions C I, N II, O III, F IV, Ne V, Na VI, Mg VII, Al VIII, Si IX, and S XI. Astrophys. J. Suppl. 1995, 101, 423–434. [Google Scholar] [CrossRef]
  70. Nahar, S.N. Electron-ion recombination rate coefficients for Si I, Si II, S II, S III, C II, and C-like ions C I, N II, O III, F IV, Ne V, Na VI, Mg VII, Al VIII, Si IX, and S XI. Erratum Astrophys. J. Suppl. 1996, 106, 213–214. [Google Scholar] [CrossRef]
  71. Nahar, S.N.; PRadhan, A.K. Unified electron-ion recombination rate coefficients of Silicon and Sulfur ions. Astrophys. J. 1995, 447, 966. [Google Scholar] [CrossRef]
  72. Nahar, S.N.; PRadhan, A.K. Atomic Data For Opacities Calculations. XX: Photoionization cross sections and oscillator strengths for Fe II. J. Phys. B 1994, 27, 429. [Google Scholar] [CrossRef] [Green Version]
  73. Dourneuf, M.L.; Nahar, S.N.; Pradhan, A.K. Photoionization of Fe+. J. Phys. B 1993, 26, L1. [Google Scholar] [CrossRef]
  74. Nahar, S.N.; Pradhan, A.K. New results for photoionization and recombination of astrophysically abundant atoms and ions: The carbon sequence. Astrophys. J. 1992, 397, 729. [Google Scholar] [CrossRef] [Green Version]
  75. Nahar, S.N.; Pradhan, A.K. Photoionization of highly charged carbon like ions. Phys. Rev. A 1992, 45, 7887–7894. [Google Scholar] [CrossRef] [Green Version]
  76. Nahar, S.N.; Pradhan, A.K. Photoionization and electron-ion recombination: The carbon sequence. Phys. Rev. A 1992, 44, 2935–2948. [Google Scholar] [CrossRef] [Green Version]
  77. Celik, G.; Ates, S.; Nahar, S.N. Energies, electric dipole (E1), quadrupole (E2), octupole (E3) and magnetic dipole (M1), quadrupole (M2) transition rates for Ca XII, Ti XIV, Cr XVI, Fe XVIII and Ni XX. Indian J. Phys. 2020, 94, 565–574. [Google Scholar] [CrossRef]
  78. Nahar, S.N. Oscillator Strengths and Transition Probabilities for Allowed and Forbidden Transition in Fe XIX. At. Data Nucl. Data Tables 2011, 97, 403–425. [Google Scholar] [CrossRef]
  79. Nahar, S.N. Oscillator Strengths and Transition Probabilities of O II. At. Data Nucl. Data Tables 2010, 96, 863–877. [Google Scholar] [CrossRef] [Green Version]
  80. Nahar, S.N. Allowed and Forbidden Transition Parameters for Fe XXII. At. Data Nucl. Data Tables 2009, 96, 26–51. [Google Scholar] [CrossRef] [Green Version]
  81. Nahar, S.N.; Eissner, W.; Sur, C.; Pradhan, A.K. A comprehensive set of UV and X-Ray Radiative Transition Rates for Fe XVI. Phys. Scr. 2009, 79, 035401. [Google Scholar] [CrossRef]
  82. Nahar, S.N.; Pradhan, A.K.; Sur, C. Oscillator strengths and radiative transition rates for Kα lines in gold X-ray spectra: 1s-2p transitions. J. Quant. Spectrosc. Radiat. Transf. 2008, 109, 1951–1959. [Google Scholar]
  83. Sur, C.; Nahar, S.N.; Pradhan, A.K. Kα transition probabilities for Fluorine-like ions from neon to gold: Ab initio relativistic coupled-cluster calculations. Phys. Rev. A 2008, 77, 052502. [Google Scholar]
  84. Nahar, S.N. Atomic data from the Iron Project LXII. Allowed and forbidden transitions in Fe XVIII in Breit-Pauli approximation. Astron. Astrophys. 2006, 457, 721–728. [Google Scholar]
  85. Nahar, S.N. Atomic data from the Iron Project LXI. Radiative E1, E2, E3, and M1 transtion probabilities for Fe IV. Astron. Astrophys 2006, 448, 779. [Google Scholar] [CrossRef] [Green Version]
  86. Nahar, S.N.; Pradhan, A.K. Atomic data from the Iron Project LIX. New radiative transition probabilities for Fe IV including fine structure. Astron. Astrophys. 2005, 437, 345. [Google Scholar] [CrossRef]
  87. Nahar, S.N. Atomic data from the Iron Project LIV. Relativistic calculations for allowed and forbidden fine structure transitions in Fe XX. Astron. Astrophys. 2003, 413, 779. [Google Scholar] [CrossRef] [Green Version]
  88. Nahar, S.N. Relativistic fine structure oscillator strengths for Li-like ions: C IV-Si XII, S XIV, Ar XVI, Ca XVIII, Ti XX, Cr XXII, and Ni XXVI. Astron. Astrophys. 2002, 389, 716–728. [Google Scholar]
  89. Nahar, S.N. Fine structure radiative transitions in C II and C III using the Breit-Pauli R-matrix method. At. Data Nucl. Data Tables 2002, 80, 205. [Google Scholar] [CrossRef] [Green Version]
  90. Nahar, S.N. Atomic data from the Iron Project XLV. Relativistic transition probabilities for carbon-like Ar XIII and Fe XXI using Breit-Pauli R-matrix method. Astron. Astrophys. Suppl. Ser. 2000, 127, 253. [Google Scholar]
  91. Nahar, S.N.; Delahaye, F.; Pradhan, A.K.; Zeippen, C.J. Atomic data from the Iron Project XLIII. Transition Probabilities For Fe V. Astron. Astrophys. Suppl. Ser. 2000, 144, 141. [Google Scholar]
  92. Nahar, S.N. Oscillator strengths for dipole allowed fine structure transitions in Fe XIII. At. Data Nucl. Data Tables 1999, 72, 129. [Google Scholar] [CrossRef] [Green Version]
  93. Nahar, S.N.; Pradhan, A.K. Atomic data from the Iron Project XXXV. Relativistic fine structure oscillator strengths for Fe XXIV and Fe XXV. Astron. Astrophys. Suppl. Ser. 1999, 135, 347. [Google Scholar] [CrossRef] [Green Version]
  94. Nahar, S.N. Oscillator strengths for dipole-allowed fine structure transitions in Si II. At. Data Nucl. Data Tables 1998, 68, 183. [Google Scholar] [CrossRef] [Green Version]
  95. Nahar, S.N. Transition probabilities for the dipole allowed fine structure transitions in S II. Phys. Scr. 1997, 55, 200. [Google Scholar] [CrossRef] [Green Version]
  96. Nahar, S.N.; Pradhan, A.K. Atomic data from the Iron Project XVII. Radiative transition probabilities for dipole allowed and forbidden transitions in Fe III. Astron. Astrophys. Suppl. 1996, 119, 509. [Google Scholar] [CrossRef]
  97. Nahar, S.N. Atomic Data from the IRON Project VII. Radiative Transition Probabilities for Fe II. Astron. Astrophys. 1993, 293, 967. [Google Scholar]
  98. Westphal, M.; Lim, S.N.; Nahar, S.N.; Chowdhury, E.; Pradhan, A.K. Broadband, monochromatic and quasi-monochromatic x-ray propagation in multi-Z media for imaging and diagnostics. Phys. Med. Biol. 2017, 62, 6361–6378. [Google Scholar] [CrossRef]
  99. Nahar, S.N.; Pradhan, A.K. Kα resonance fluorescence in Al, Ti, Cu and potentialapplications for X-ray sources. J. Quant. Spectrosc. Radiat. Transf. 2015, 155, 32–48. [Google Scholar] [CrossRef] [Green Version]
  100. Lim, S.N.; Pradhan, A.K.; Barth, R.F.; Nahar, S.N.; Nakkula, R.J.; Yang, W.; Palmer, A.M.; Turro, C.; Weldon, M.; Bell, E.H.; et al. Tumoricidal activity of low energy 160 ke VX-rays versus 6 MV photons against platinum sensitized F98 glioma cells. J. Rad. Res. 2015, 56, 77–89. [Google Scholar] [CrossRef] [Green Version]
  101. Lim, S.; Montenegro, M.; Pradhan, A.K.; Nahar, S.N.; Chowdhury, E.; Yu, Y. Broadband and Monochromatic X-ray Irradiation of Platinum: Monte Carlo Simulations for Dose Enhancement Factors and Resonant Theranostics. (refereed). In World Congress on Medical Physics and Biomedical Engineering, IFMBE Proceedings; Long, M., Ed.; Springer: Berlin/Heidelberg, Germany, 2012; Volume 39, pp. 2248–2251. [Google Scholar]
  102. Nahar, S.N.; Pradhan, A.K.; Lim, S. Kα Transition Probabilities for Platinum and Uranium Ions for possible X-ray Biomedical Applications. Can. J. Phys. 2011, 89, 483–494. [Google Scholar] [CrossRef]
  103. Montenegro, M.; Nahar, S.N.; Pradhan, A.K.; Yu, Y.; Huang, K. Monte Carlo Simulations and Atomic Calculations for Auger Processes in Biomedical Nanotheranostics. J. Phys. Chem. A 2009, 113, 12364–12369. [Google Scholar] [CrossRef] [PubMed]
  104. Pradhan, A.K.; Nahar, S.N.; Montenegro, M.; Yu, Y.; Hang, H.L.; Sur, C.; Mrozik, M.; Pitzer, R. Resonant X-ray Enhancement of the Auger Effect in High-Z atoms, molecules, and Nanoparticles: Biomedical Applications. J. Phys. Chem. A 2009, 113, 12356–12363. [Google Scholar] [CrossRef] [PubMed]
  105. Pradhan, A.K.; Yan, Y.; Nahar, S.N.; Silver, E.; Pitzer, R. Computational Methodology For Resonant Nano-Plasma Theranostics For Cancer Treatment. Radiother. Dyn. 2007, 2, 89–93. [Google Scholar]
  106. Naghma, R.; Nahar, S.N.; Pradhan, A.K. Collision strengths for FIR and UV transtions in P III and the phosphorus abundance. MNRAS Lett. 2018, 479, L60–L64. [Google Scholar] [CrossRef]
  107. Dance, M.; Palay, E.; Nahar, S.N.; Pradhan, A.K. Fine structure collision strengths and line ratios for [Ne v] in infrared and optical sources. Mon. Not. R. Astron. Soc. 2018, 435, 1576–1581. [Google Scholar] [CrossRef] [Green Version]
  108. Palay, E.; Nahar, S.N.; Pradhan, A.K.; Eissner, W. Improved collision strengths and line ratios for forbidden [O III] far-infrared and optical lines. Mon. Not. R. Astron. Soc. Lett. 2012, 423, L35–L39. [Google Scholar] [CrossRef] [Green Version]
  109. Montenegro, M.; Eissner, W.; Nahar, S.N.; Pradhan, A.K. Relativistic and correlation effects in electron impact excitation of forbidden transitions of O II. J. Phys. B 2006, 39, 1863. [Google Scholar] [CrossRef] [Green Version]
  110. Pradhan, A.K.; Montenegro, M.; Nahar, S.N.; Eissner, W. [O II] line ratios. Mon. Not. R. Astron. Soc. Lett. 2006, 366, L6. [Google Scholar] [CrossRef]
  111. Nahar, S.N. X-Rays of Heavy Elements for Nanotechnological Applications: W and Pb Ions. In Modern Trends in Physics Research (MTPR-10); Nadi, L.E., Ed.; World Scientific: Singapore, 2013; Volume 2013, pp. 275–285. [Google Scholar]
  112. Grant, I.P.; McKenzie, B.J.; Norrington, P.H.; Mayers, D.F.; Pyper, N.C. An atomic multiconfigurational Dirac-Fock package. Comput. Phys. Comm. 1980, 21, 207–231. [Google Scholar] [CrossRef]
  113. Covington, A.M.; Aguilar, A.; Covington, I.R.; Gharaibeh, M.; Shirley, C.A.; Phaneuf, R.A.; Avarez, I.; Cisneros, C.; Hinojosa, G.; Bozek, J.D.; et al. Photoionization of Metastable O1 Ions: Experiment and Theory. Phys. Rev. Letts. 2001, 87, 243002-1. [Google Scholar] [CrossRef]
  114. Aguilar, A.; Covington, A.M.; Hinojosa, G.; Phaneuf, R.A.; Alvarez, I.; Cisneros, C.; Bozek, J.D.; Dominguez, I.; Sant’Ama, M.M.; Schlachter, A.S.; et al. Absolute Photoionization Cross Section Measurements of O II ions from 29.7 eV to 46.2 eV. Astrophys. J. Suppl. 2003, 146, 467. [Google Scholar] [CrossRef] [Green Version]
  115. Nahar, S.N.; Hernaez, E.M.; Hernaez, L.; Antil, A.; Morales-Mori, A.; Gonzz, O.; Covington, A.M.; Hanstorp, K.C.C.D.; Juoz, A.M.; Hinojosa, G. Photoionization of P+: Experiment and theory. J. Quant. Spectrosc. Radiat. Trans. 2017, 187, 215–223. [Google Scholar] [CrossRef] [Green Version]
  116. Nahar, S.N.; Covington, A.M.; Kilcoyne, D.; Davis, V.T.; Thompson, J.F.; Hernandez, E.M.; Antillon, A.; Juarez, A.M.; Morales-Mori, A.; Hinojosa, G. Single-photon photoionization of oxygen-like Ne III. Int. J. Mass Spectrosc. 2019, 443, 61–69. [Google Scholar] [CrossRef] [Green Version]
  117. Nahar, S.N. Photoionzation features of the ground and excited levels of Cl II and benchmarking with experiment. New Astron. 2021, 82, 101447. [Google Scholar] [CrossRef]
  118. Nahar, S.N. Relativistic photoionization cross sections for C II. Phys. Rev. A 2002, 65, 052702. [Google Scholar] [CrossRef] [Green Version]
  119. Kjeldsen, H.; Kristensen, B.; Folkmann, F.; Andersen, T. Measurements of the absolute photoionization cross section of Fe+ ions from 15.8 to 180 eV. J. Phys. B At. Mol. Opt. Phys. 2003, 25, 3655. [Google Scholar] [CrossRef] [Green Version]
  120. Champeaux, J.-P.; Bizau, J.-M.; Cubaynes, D.; Blancard, C.; Nahar, S.N.; Hitz, D.; Bruncau, J.; Wuilleumier, F.J. Measurements and Calculations of Photoionization Cross Sections of Multiply-Charged Ions in Ground and Metastable States along the Isonuclear Series of Oxygen: O2+ to O4+. Astrophys. J. 2003, 148, 583. [Google Scholar] [CrossRef] [Green Version]
  121. Nahar, S.N. Photoionization cross sections of O II, O III, O IV, and O V: Benchmarking R-matrix theory and experiments. Phys. Rev. A 2004, 69, 042714. [Google Scholar] [CrossRef] [Green Version]
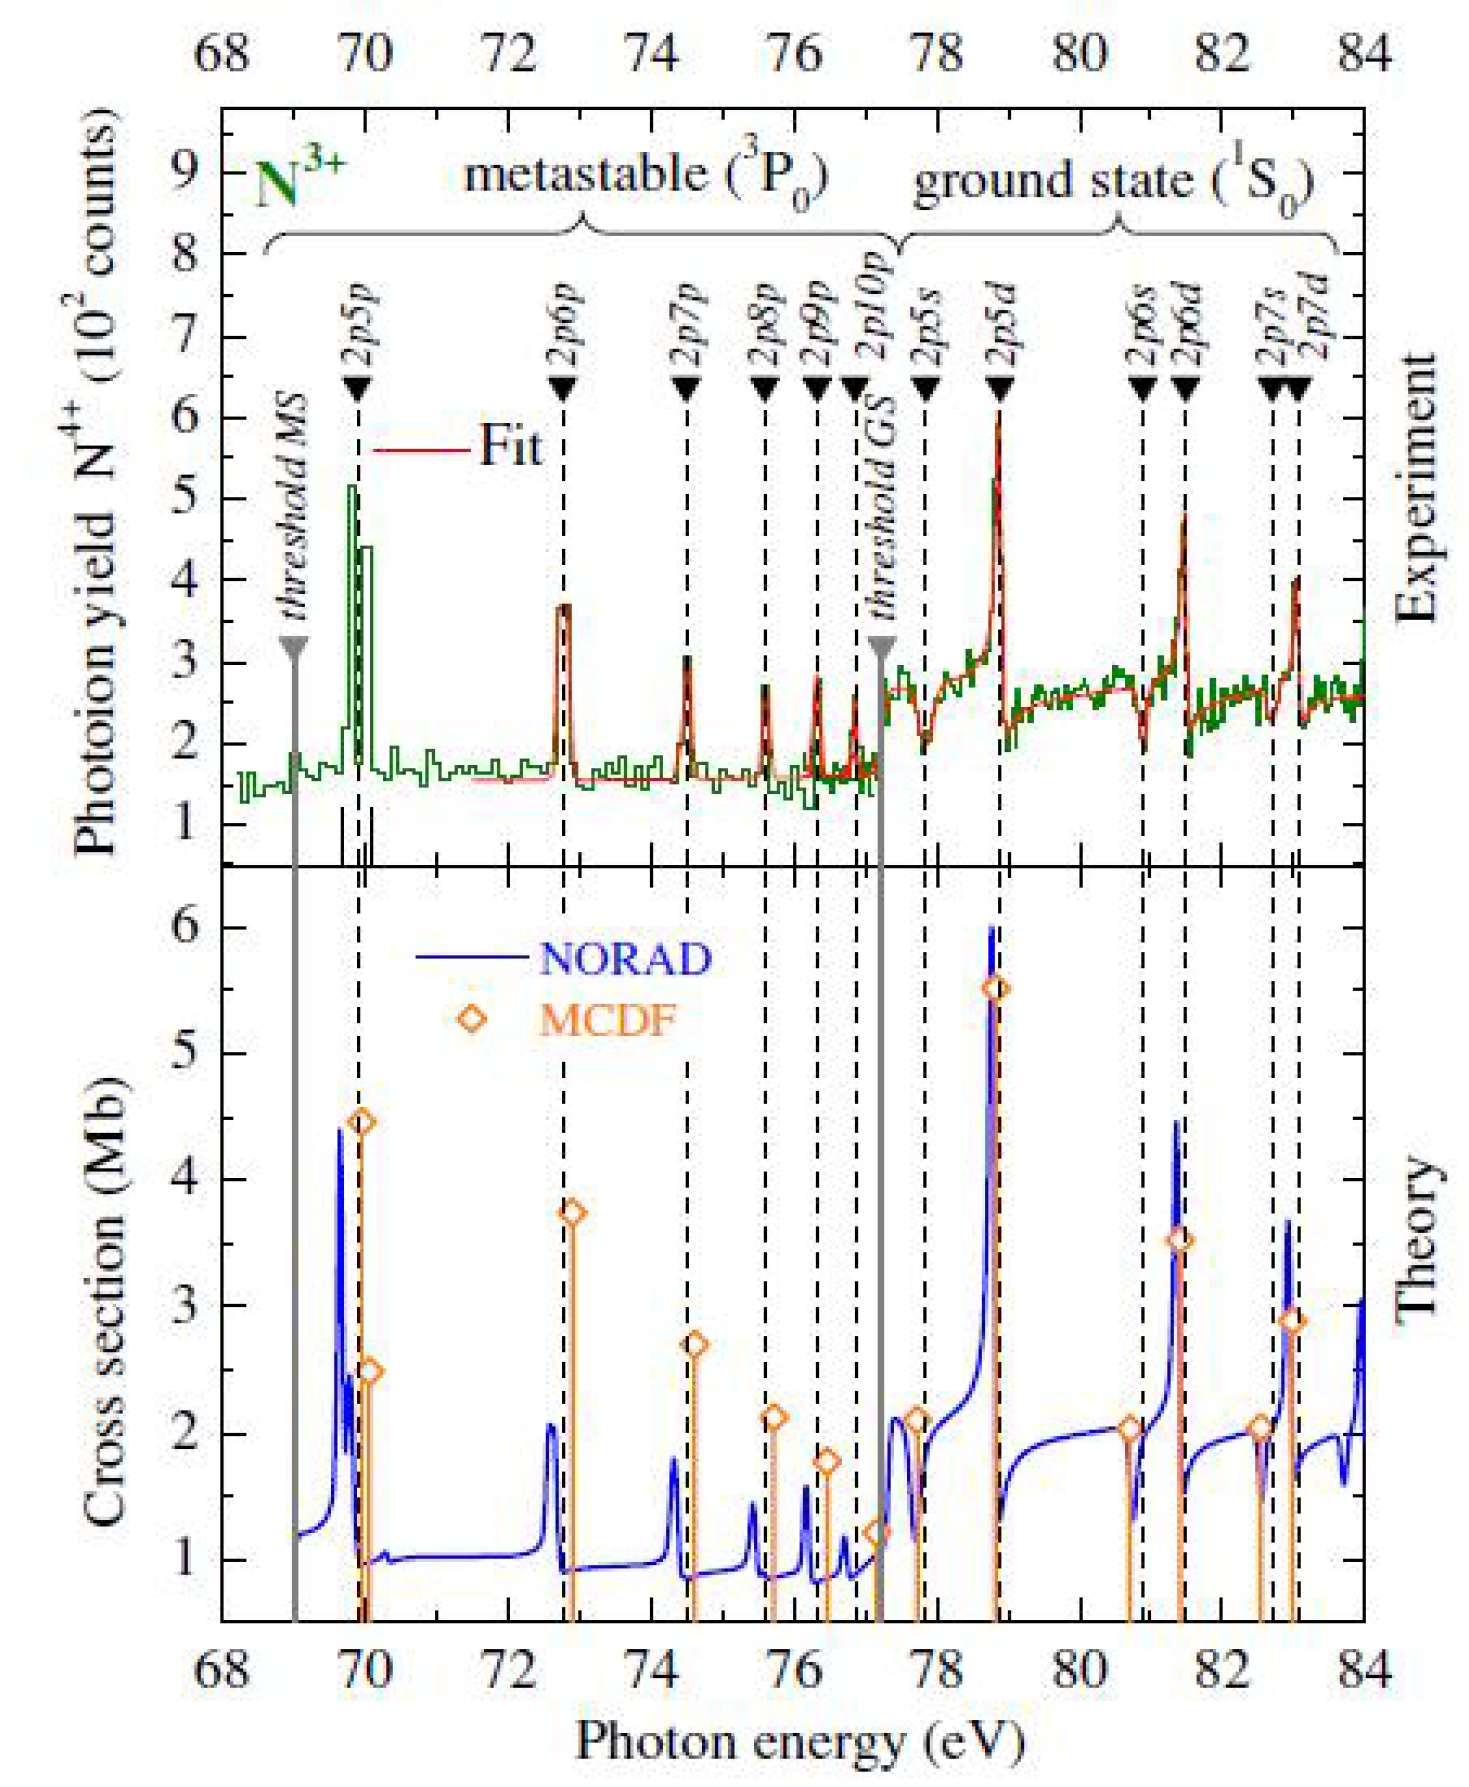
  122. Simon, M.C.; Schwarz, M.; Epp, S.W.; Beilmann, C.; Schmitt, B.L.; Harman, Z.; Baumann, T.M.; Mokler, P.H.; Bernitt, S.; Ginzel, R.; et al. Photoionization of N3+ and Ar8+ in an electron beam ion trap by synchrotron radiation. J. Phys. B At. Mol. Opt. Phys. 2010, 43, 065003. [Google Scholar] [CrossRef] [Green Version]
  123. Nahar, S.N.; Pradhan, A.K. Electron-Ion Recombination Rate Coefficients, Photoionization Cross Sections, and Ionization Fractions for Astrophysically Abundant Elements I. Carbon and Nitrogen. Astrophys. J. Suppl. 1997, 111, 339–355. [Google Scholar] [CrossRef]
  124. Nahar, S.N. Photoionization of ground and excited states of Ti I. New Astron. 2015, 38, 16–22. [Google Scholar] [CrossRef]
  125. Pradhan, A.K.; Chen, G.X.; Nahar, S.N.; Zhang, H.L. Relativistic fine structure and resonance effects in electron-ion recombination and excitation of (e + C IV). Phys. Rev. Lett. 2001, 87, EI-183201. [Google Scholar] [CrossRef] [Green Version]
  126. Pradhan, A.K.; Nahar, S.N.; Zhang, H.L. Unified electronic recombination of Ne-like Fe XVII: Implications for modeling X-ray plasmas. Astrophys. J. Lett. 2001, 549, L265–L268. [Google Scholar] [CrossRef]
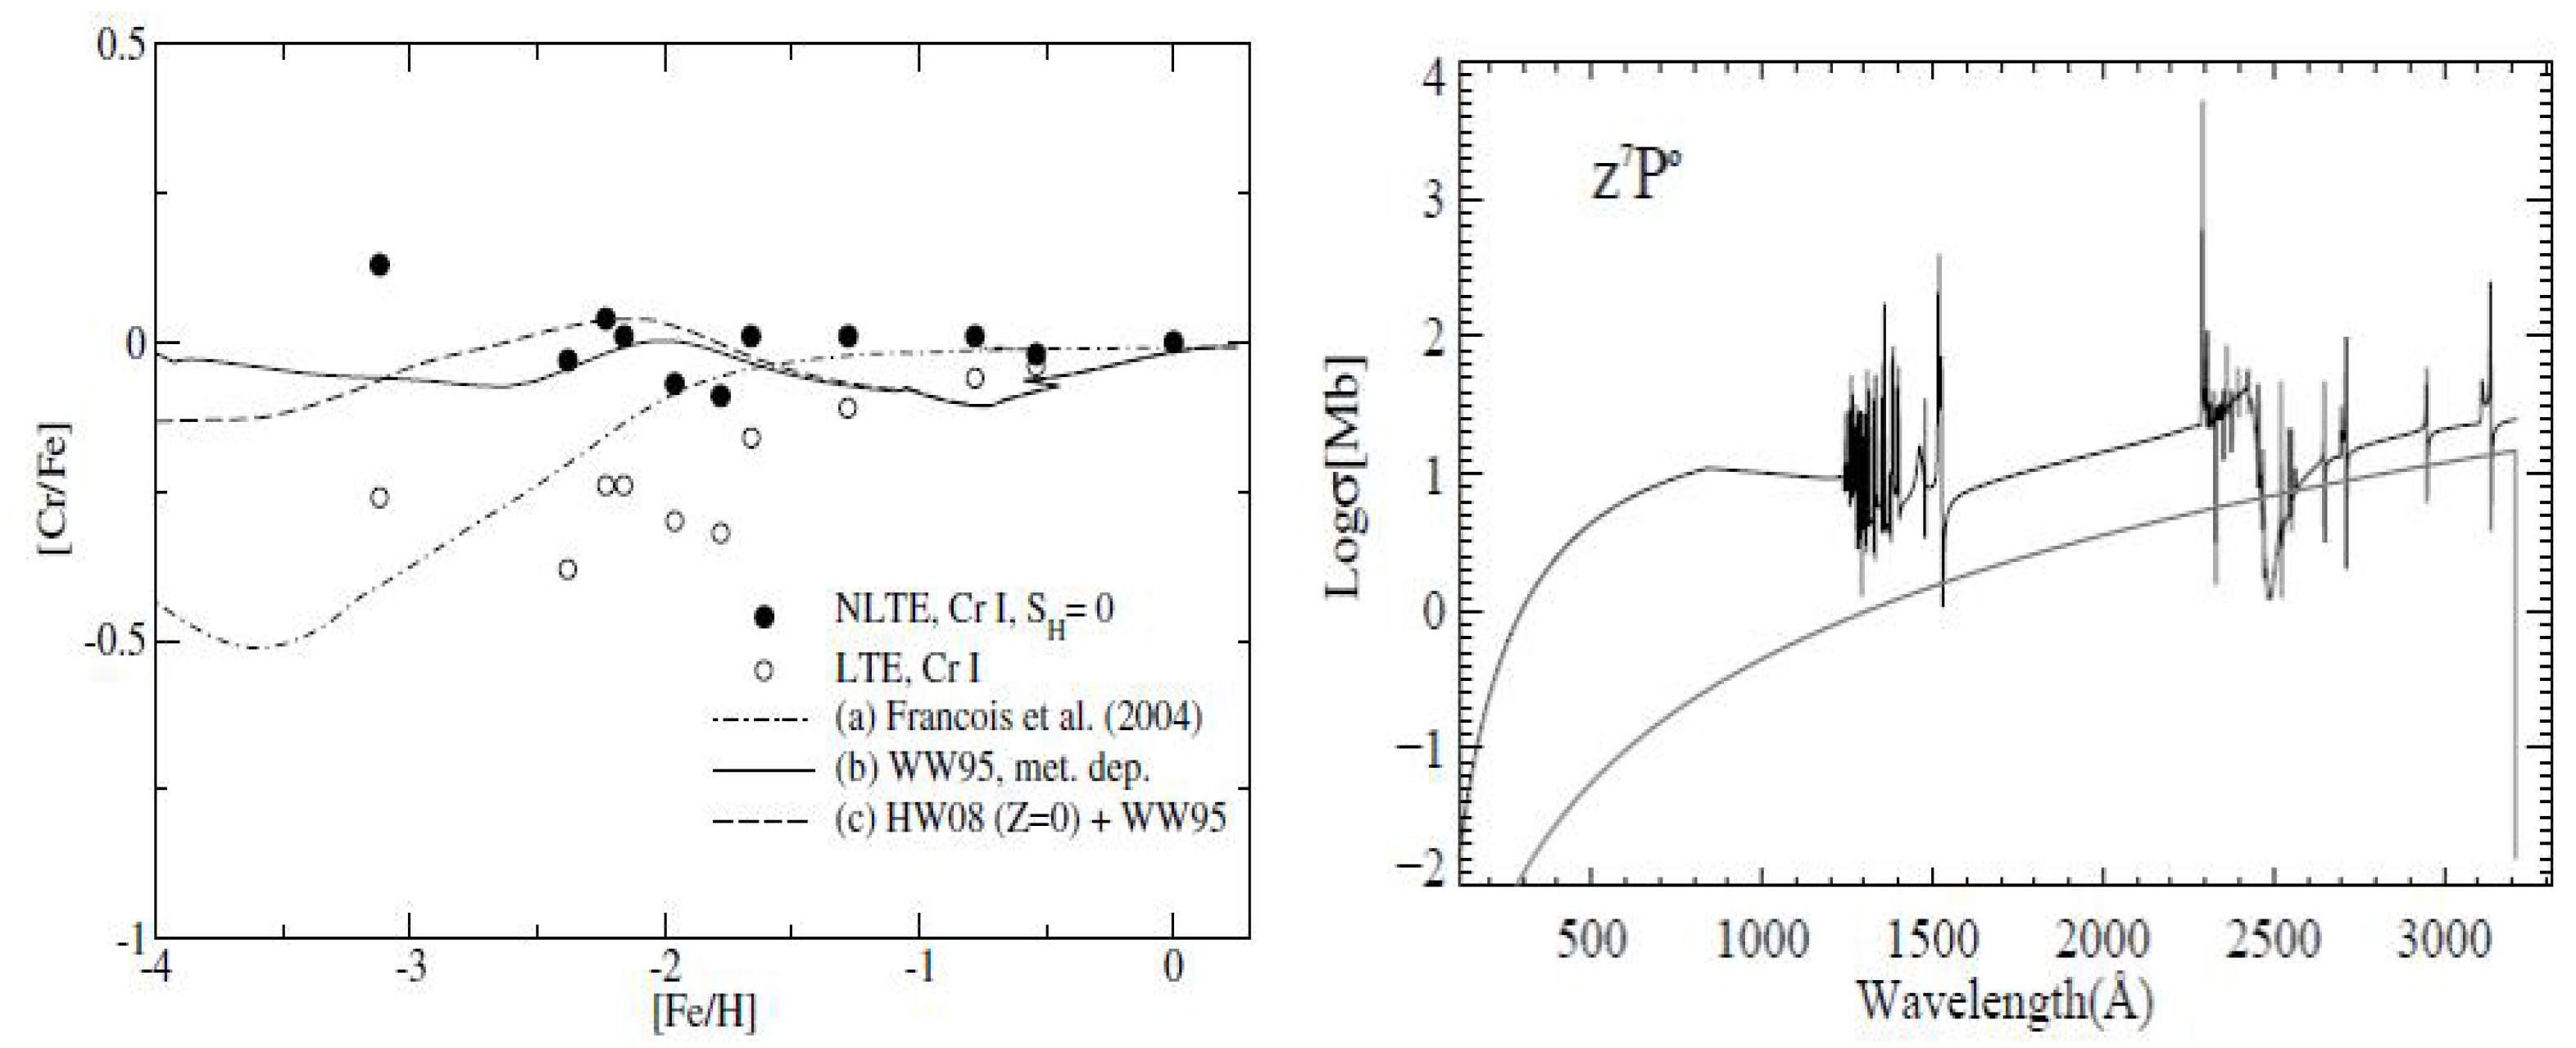
  127. Nahar, S.N. Photoionization and electron-ion recombination of Cr I. J. Quant. Spectrosc. Radiat. Transf. 2009, 110, 2148–2161. [Google Scholar] [CrossRef] [Green Version]
  128. Bargeman, M.; Cescutti, C. Chromium: NLTE abundances in metal-poor stars and nucleosynthesis in the galaxy. Astron. Astrophys. 2010, 522, A9. [Google Scholar] [CrossRef] [Green Version]
  129. Adineh, V.R.; Coufal, O.; Zivny, O. Thermodynamic and radiative properties of plasma excited in EDM process through N2 through taking into account Fe. IEEE Trans. Plasma Sci. 2012, 40, 2723–2736. [Google Scholar] [CrossRef]
Figure 1. Space in the R-matrix method.
Atoms 08 00068 g001
Figure 2. Flowchart of different stages, e.g., STG1, STG2, RECUPD, of computation in the Breit–Pauli R-matrix (BPRM) method. The final product parameters are energy levels, oscillator strengths, photoionization cross sections, electron–ion recombination cross sections, collision strengths which are applied in astrophysical applications.
Atoms 08 00068 g002
Figure 3. Screenshot of the table that gives access to various atomic data. The leftmost column gives the atom/ion name and the right columns give the names of the data files for various atomic processes.
Atoms 08 00068 g003
Figure 4. Screenshot of a transition table, with transitions in Fe XV as example [28], with full spectroscopic designation.
Atoms 08 00068 g004
Figure 5. Comparison of photoionization cross sections of N IV measured at BESSY II setup in Germany by Simon et al. [122] (upper panel) with those by Nahar and Pradhan [123] available at the NORAD-Atomic-Data (blue) and MCDF calculations (orange drop [122]) in the lower panel (Figure from [122] is used with permission).
Atoms 08 00068 g005
Figure 6. Cr-to-Fe ratio as probe of chemical evolution between NLTE analysis of Cr I and Cr II lines (left panel) obtained by using photoionization cross sections at NORAD (right panel [127]) [128]. (Figure from [128] is used with permission).
Atoms 08 00068 g006
Figure 7. Net emission coefficient (NEC) with temperature at different percentage of contamination of iron in nitrogen molecule in EDM plasmas. (Figure from [129] is used with permission).
Atoms 08 00068 g007
Table 1. Sample table of fine structure energy levels of Fe XIV [26] where levels have been grouped together as components of L S terms. This is a conventional format of the NIST table [27].
C t ( S t L t π t ) J t nl 2 J E(Ry) ν SL π
Nlv = 2,   2 L o :P ( 3 1 )/2
2p63s2    (1Se)03p1−2.88230 × 10 1 2.642P o
2p63s2    (1Se)03p3−2.86520 × 10 1 2.622P o
Nlv(c) =  2  : set complete
Eqv electron/unidentified levels, parity: e
3s3p2 1−2.68030 × 10 1 2.704P e
3s3p2 3−2.67330 × 10 1 2.714P e
3s3p2 5−2.66410 × 10 1 2.714P e
Nlv(c) = 3  : set complete
Nlv = 9,   2 L e : S ( 1 )/2 P ( 3 1 )/2 D ( 5 3 )/2 F ( 7 5 )/2 G ( 9 7 )/2
3p2    (1De)23d5−1.96549 × 10 1 2.842DF e
3p2    (1De)23d7−1.95955 × 10 1 2.832FG e
3p2    (1De)23d7−1.94588 × 10 1 2.852FG e
3p2    (1De)23d9−1.94215 × 10 1 2.842G e
3p2    (1De)23d3−1.94120 × 10 1 2.832D e
3p2    (1De)23d5−1.93740 × 10 1 2.852D e
3p2    (1De)23d1−1.88526 × 10 1 2.852SP e
3p2    (1De)23d1−1.87559 × 10 1 2.862SP e
3p2    (1De)23d3−1.87283 × 10 1 2.882PD e
Nlv(c) = 9  : set complete
Table 2. Sample set of f-, S and A-values for allowed E1 transitions in Fe XIV [26].
2613
I i I k λ ( Å ) E i (Ry) E k (Ry) f S A ki ( s 1 )
     2     0        2     1   79  82    6478 =  gi  Pi  gk  Pk  Ni  Nk  NN
11451.12−2.6803 × 10 1 −2.8823 × 10 1 5.777 × 10 4 1.716 × 10 3 1.893 × 10 7
12237.74−2.6803 × 10 1 −2.2970 × 10 1 −1.231 × 10 4 1.927 × 10 4 1.453 × 10 7
13211.68−2.6803 × 10 1 −2.2498 × 10 1 −2.819 × 10 1 3.929 × 10 1 4.197 × 10 10
14207.44−2.6803 × 10 1 −2.2410 × 10 1 −1.458 × 10 3 1.991 × 10 3 2.259 × 10 8
15161.86−2.6803 × 10 1 −2.1173 × 10 1 −4.713 × 10 4 5.023 × 10 4 1.200 × 10 8
1619.07−2.6803 × 10 1 −2.0978 × 10 1 −4.846 × 10 7 6.086 × 10 8 8.890 × 10 6
1782.85−2.6803 × 10 1 −1.5804 × 10 1 −5.076 × 10 5 2.769 × 10 5 4.931 × 10 7
1882.65−2.6803 × 10 1 −1.5777 × 10 1 −1.231 × 10 5 6.699 × 10 6 1.202 × 10 7
1981.13−2.6803 × 10 1 −1.5571 × 10 1 −1.757 × 10 5 9.386 × 10 6 1.780 × 10 7
11079.57−2.6803 × 10 1 −1.5351 × 10 1 −1.716 × 10 5 8.989 × 10 6 1.807 × 10 7

