1. Introduction
Self-absorption as well as self-reversal of radiation from optically thick plasma occur due to processes of re-absorption in the outer-cooler region or in shockwave-induced density variations. The plasma produced by focusing of pulsed laser light on suitable targets suffers from strong inhomogeneity, even when using a well-defined TEM
00 laser mode [
1]. Plasma inhomogeneities lead to strong gradients of plasma parameters (electron density and temperature) from the hot central core to peripheries that is in contact with surrounding air. This cooler plasma peripheries contain large population of atoms in lower atomic states, especially in the ground state. These peripheral atoms are often causing plasma re-absorption [
2]. The plasma opacity manifests itself in form of homogeneous absorption of the spectral line that is labelled self-absorption. Effects of self-absorption include an apparent increase of the emitted line full-width at half-maximum (FWHM) and a decrease in spectral line height [
3]. Line shape recovery is possible, only if one employs a standard, reliable measure of the true plasma electron density, which is offered by the optically thin Hα- and Hβ- lines [
3,
4], yet frequently the Hα-line is utilized. For instance, line-of-sight measurements of laser-induced plasma at or near an ice surface [
4,
5] show self-reversal dips at the un-shifted resonance wavelength of the hydrogen alpha line of the Balmer series. Typical “fingerprints” due to re-absorption include self-reversal and self-absorption [
4,
5,
6,
7,
8,
9,
10,
11]. In this work, self-absorption and self-reversal parameters, SR and SA, respectively, distinguish between these re-absorption effects.
There are significant challenges when considering self-reversed lines, especially for resonance lines, for the evaluation of the electron density measured from the full-width-at-half-maximum, and the determination of the temperature that is a function of the spectral radiance. Moreover, spectral line intensities from nano-based materials show differences from the corresponding bulk signals [
12]. The theoretical descriptions of self-absorption and self-reversal [
5,
6,
7,
8,
9,
10,
11] rely on the computation of the emitted radiation when modeling the emitters by a specific distribution.
However, strong enhanced plasma emission was noticed when focusing laser radiation onto targets made of pure nanomaterials [
12,
13,
14]. This enhanced emission was related to the sudden increase of the population density of the ground state atoms in the same ratio of the amount of enhanced emission I
λ0nano/I
λ0bulk ≈ N
λ0nano/N
λ0bulk [
12,
13,
14], i.e., more of cold atoms, N
0nano, exist at the outer peripheries of plasma produced from nanomaterials [
14], but without further increase in the plasma excitation temperature [
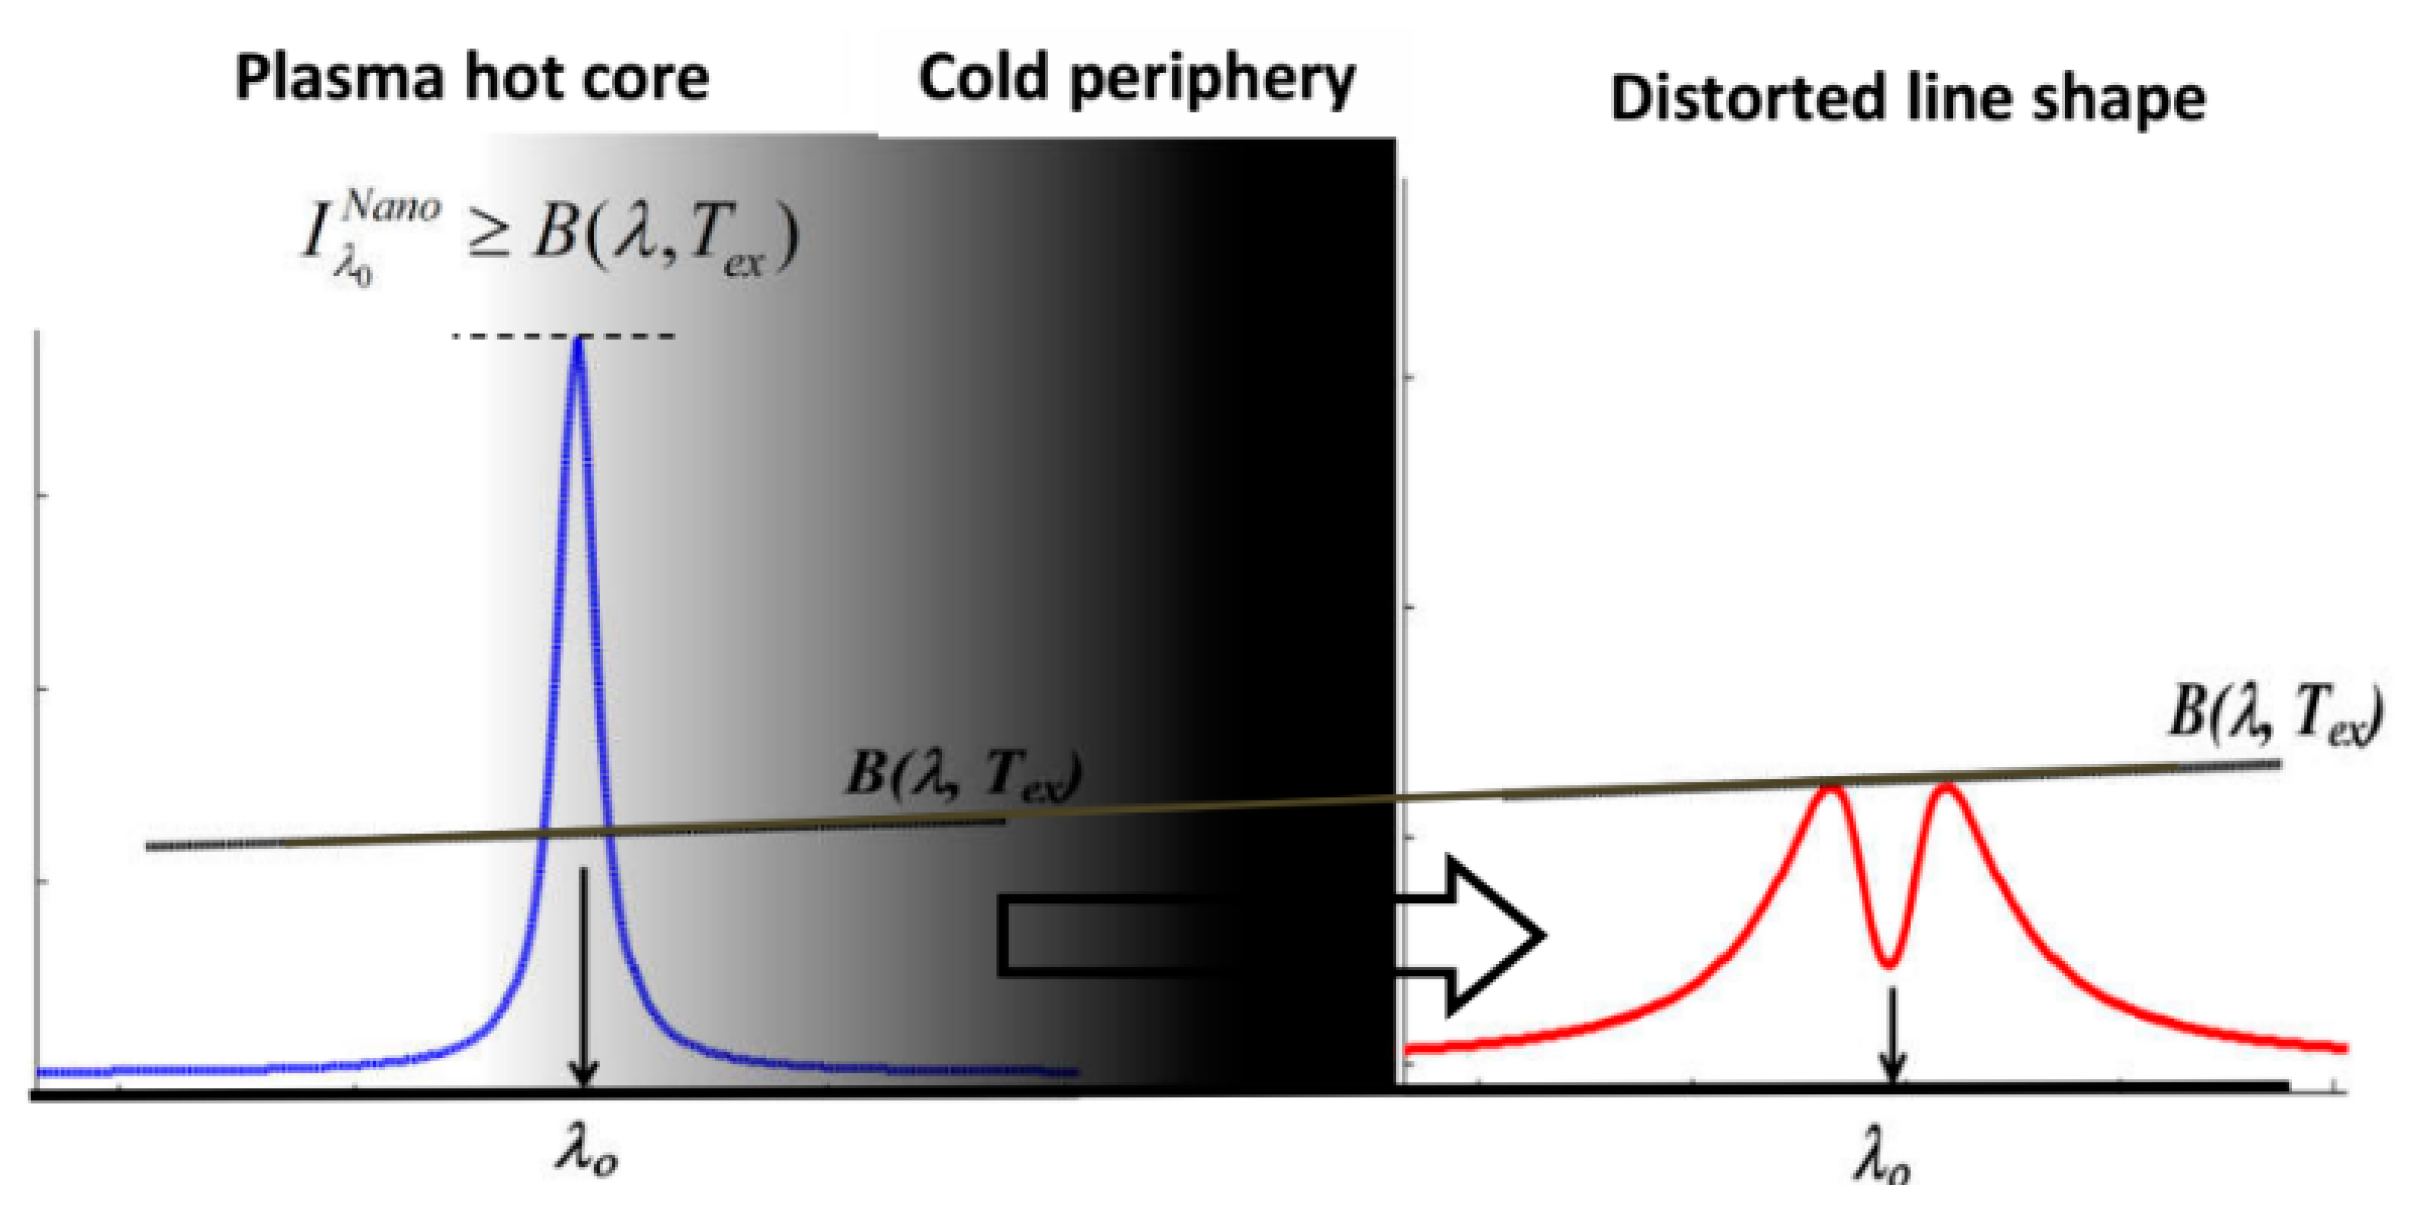
2]. This enhanced emission enables the spectral line intensity I
λ0Nano of the resonance lines to exceed the corresponding, upper-limit black body radiation intensity I
λ0Nano ≥ B(λ
0,T
ex),
because of the relatively local temperature, T
ex, in this plasma region. Therefore, and as elaborated by Fujimoto [
2], i.e., the measured radiation intensities of the resonance lines are only those that emerge from the outer plasma regions at which the plasma optical depth is unity, hence self-reversal starts to act at the central un-shifted wavelengths of resonance lines that terminate at the ground state.
Figure 1 illustrates a homogenized central core, cold periphery, the emanating “distorted” line shape and the upper limit of spectral intensity imposed by the black body radiation “tilted horizontal thick line”.
There are three effects that modify the line shape: First, the excessive enlargement of line FWHM; second, reduction of spectral radiance imposed by the black body radiation limit; and third, the reversal in the emitted line-shape.
This work introduces a method for retrieving the original undistorted shape of self-absorbed lines that are affected simultaneously by self-reversal and self-absorption. The method is based on the availability of certain optically-thin spectral lines that originate from upper states of atomic transitions, viz., Ag I lines at 827.35 and 768.7 nm. These Ag lines are investigated first by comparison of the determined electron density with that obtained from Hα, and then serve as gauge for other optically-thick Ag lines.
3. Results and Discussion
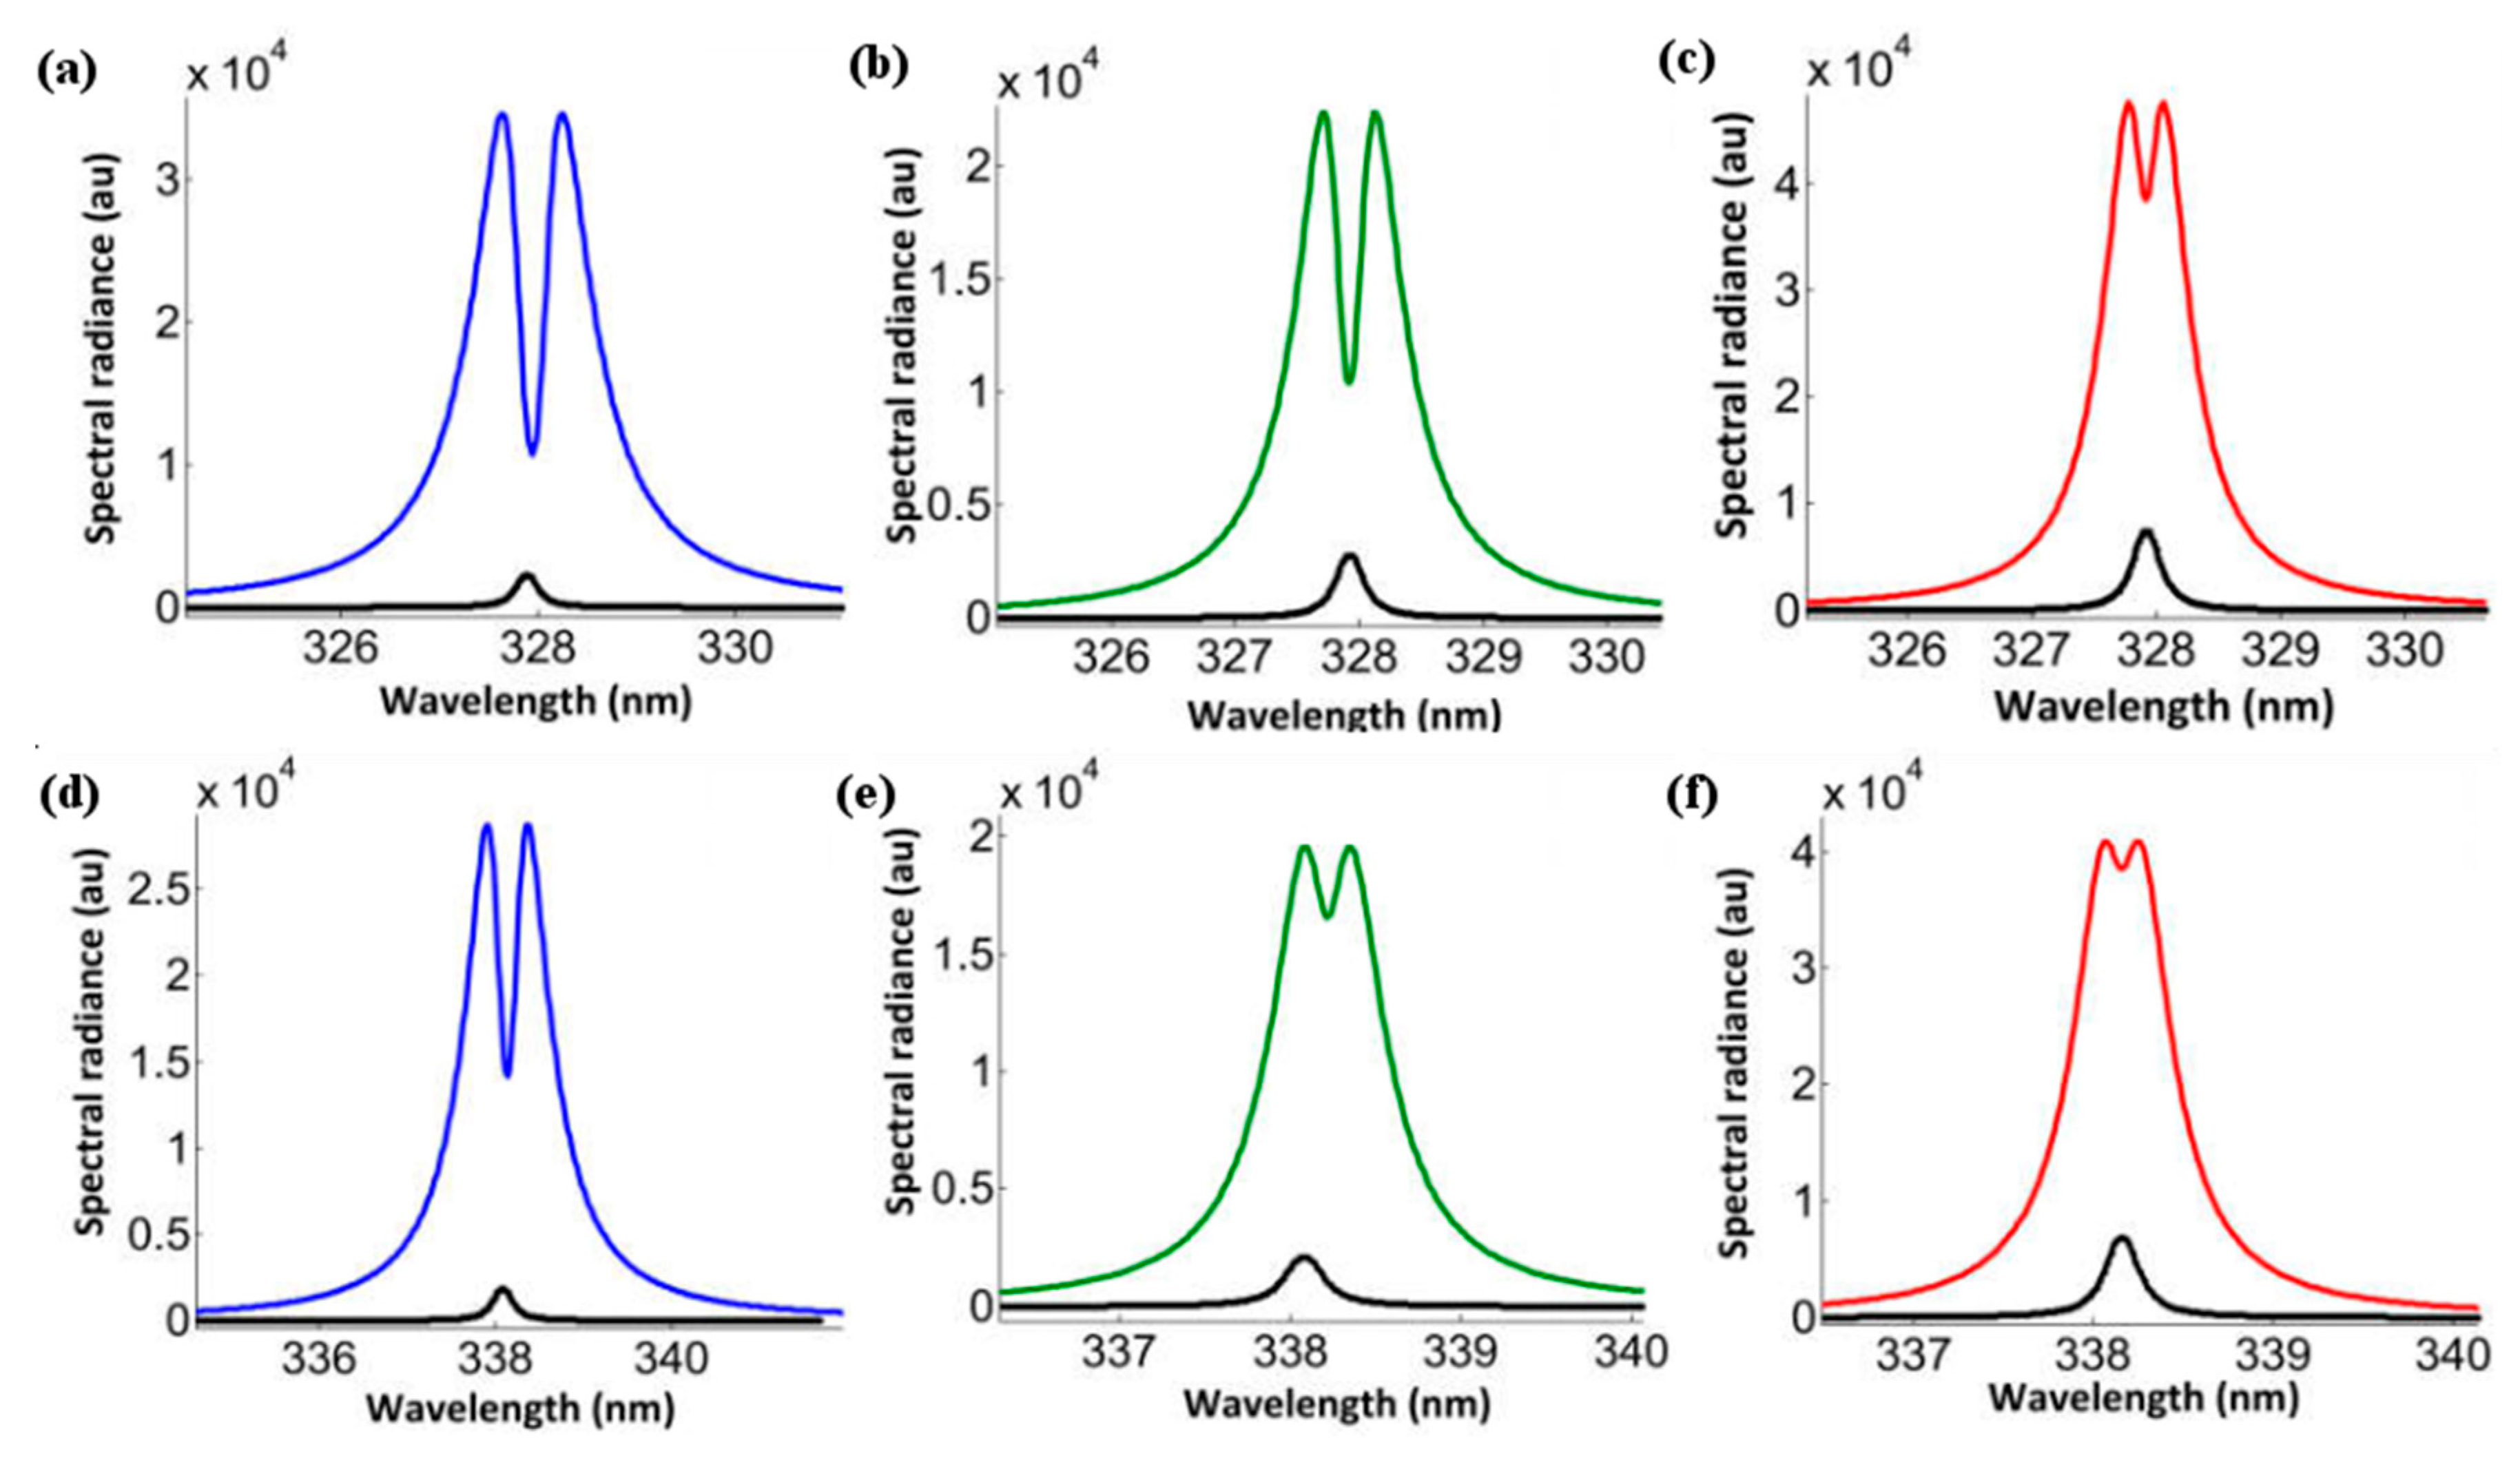
An example of the self-reversed resonance lines from the neutral silver atoms is presented in
Figure 2 after laser irradiation with different wavelengths, namely,
Figure 2a,d: 355 nm,
Figure 2b,e: 532 nm, and
Figure 2c,f: 1064 nm.
In
Figure 2, the upper self-reversed spectral lines emerge from plasma generated at the surface of the nano-silver target. The lower black spectra are the corresponding lines for the same transition and under the same experimental conditions but from the bulk-silver target. One can notice significantly more self-reversal of the plasma created from nano-silver than for plasma from bulk-silver.
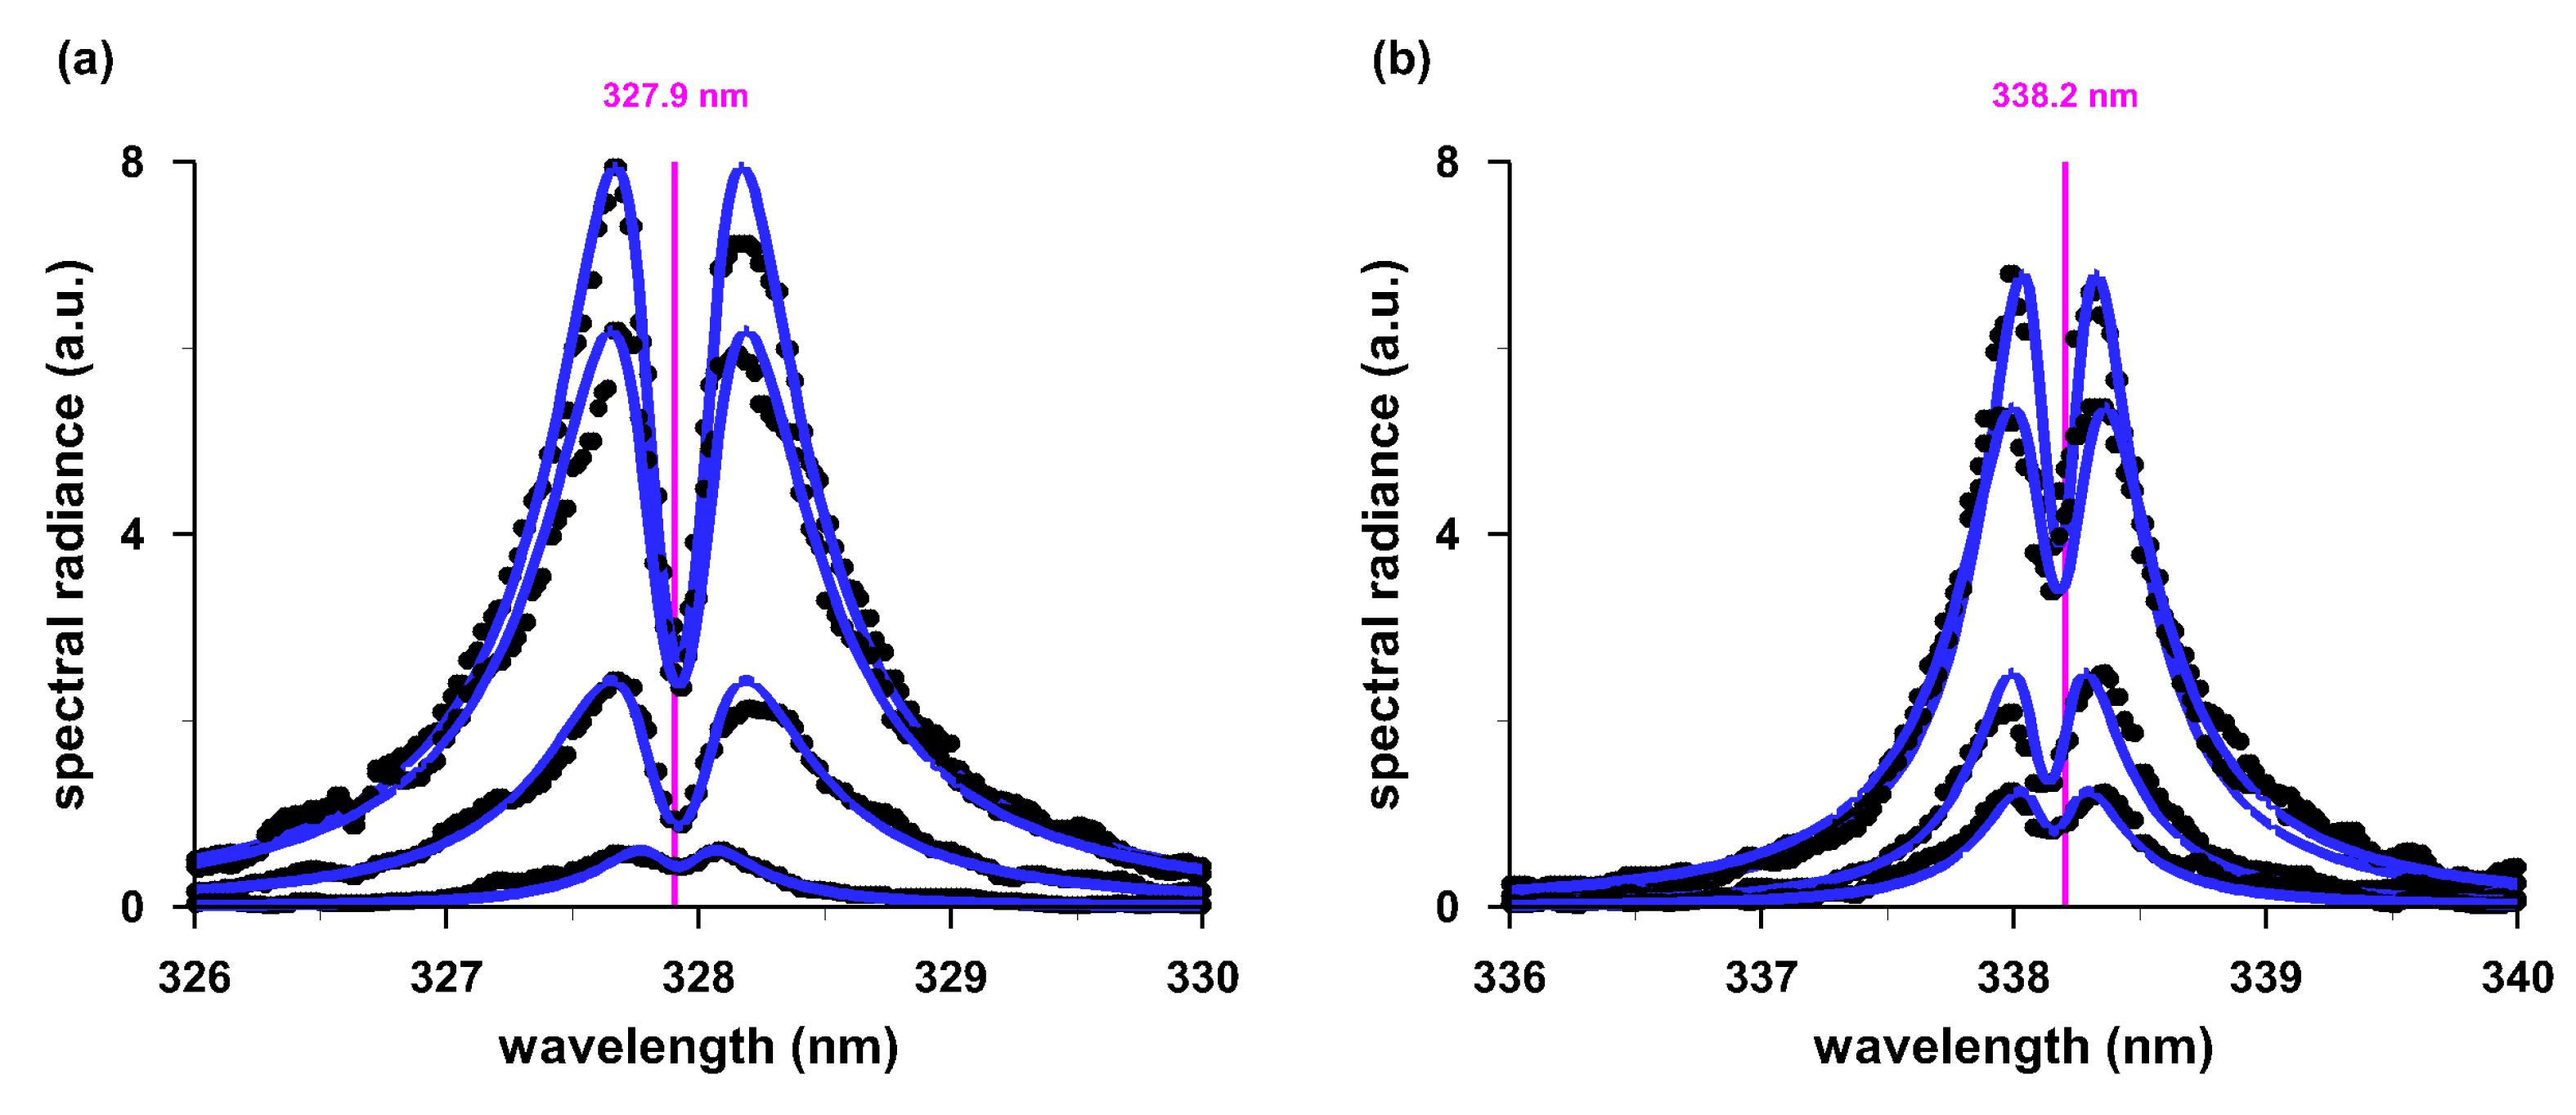
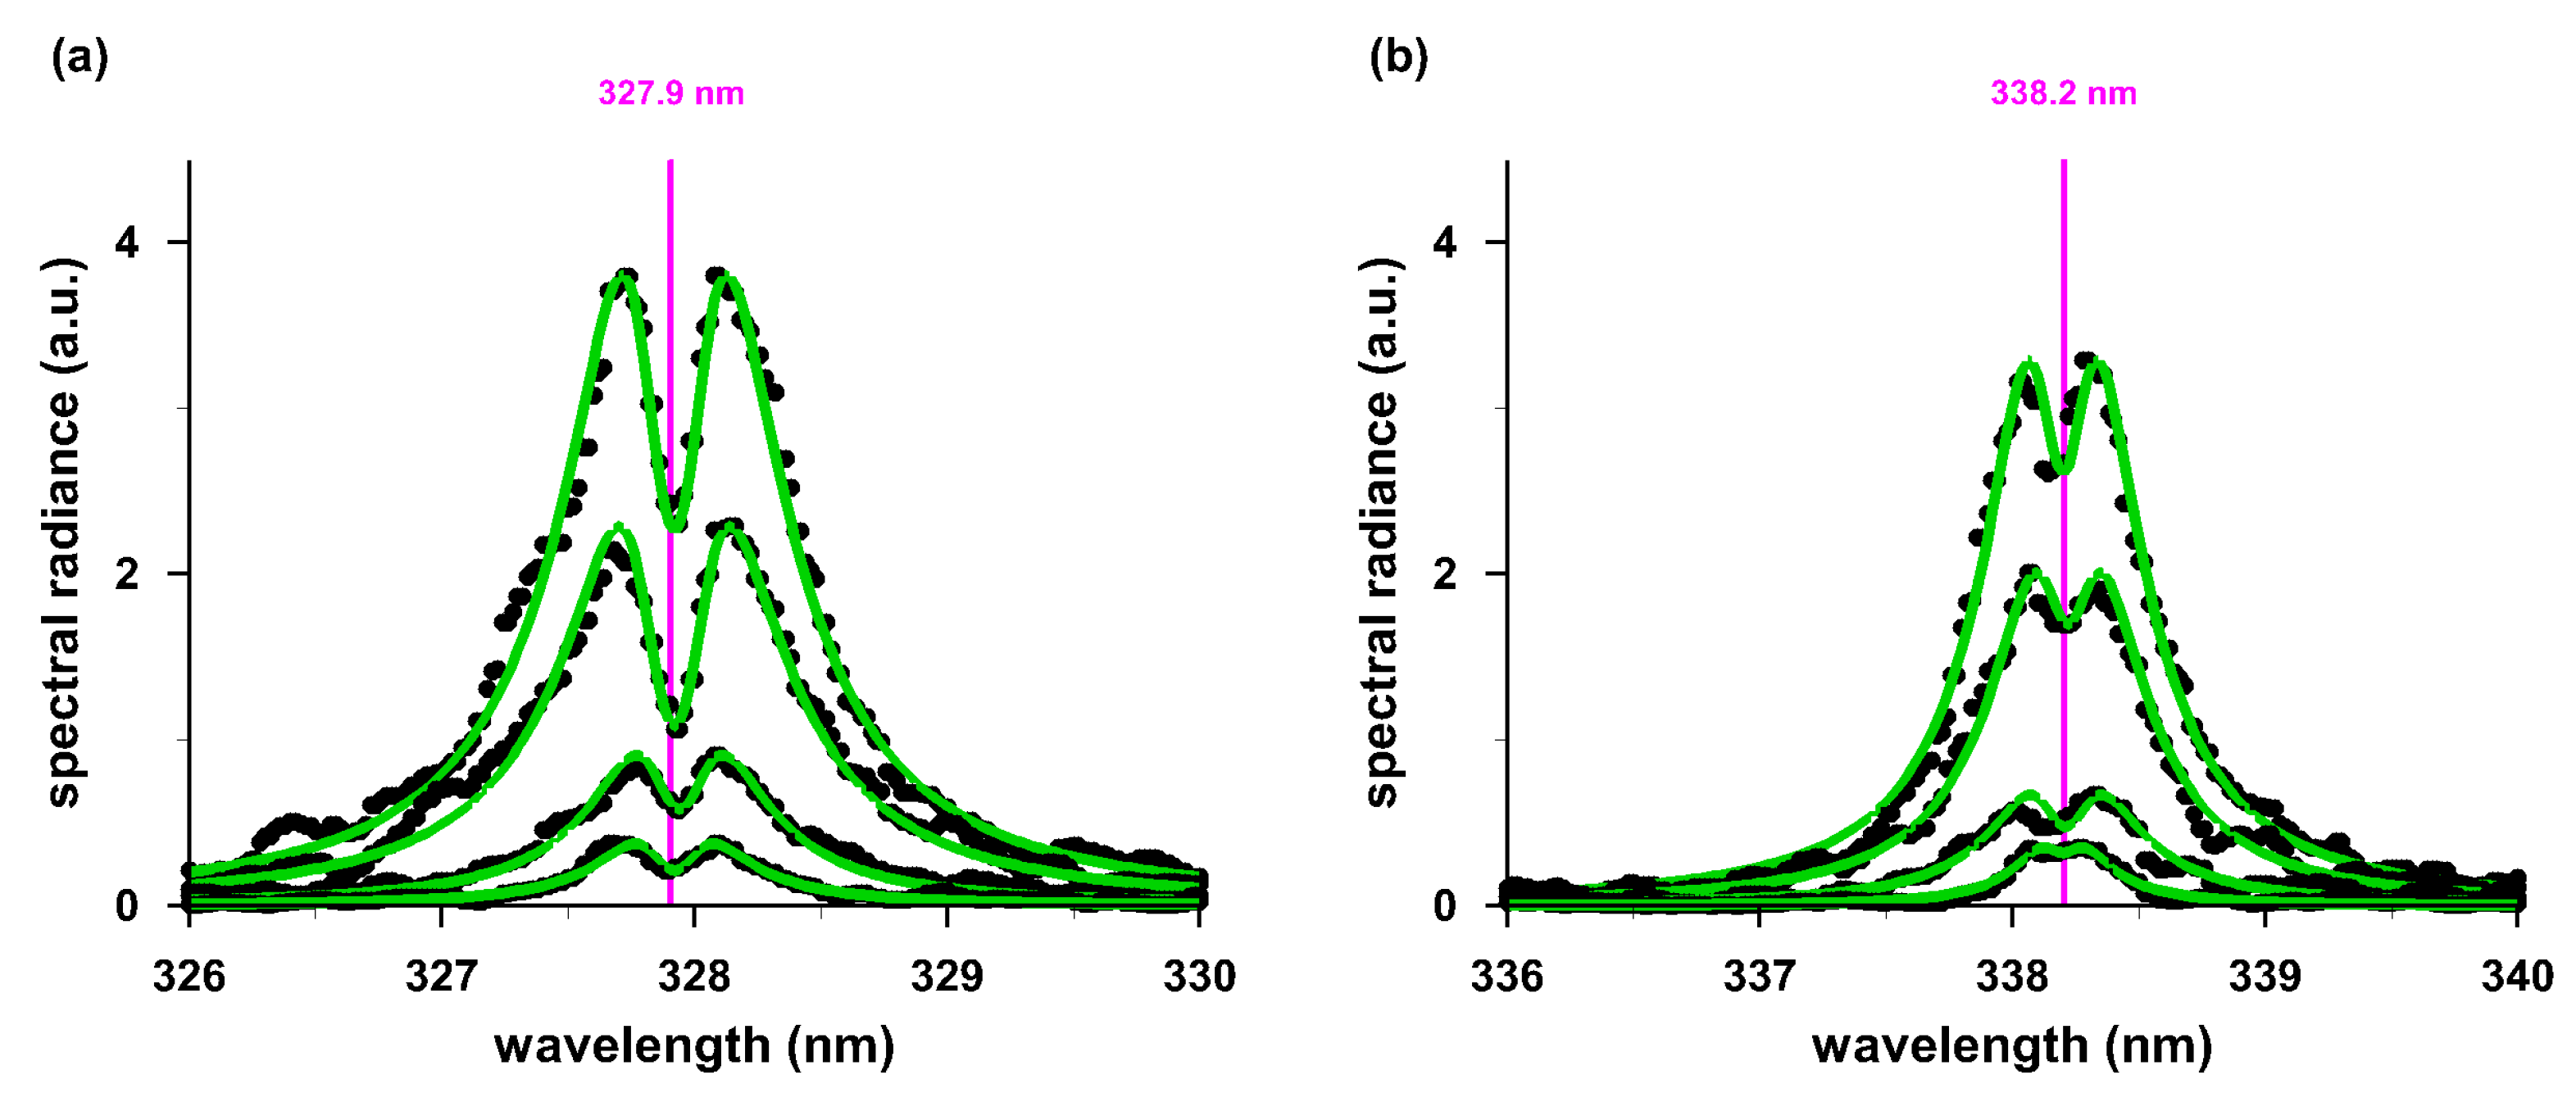
For the resonance transitions of the Ag I lines at 327.9 and 338.2 nm,
Figure 3,
Figure 4 and
Figure 5 illustrate recorded and fitted nano-material silver lines with central dips at line center.
The two sets of spectra show the results captured from nano-material silver targets with 355 nm radiation. The self-reversal of plasma radiation from nano-silver material is typically absent in investigations of laser-induced plasma with bulk-silver targets for otherwise similar experimental conditions.
Figure 3 shows well-developed spectral dips. Accordingly,
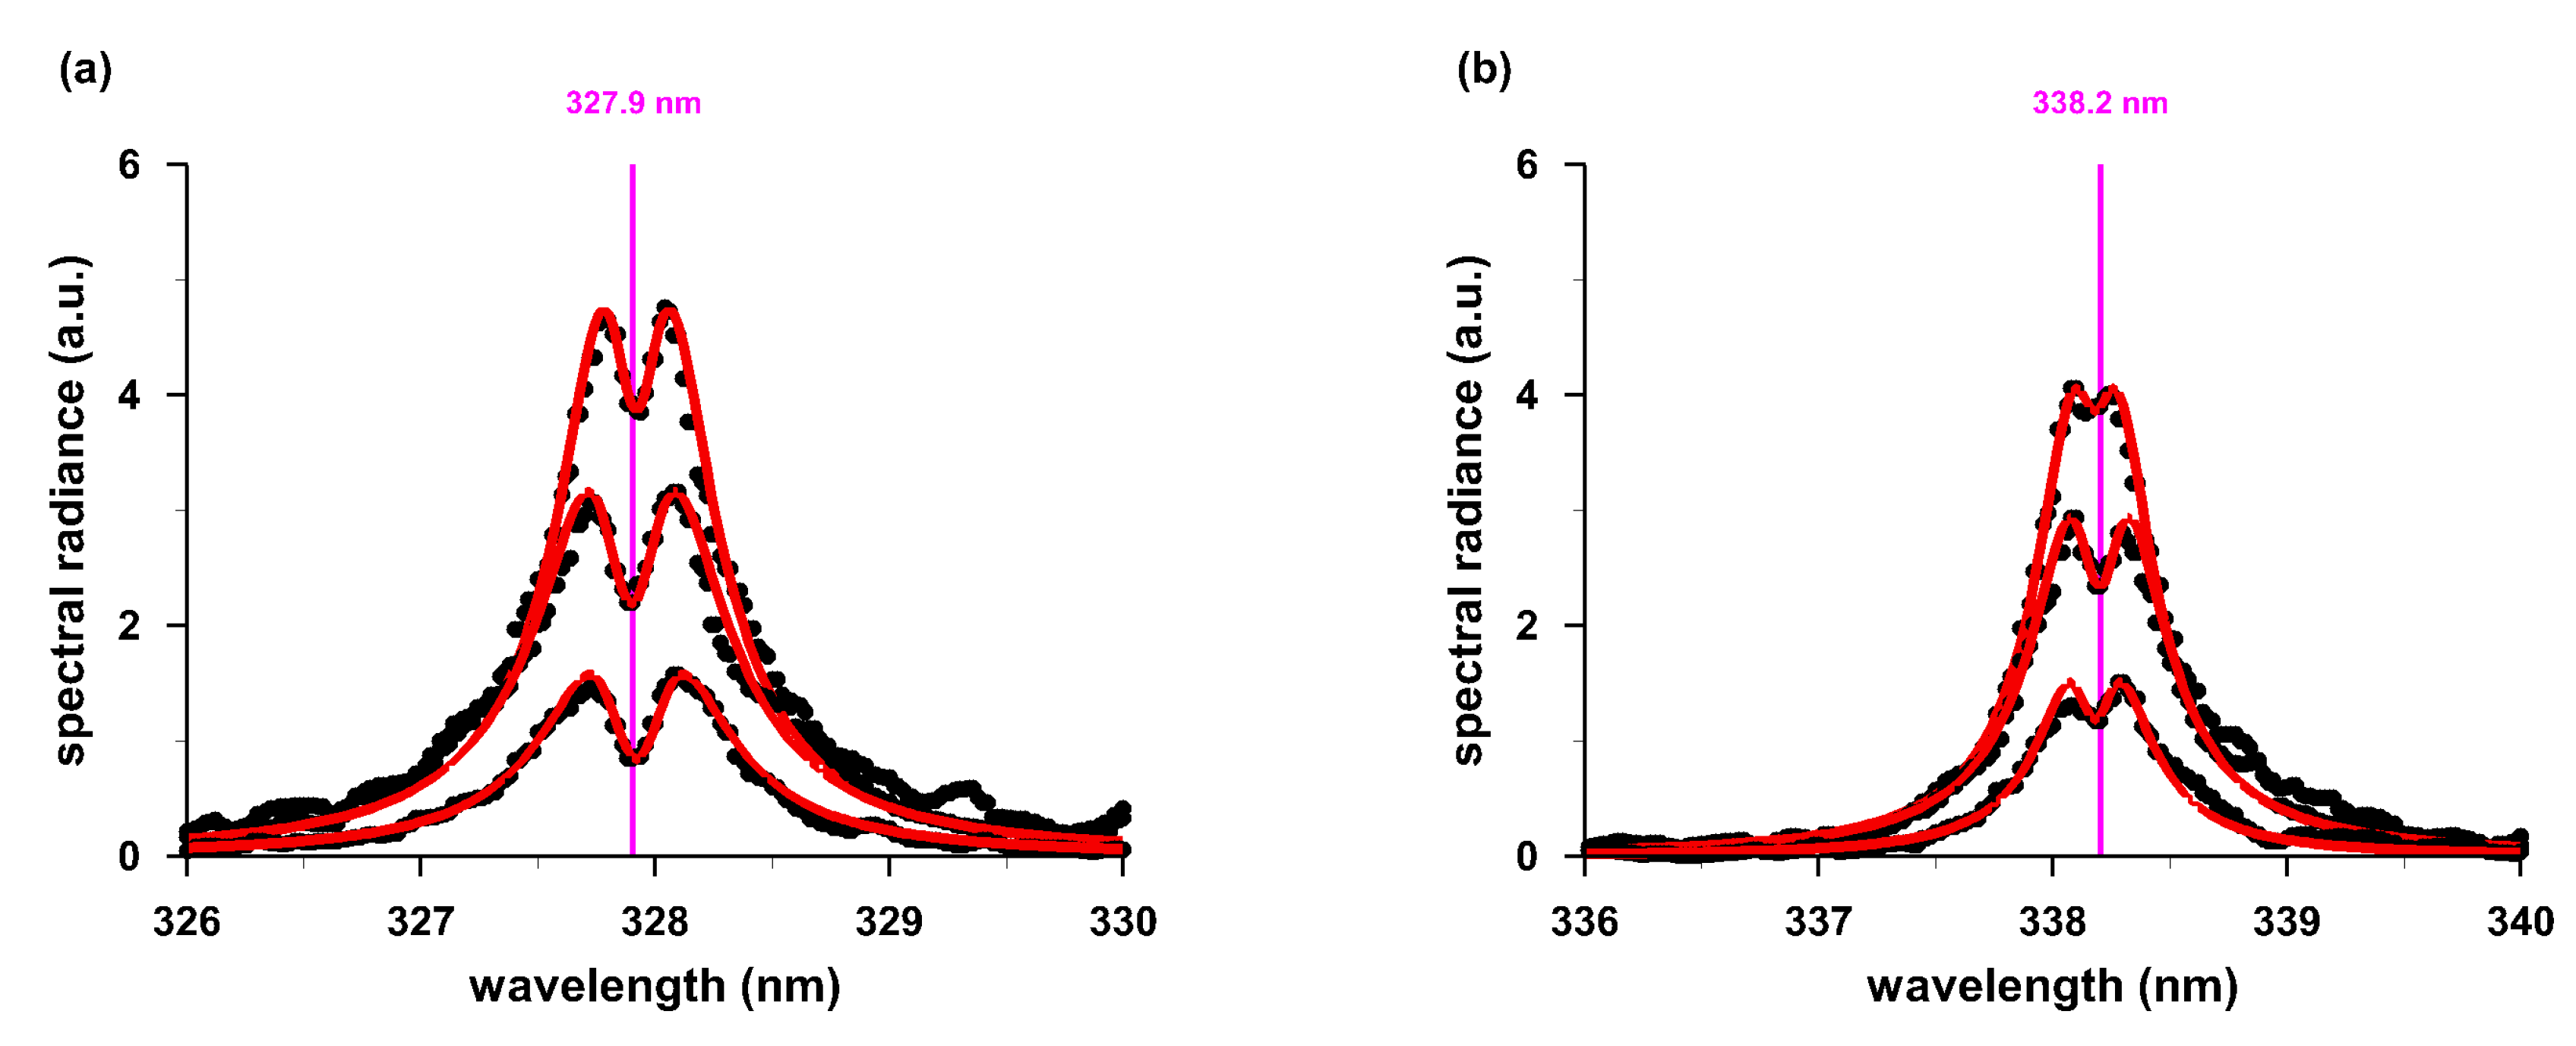
Figure 4 displays recorded spectra obtained with 532 nm harmonic laser excitation.
Figure 4 indicates diminished self-absorption when compared to
Figure 3. For 1064 nm laser excitation,
Figure 5 displays even smaller self-absorption phenomena for the two silver lines.
In view of
Figure 3,
Figure 4 and
Figure 5, one can see that it would be challenging to extract the full-width at half-maximum for determination of electron density. It would be required to extract the FWHM of the line after opacity corrections due to self-reversal and self-absorption effects.
An accurate electron-density measure of the nano-material plasma is required for the design of self-absorption correction procedures. The reliable H
α line was supposed to provide a measure for electron density [
3], but unfortunately, the H
α line is absent when employing green and blue laser beams for plasma generation with nano-silver. Consequently, one needs to identify other suitable optically thin lines. In this work, opacity corrections for self-reversed and self-absorbed Ag lines are based on other optically-thin Ag lines.
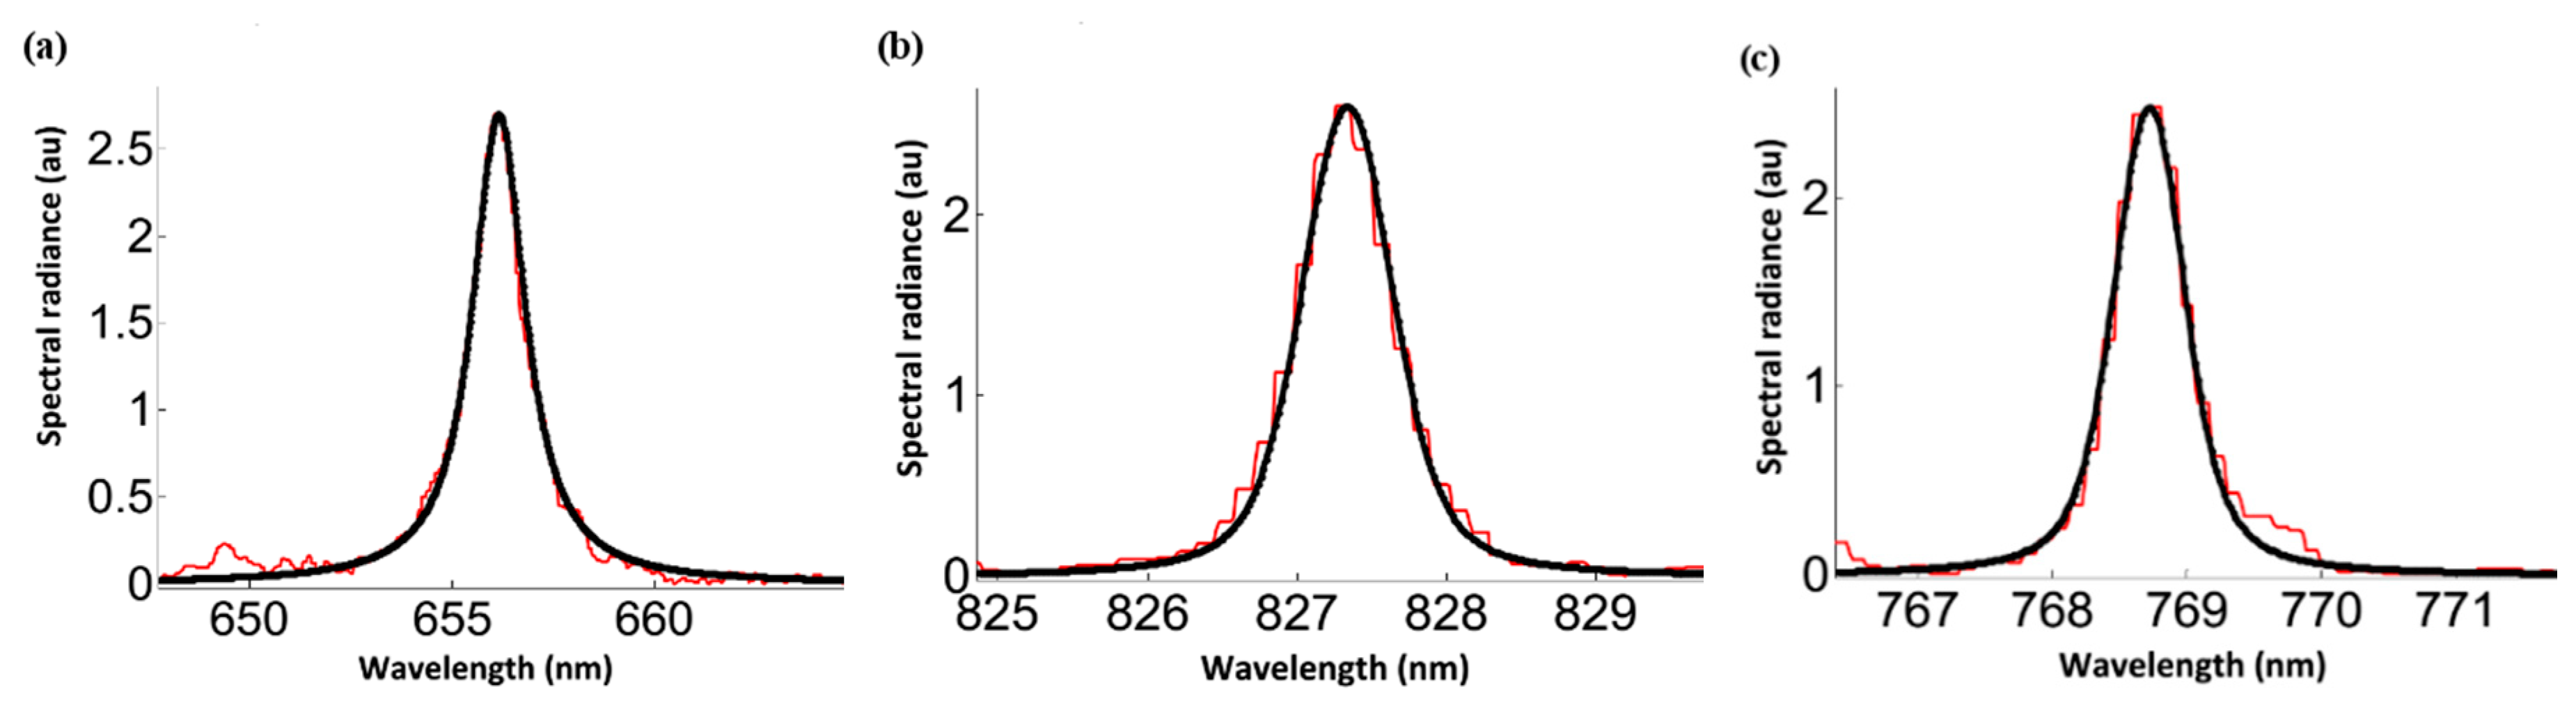
In the process of locating suitable lines in place of H
α, an extensive examination of emission spectral lines from the neutral silver discovers that only two Ag I lines at 827.35 or 768.7 nm are suitable candidates for reliable measurement of the ‘true’ electron density. The inferred electron densities compare nicely with the corresponding values obtained from analysis of the hydrogen alpha line of the Balmer series.
Figure 6 illustrates the results, and
Table 1 shows the comparisons.
There is excellent agreement of the measured electron density from the Hα and the two optically thin silver lines. The two silver lines Ag I at 827.35 and 768.7 nm are suitable for electron density determination in nano- and bulk- material for the following reasons: First, the Ag lines emerge from the upper states 4d106s-4d105p with almost empty lower and highly excited state 4d106s that minimizes the possibility of plasma re-absorption by highly populated low atomic states. Second, both lines are observed in emission spectra of neutral silver under nearly all conditions.
The experimental evaluation included change of the incident laser fluence in the range from 5 to 10 J/cm
2 and measurement of the emission spectra during IR laser irradiation. The lines are Voigt-fitted to recorded spectral radiances as indicated by the solid black lines in
Figure 6. The Stark broadening parameters for both lines are archived in Stark tables [
15]: At the reference electron density of N
eref = 10
17 cm
−3, the Stark broadening parameter, ω
SAgI, amounts to ω
SAgI = 0.18 ± 0.06 nm. The Lorentzian components of the emitted lines, λ
SAgI, were extracted. The electron densities listed in
Table 1 were evaluated with the help of the expression, n
eAgI ≈ N
eref (λ
SAgI/ω
SAgI), and then compared with the corresponding values obtained from Hα.
For analysis of the self-absorbed spectra in
Figure 2, notice line reversal at the center wavelength, λ
0, and weaker effects in the wings that lead to distortions. The transmittance [
3,
6], T(
, is related to the escape factor [
3,
6] and it depends on the optical thickness of the plasma,
.
The transmittance, T(
), is modeled with a Lorentzian spectral line shape, φ(λ),
where Δλ
s denotes the full-width at half-maximum (FWHM) of the normalized spectral line shape of magnitude φ
0 at line center. The plasma optical thickness at line center,
,
is defined in terms of integrated absorption coefficient, κ (λ), of a spectral line measured along the line-of-sight, ℓ, at the transition wavelength, λ
0.
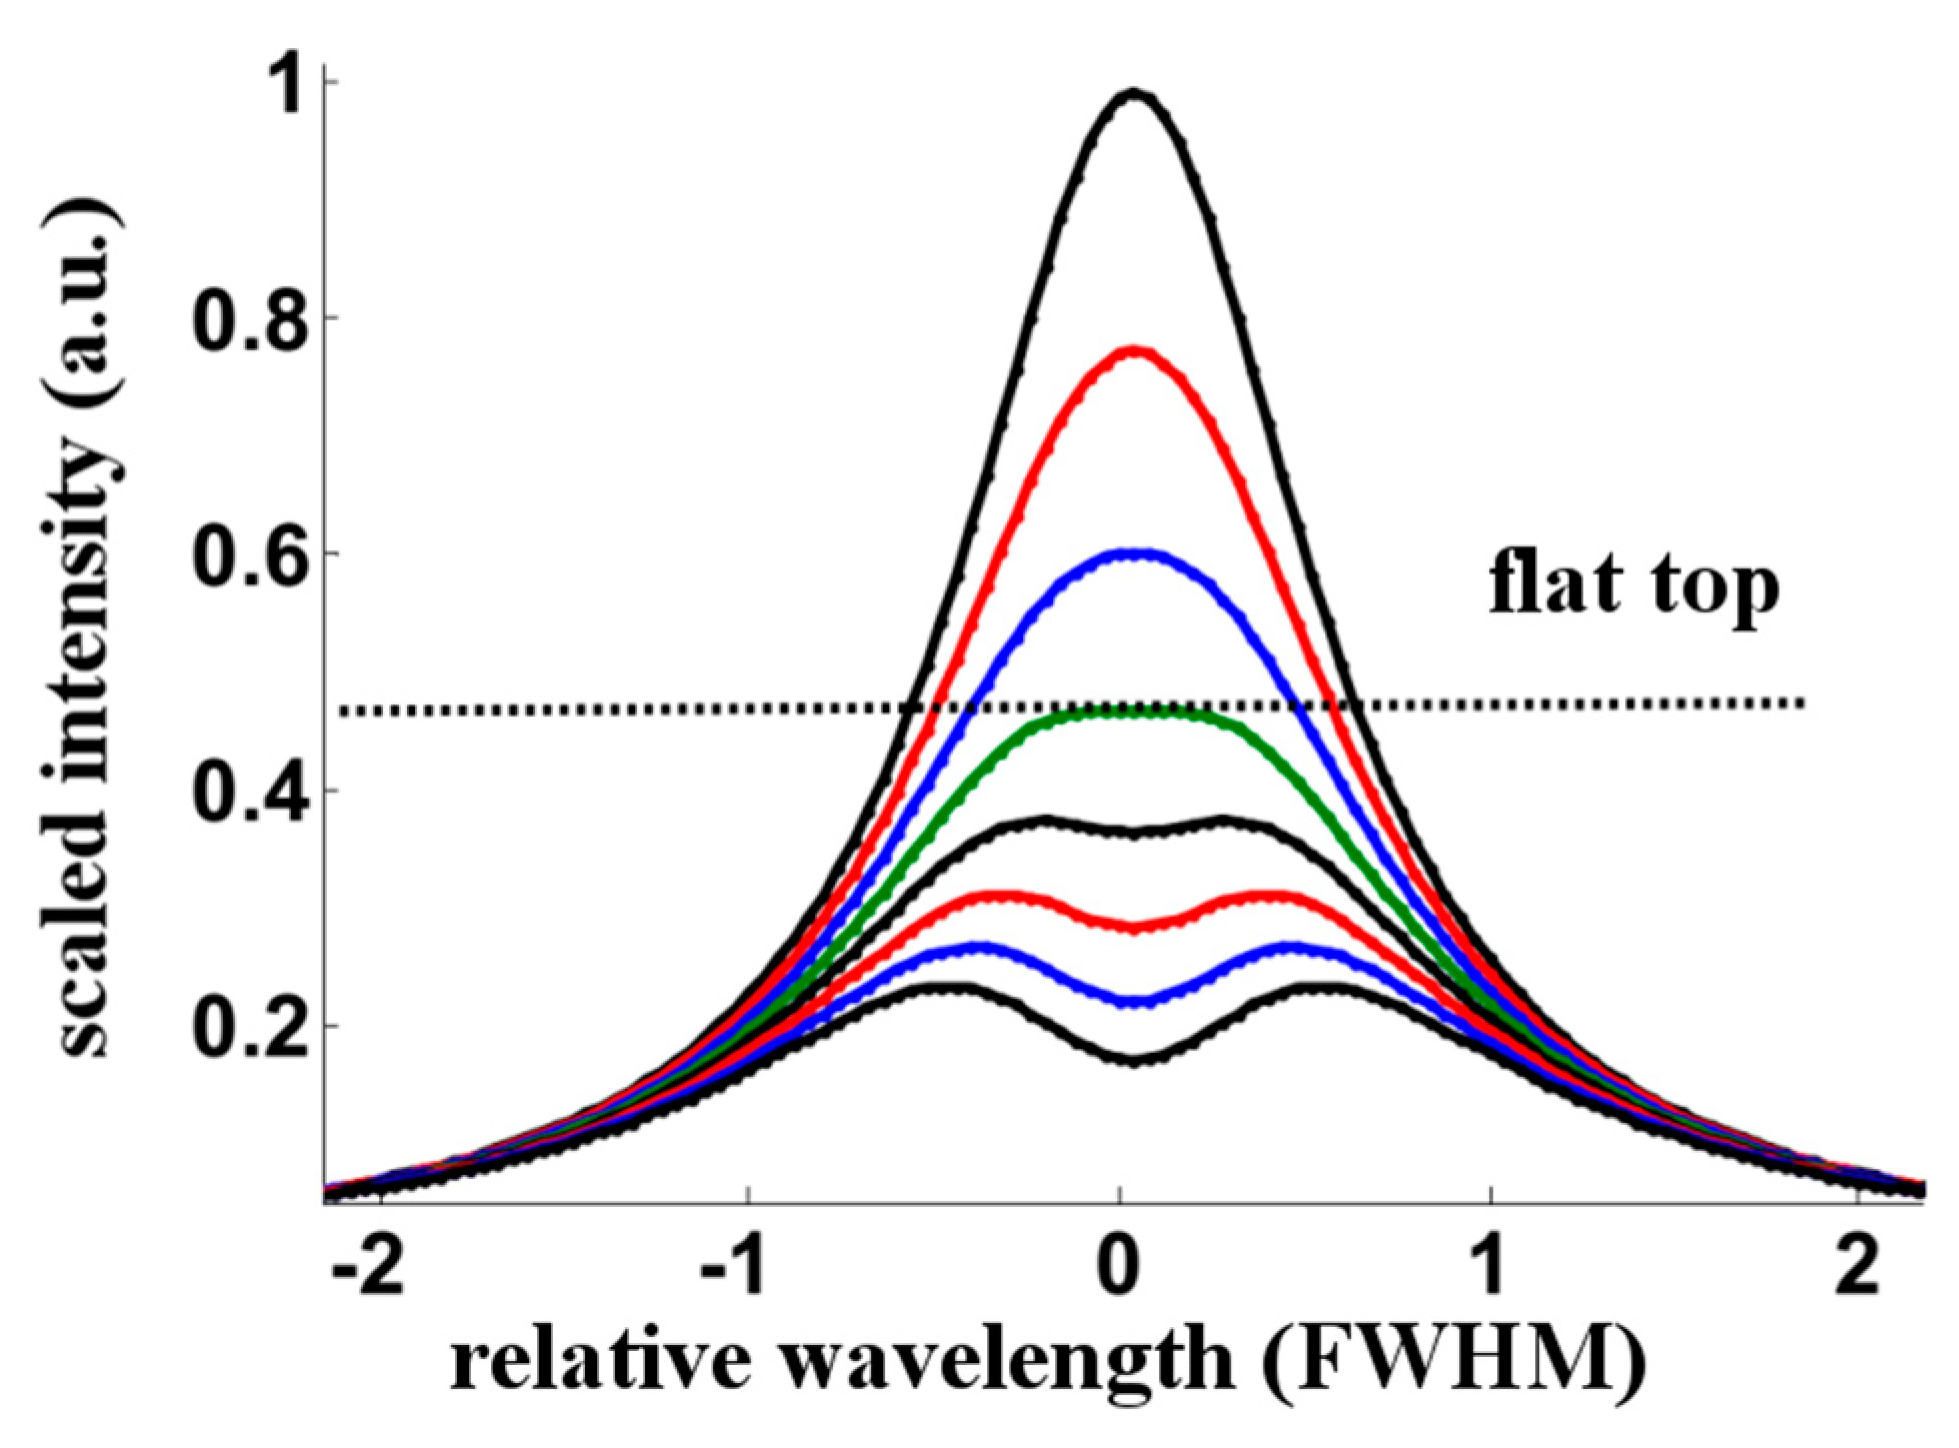
Figure 7 illustrates results for
ranging from 0.25 to 2 at equal steps of 0.25, and for fixed Lorentzian FWHM of Δλ
s = 0.5 nm. The line shape indicates a flat top for unity optical thickness, i.e.,
. For values higher than unity, self-absorption affects the line shape primarily at the center [
2].
The fitting of the argument in Equation (2) to the experimentally measured line shape can be formulated with two line-shape parameters, namely, the self-absorbed Lorentzian FWHM, Δλ
S1, and the optical depth,
, at line center [
2].
The self-reversal parameter, SR, is introduced for a quantitative description of the measured line shapes. The parameter SR indicates the ratio of transmitted and of weakly (κ (λ) ℓ << 1) affected intensities at line center,
or in terms of the transmittance, SR = T(
). Self-reversal diminishes the peak spectral radiance as well. In comparison with self-absorption, self-reversal causes further apparent enlargement of the FWHM, Δλ
S2, with Δλ
S2 > Δλ
S1. In analogy with the derivation of self-absorption [
3], one can write
. The value for the exponent is taken to be α = –0.54, in analogy to previously reported self-absorption studies [
3]. The self-reversal factor, SR, is functionally identical to that for the self-absorption factor [
3], SA,
. Here, Δλ and Δλ
S0 indicate the FWHM of spectral lines with and without self-absorption, respectively.
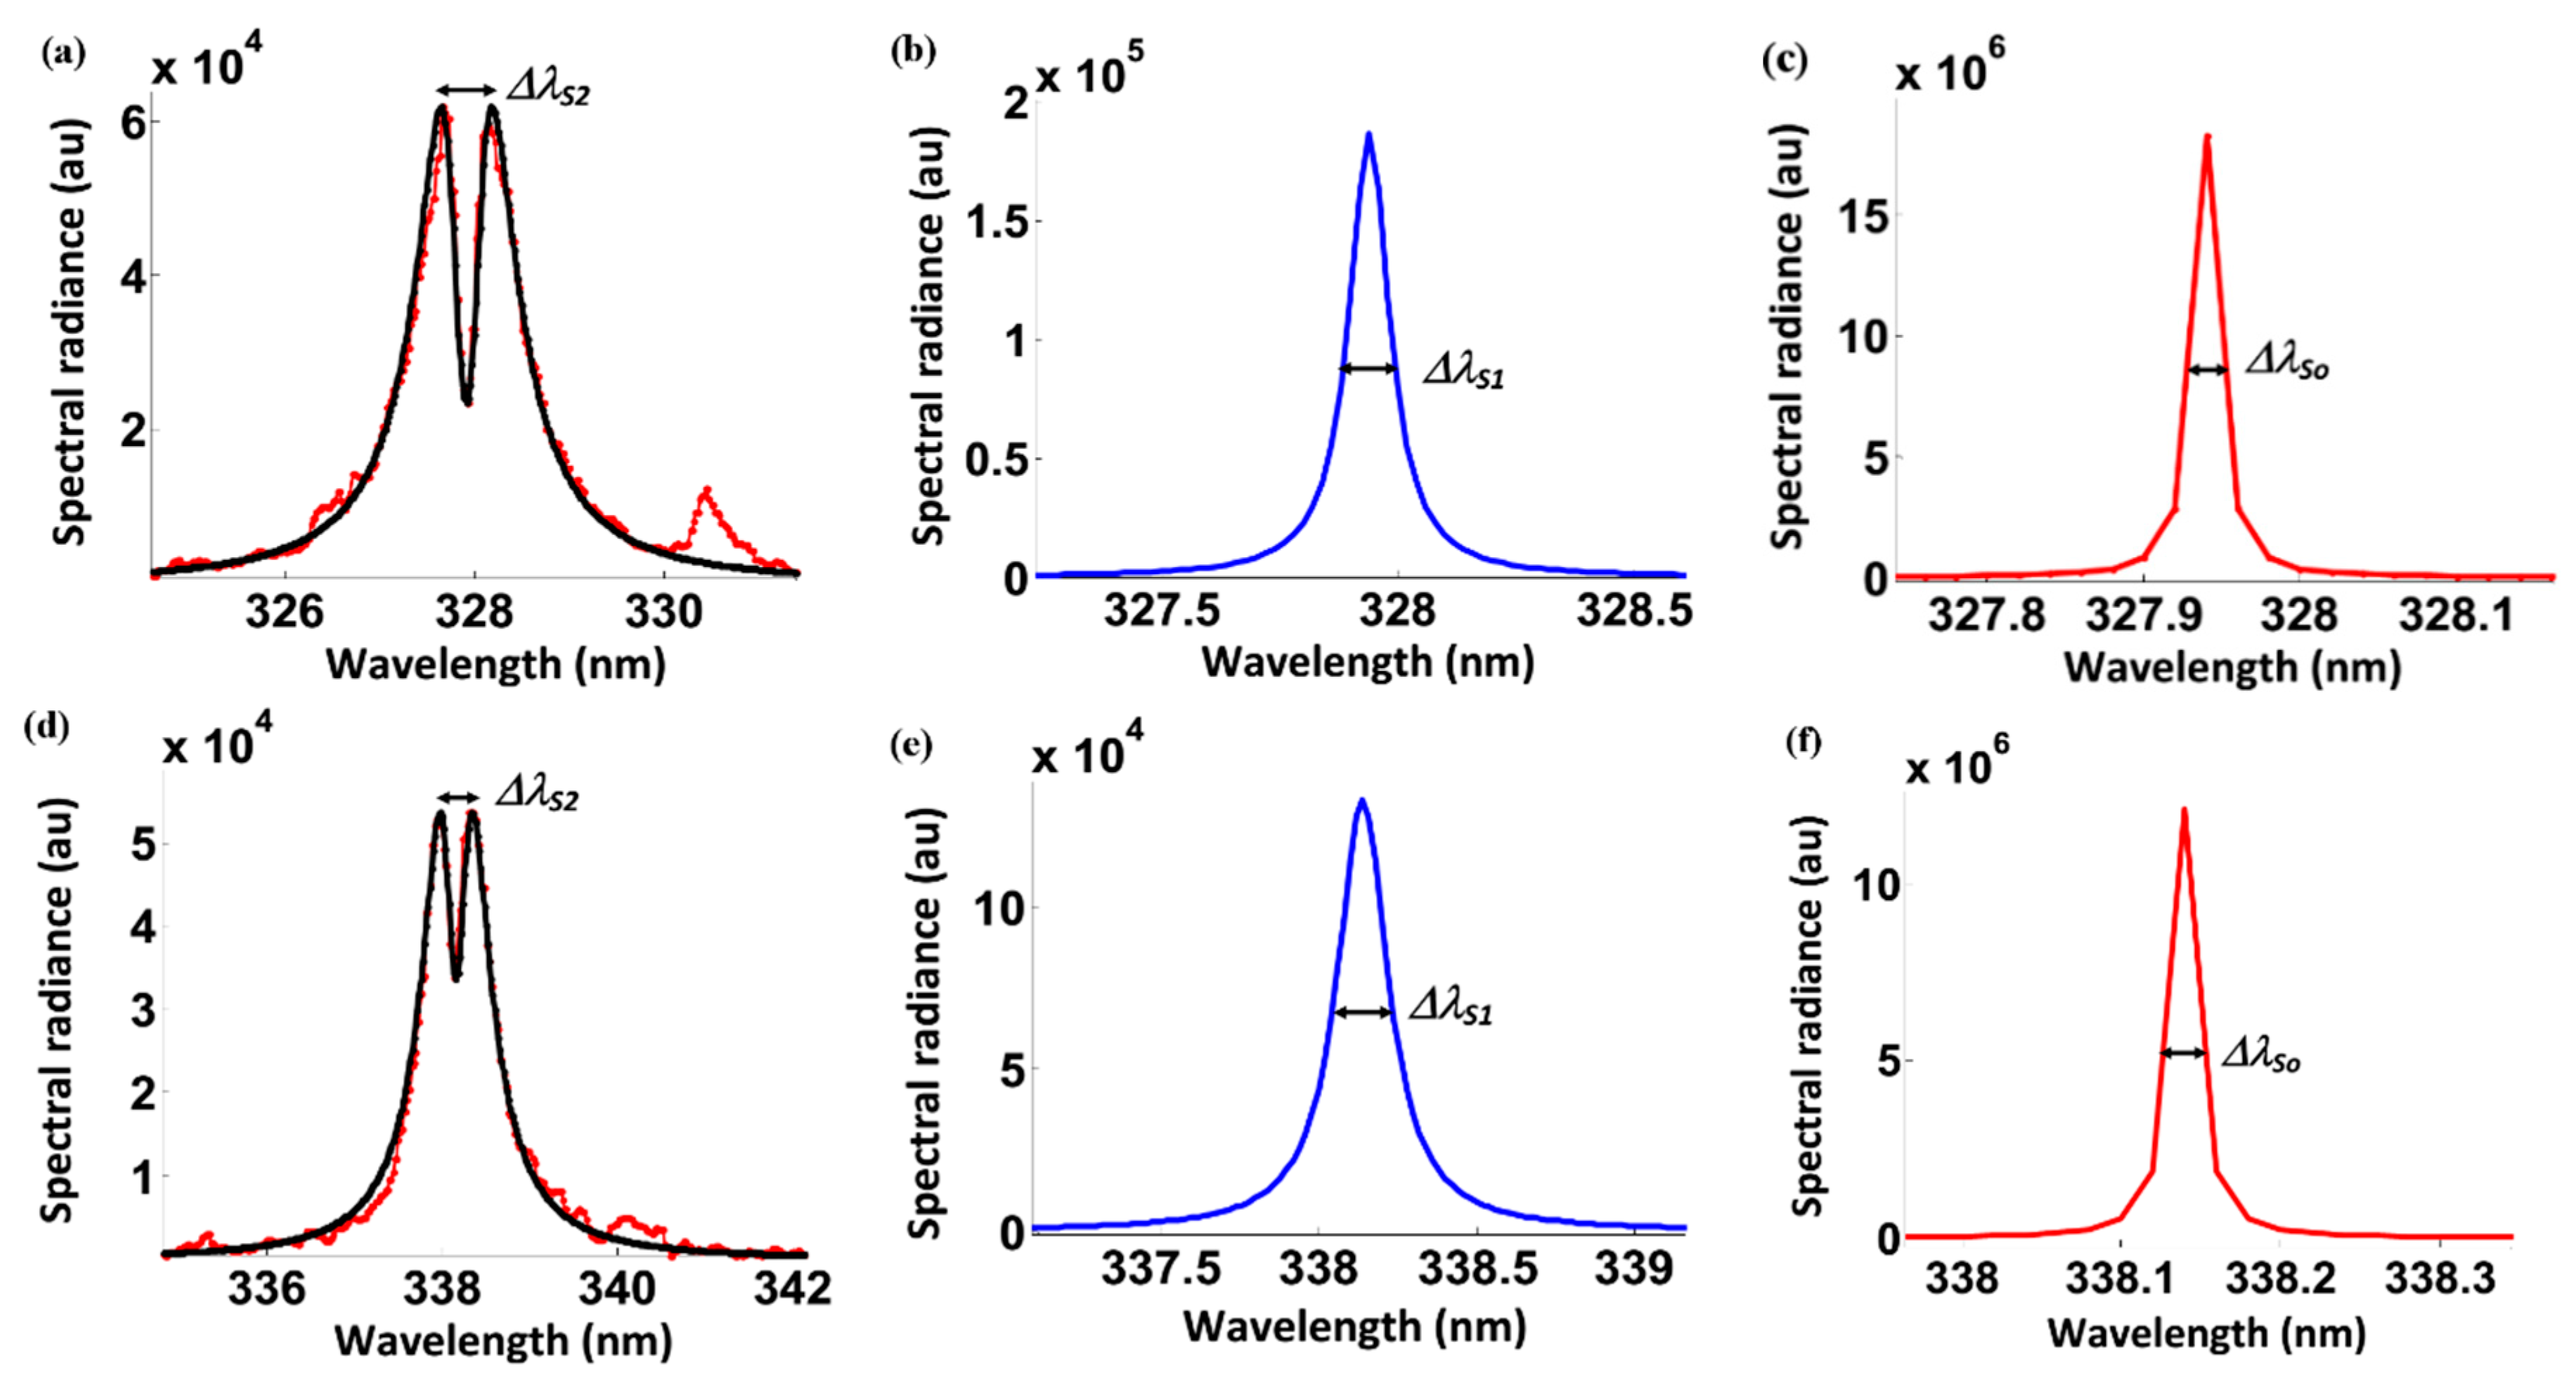
Figure 8 summarizes two typical examples of the discussed spectral line shape analysis for the measured Ag I lines at 327.9 and 338.2 nm.
Figure 8a,d display self-reversed data,
Figure 8b,e portray corrected lines that are still self-absorbed, and
Figure 8c,f illustrate the retrieved line-shapes when using data from the optically thin line at 827 nm.
The measured widths and plasma transmission percentages (typically 33% and 40% for the reported experiments) are included in the figure captions. The theoretical, asymptotic form for the transmittance of a Lorentzian line profile [
2,
6] equals
The theoretical transmittances are compatible with SR factors of 0.32 and 0.38. The measured line shapes are well-described by the fitted Lorentzians. However, for sake of simplicity, this discussion omits Gaussian components due to instrumental broadening of Δλ
instrument ~0.12 nm.
Figure 8a,d show a significant reduction in intensity along with an apparent increase in broadening (Δλ
S2). The self-reversal coefficients are relatively small (SR = 0.32 and SR = 0.38), but due to line center effects [
2,
5,
6,
7,
8,
9,
10] dips occur. Noteworthy in this work, self-reversal (quantified by the coefficient SR) is almost independent of the laser fluence, but self-absorption (SA) changes monotonically with laser fluence.
In this example, the self-reversal peak separation provides values for Δλ
S2, using the FWHM of lines with the dip would cause even larger discrepancies for the electron density, n
e. From Equation (5), computed Δλ
S1 would show electron densities that are ~ ten times higher than obtained from the optically thin line that was retrieved by comparison with 827-nm results. When using lower fluence levels for these two lines, larger variances occur in inferred n
e values. From Δλ = Δλ
S0 SA
α, a factor of ten higher electron density means that the self-absorption factor is of the order of SA ~ 0.01. For self-absorption, the magnitude of the peak spectral irradiances can be evaluated [
3] using I
0(λ
0) ~ I
1(λ
0)/SA, leading to two orders of magnitude higher irradiances. Such discrepancy indicates significant self-absorption and line reversal for the selected example.


