Atomic and Molecular Laser-Induced Breakdown Spectroscopy of Selected Pharmaceuticals

 ,
,  , and
, and 
Abstract
:1. Introduction
2. Results
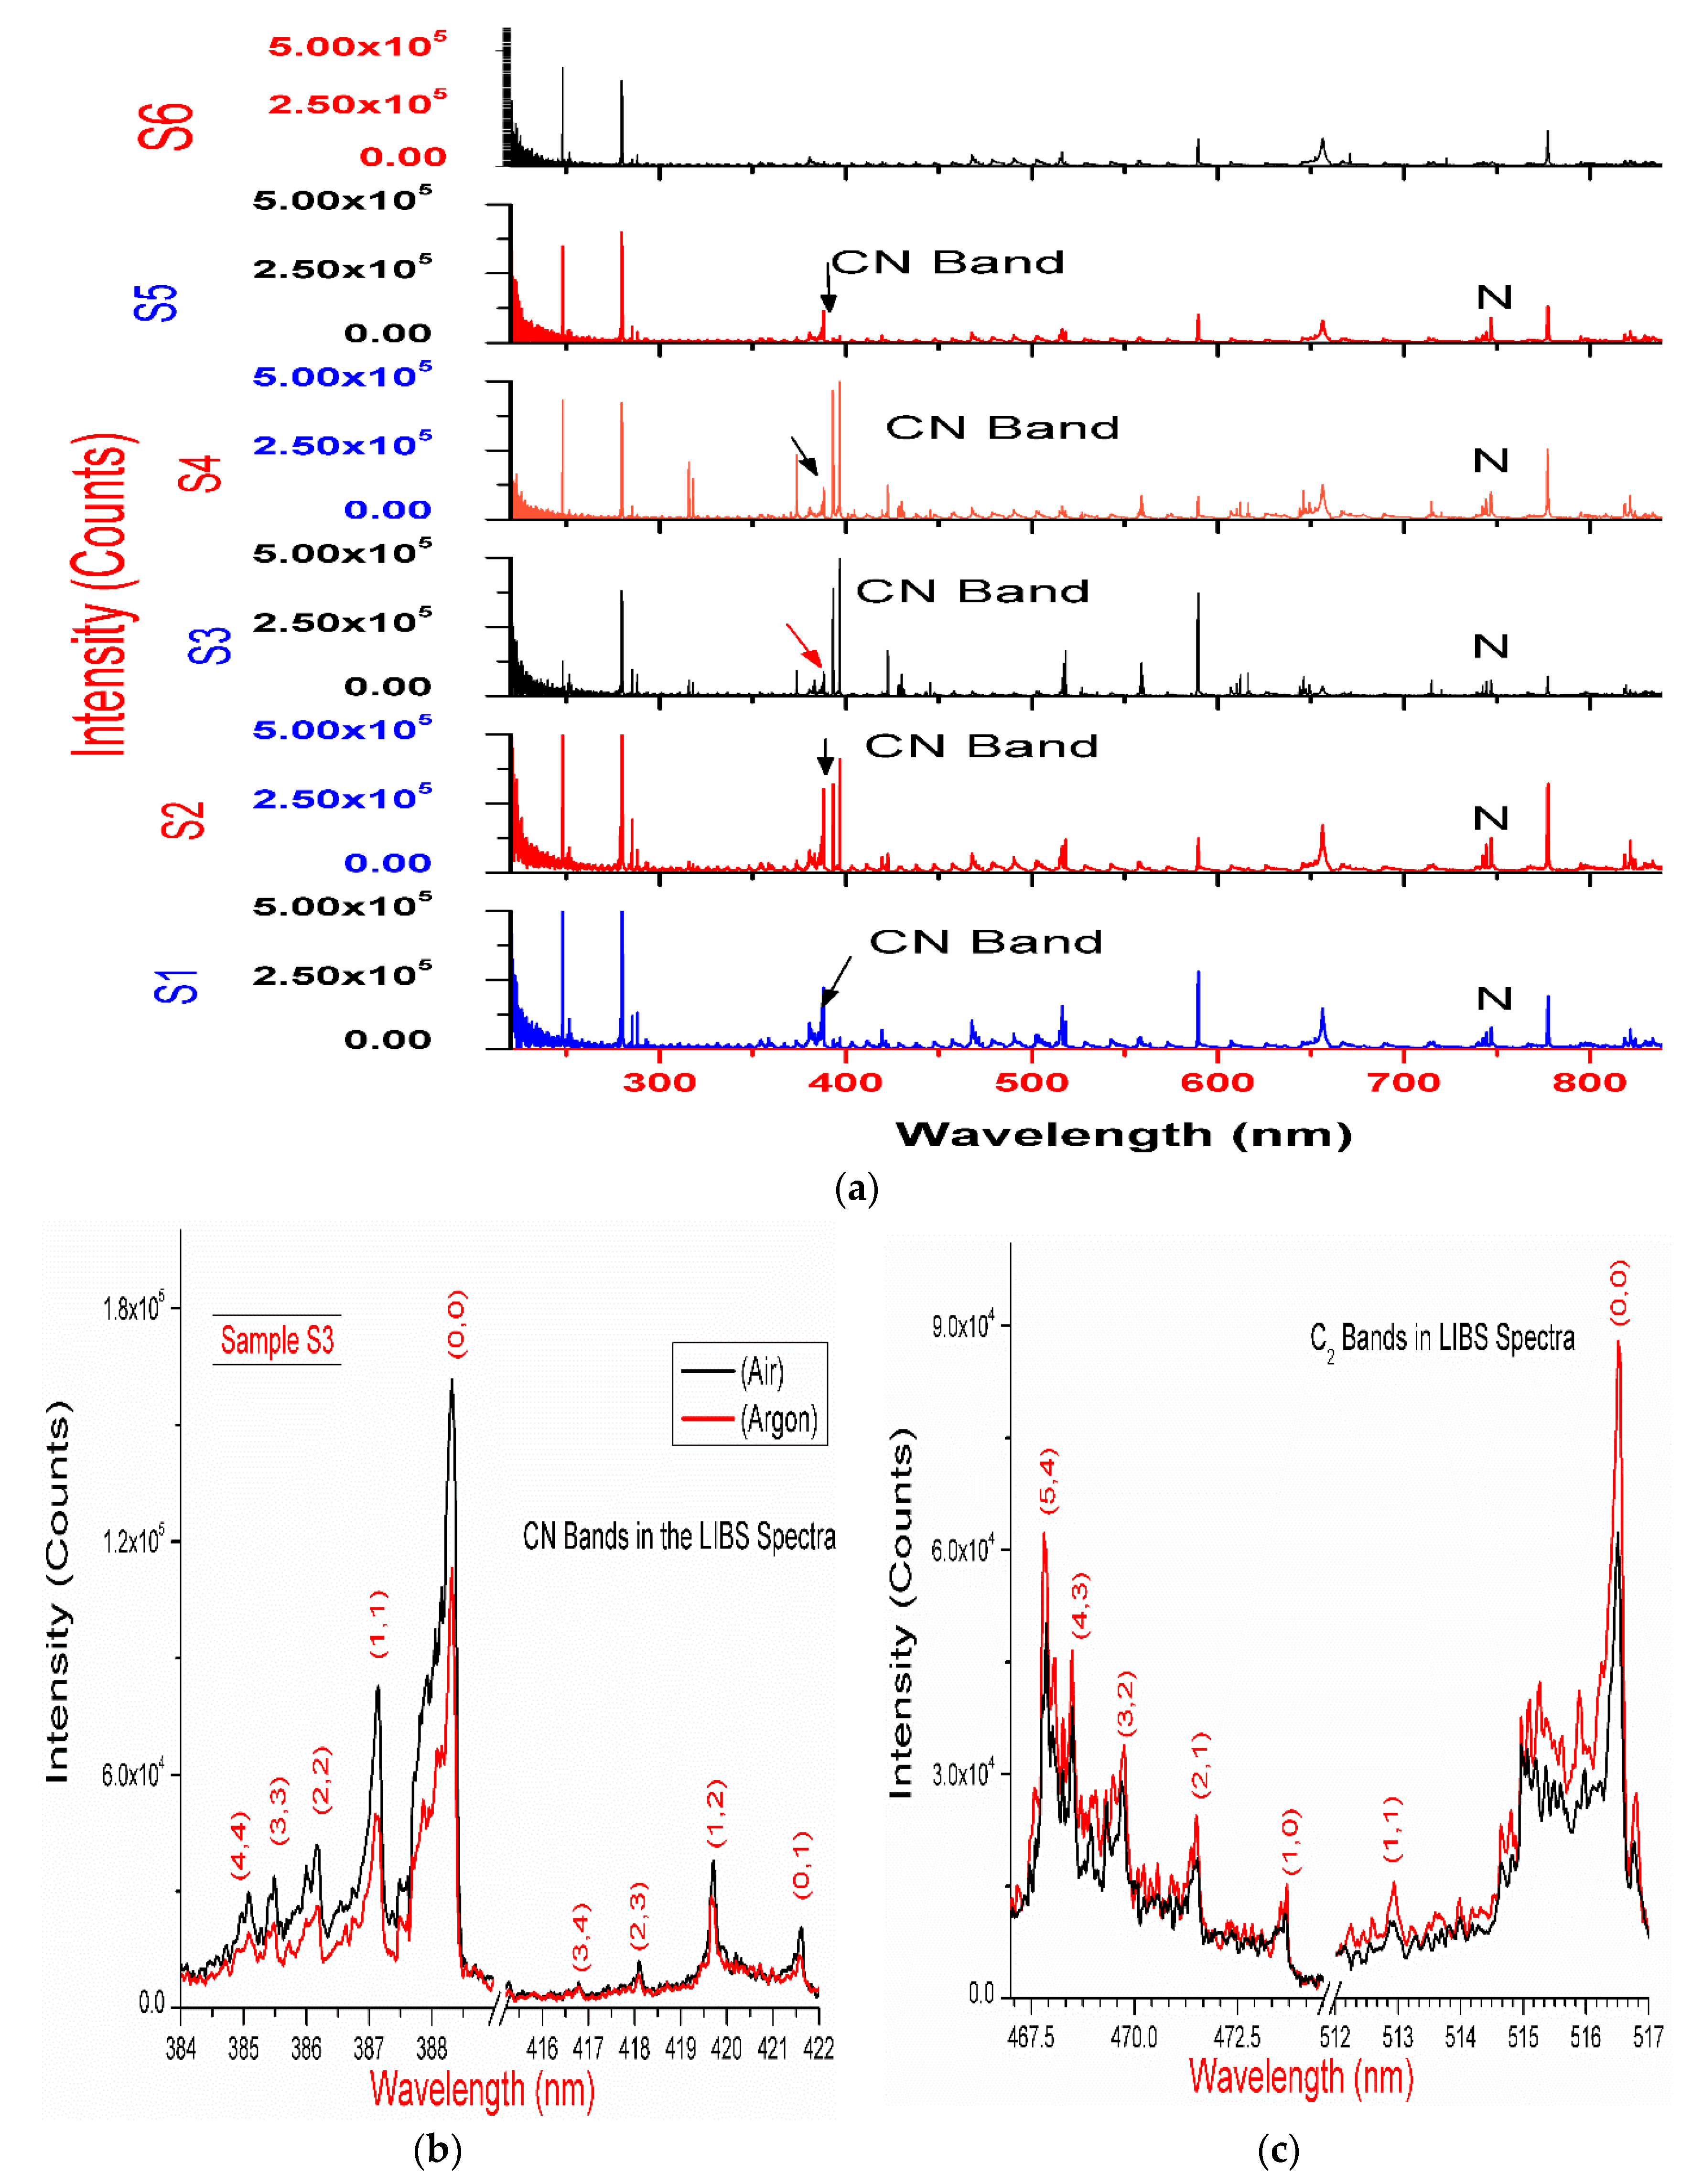
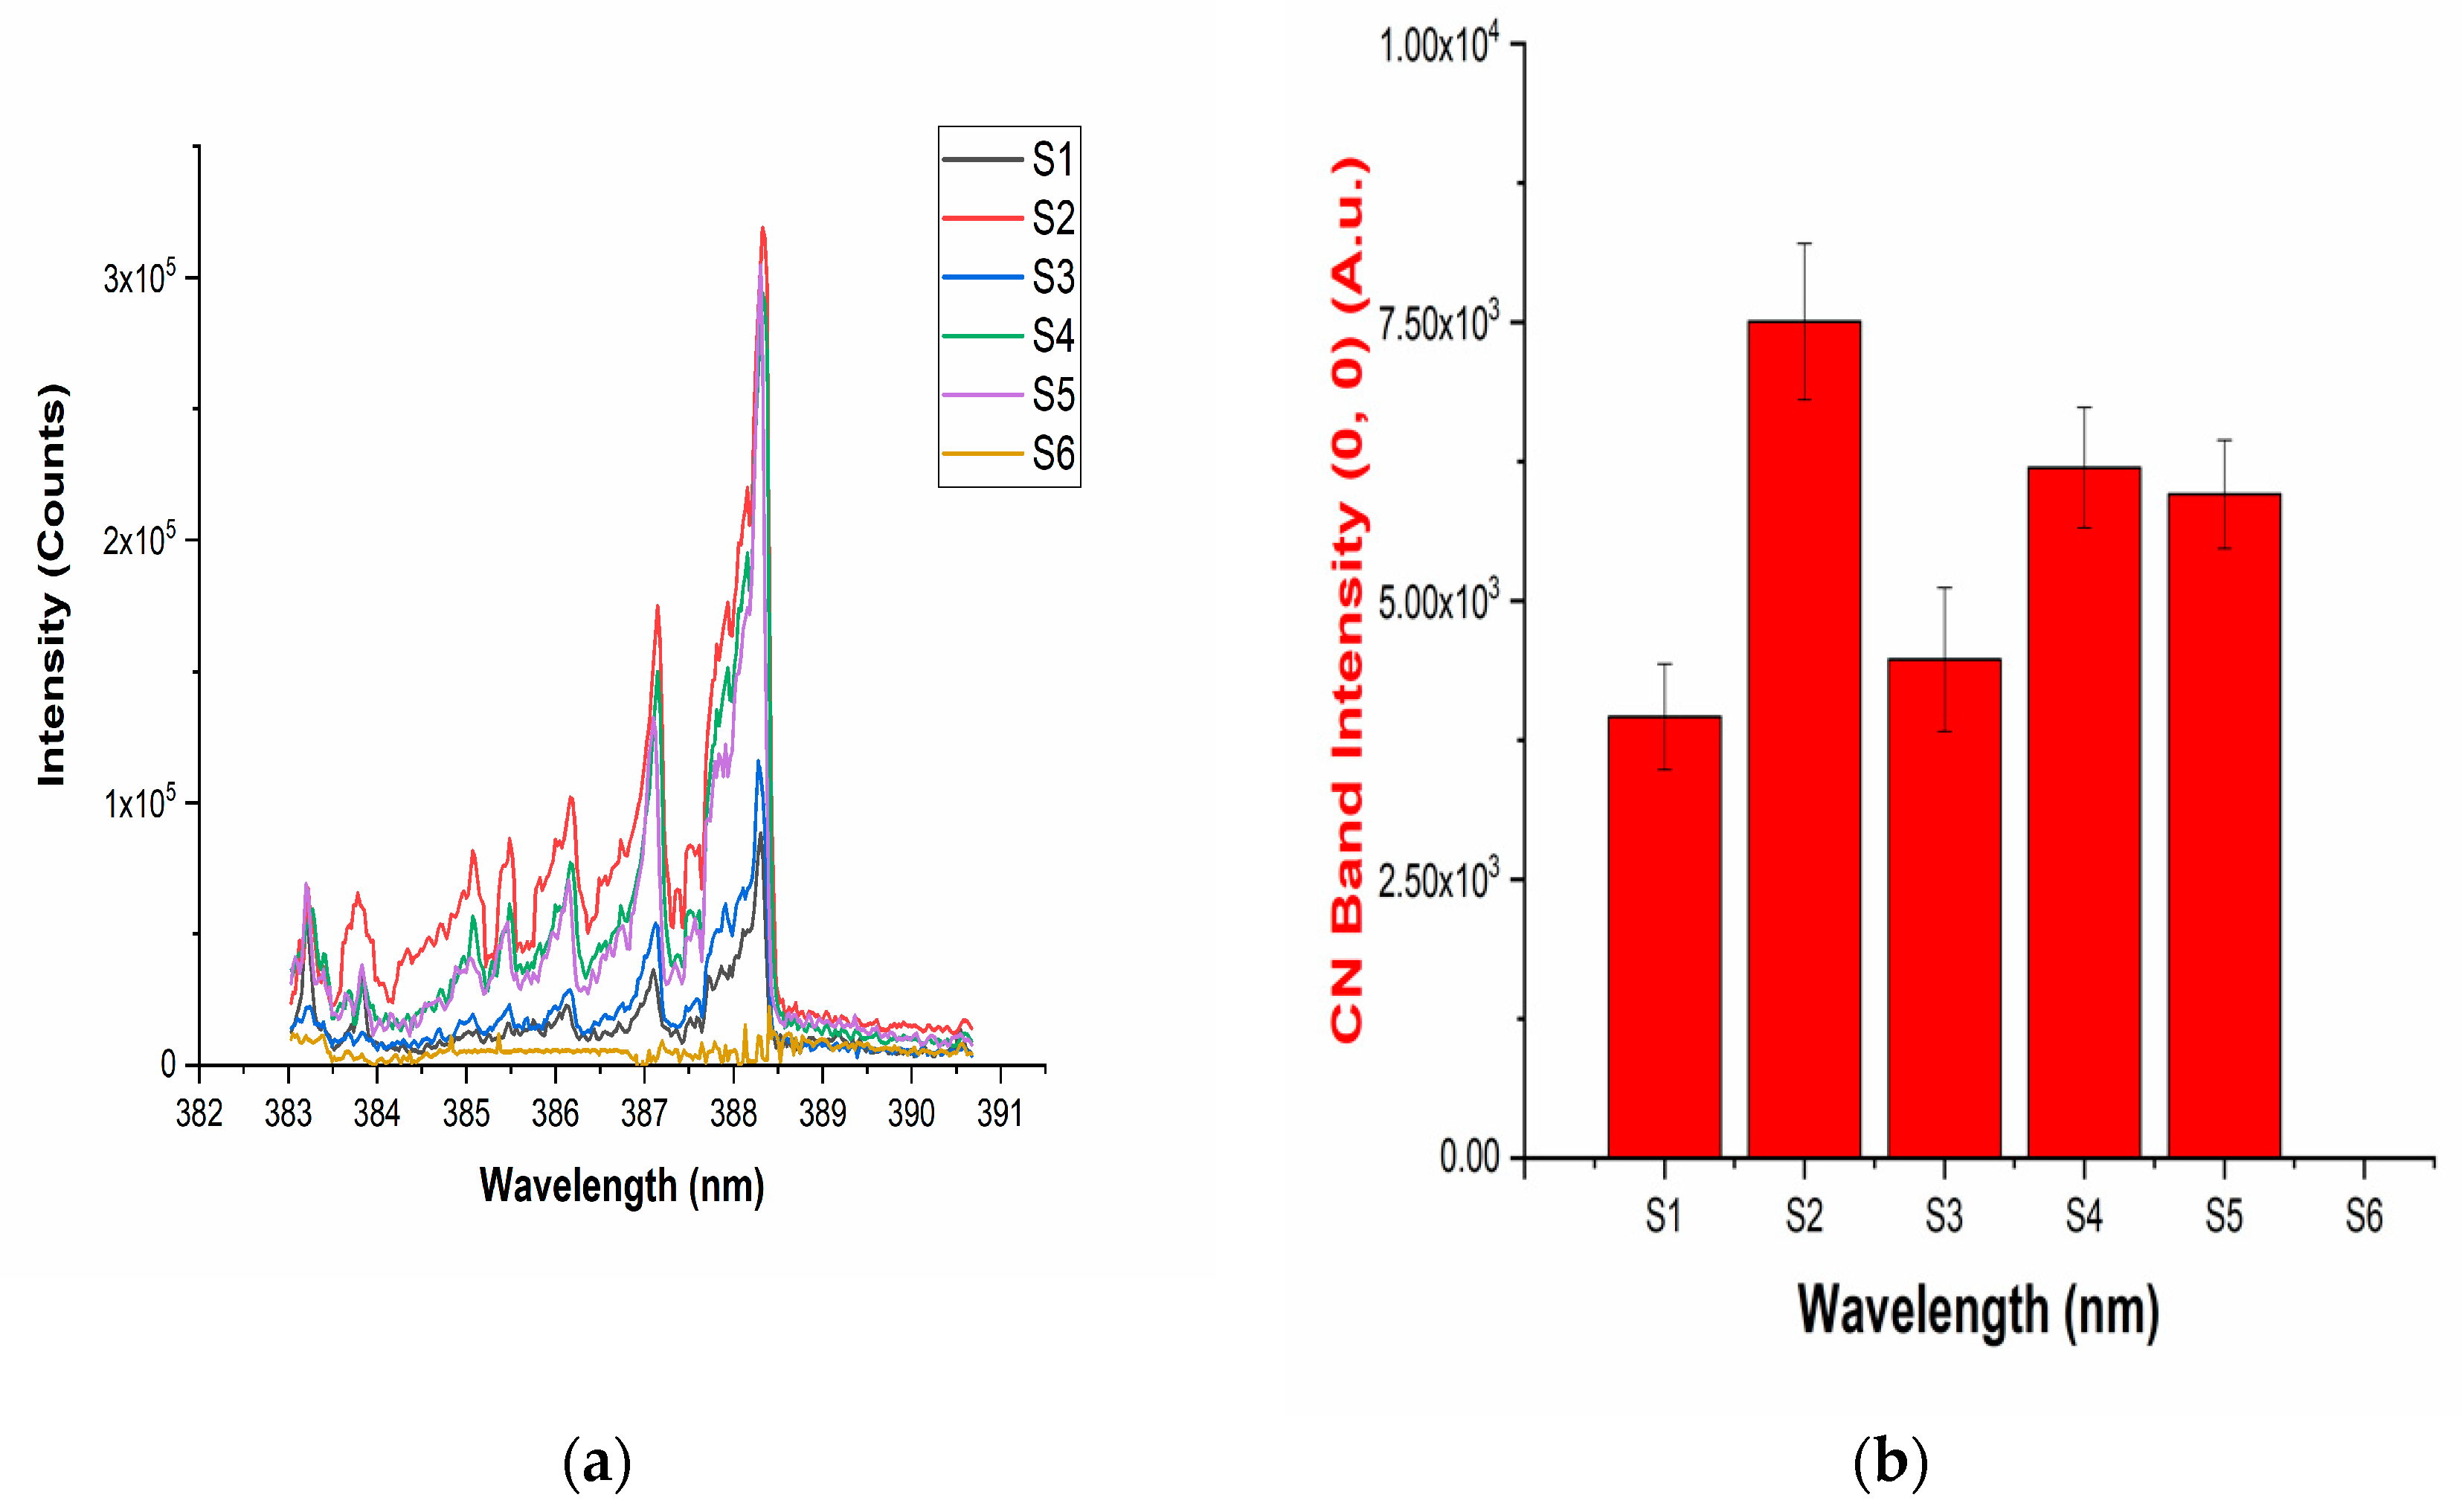
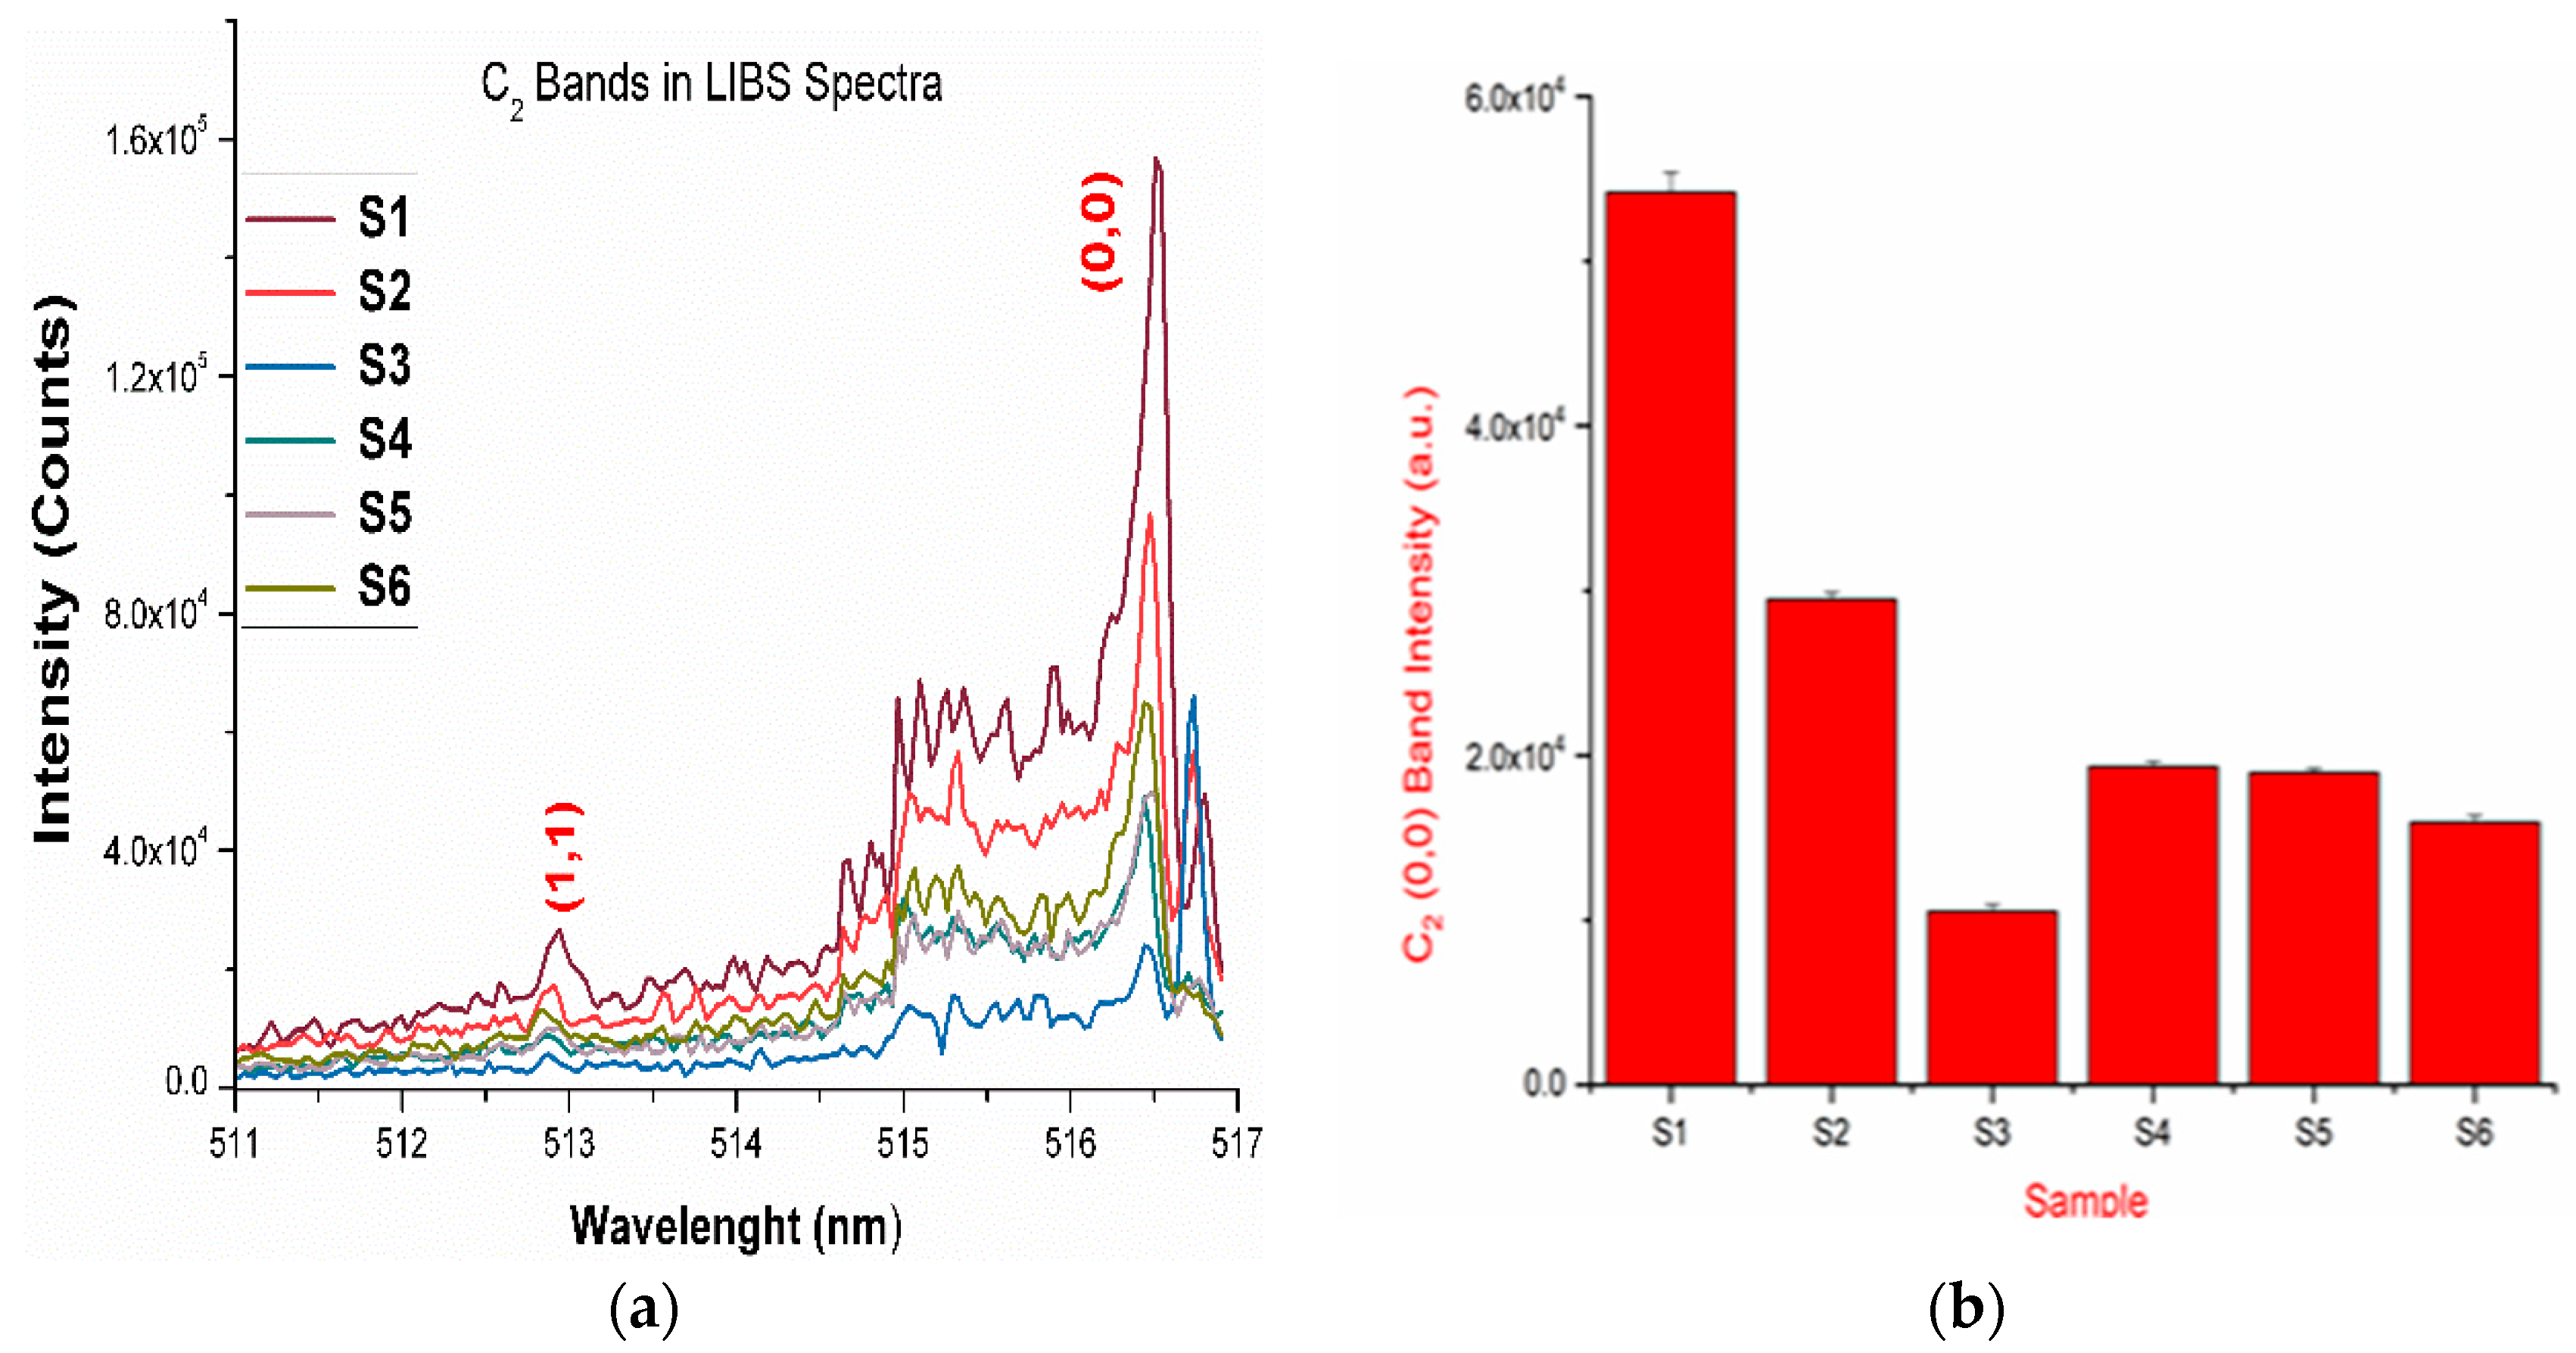
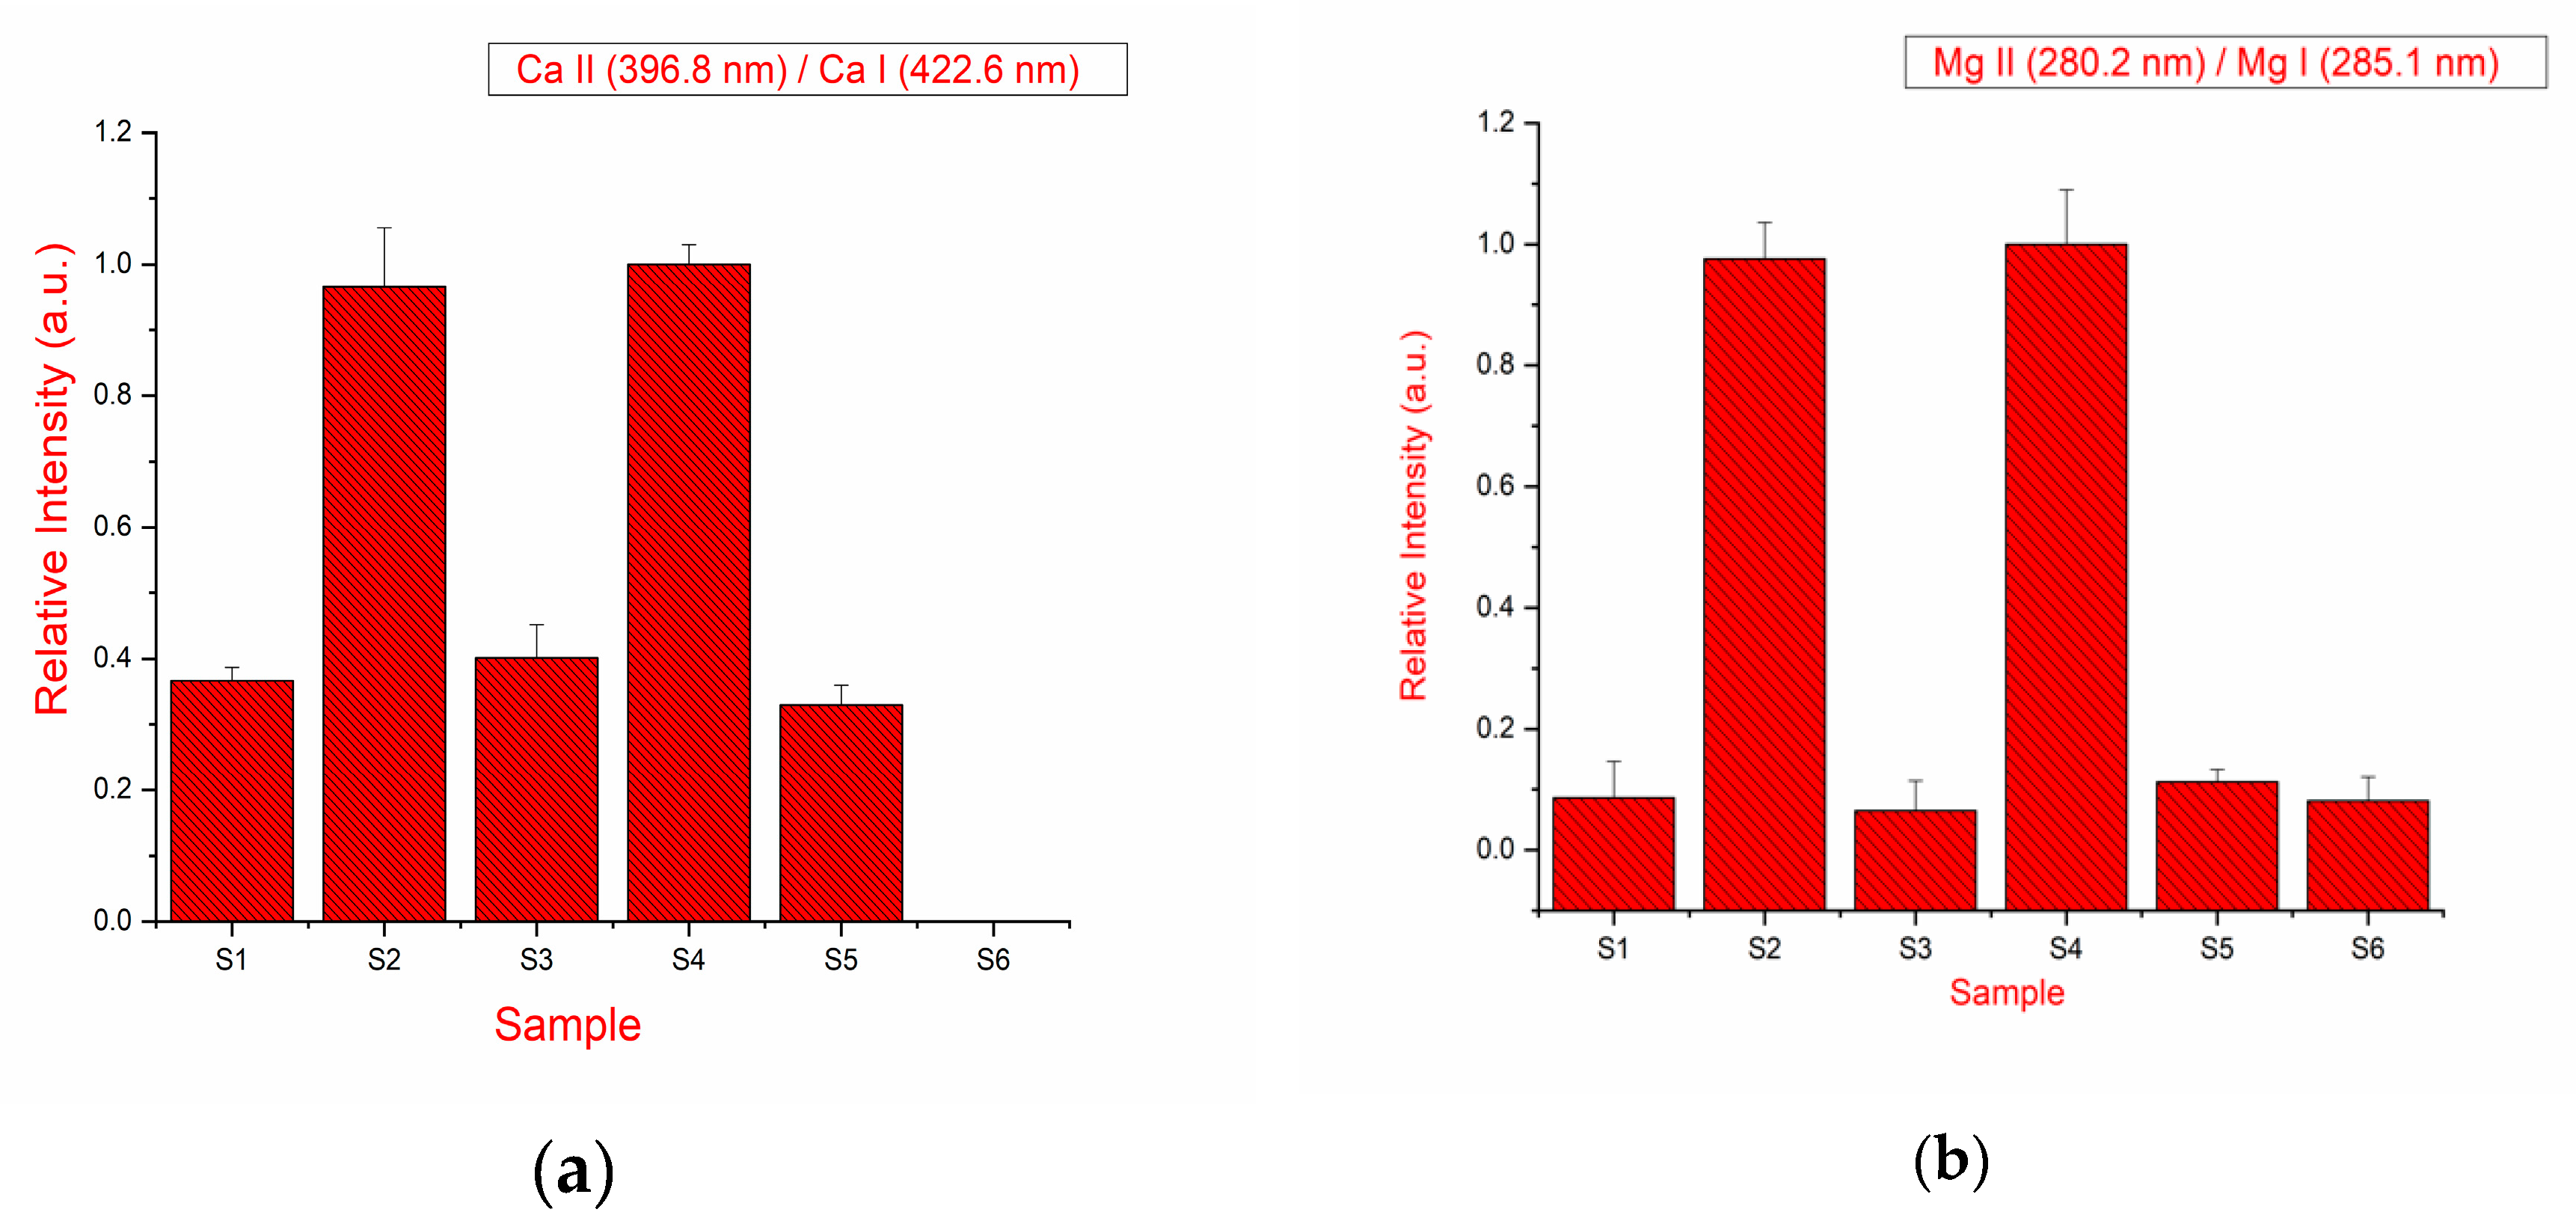
2.1. LIBS Analysis
2.2. Relative Hardness of the Tested Drugs
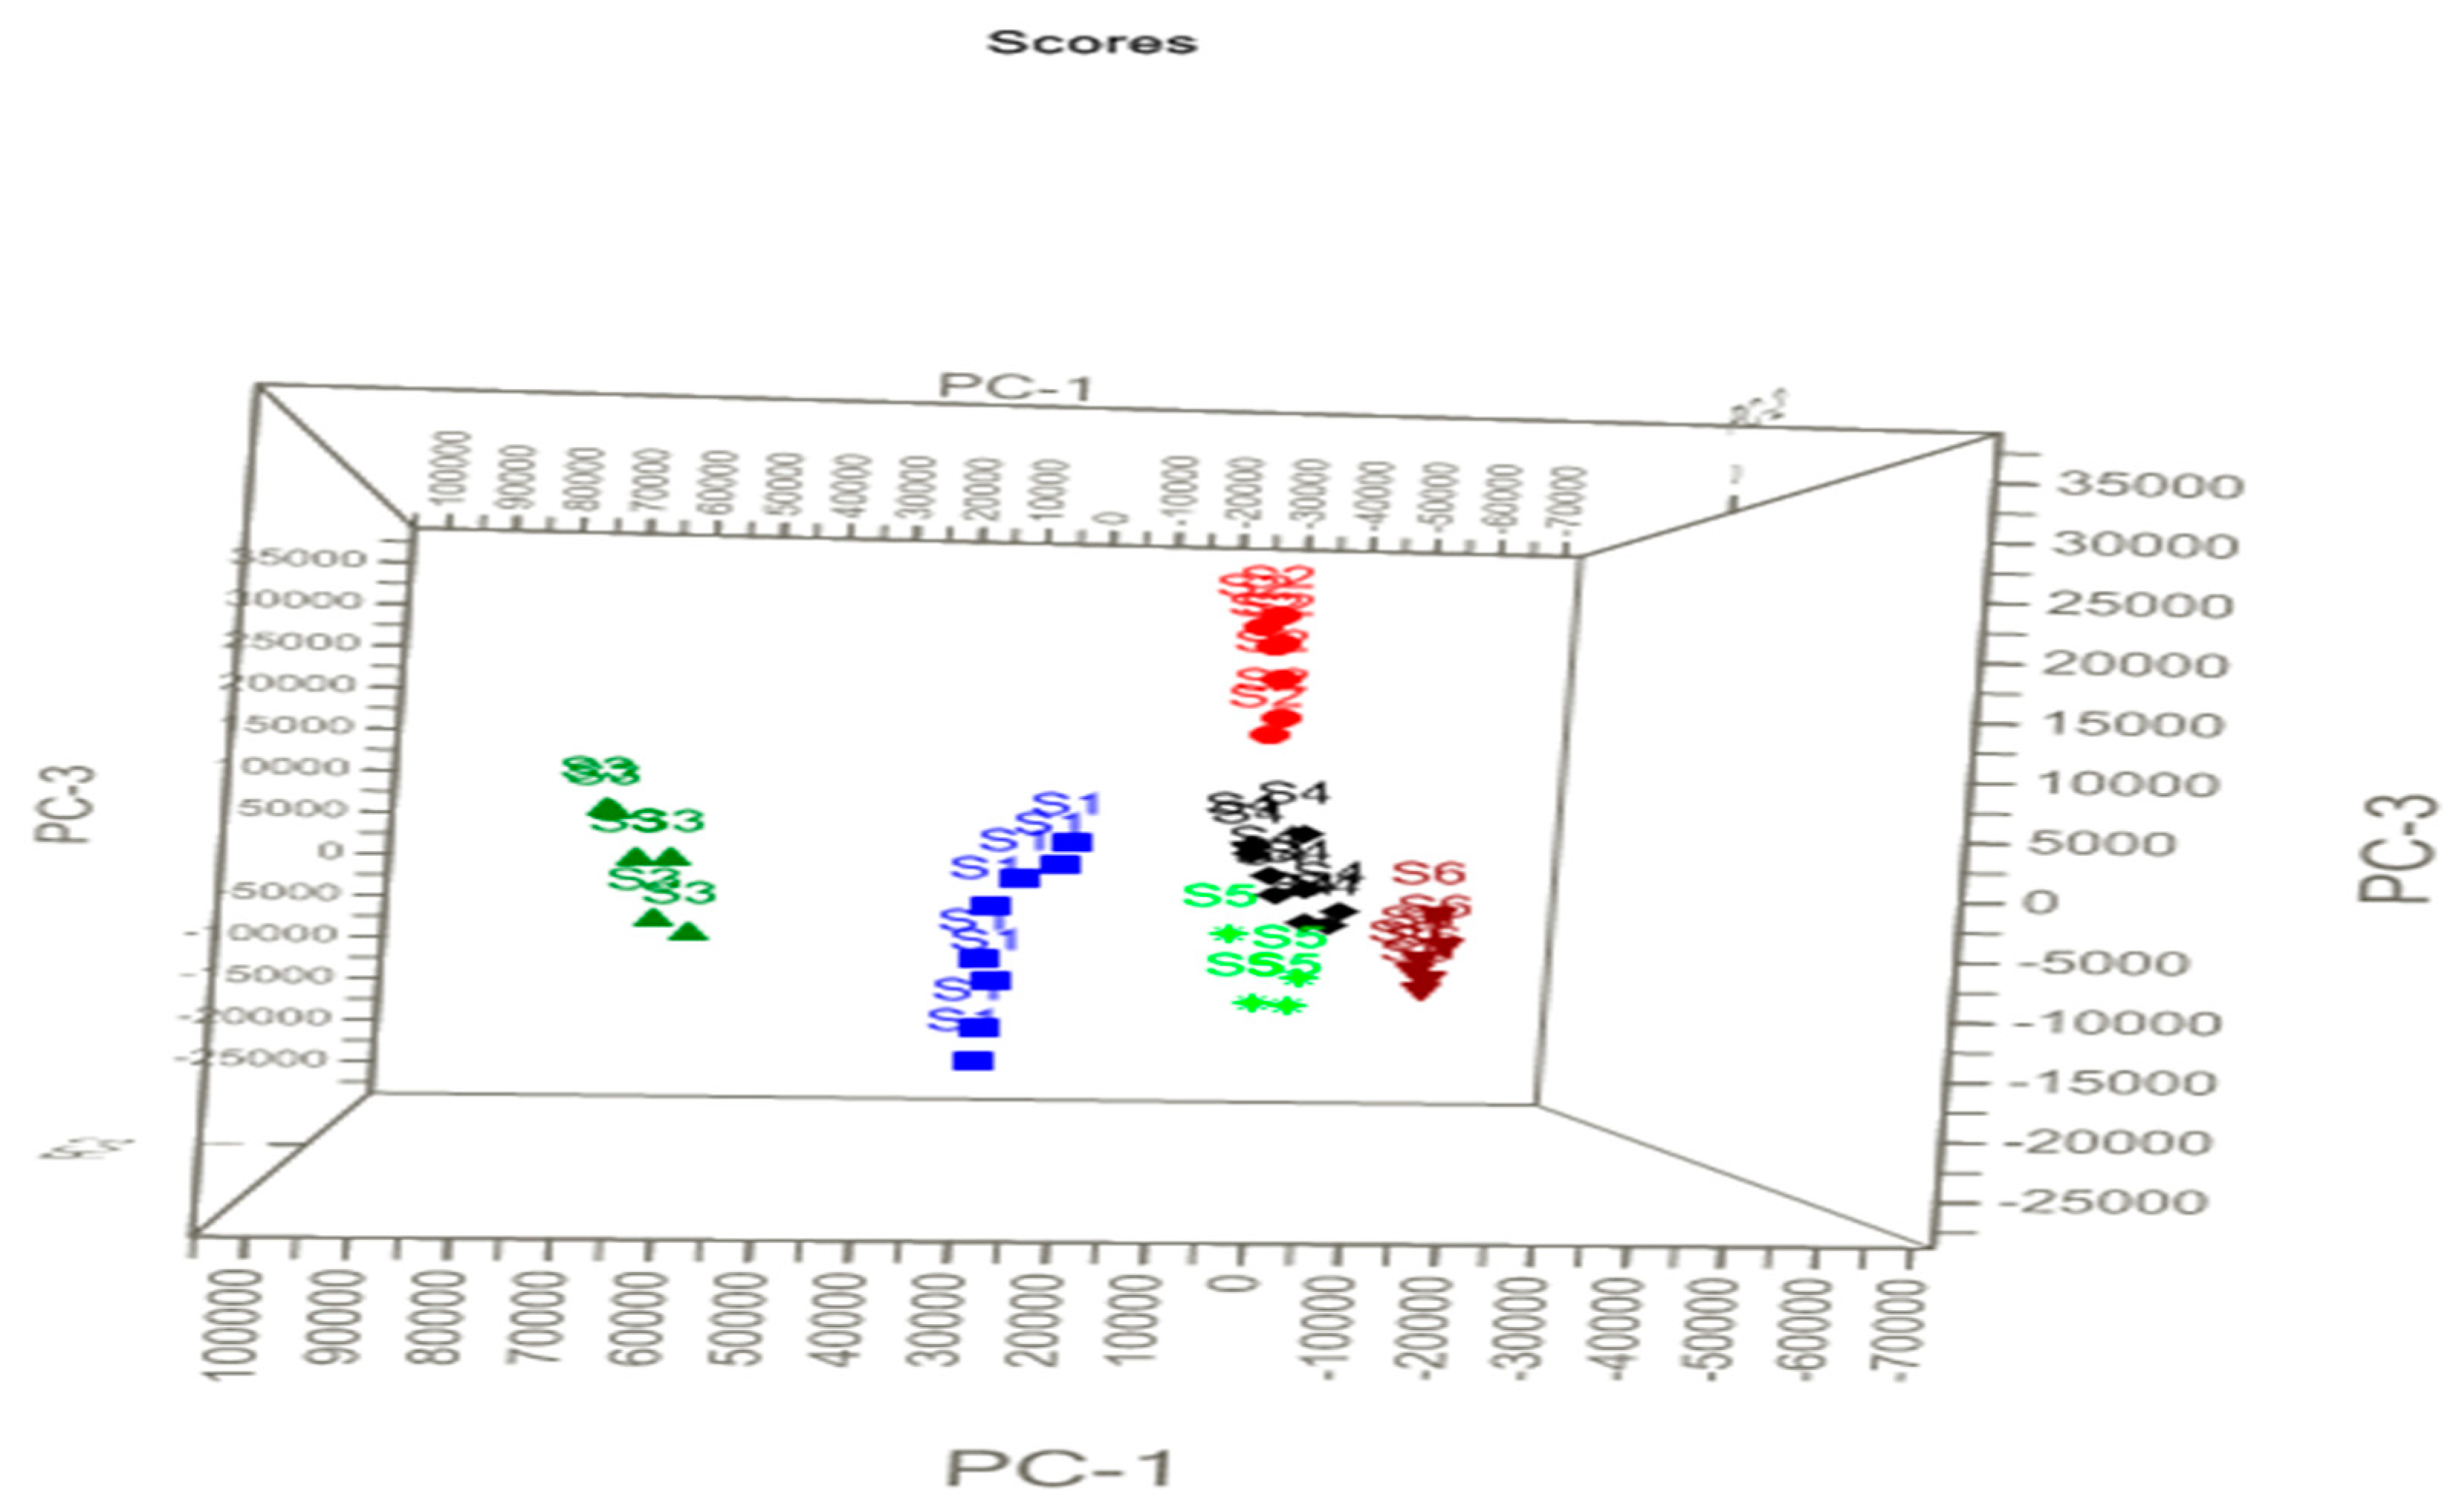
2.3. Principal Component Analysis (PCA)
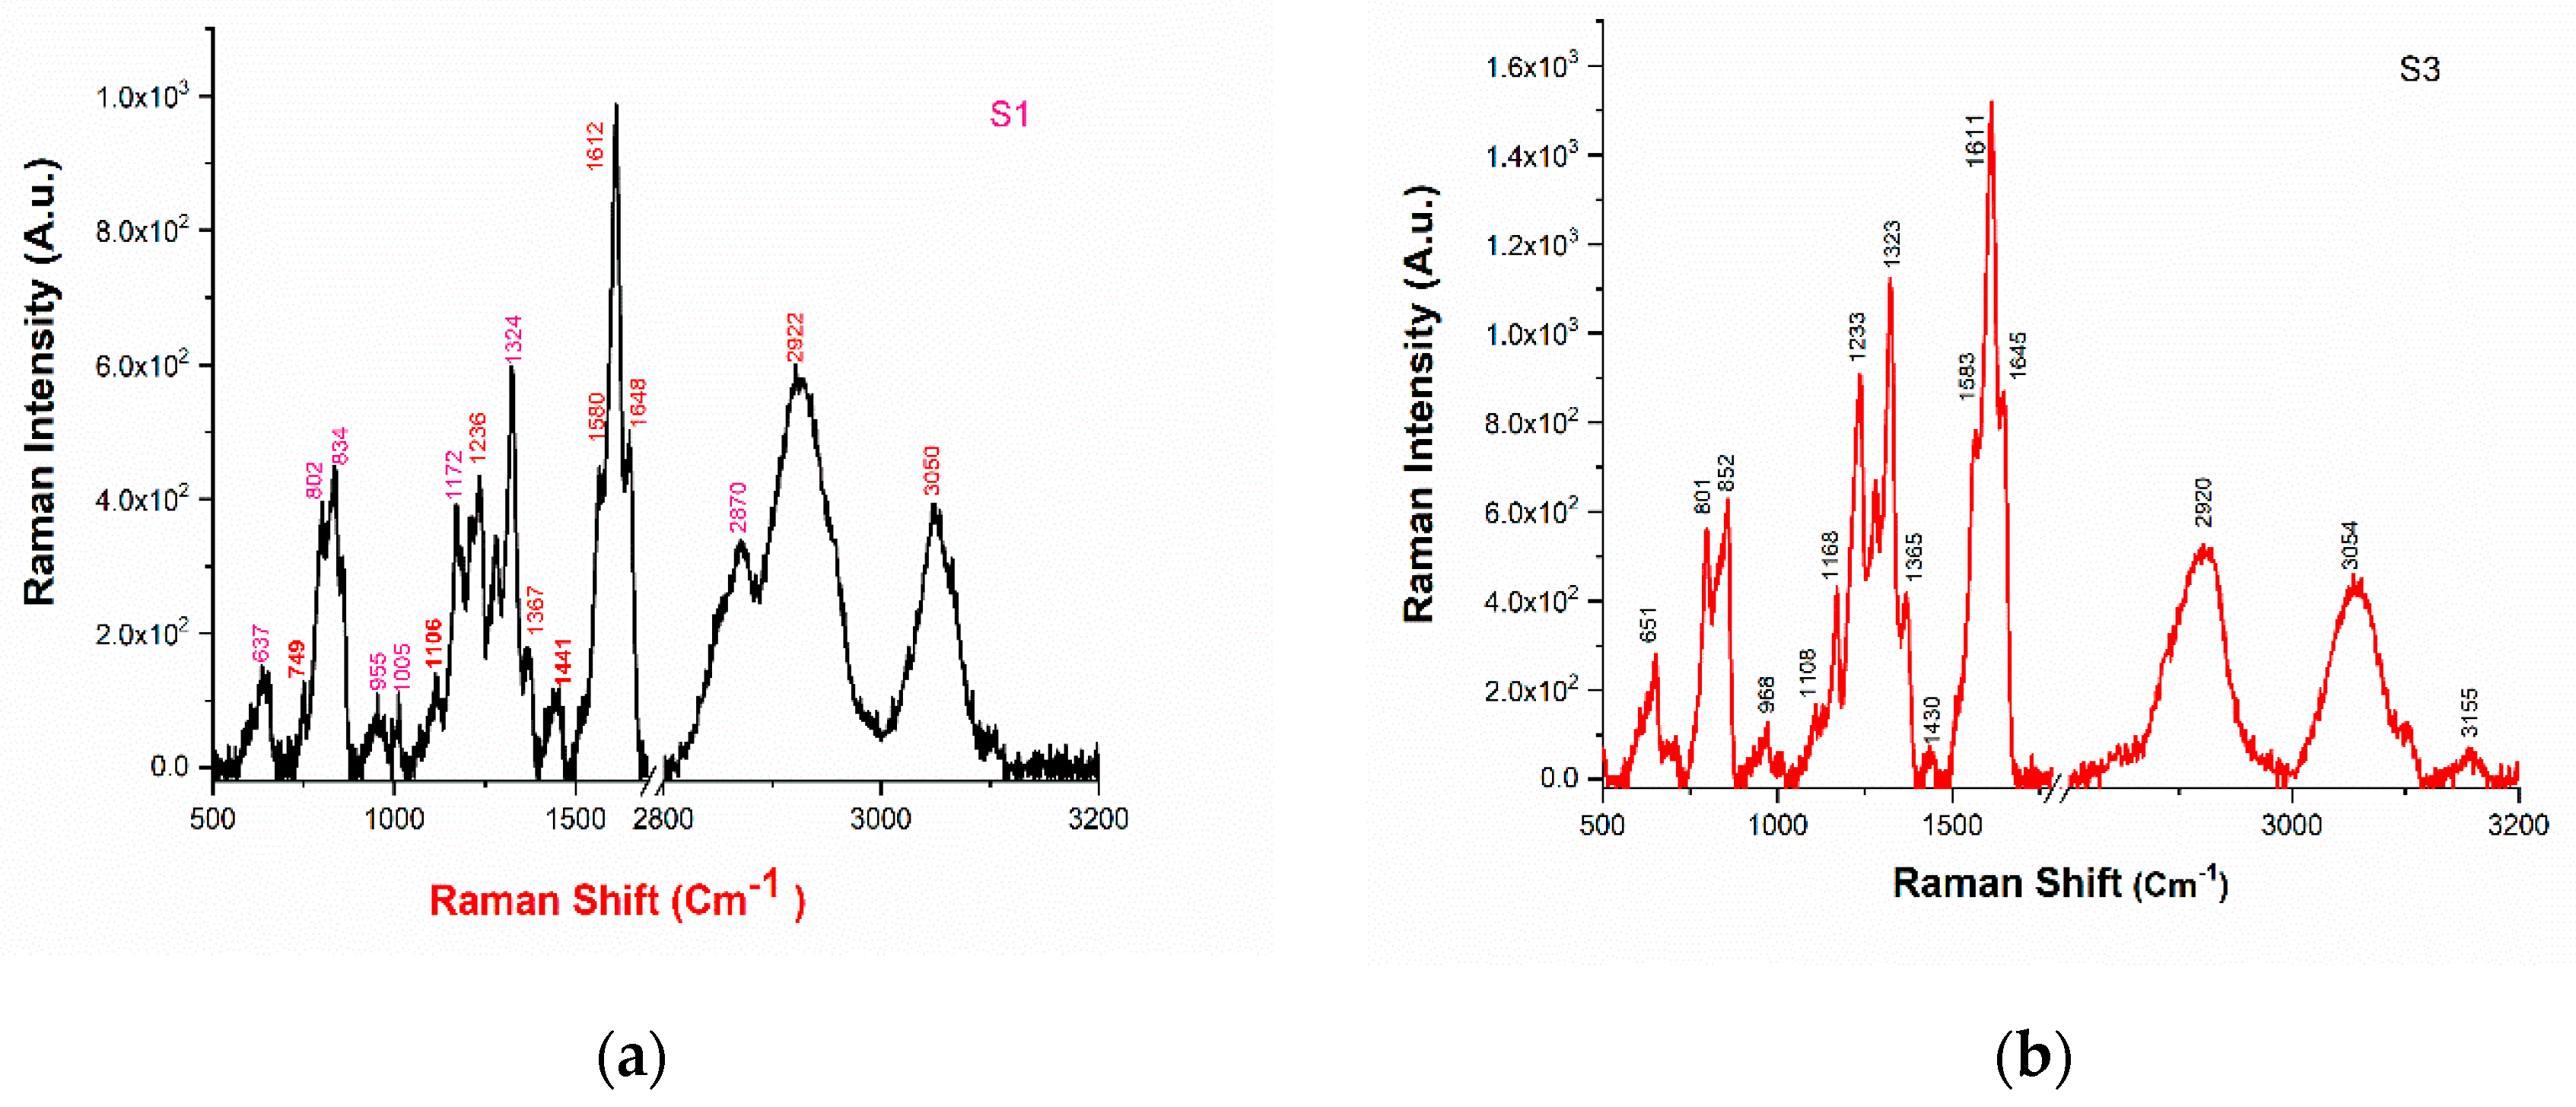
2.4. Raman Spectroscopy
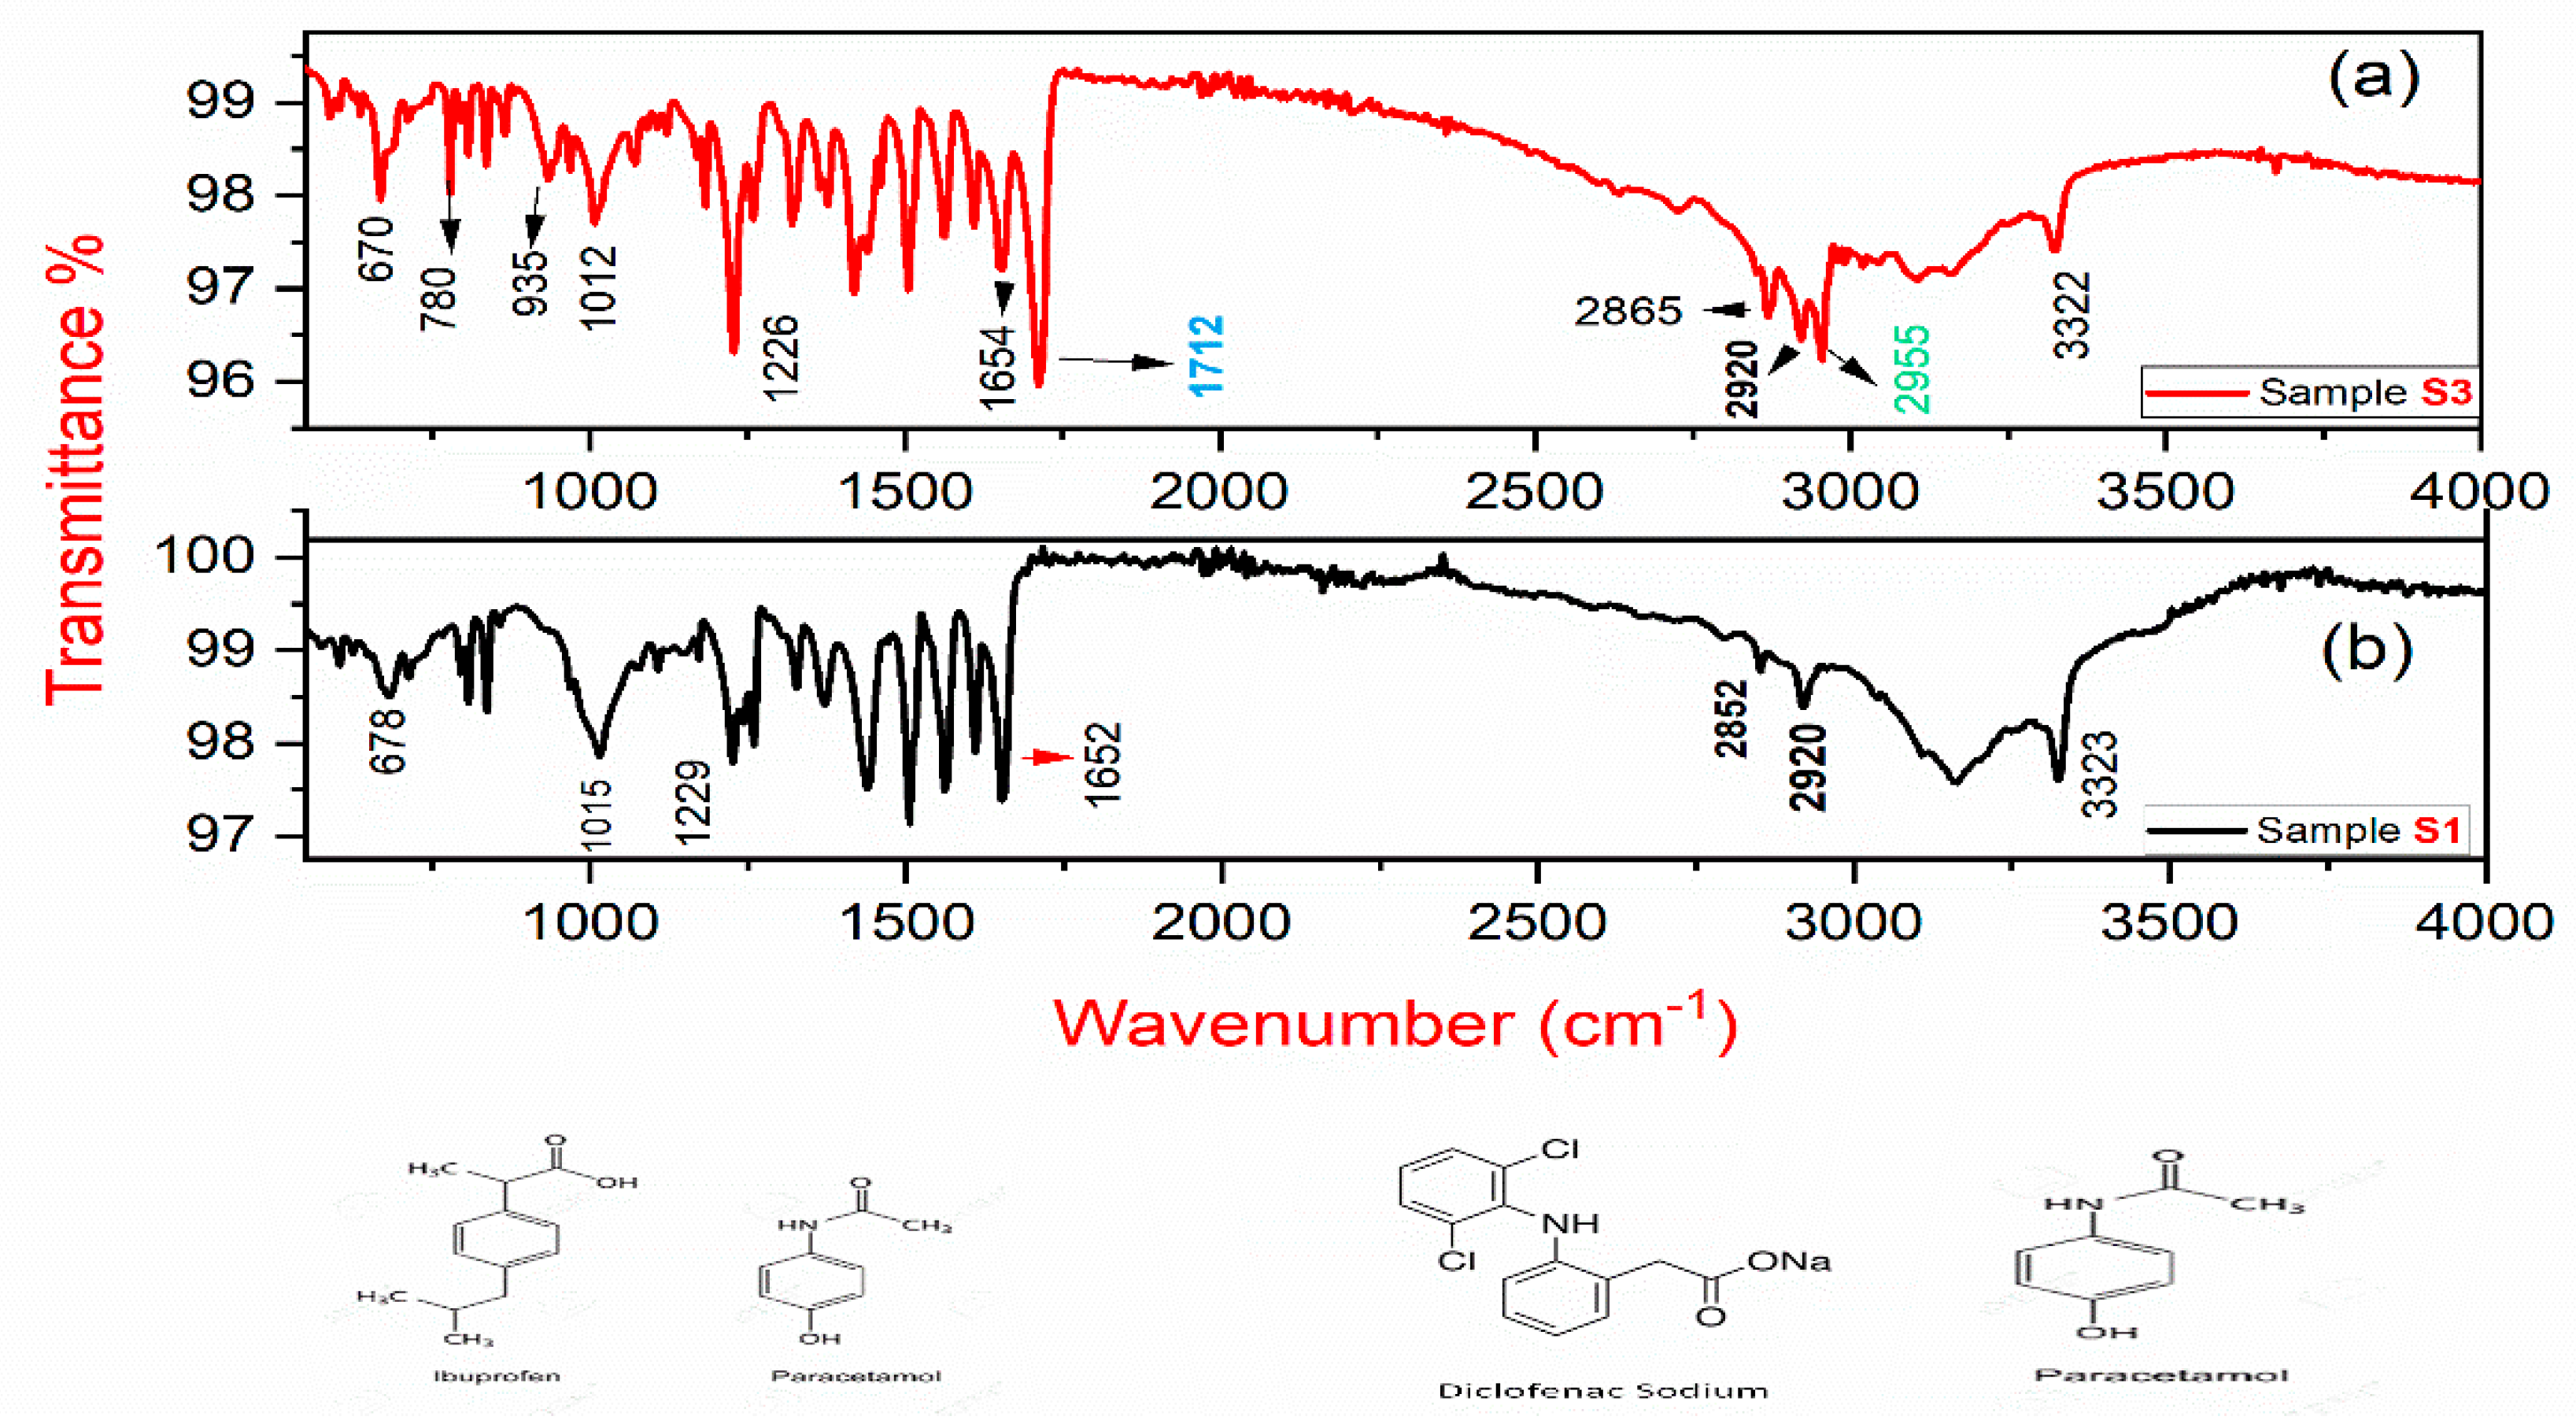
2.5. FT-IR Spectroscopic Analysis
3. Materials and Methods
4. Discussion and Conclusions
Author Contributions
Funding
Acknowledgments
Conflicts of Interest
References
- Prescott, F.L. Paracetamol: Past, present, and future. Am. J. Ther. 2000, 7, 143–147. [Google Scholar] [CrossRef] [PubMed]
- World Health Organization (WHO) Model List of Essential Medicines (EML). Available online: http://www.who.int/medicines/publications/essentialmedicines/en/ (accessed on 20 March 2017).
- Monts, D.L.; Singh, J.P.; Boudreaux, G.M. Laser-Optical-Based Techniques for the Detection of Explosives. In Encyclopedia of Analytical Chemistry: Instrumentation and Applications; John Wiley & Sons: Chichester, UK, 2000; pp. 2148–2171. [Google Scholar] [CrossRef]
- Nancy, L. The use of atomic spectroscopy in the pharmaceutical industry for the determination of trace elements in pharmaceuticals. J. Pharm. Biomed. Anal. 2011, 55, 653–661. [Google Scholar] [CrossRef]
- St-Onge, L.; wong, E.K.; Sabsabi, M.; Vadas, E.B. Quantitative analysis of pharmaceutical products by laser-induced breakdown spectroscopy. Spectrochim. Acta Part B 2002, 57, 1131–1140. [Google Scholar] [CrossRef]
- Alcalà, M.; Blanco, M.; Moyan, D.; Broad, N.W.; O’Brien, N.; Friedrich, D.; Pfeifer, F.; Siesler, H.W. Qualitative and quantitative pharmaceutical analysis with a novel hand-held miniature near-infrared spectrometer. J. Near Infrared Spectrosc. 2013, 21, 445–457. [Google Scholar] [CrossRef]
- Cremers, D.A.; Radziemski, J.L. Handbook of Laser-Induced Breakdown Spectroscopy; John Willey & Sons Ltd.: Chichester, UK, 2006; ISBN 978-0-470-09300-9. [Google Scholar]
- Bruder, R.; Coupry, V.D.C. An example of the complementarity of laser-induced breakdown spectroscopy and Raman microscopy for wall painting pigments analysis. J. Raman Spectrosc. 2007, 38, 909–915. [Google Scholar] [CrossRef]
- Miziolek, A.W.; Palleschi, V.; Schechter, I. Laser Induced Breakdown Spectroscopy: Fundamental and Application; Cambridge University Press: New York, NY, USA, 2006; ISBN 978-0-511-24529-9. [Google Scholar]
- Tiwari, P.K.; Awasthi, S.; Kumar, R.; Anand, R.K.; Rai, P.K.; Rai, A.K. Rapid analysis of pharmaceutical drugs using LIBS coupled with multivariate analysis. Lasers Med. Sci. 2018, 33, 263–270. [Google Scholar] [CrossRef]
- Mousavi1, S.J.; Farsani, M.H.; Darbani, S.M.R.; Mousaviazar, A.; Soltanolkotabi, M.; Majd, A.E. CN and C2 vibrational spectra analysis in molecular LIBS of organic materials. Appl. Phys. B 2016, 122, 106. [Google Scholar] [CrossRef]
- shakov, A.A.B.; Yoo, J.H.; Liu, C.; Plumer, J.R.; Russo, R.E. Laser-induced breakdown spectroscopy in industrial and security applications. Appl. Opt. 2010, 49, C132–C142. [Google Scholar] [CrossRef]
- St-Onge, L.; Sing, R.; Béchard, S.; Sabsabi, M. Carbon emissions following 1064 μm laser ablation of graphite and organic samples in ambient air. Appl. Phys. A 1999, 69, S913–S916. [Google Scholar] [CrossRef]
- Portnov, A.; Rosenwaks, S.; Bar, I. Emission following laser induced breakdown spectroscopy of organic compounds in ambient air. Appl. Opt. 2003, 42, 2835–2842. [Google Scholar] [CrossRef]
- Mousavi, S.J.; Farsani, M.H.; Darbani, S.M.R.; Asadorian, N.; Soltanolkotabi, M.; Majd, A.E. Identification of atomic lines and molecular bands of benzene and carbon disulfide liquids by using LIBS. Appl. Opt. 2015, 54, 1713–1720. [Google Scholar] [CrossRef]
- Dong, M.; Mao, X.; Gonzalez, J.J.; Lu, J.; Russo, R.E. Time resolved LIBS of atomic and molecular carbon from coal in air, argon, and helium. J. Anal. At. Spectrom. 2012, 27, 2066–2075. [Google Scholar] [CrossRef]
- Day, J.S.; Edwards, H.G.M.; Dobrowski, S.A.; Voice, A.M. The detection of drugs of abuse in fingerprints using Raman spectroscopy I: Latent fingerprints. Spectrochim. Acta Part A 2004, 60, 563–568. [Google Scholar] [CrossRef]
- Socrates, G. Infrared and Raman Characteristic Group Frequencies, Tables and Charts, 3rd ed.; John Wiley and Sons: Chichester, UK, 2001. [Google Scholar]
- Tsuyuki, K.; Miura, S.; Idris, N.; Kurniawan, K.H.; Lie, T.J.; Kagawa, K. Measurement of Concrete Strength Using the Emission Intensity Ratio Between Ca (II) 396.8 nm and Ca(I) 422.6 nm in a Nd:YAG Laser-Induced Plasma. Appl. Spectrosc. 2006, 60, 61–64. [Google Scholar] [CrossRef] [PubMed]
- Nur, S.; Madjid, A.; Lahna, K.; Desiyana, L.S. The Use of Laser-Induced Shock Wave Plasma Spectroscopy (LISPS) For Examining Physical Characteristics of Pharmaceutical Products. AIP Conf. Proc. 2016, 1719, 030052. [Google Scholar] [CrossRef]
- Jetzer, W.E. Measurement of hardness and strength of tablets and their relation to compaction performance of powders. J. Pharm. Pharmcol. 1986, 38, 254–258. [Google Scholar] [CrossRef] [PubMed]
- Seitz, J.A.; Flessland, G.M. Evaluation of the physical properties of compressed tablets I. Tablet hardness and friability. J. Pharm. Sci. 1965, 54, 1353–1357. [Google Scholar] [CrossRef] [PubMed]
- Sansonetti, J.E.; Martin, W.C. Handbook of Basic Atomic Spectroscopic Data. J. Phys. Chem. Ref. Data 2005, 34, 1559–2259. [Google Scholar] [CrossRef] [Green Version]
- Rao, E.N.; Mathi, P.; Kalam, S.A.; Sreedhar, S.; Singh, A.K.; Jagatap, B.N.; Rao, S.V. Femtosecond and nanosecond LIBS studies of nitroimidazoles: Correlation between molecular structure and LIBS data. J. Anal. Spectrom. 2016, 31, 737–750. [Google Scholar] [CrossRef]
- Movasaghi, Z.; Rehman, S.; Rehman, D.I.U. Raman Spectroscopy of Biological Tissues. Appl. Spectrosc. Rev. 2007, 42, 493–541. [Google Scholar] [CrossRef]
- Pearse, R.W.B.; Gaydon, A.G. The Identification of Molecular Spectra; Chapman and Hall: London, UK, 1976; ISBN1 041214350X. ISBN2 9780412143502. [Google Scholar]
- Pořízka, P.; Klus, J.; Képeš, E.; Prochazka; David, H.; David, W.; Kaiser, J. On the utilization of principal component analysis in laser-induced breakdown spectroscopy data analysis: A review. Spectrochim. Acta Part B 2018, 148, 65–82. [Google Scholar] [CrossRef]
- Willard, H.H.; Merritt, L.; Dean, J.A. Instrumental Methods of Analysis, International Student Edition; Wadsworth Publishing Company: Belmont, CA, USA, 1988; ISBN 0534081428. [Google Scholar]
- Chaplin, M. Infrared Spectroscopy. Available online: http://www.ifsc.usp.br/~lavfis2/BancoApostilasImagens/ApLuminescencia/Infrared%20Spectroscop1.pdf (accessed on 15 May 2013).
- Parigger, C.G.; Woods, A.C.; Surmick, D.M.; Gautan, G.; Witte, M.J.; Hornkohl, J.O. Computation of diatomic molecular spectra for selected transitions of Aluminum monoxide, cyanide, diatomic carbon, and titanium monoxide. Spectrochim. Acta Part B 2015, 107, 132–138. [Google Scholar] [CrossRef]


| Sample | Compound in Sample (Manufacturer) | % of C | % of N |
|---|---|---|---|
| S1 | Ibuprofen C13H18O2 (400 mg) and Paracetamol C8H9NO2 (325 mg) | 50.9 | 30.1 |
| S2 | Aceclofenac C16H13Cl2NO4 (100 mg) Paracetamol C8H9NO2 (500 mg) | 37.2 | 50.2 |
| S3 | Diclofenac Sodium C14H11Cl2NNaO2 (50 mg) Paracetamol C8H9NO2 (325 mg) | 23.2 | 32.3 |
| S4 | Paracetamol C8H9NO2 (500 mg) | 31.7 | 46.3 |
| S5 | Paracetamol C8H9NO2 (500 mg) | 31.7 | 46.3 |
| S6 | Ibuprofen C13H18O2 (400 mg) | 30.2 | 0 |
| Sample S1 Raman Shift (cm−1) | Sample S3 Raman Shift (cm−1) | Result |
|---|---|---|
| 749 | ------ | C-N stretch |
| 802 | 801 | C-H Bend, para |
| 1116 | ------ | Aromatic ring breathing |
| 1213 | 1211 | C-O Stretch |
| 1236 | 1230 | C-O Stretch |
| 1367 | 1365 | CH3 bend |
| 1441 | ------ | O-H bend |
| 1580 | 1583 | N-H Bend |
| 1612 | 1611 | C=O stretch |
| 1648 | 1645 | C=O stretch+ N-H deformation |
| 2927 | 2920 | Saturated C-H |
| 3050 | 3055 | Aromatic C-H |
© 2019 by the authors. Licensee MDPI, Basel, Switzerland. This article is an open access article distributed under the terms and conditions of the Creative Commons Attribution (CC BY) license (http://creativecommons.org/licenses/by/4.0/).
Share and Cite
Tiwari, P.K.; Rai, N.K.; Kumar, R.; Parigger, C.G.; Rai, A.K. Atomic and Molecular Laser-Induced Breakdown Spectroscopy of Selected Pharmaceuticals. Atoms 2019, 7, 71. https://doi.org/10.3390/atoms7030071
Tiwari PK, Rai NK, Kumar R, Parigger CG, Rai AK. Atomic and Molecular Laser-Induced Breakdown Spectroscopy of Selected Pharmaceuticals. Atoms. 2019; 7(3):71. https://doi.org/10.3390/atoms7030071
Chicago/Turabian StyleTiwari, Pravin Kumar, Nilesh Kumar Rai, Rohit Kumar, Christian G. Parigger, and Awadhesh Kumar Rai. 2019. "Atomic and Molecular Laser-Induced Breakdown Spectroscopy of Selected Pharmaceuticals" Atoms 7, no. 3: 71. https://doi.org/10.3390/atoms7030071
APA StyleTiwari, P. K., Rai, N. K., Kumar, R., Parigger, C. G., & Rai, A. K. (2019). Atomic and Molecular Laser-Induced Breakdown Spectroscopy of Selected Pharmaceuticals. Atoms, 7(3), 71. https://doi.org/10.3390/atoms7030071