1. Introduction
A plasma produced using electron cyclotron resonance (ECR) heating under a simple cusp field could have a relatively large degree of ionization (DOI) [
1,
2]. In a simple cusp field, the field strength increases in the outward direction and the resonance layer forms a closed surface. Electrons escaping from the center of the plasma pass through this surface and their magnetic moments and the magnetic mirror forces are increased by the heating. Electrons are, then, better confined inside the ECR surface, as well as ions, owing to the ambipolar electric field. A relatively large DOI, can thus be obtained with a relatively simple magnetic field configuration.
The DOI is defined as
, where
and
are the total ion and neutral densities, respectively. This expression can be approximated, in the case of low-temperature helium plasmas, as
, where
and
are the electron and ground-state helium atom densities, respectively. The number of reports on the DOI attainable by ECR discharges is limited, mainly due to the difficulty in accurately evaluating the spatially-resolved neutral density. In this study, we simultaneously evaluate
and
, using the helium atom (HeI) emission-line intensities and by collisional-radiative (CR) model analysis. This is becoming a standard method, owing to the recent improvements in its measurement accuracy for various types of plasma (see Reference [
3] and the references therein). We previously measured a one-dimensional spatial distribution of the DOI [
3,
4] and found that the DOI increased by up to 30% inside the ECR surface. The purpose of the present study is to extend the measurement to two dimensions in order to confirm the spatial uniformity of the DOI.
2. Method
The excited helium atom densities were evaluated using their emission-line intensities and were then compared with those calculated using a CR model. The adopted model was developed by Goto [
5] and Fujimoto [
6], and we additionally included the optical escape factor (OEF), which represents the effective reduction of the spontaneous emission coefficient due to radiation trapping [
7,
8,
9]. In our plasma, the density in a state
p, which designates a term resolved into the orbital angular momentum (e.g., 2
1P, 2
3P, ⋯) is approximately calculated as
where
,
, and
are coefficients which are functions of
,
, and the OEF; and
,
, and
are the 1
1S (ground) and 2
1S and 2
3S (metastable) state densities, respectively. On the right-hand side of Equation (
1), the terms, from left to right, represent the production of excited atoms from the ground state atoms, 2
1S metastable atoms and 2
3S metastable atoms, respectively. The production of ions through the three-body, radiative and di-electronic recombinations are included in the model but the contributions are negligible in the present plasma because of small electron densities (
< 10
18 m
−3). The small
also violates the quasi steady-state approximation [
10] for the metastable atoms.
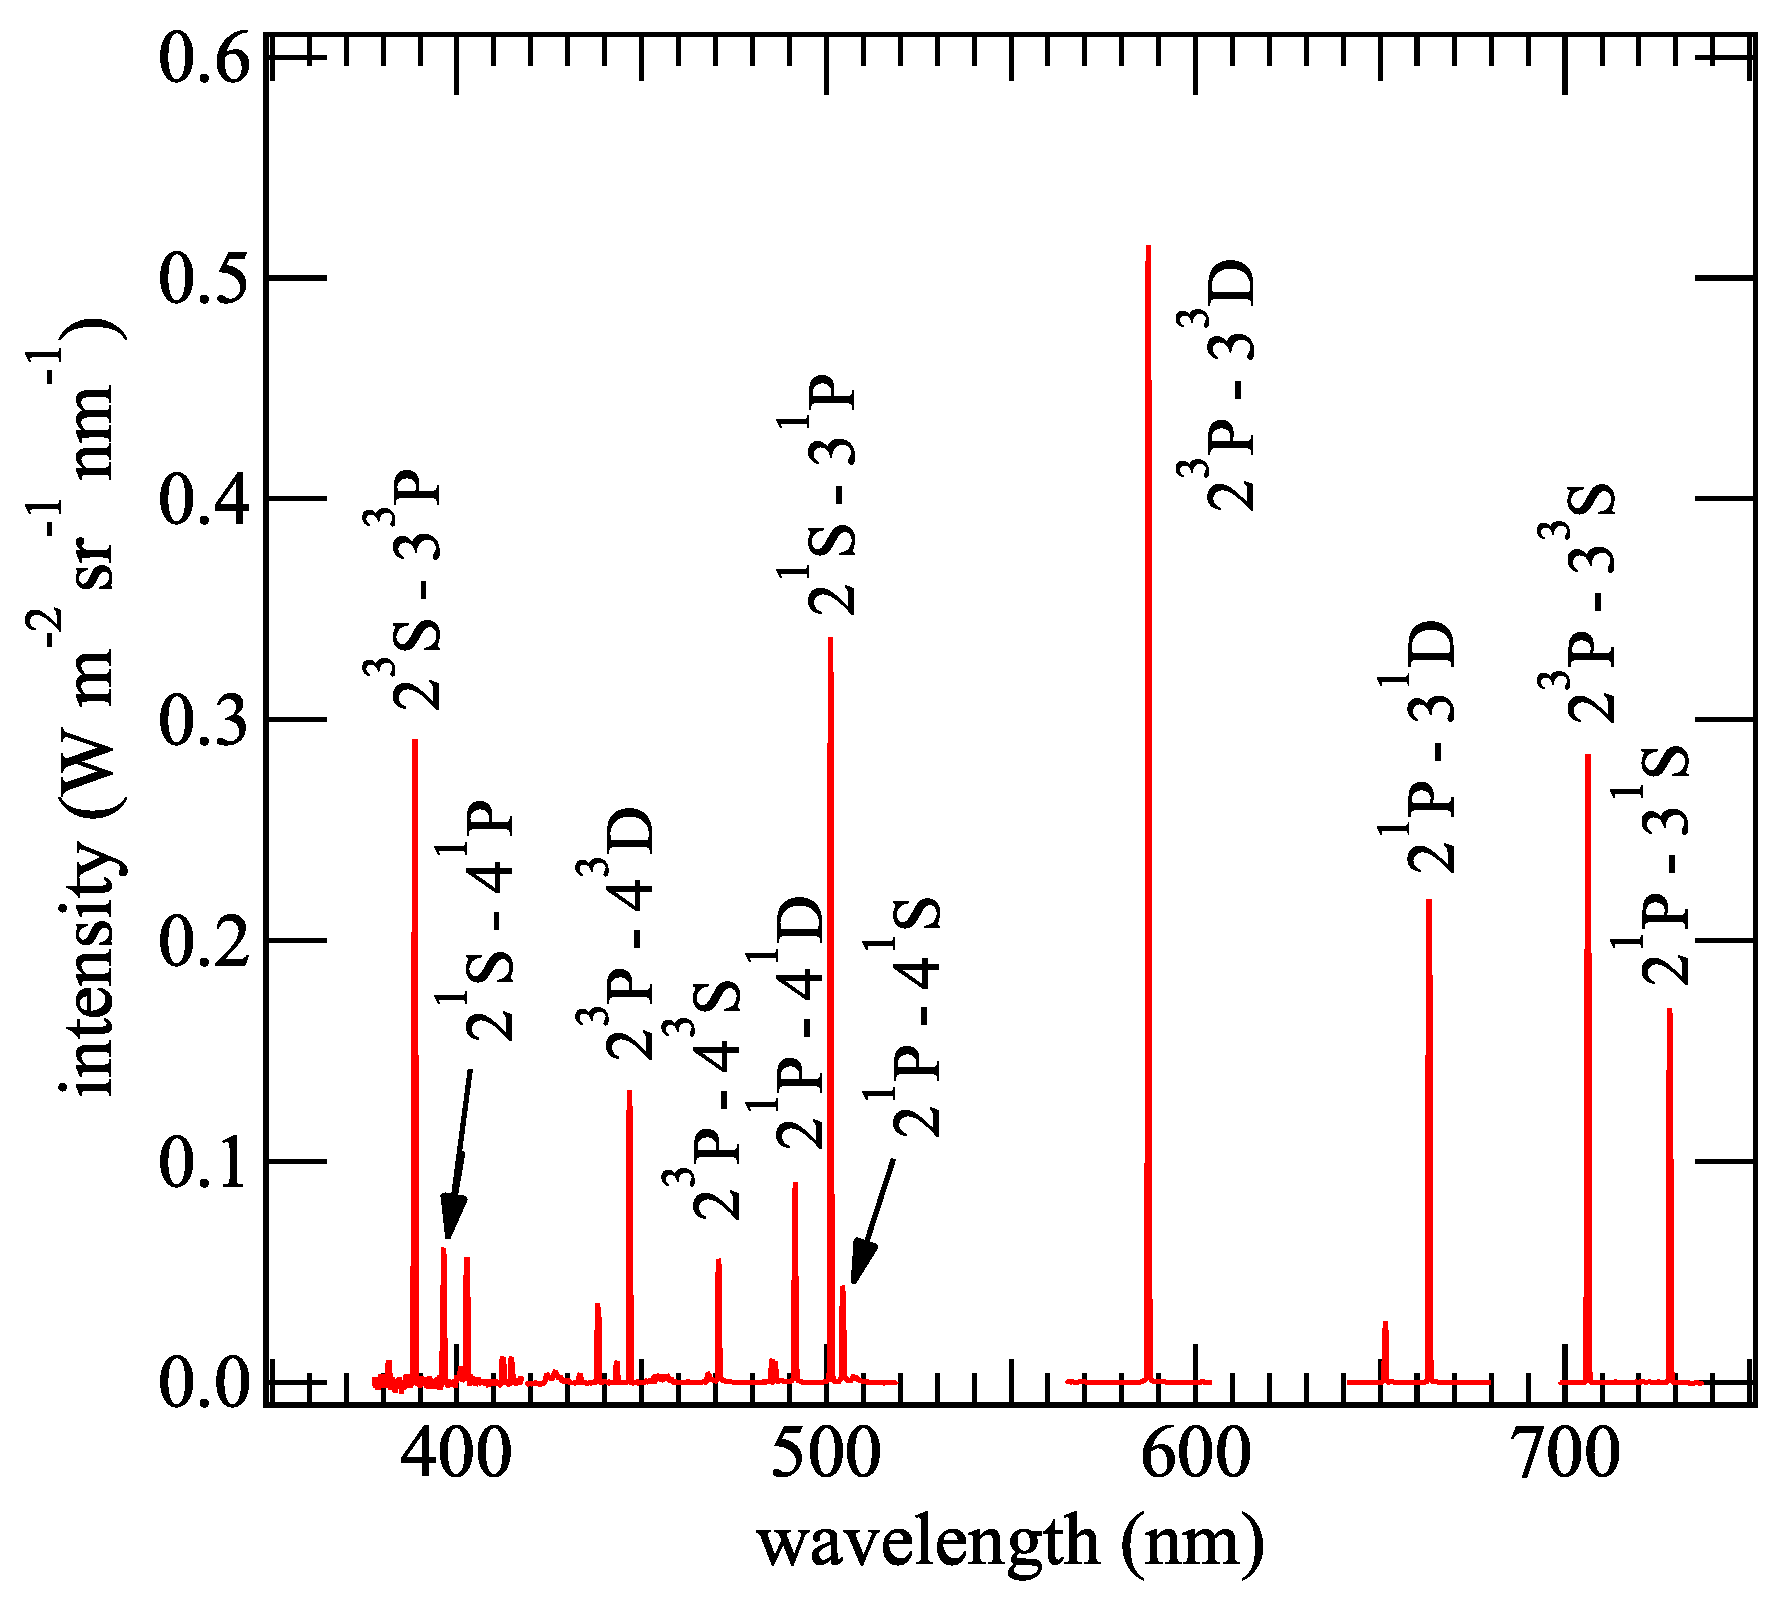
Emission spectra were measured in a wavelength range of 350–750 nm. An example is shown in
Figure 1. Eleven emission lines, belonging to
n = 2–3 and 2–4 transitions, were used for the analysis; where
n is the principal quantum number. As will be described in
Section 4, the measured chord-integrated intensities were converted to the radial distributions of the emissivity and the population densities in the
n = 3 and 4 states. For the present neutral pressure condition, the effect of the radiation trapping becomes significant for the resonant 1
1S–
P transitions associated with the ground state. We take into account the OEFs for the 1
1S–3
1P (
) and 1
1S–4
1P (
) transitions and determine these factors empirically, assuming that they are independent. The secondary effect—namely, the variation in the densities in the
n = 3 and 4 states, as a result of the increase in the
P state densities (
n = 2 and
n > 4) due to radiation trapping—was small. Consequently, seven unknown parameters,
,
,
,
,
,
, and
, were determined by fitting the calculated
to the measured ones. Although most studies aimed to measure
and
have used ratios of
[
5,
9,
11], we used the absolute values of
. This enabled us to evaluate
at the expense of requiring measurements of absolute emission line intensities.
3. Experiments
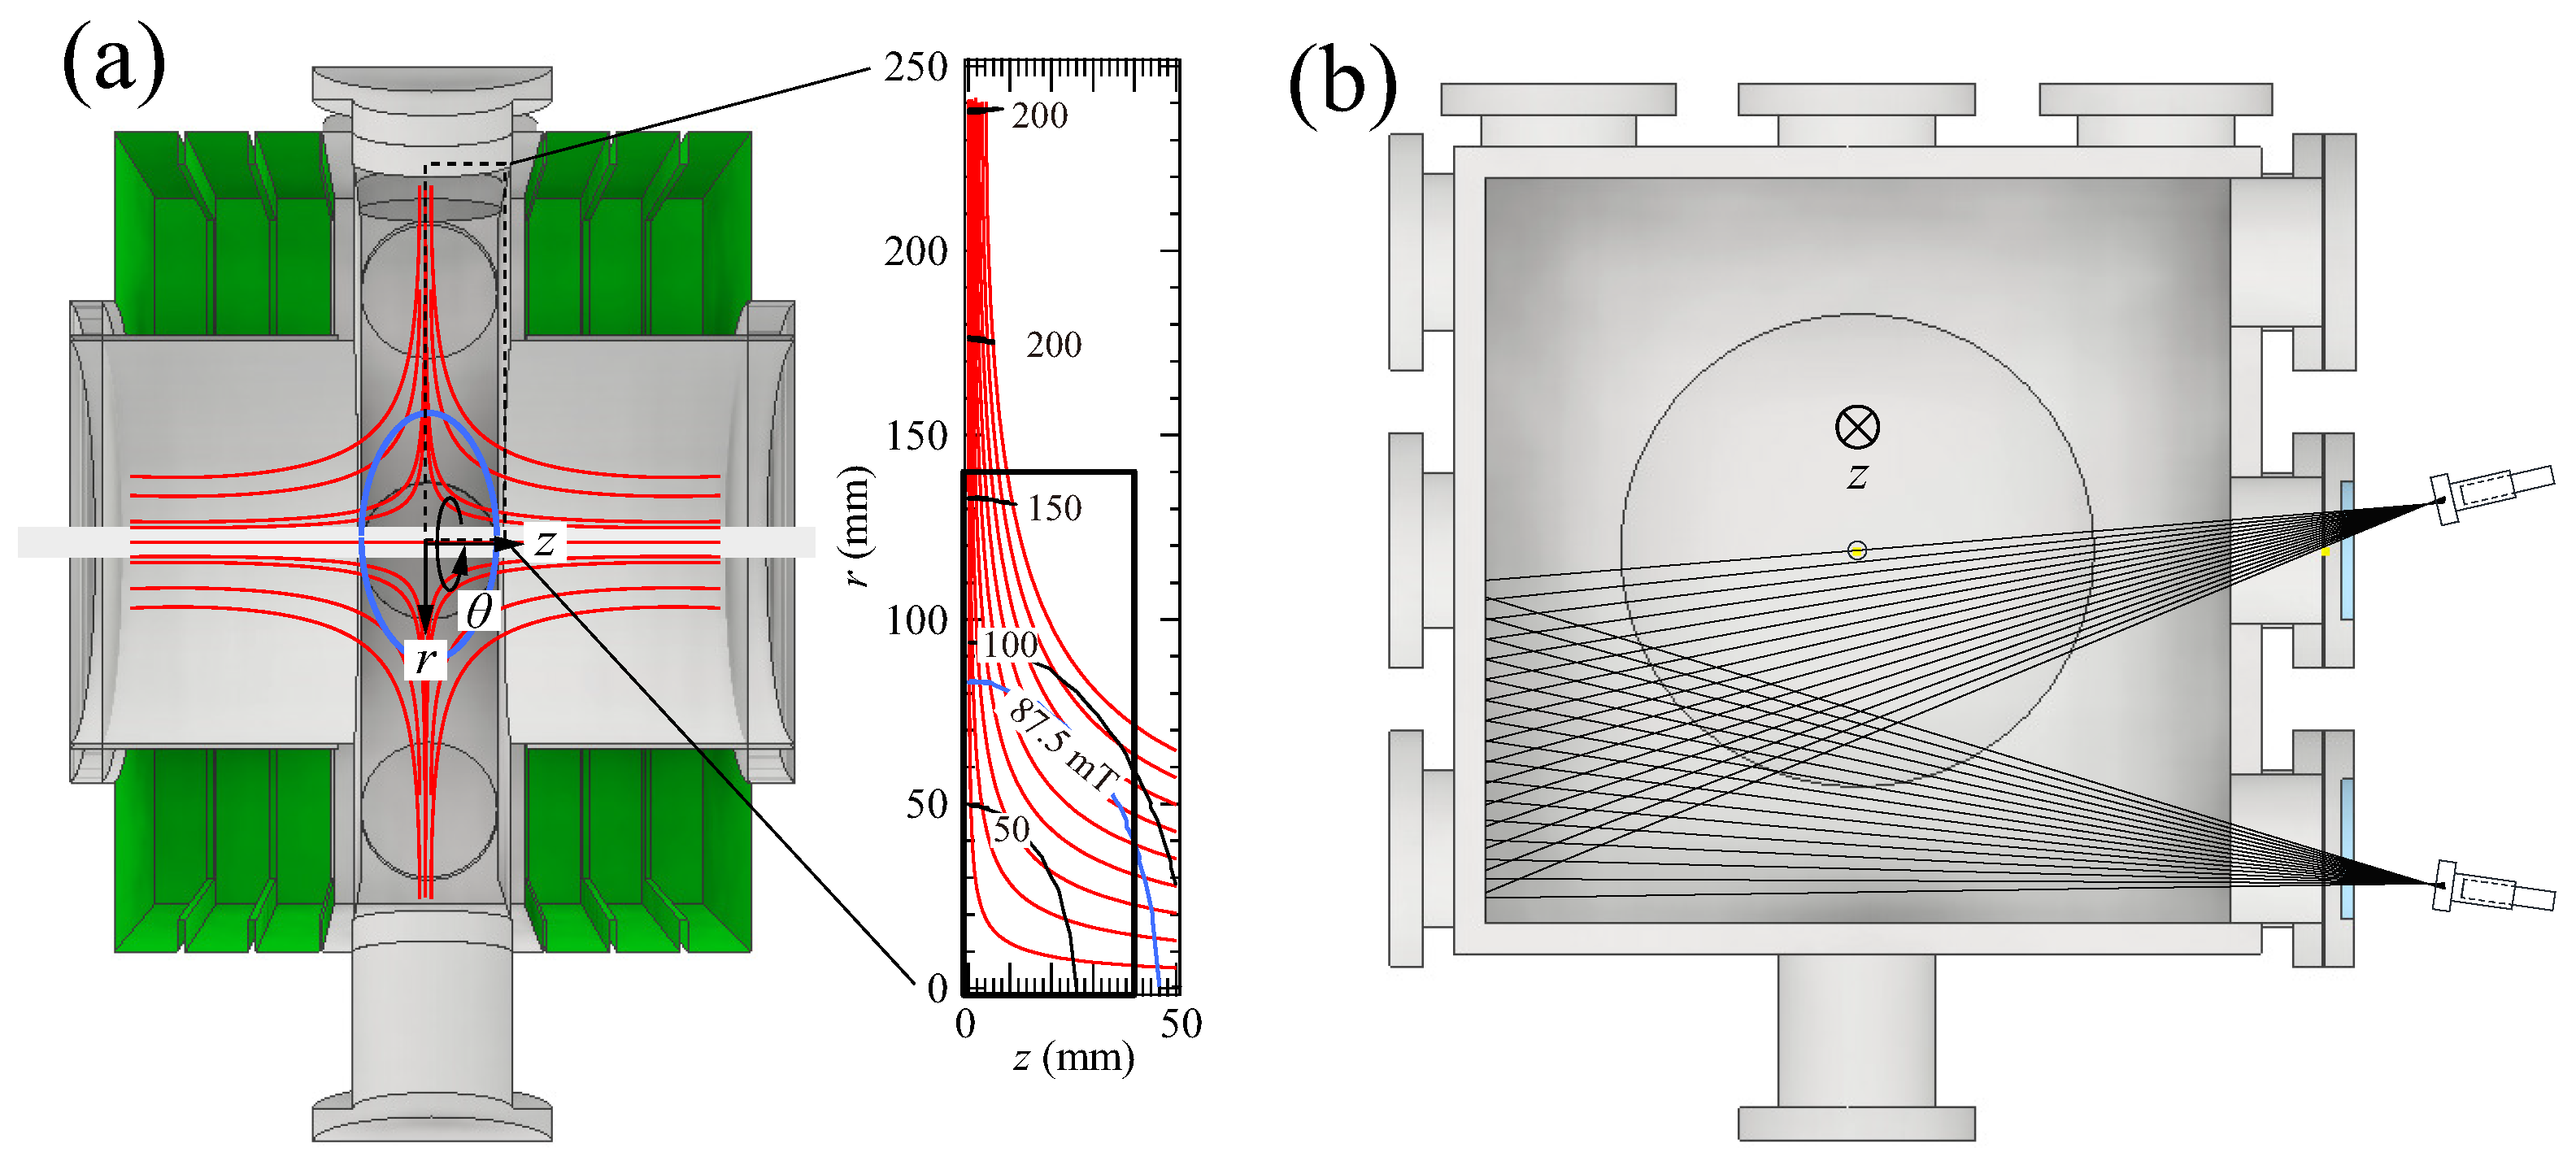
A pure helium plasma was produced using an ECR discharge device [
1,
2], as illustrated in
Figure 2. At the time of operation, helium gas was fed at a constant flow rate and the pressure at the vacuum chamber was set to 67 mPa. A steady-state plasma was produced for 2.5 s using 2.45 GHz and 0.8 kW microwaves under a simple cusp field. The shape of the ECR surface was a spheroid. A seven-turn internal conductor with a diameter of 12 mm was installed along the axis of the device to produce an additional azimuthal field but was not used for the present study. The surfaces of the internal conductor and the side walls of the vacuum chamber at the axial ends were kept at floating potentials to reduce the loss of plasma.
Plasma emission was collected using 32 viewing chords, which consisted of two pairs of achromatic lens (Edmund Optics; 12 mm focal length) and 16 bundled optical fibers (Mitsubishi Cable Industries ST230D; 230 and 250 μm core and cladding diameters, 0.2 NA). The chords were aligned on a
-plane, as illustrated in
Figure 2b and moved to
z = 10, 20, and 30 mm, on a shot-by-shot basis. The chords had a diameter of approximately 7 mm around the center of the device. The collected light was transmitted to a spectrometer (Nikon P250; 0.25 m focal length, 600 grooves/mm grating, F/4.5) and 32 spectra were recorded simultaneously using a CMOS detector (Hamamatsu Photonics Orca-Flash 4.0 V2.0; 2048 × 2048 pixels, 6.5 μm pixel size, 16 bit and 100 frames/s). Seven CMOS frames were recorded in a period, where the wavelength-integrated emission intensity was nearly constant and the variation of the spectrum was negligible. Then, the seven spectra were averaged and used for the analysis. The light intensities were absolutely calibrated using a standard tungsten-halogen lamp, taking into account the transmittance of the window. The wavelength resolution, defined as the instrumental width, was approximately 0.6 nm.
4. Results
Figure 1 shows a measured spectrum. It consists of seven fractional spectra measured at different wavelengths. For each of the eleven emission lines indicated in the figure, we applied the following procedures: Firstly, the chord-integrated intensity was evaluated from the area of the line spectrum. The evaluated intensities, with respect to the distances of the chords from the
z-axis, were then fitted using a sum of fifteen sigmoid functions. The fitted curve was converted to the radial distribution of the emissivity using Abel inversion. The error bar in the emissivity was evaluated, using a procedure described in Reference [
4]. The upper-state density,
and its error were calculated from the emissivity and its uncertainty, using the relation
=
, where
is the emissivity;
p and
q designate the upper and lower states, respectively;
h is Planck’s constant;
is the transition frequency; and
is the spontaneous emission coefficient.
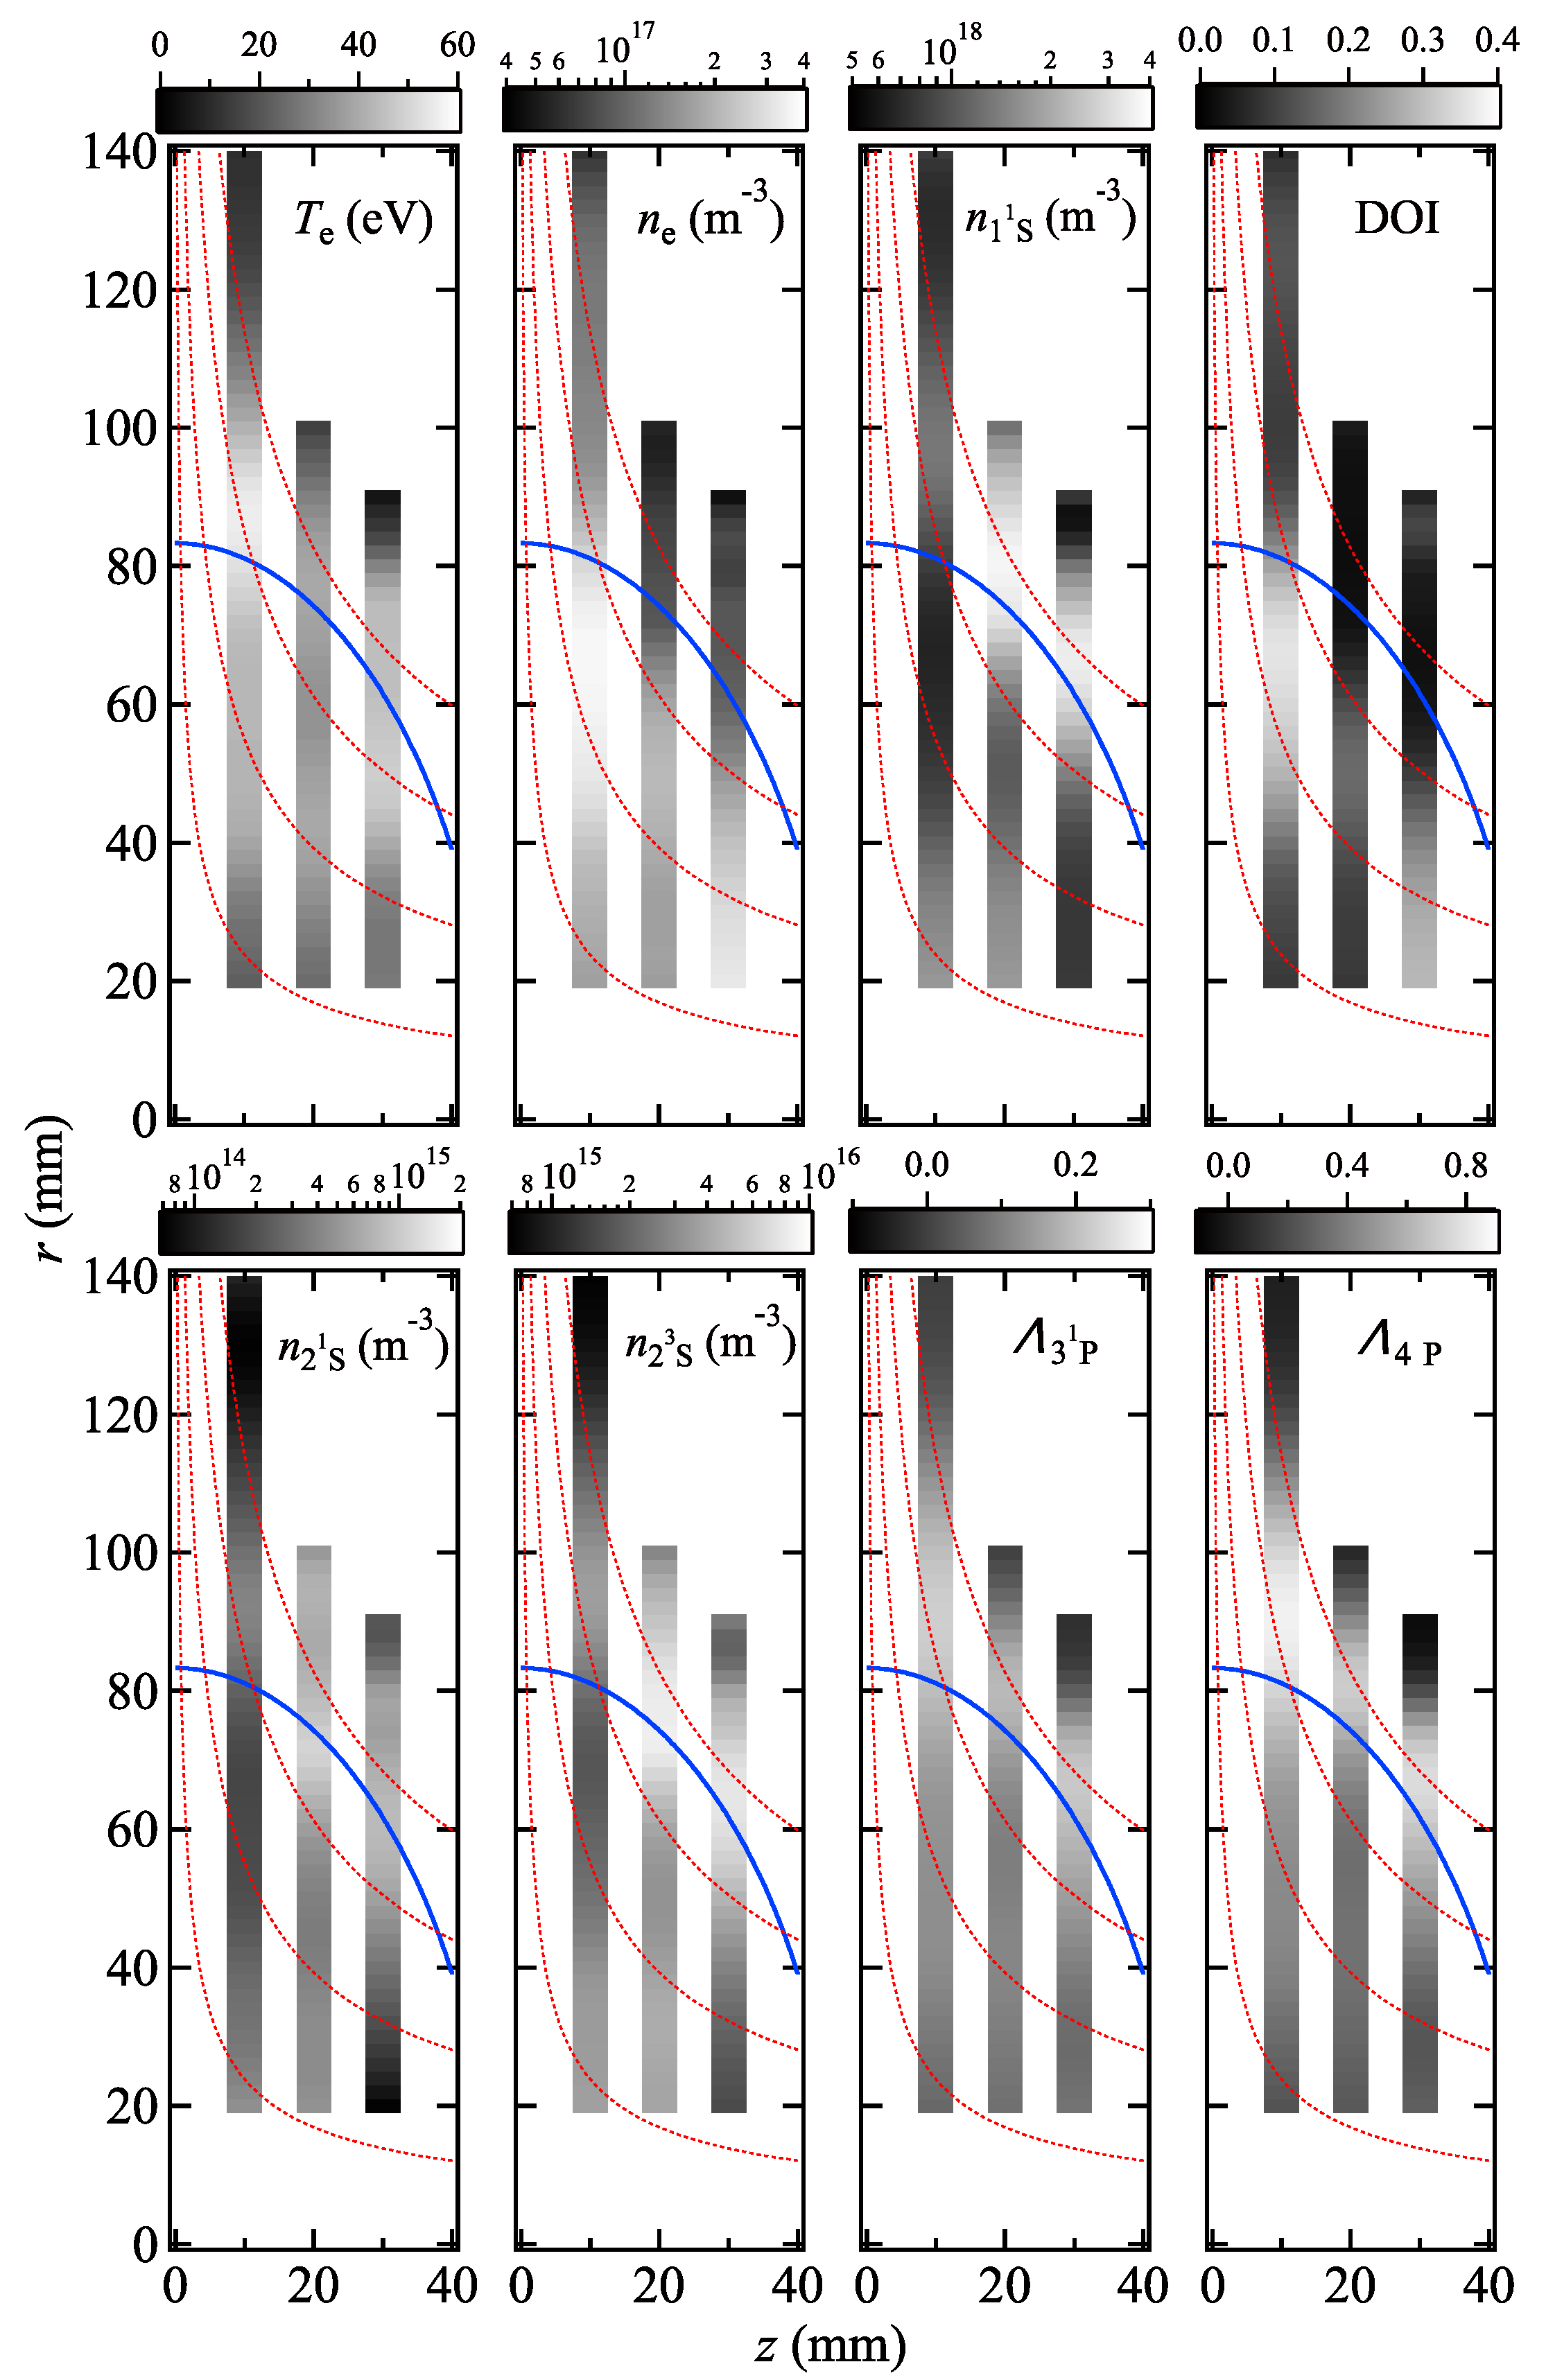
We calculated the densities in the
n = 3 and 4 states, using the CR model and least-squares fitted them to the measured values, where the input parameters were used as fitting variables and the residues were weighted with the inverse standard deviations of
. The
-distributions of the evaluated parameters are shown in
Figure 3, where the solid blue line represents the ECR surface and the red dotted lines represent the magnetic field lines. The radial ranges of the plots are limited to where the eleven emission lines were observable, as well as the viewing chords which were not intercepted by the internal conductor. The axial width of the plots corresponds to the 7 mm diameter of the viewing chords. The radial distributions of
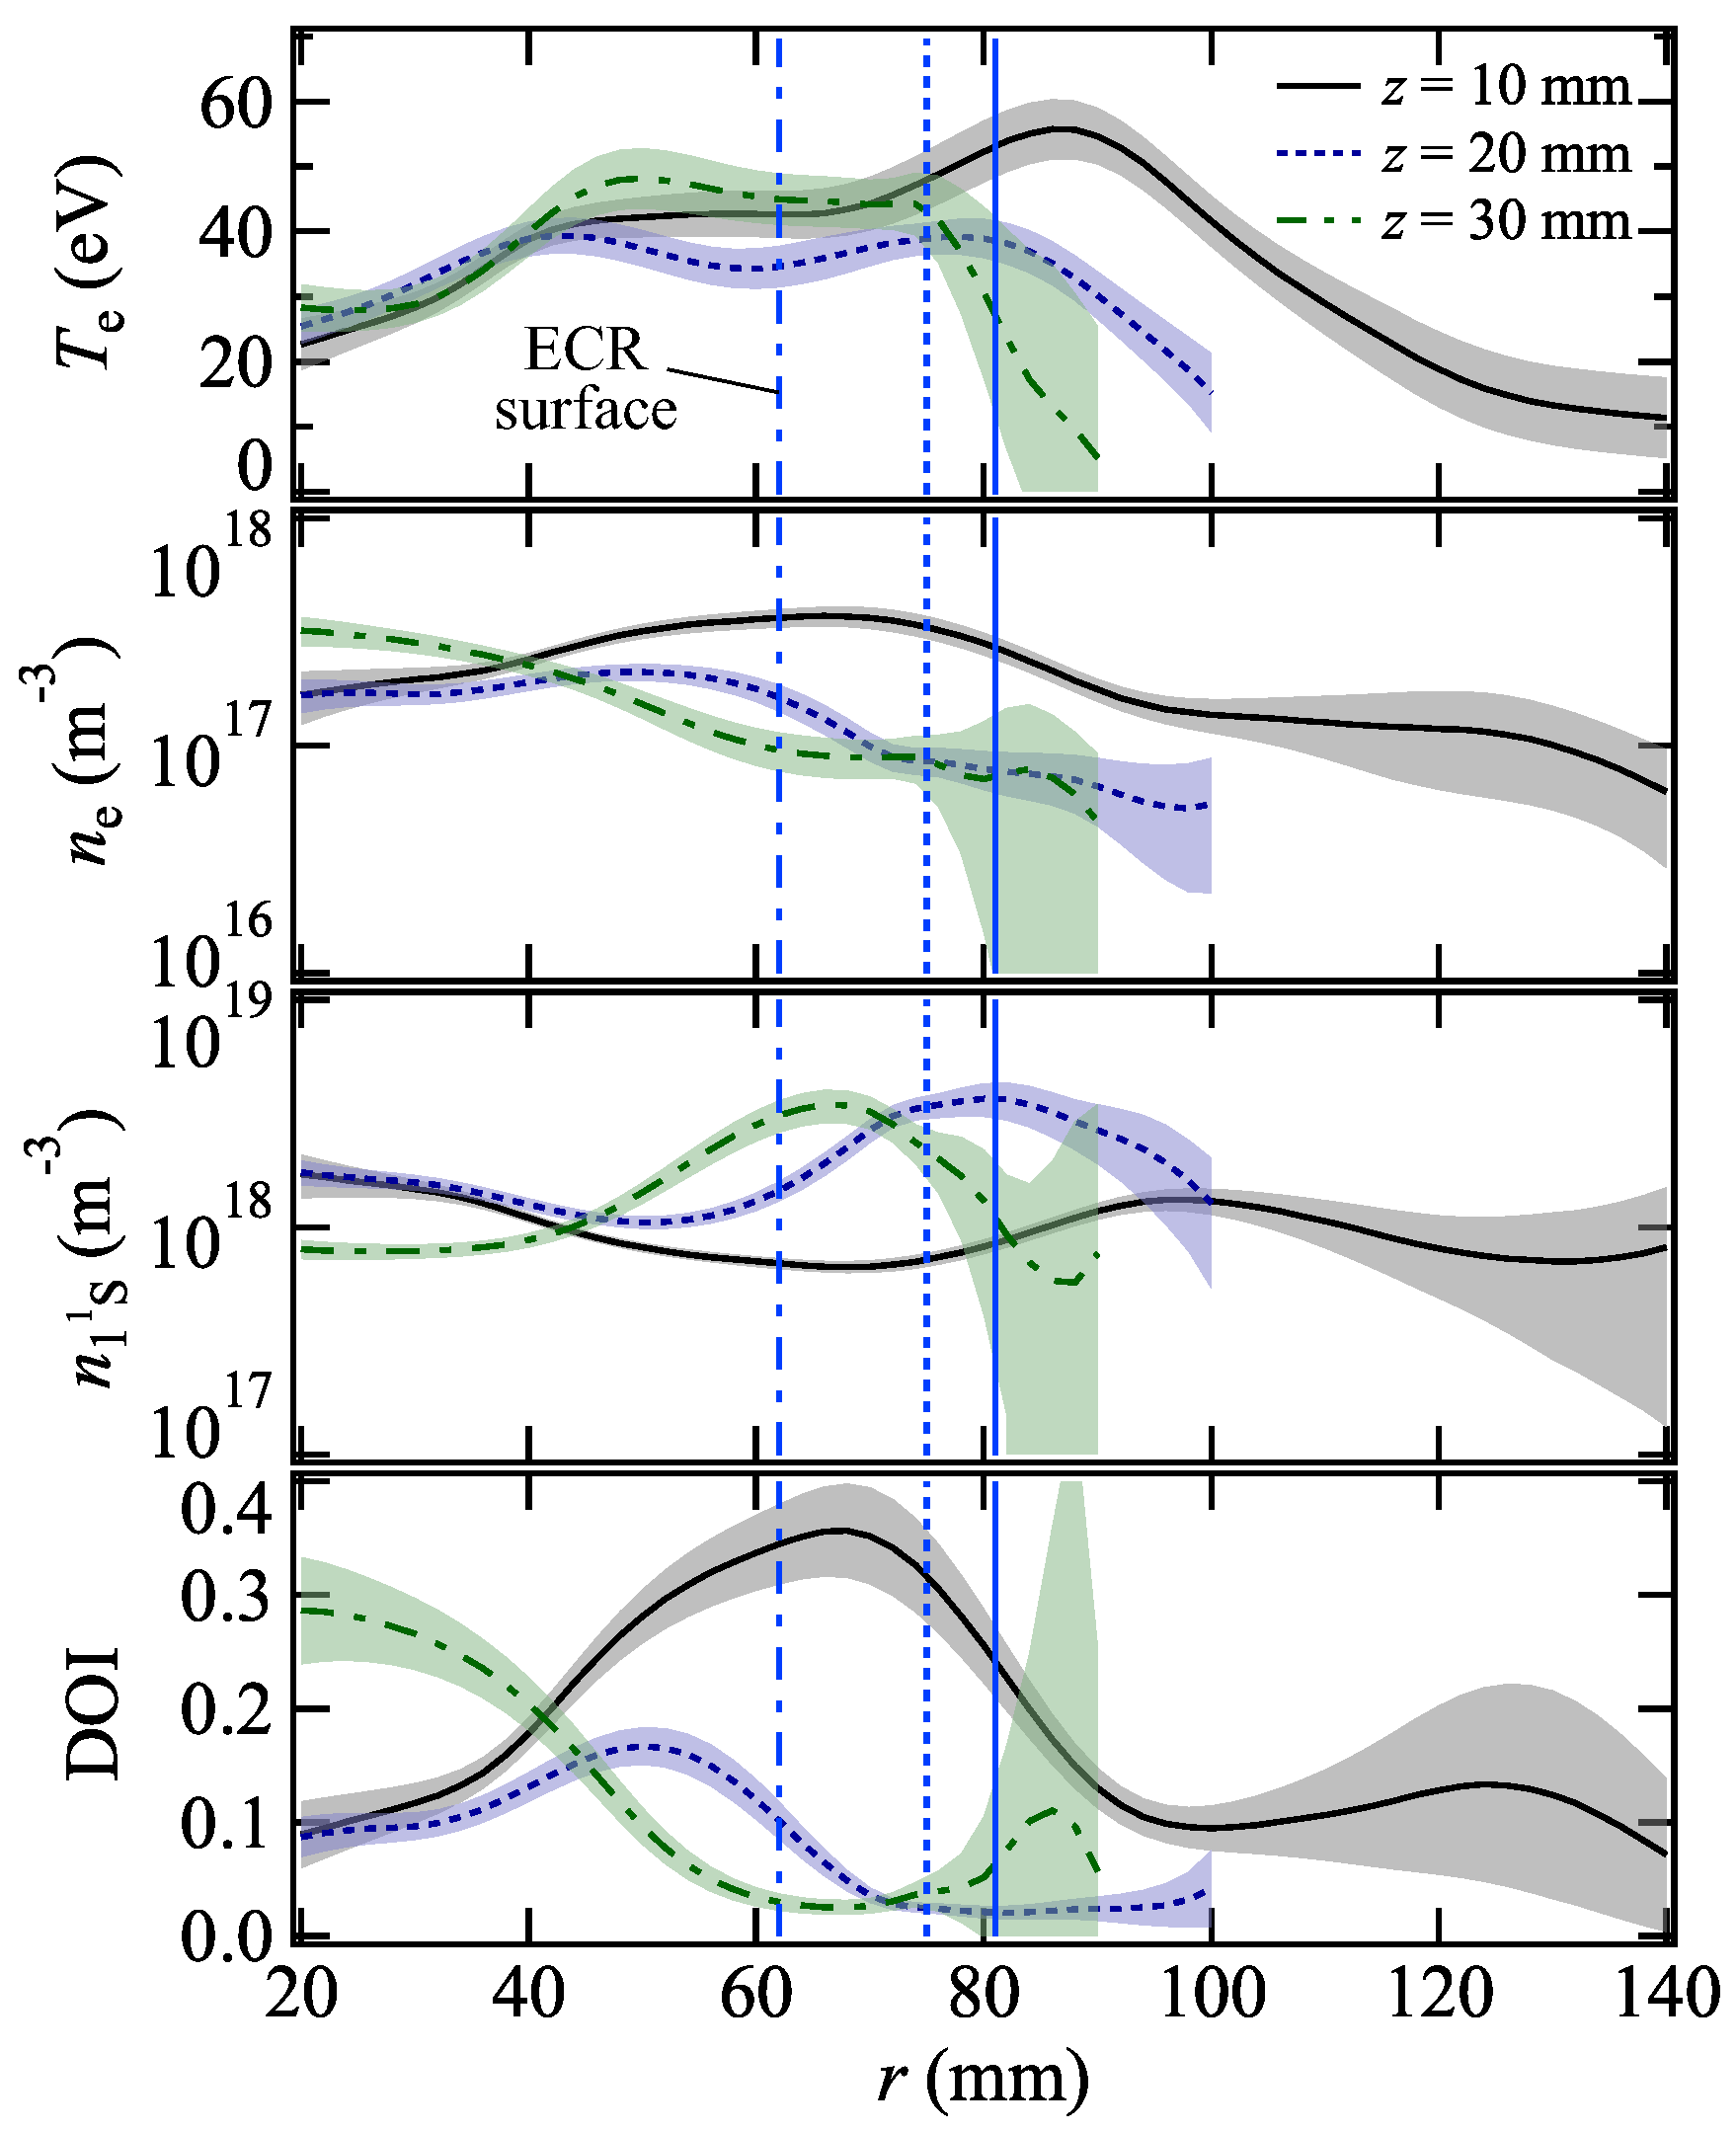
,
,
and the DOI, with their error bars, are shown in
Figure 4. The larger errors in the region outside the ECR surface originate from the uncertainty in the CR model fitting, presumably caused by systematic errors in the emissivities.
The evaluated
increases, up to 60 eV, near the ECR surface owing to the heating and
reaches more than 10
17 m
−3 inside the ECR surface. Even though the radial distributions of these parameters are independently measured at three different
z positions, the two-dimensional
-distributions have close values along the field lines and this tendency is physically consistent with the electron motion along the field lines. Decreased
and
in a region around
z = 10 mm and
r = 20 mm are due to perturbation by the internal conductor. A decrease in
was also detected by a two-dimensional thermal lithium beam measurement [
12]. These reductions could be mitigated by driving a current through the conductor and superposing an azimuthal magnetic field around it [
2]. The metastable atom densities reached their maximums near the ECR surface and decreased in the other regions. This can be explained by increased productions as a result of the increased value of
. The OEFs are peaked slightly outside the ECR surface. In order to confirm their validity, a three-dimensional radiation transport calculation is required; this is a task for future studies. Confirmation of the obtained parameters is not a trivial task and requires elaboration beyond the scope of this study. An advantage of the present method is the empirical determination of these parameters, owing to the reliability of the CR model calculation. The relevance of the parameters, from the viewpoint of the order of magnitude, was discussed in Reference [
3,
4].
The depletion of
inside the ECR surface is attributable to ionization and charge exchange reactions, as well as to an increase in the atomic temperature [
13];
at the vacuum chamber wall, evaluated from the pressure at the room temperature, was 1.6 × 10
19 m
−3 and decreased down to less than 10% inside the ECR surface. The reduction of
in the radial edge region was un-physical and contributed to the larger errors. As a result of the increased
and decreased
inside the ECR surface, the DOI increased up to 35%. Except for the region perturbed by the internal conductor, the DOI was above 10% throughout the interior of the ECR surface.


