Article

Cavity-Enhanced Photodetachment of H as a Means to Produce Energetic Neutral Beams for Plasma Heating

by
Christophe Blondel
1,*,†,
David Bresteau
2,†,‡ and
Cyril Drag
1,†
1
Laboratoire de Physique des Plasmas, École Polytechnique, Centre National de la Recherche Scientifique, Université Paris-Sud, Sorbonne Université, Route de Saclay, F-91128 Palaiseau CEDEX, France
2
Laboratoire Aimé-Cotton, Centre National de la Recherche Scientifique, Université Paris-Sud, Université Paris-Saclay, Bâtiment 505, F-91405 Orsay CEDEX, France
*
Author to whom correspondence should be addressed.
These authors contributed equally to this work.
Current address: LIDyL, Commissariat à l'Énergie atomique et aux Énergies Alternatives, Centre de Saclay, F-91191 Gif-sur-Yvette CEDEX, France.
Atoms 2019, 7(1), 32; https://doi.org/10.3390/atoms7010032
Submission received: 8 February 2019 / Revised: 22 February 2019 / Accepted: 23 February 2019 / Published: 1 March 2019
(This article belongs to the Special Issue SPIG2018)

Abstract

:
Neutral beam injection, for plasma heating, will supposedly be achieved, in ITER, by collisional detachment of a pre-accelerated D beam. Collisional detachment, however, makes use of a D 2 -filled neutralisation chamber, which has severe drawbacks, including the necessity to set the D -ion source at −1 MV. Photodetachment, in contradistinction, would have several advantages as a neutralisation method, including the absence of gas injection, and the possibility to set the ion source close to the earth potential. Photodetachment, however, requires a very high laser flux. The presented work has consisted in implementing an optical cavity, with a finesse greater than 3000, to make such a high illumination possible with a state-of-the-art CW (continuous-wave) laser. A 1.2 keV 1 H -beam (only 20 times slower than the 1 MeV 2 D ion beams to be prepared for ITER) was photodetached with more-than-50% efficiency, with only 24 W of CW laser input. This experimental demonstration paves the way for developing real-size photoneutralizers, based on the implementation of refolded optical cavities around the ion beams of neutral beam injectors. Depending on whether the specifications of the laser power or the cavity finesse will be more difficult to achieve in real scale, different architectures can be considered, with greater or smaller numbers of optical refoldings or (inclusively) optical cavities in succession, on the beam to be neutralised.

1. Introduction

The history of fast D 0 neutral beam generation for plasma heating has followed three technical ways in succession. Electron capture by accelerated D + ion was historically the first one. Collisional detachment of accelerated D ions was then developed to overcome the decrease of electron-capture probability at higher acceleration voltages. It is the procedure now implemented on ITER, but with a limited efficiency that will probably not be sustainable for industrial developments.
Photodetachment of accelerated D ions has been considered since the 1980s as a very promising technique [1]. Its energy cost, namely the circa 1 eV energy of every absorbed photon, is very low when compared to the 1 MeV kinetic energy of every produced neutral atom. Photons are insensitive to electric fields, and the photodetachment zone does not need any gas input, which makes it possible to set it at a high (positive) voltage and keep the D ion source close to the earth potential, with innumerable advantages as concerns electrical engineering.
The photodetachment process can never (but asymptotically) be complete. One can, however, get as close to 100% efficiency as one wants: undetached ions are still present in the beam and having them photodetached is only a matter of increasing the illumination. This stands in contrast with the collisional technique, where most of the D ions that have not been successfully channelled to making a D 0 beam have been either lost due to spurious collisions or further and irremediably stripped to D + ions.
Implementation of the photodetachment solution has been hindered, however, by the huge light flux required, e.g., to detach a 1 MeV ion beam, say with a 1 cm width: this would mean several MW of light power [2].
Having that power out of a laser source was something no laser promoter could even dream of in the 20th century. Meanwhile, it was imagined that such a power could be produced inside a laser resonator, and that the ion beam could be sent to cross the laser cavity directly [3]. Along these principles, a H beam could be produced inside the extended cavity of a YAG laser, with a neutralization efficiency of about 5 % [4].
Amplification in an external optical cavity makes optimization of the cavity finesse easier, at the expense of having the cavity length permanently tuned to a multiple of the laser wavelength [5]. Atomic or molecular physics experiments have used that way to enhance the photoelectron signal [6,7], but, again, with a detachment efficiency that was never greater than a few %. An essential difficulty, for better efficiencies, has been the availability of continuous-wave lasers both powerful and spectrally narrow enough to be used for cavity injection.
The situation changed recently, with the advent of doped fibre-based laser amplifiers, which makes spectrally narrow CW lasers with powers greater than 10 W commercially available. The present communication reports on a demonstration experiment that has shown efficient photodetachment of a H ion beam, at a reduced scale as concerns both the ion beam kinetic energy (1.2 keV instead of 1 MeV) and its diameter (a millimetre instead of several centimetres), but with a cavity finesse and intracavity light fluxes that are already of the same order of magnitude as what will be required, eventually, for full-scale implementation.

2. Experimental Set-Up

2.1. Ion Beam

The experimental set-up has already been described elsewhere [8]. The hydrogen ion beam is produced by a cesium sputtering ion source [9]. Neutral-atom time-of-flight measurements, following pulsed photodetachment by a frequency-tripled Nd:YAG laser, make it possible to check that the admixture of O ions, which may be present due to oxidization of the cathode but do not detach at a 1 μ m wavelength, will not lead to an underestimation of the photodetachment efficiency. H ions travel along the ion-beam machine with a 1 . 2 keV kinetic energy, i.e., a velocity of about 4 . 8 × 10 5 m s 1 . The residual pressure in the chamber where the ions are brought to cross the laser beam, is a few 10 5 Pa .
H anions are illuminated by the laser beam, inside an intra-vacuum optical cavity (Figure 1), and some of them are photodetached. The photon momentum, about 6 . 2 × 10 28 kg m/s at the wavelength λ = 1064 nm, is several orders of magnitude smaller than the ion momentum, about 8.0 × 10 22 kg m/s, which makes the deviation due to photon absorption negligible. The residual ion beam is de-merged from the produced H 0 neutral beam by a transverse electric field, a few cm downstream of the interaction region. A Beam Imaging Solutions® BOS-25 “Beam observation system” (Logmont, CO, USA) can be used to bring both the ion and neutral beams to observation. A Faraday cup can also be used to monitor the residual ion current and measure the photodetachment efficiency. The undetached ion beam current was typically 1 nA .

2.2. Laser System

The Azur Light Systems (ALS) laser [10] consists of a single-mode ytterbium doped NKT Photonics Koheras Y10 fibre laser (Talence, France), followed by an ALS-IR-10-USF amplifier (Talence, France). Its maximum output is 25 W and its spectral bandwidth about 10 kHz , with a ± 2 GHz tunability achieved via an internal piezoelectric actuator of the NKT oscillator. An electro-optic phase-modulator is set between the oscillator and the amplifier, and used for error-signal generation, when the laser light is sent into the cavity and partially reflected, using the Pound–Drever–Hall (PDH) method [11].

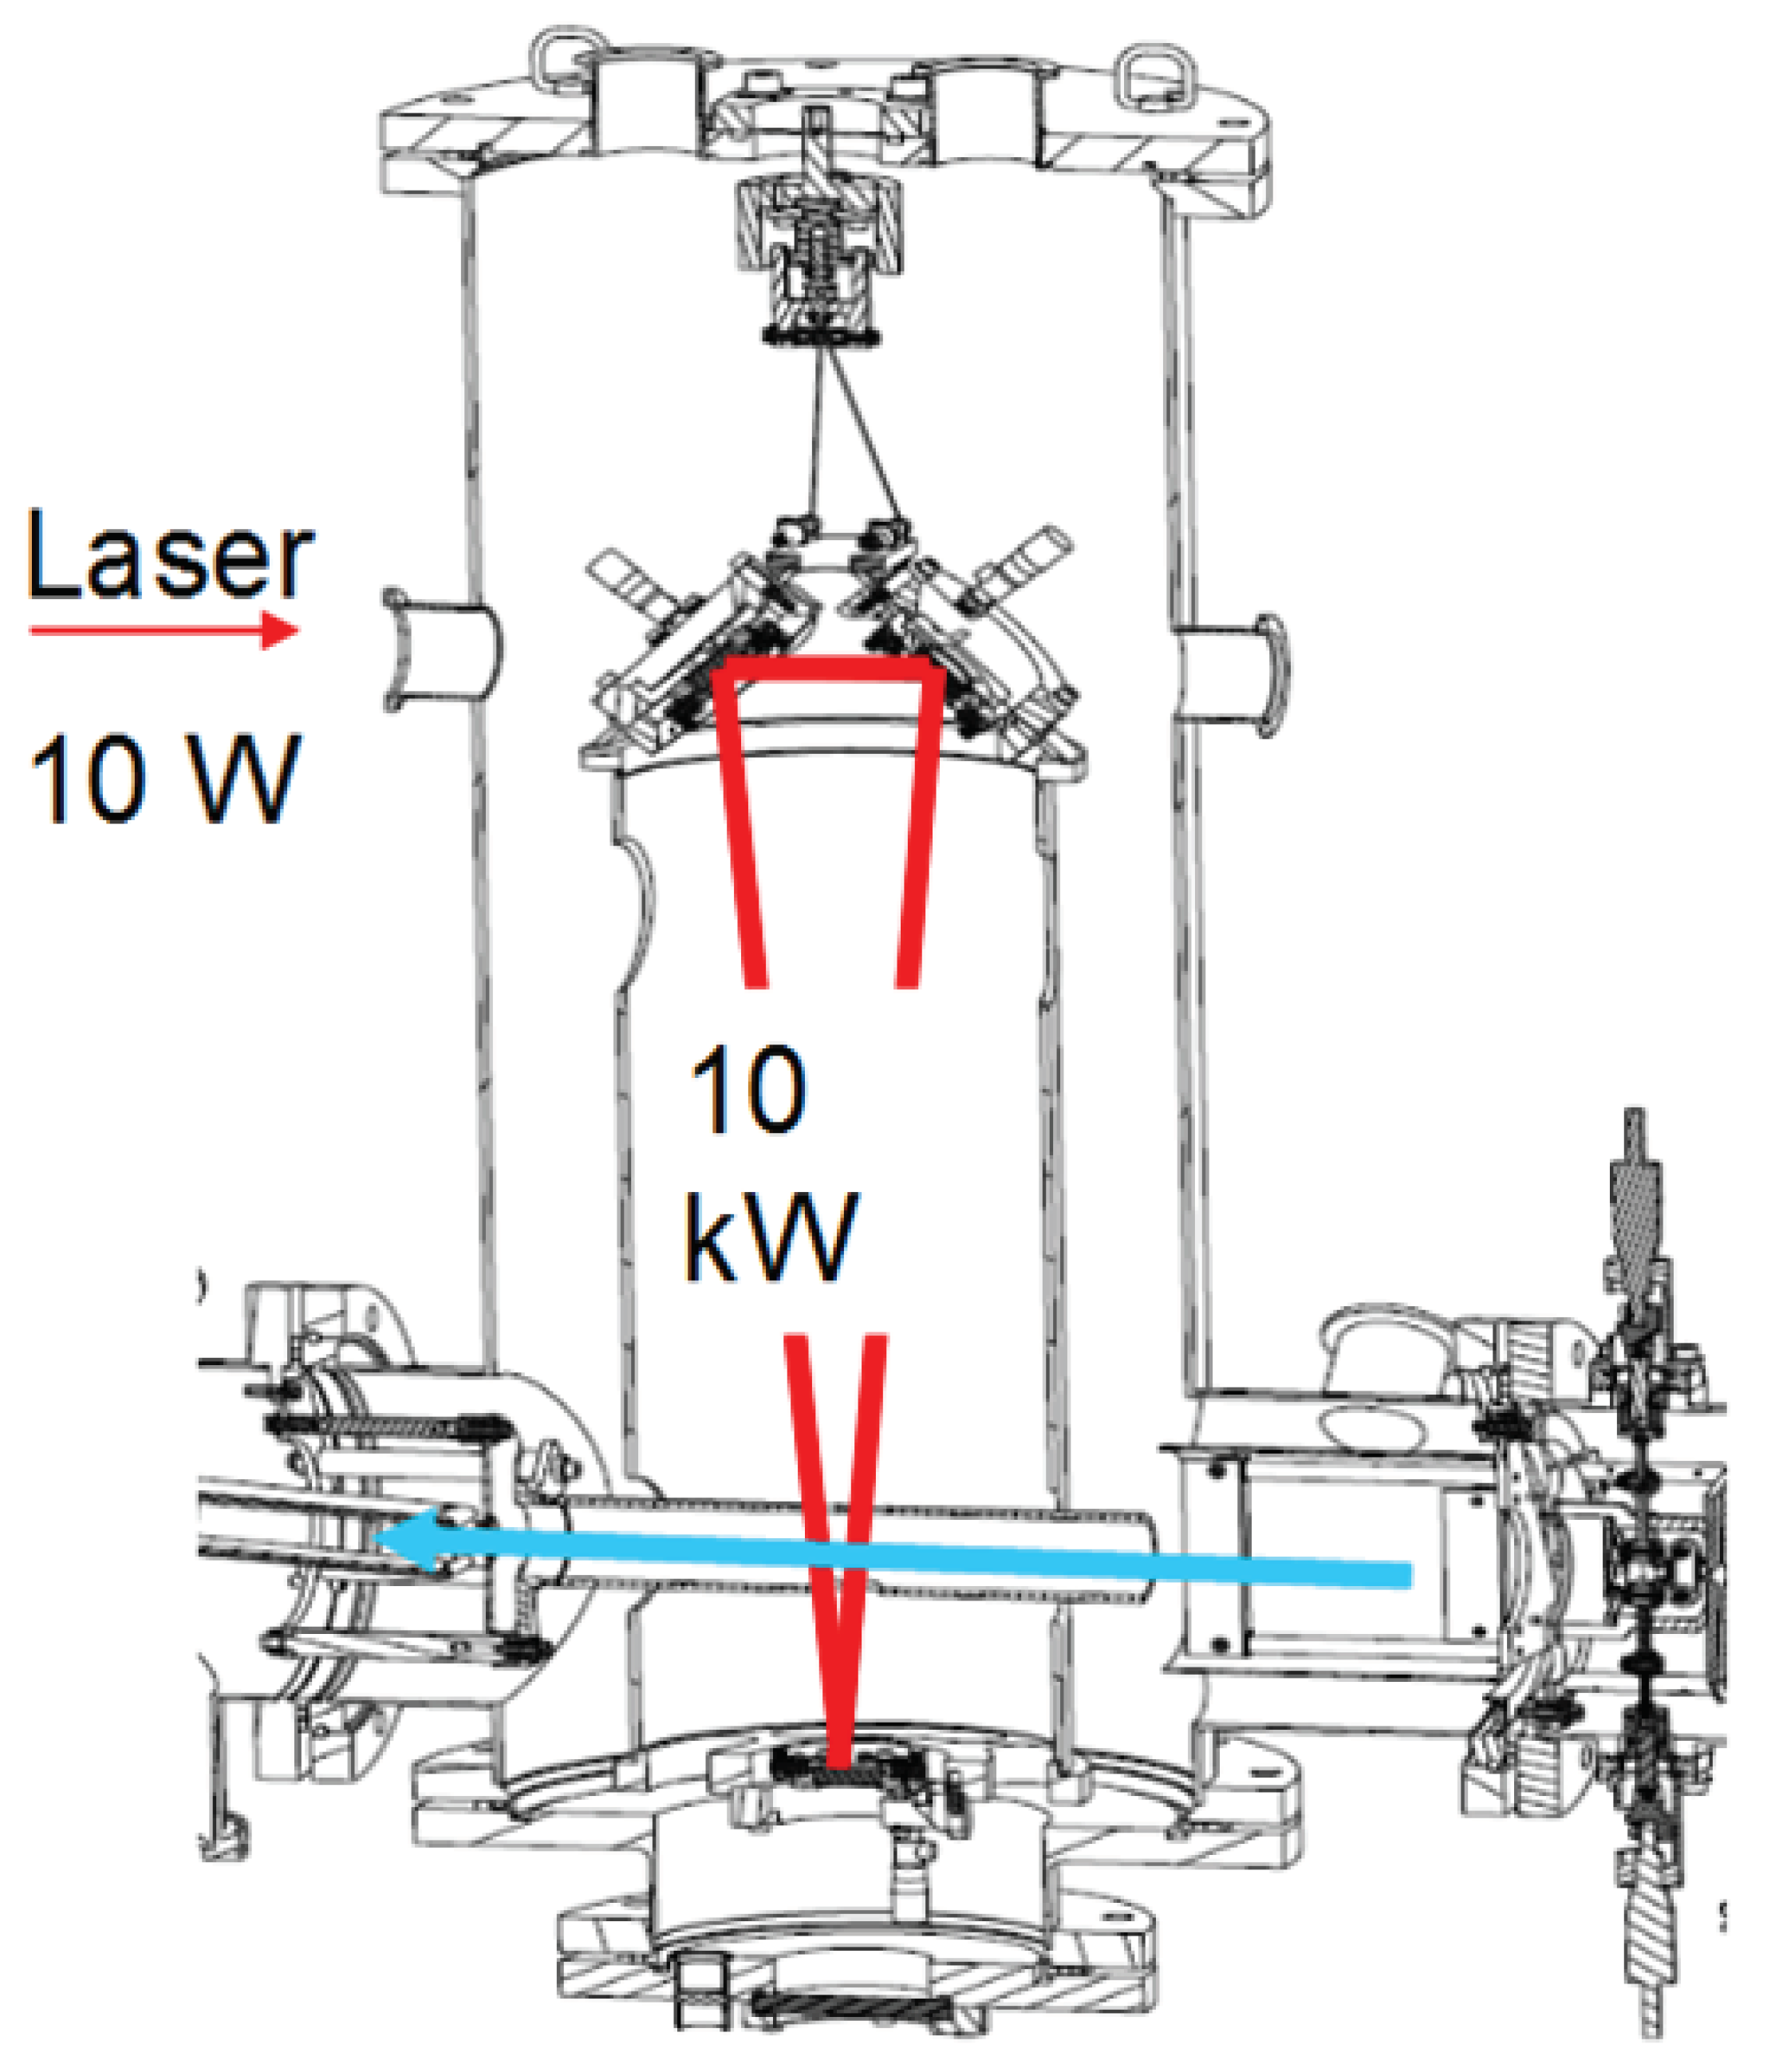
2.3. Optical Cavity and Light Storage

2.3.1. Geometry

The optical cavity is a triangular ring cavity, as shown by Figure 1, with an optical length L 1 m . It is equipped with high-reflectivity commercial mirrors: two (upper) plane mirrors set at a 43 angle of incidence, and a concave (lower) mirror with a radius of curvature R 5 m , set on a piezoelectric mount.
The waist w 0 of the TEM 00 mode is about 713 μ m at the wavelength λ = 1064 nm . It is located at the centre of symmetry of the cavity, between the two 43 plane mirrors. Diffraction, however, does not make the beam much broader all along the cavity circuit. The calculated value of w is 743 μ m , at the positions where the ion beam crosses the laser beam. The cavity frame is suspended inside the vacuum chamber by soft springs, in order to make it as insensitive as possible to external vibrations. The cavity can be rotated, as a whole, around a vertical axis to make it possible for the ion beam to pass twice through the laser beam, as shown in Figure 1.

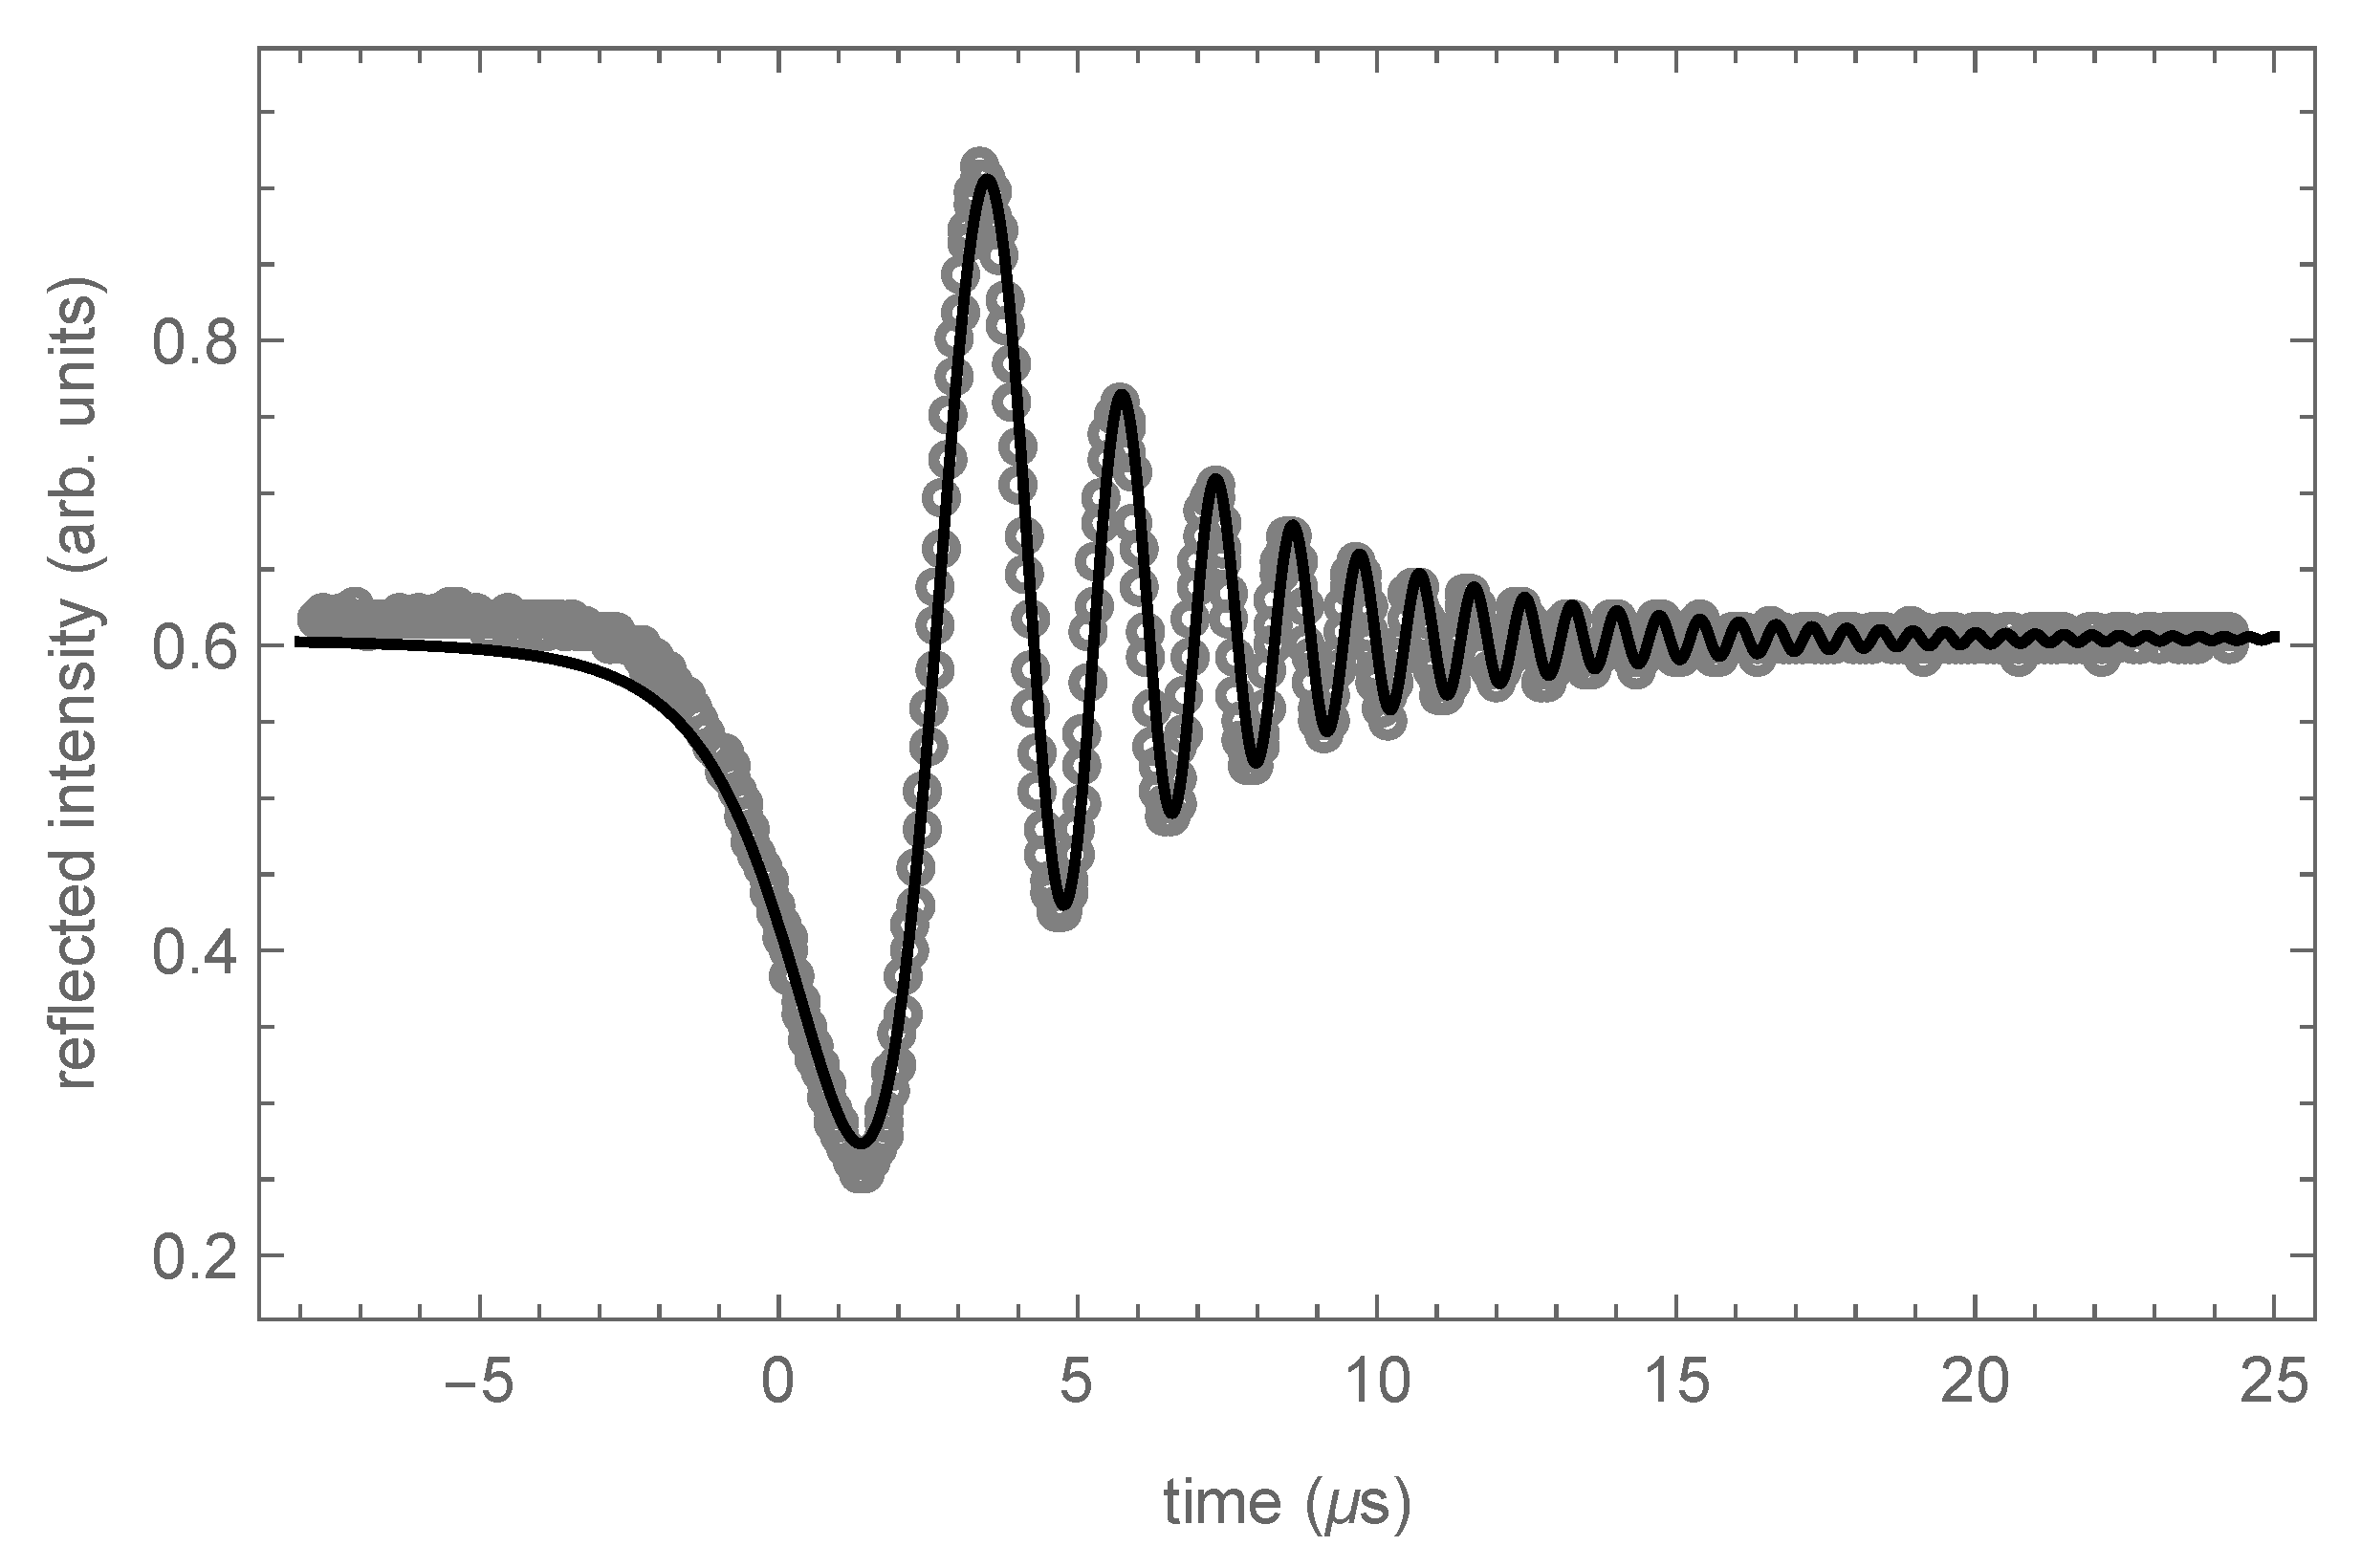
2.3.2. Cavity Finesse and Amplification Factor
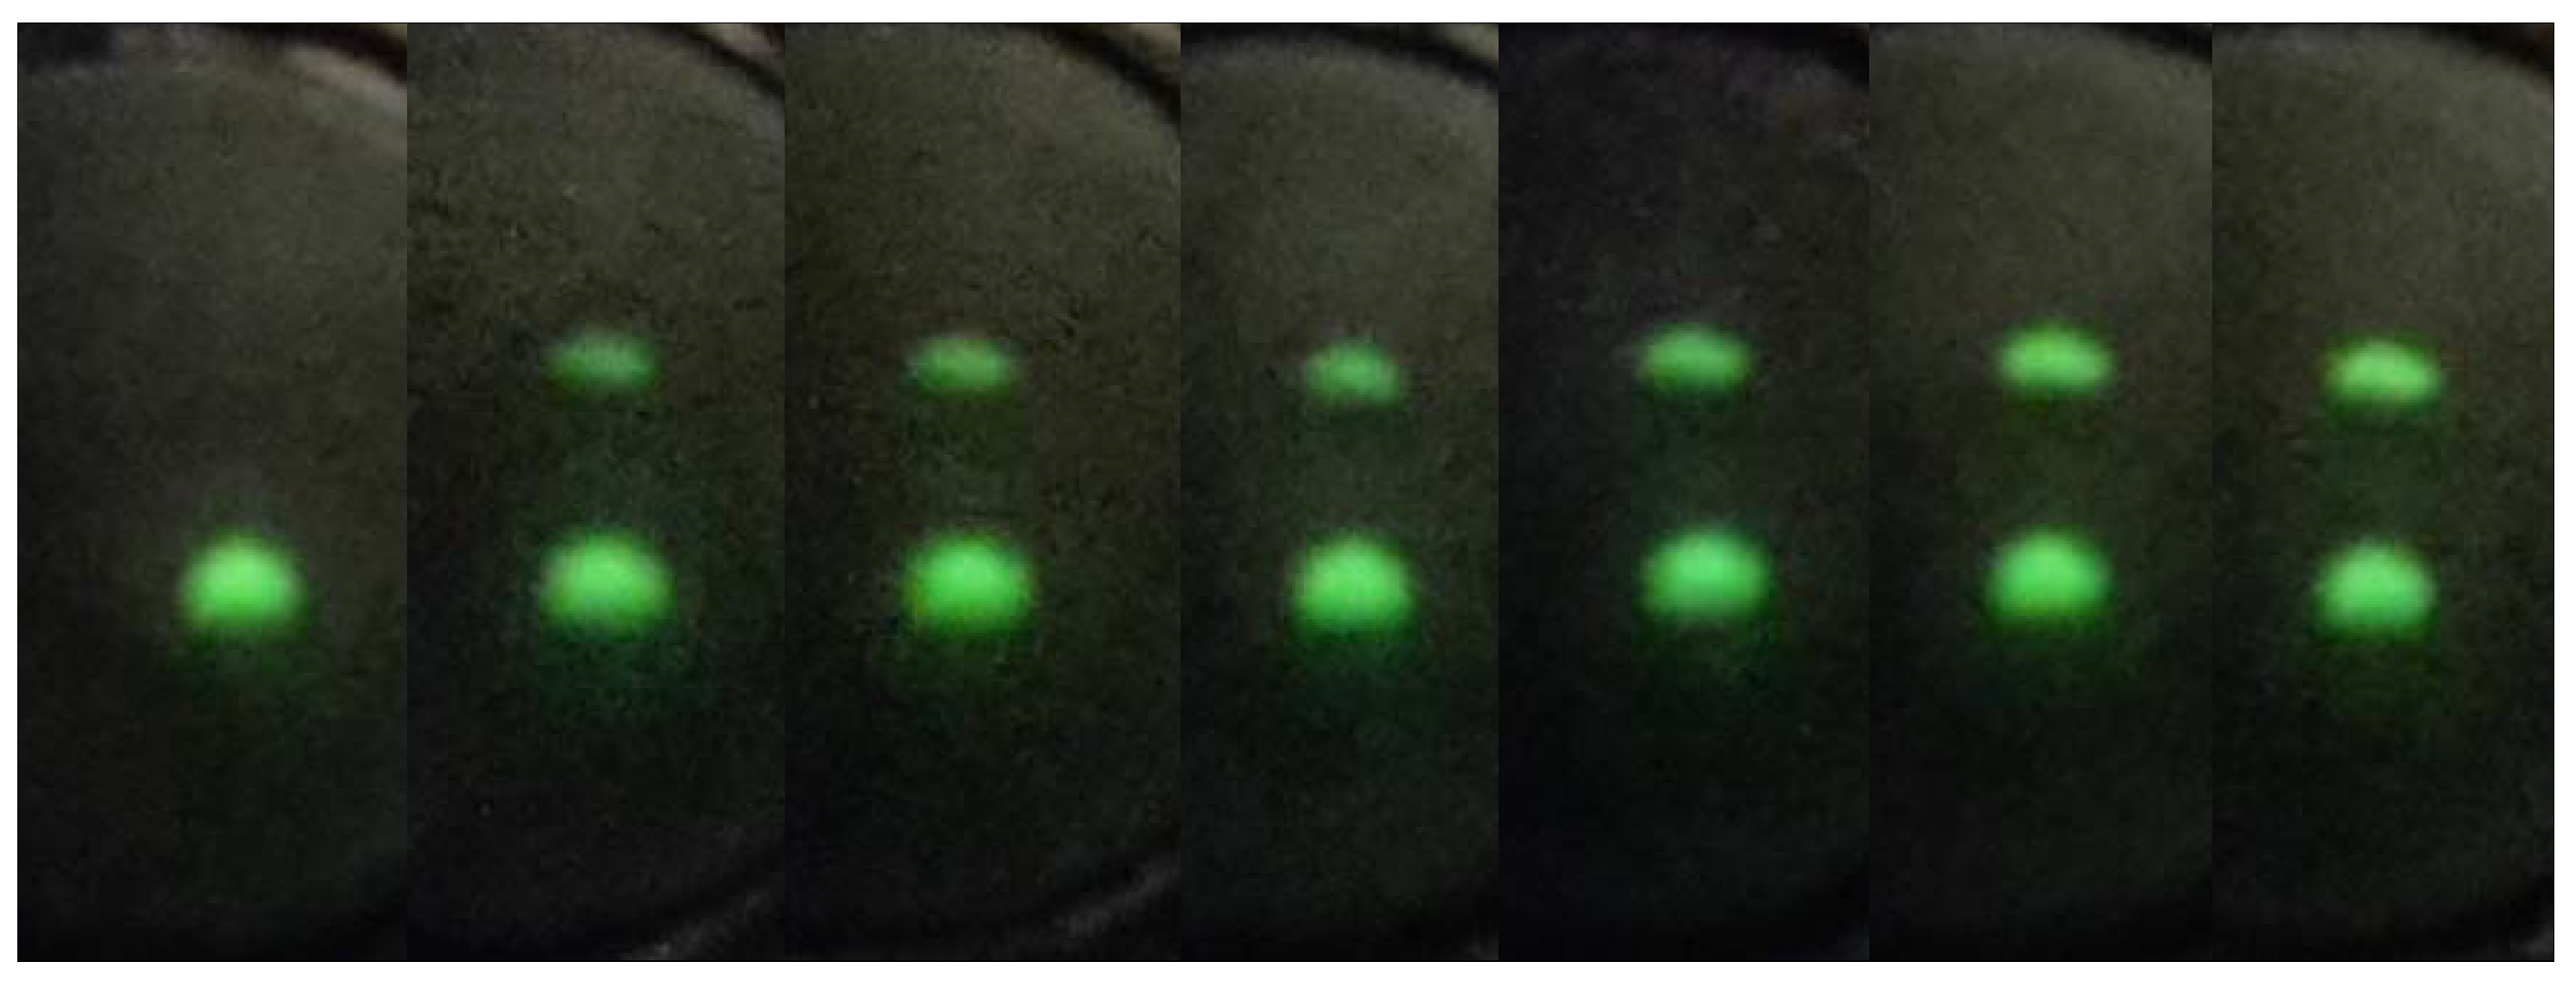
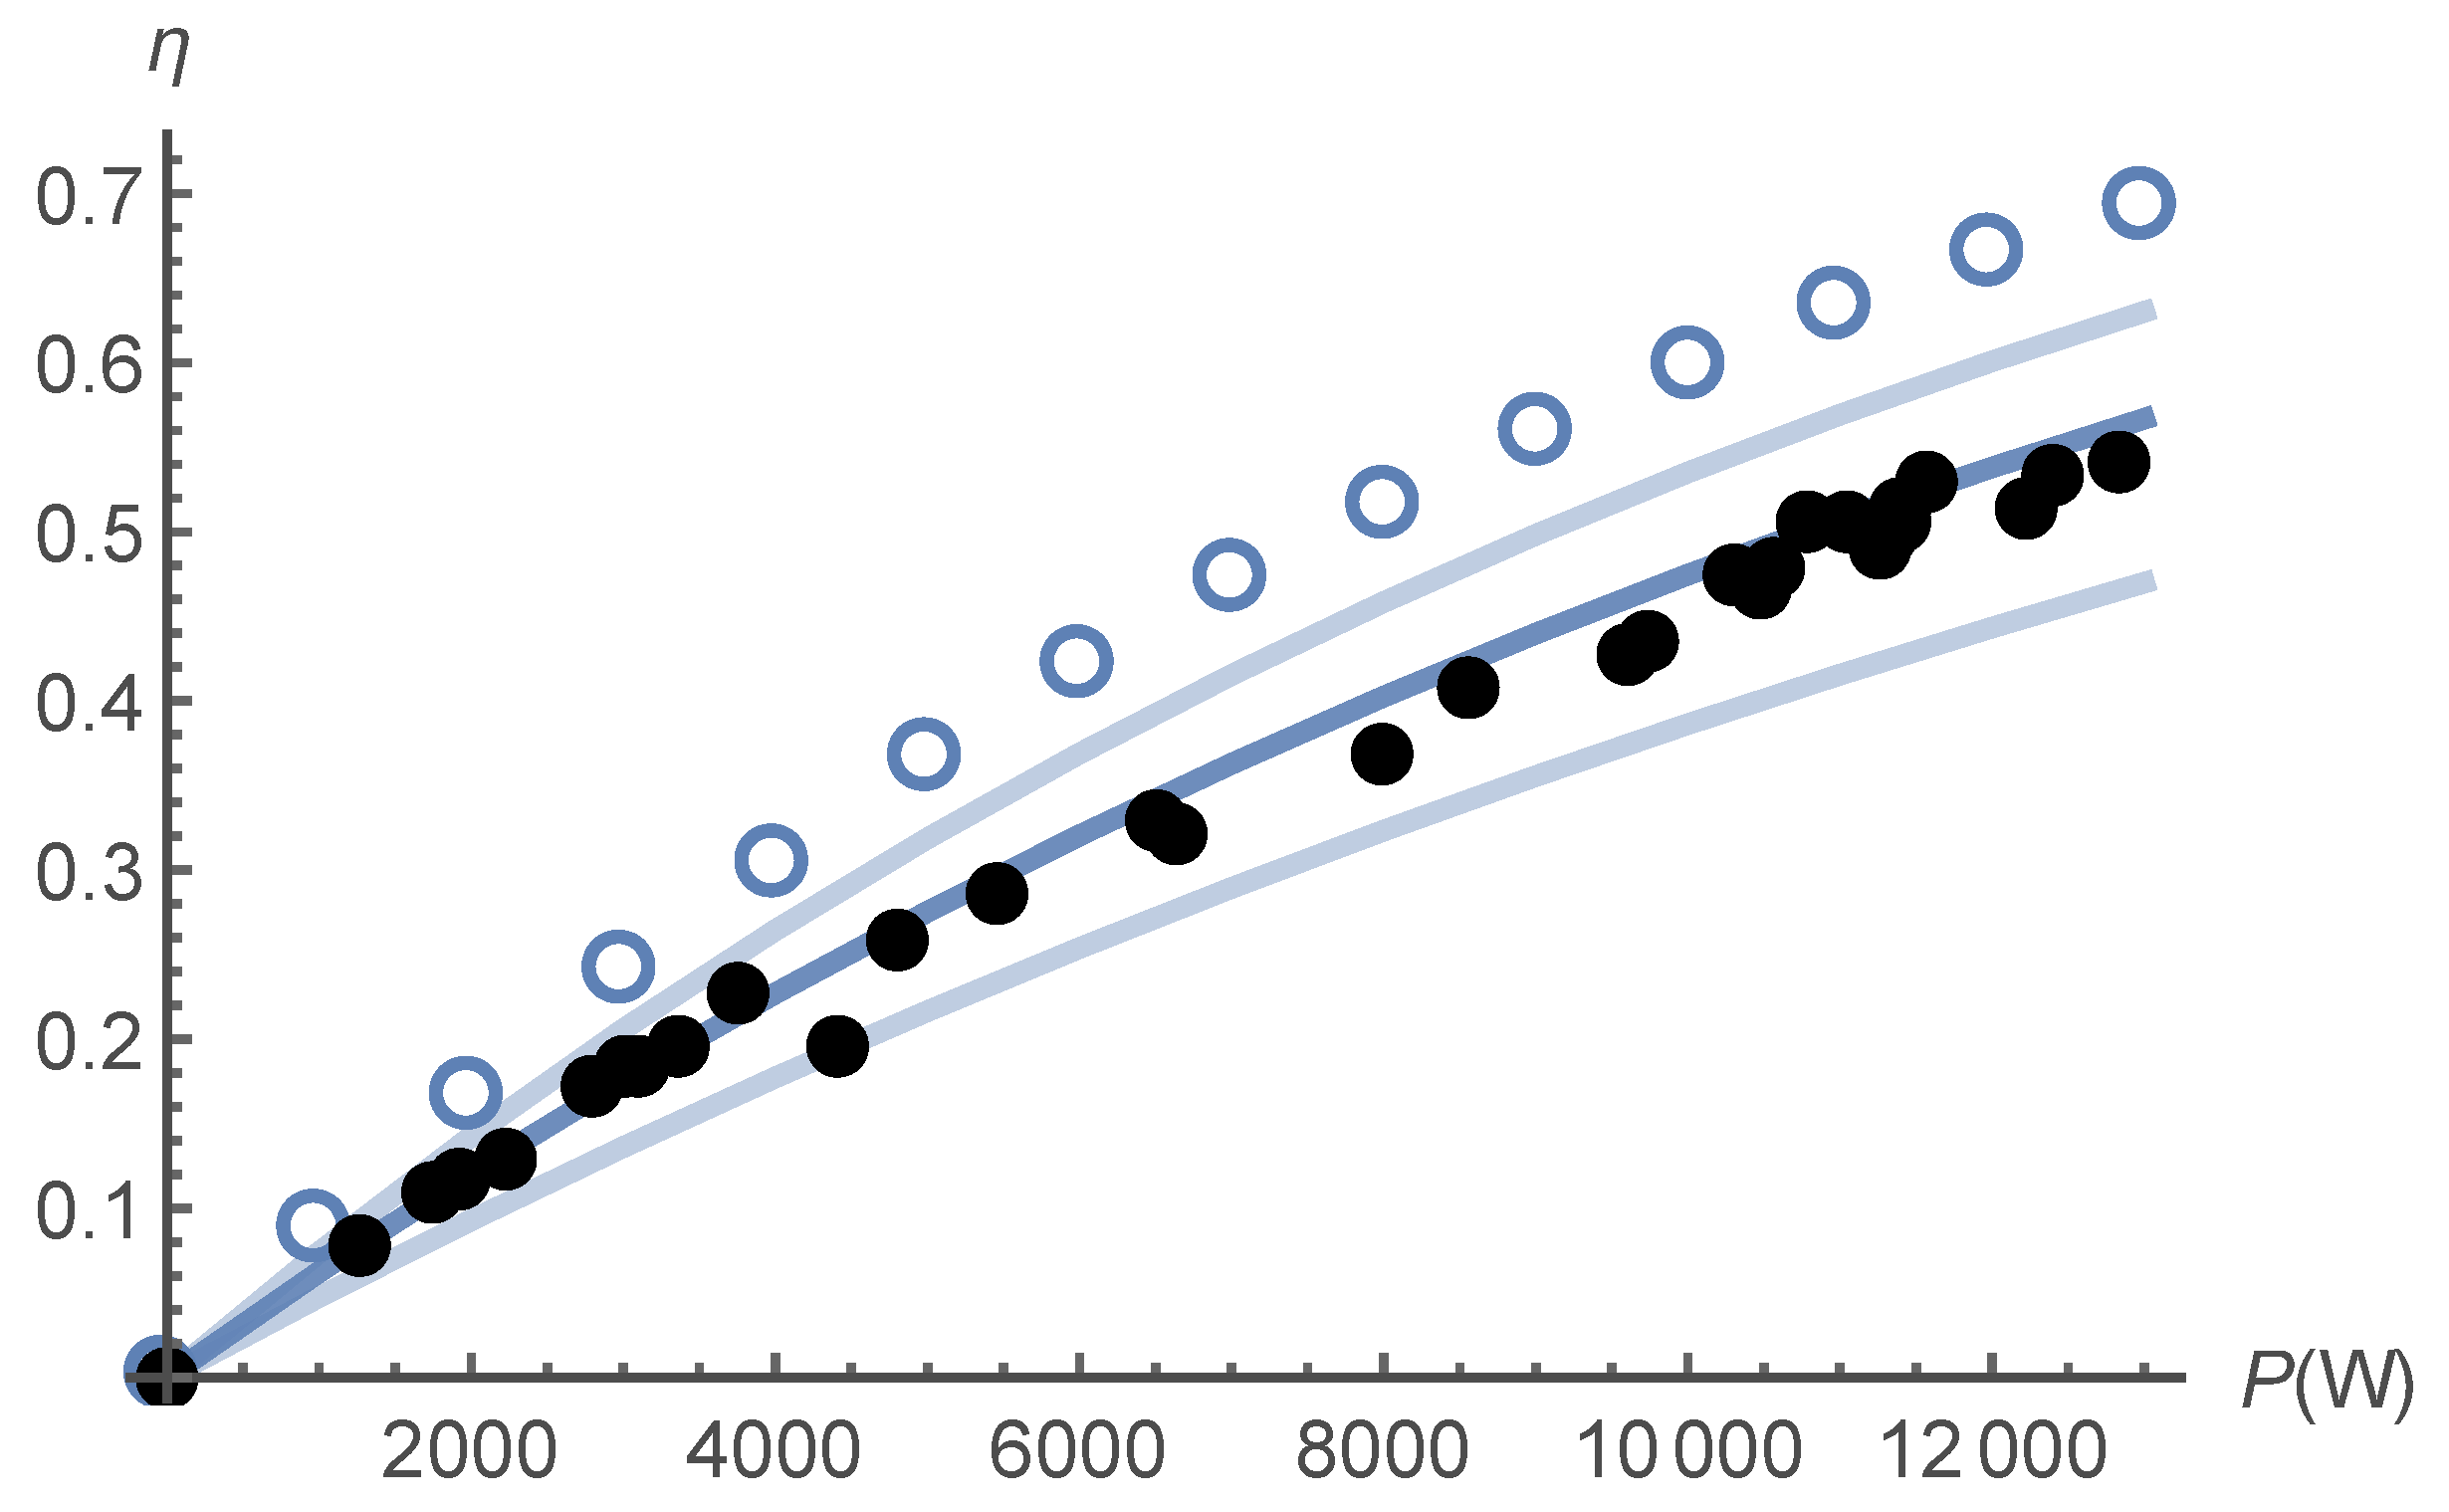
Defining θ as the multiplication factor of the amplitude after one round trip in the cavity, Θ = | θ | 2 is the corresponding multiplication factor of the intensity. Light accumulation inside the cavity leads to an integrated amplitude gain 1 θ 1 . Cavity resonance occurs every time the cavity length L is an integer multiple of the wavelength λ , which makes the argument of θ an integer multiple of 2 π , with θ close to 1. The finesse F of the cavity is defined as the ratio of the spectral interval between two adjacent resonances to the full width at half-maximum of every intensity resonance. Within an excellent approximation, F is given by
F π θ 1 θ .
The intensity amplification factor Γ , defined as the ratio of the internal intensity to the input intensity, at resonance, is given by
Γ = T 1 1 θ 2
with T 1 the transmission factor of the input mirror.
In the well-known case of a symmetrical lossless two-mirror cavity, the amplification factor Γ is just equal to F / π . With three mirrors and, in an even more general case, with losses other than the mirror transmissions (which determine both input and output couplings of the cavity), the ratio can take different values. Optimizing the finesse or the amplification factor are not subject to all identical constraints. Essential differences can be conveniently described by a simultaneous plot of Γ and F / π , as functions of T 1 and S, with S the energy fraction lost, for each intracavity round trip, for all other reasons than partial transmission back through the input mirror. The plot is done in Figure 2, assuming that the input mirror is a perfect one, i.e., with a reflection factor R 1 = 1 T 1 . The finesse F, which only depends on the total intracavity losses, then becomes a function of T 1 + S only, which makes the contour lines of constant F parallel straight lines drawn on the developable F / π surface. The Γ and F / π surfaces intersect on the line S = T 1 . Factor Γ can go up to 2 × F / π , if S can be made negligible with respect to T 1 . In actual situations, however, a constraint is more often that S losses are imposed, and one has to find the best-matching input mirror. The maximum amplification factor, with such a constraint, is met with an input mirror such that T 1 = S , which brings us back to the median line, with a ratio Γ / F = 1 / π only. As a matter of fact, the working point of the present experiment, shown in Figure 2, even corresponds to a slightly lower ratio, with F 3600 and Γ 900 .
The input mirror was an Opto4u one-inch-in-diameter 45 mirror, the reflectivity of which is given by the manufacturer to be > 0 . 992 (resp. > 0 . 997 ) in p (resp. s) polarisation, i.e., with the electric field parallel (resp. perpendicular) to the incidence plane. We have measured its transmission and found it to be 6 . 4 ( 3 ) × 10 4 ( 2.0 ( 2 ) × 10 5 , respectively). More details on the optical components of the cavity have been published elsewhere [8]. As a matter of fact, mirror reflection factors happen to be significantly greater than just told by their minimum specifications, but the experiment also shows that intracavity attenuation does not only result from outward mirror transmission. Absorption, scattering and diffraction make factor S a little greater than 10 3 , whatever the polarization. Having a transmission factor T 1 = 6.4 ( 3 ) × 10 4 at the input was thus slightly too little, meaning that the cavity was under-coupled. The even lower coupling coefficient with the other polarization was definitely too low to take advantage of the better finesse expected in the s case. Unfortunately, the time devoted to the experiment was too limited to order new, better-suited optical components. All experiments have thus been carried out in p polarization. Obvious solutions nevertheless exist to improve the cavity finesse and get higher amplification factors.
The intracavity power P can be determined either as the ratio of the output at one or the other secondary mirrors, provided that their transmission factor has been measured, or by monitoring the reflected intensity at the input mirror in a dynamical regime, scanning the cavity length. When this length L is scanned fast enough to go through a resonance in a time shorter than the cavity storage time, a “ringing” phenomenon occurs, as shown by Figure 3, which consists of fast oscillations of the reflected power, following every resonance (the intensities transmitted by the secondary mirrors exhibit similar phenomena). If scanning is not made so fast that the time lapse between resonances gets shorter than the cavity damping time, the observed intensity oscillations can be fitted by an analytical formula [8], which gives a means to evaluate the cavity finesse without depending on light flux calibration.
For input powers greater than 12 W, it was observed that the increase of the transmitted power ceased to be a linear function of the input. This had not been observed when the cavity had been tested at atmospheric pressure, and may be due to thermal effects. As a consequence, despite the cavity amplification factor Γ having been confirmed, both by finesse and power measurements to be about 900 at low intensities, the maximum intracavity power did not exceed 14 kW , for the input power 24 W .

3. Results

A series of images recorded with the “beam observation system” is displayed on Figure 4, which shows that, at the maximum illumination, the neutral beam has reached an intensity similar to the intensity of the ion beam (notwithstanding the possibility of a slight sensitivity difference between the two species).
More quantitative measurements are carried out with the Faraday cup. A plot of the beam photodetachment rate η as a function of the intracavity power is shown in Figure 5, together with what numerical modelling predicts for three possible offsets of the ion beam with respect to the cavity mode. The experimental results appear quite compatible with the value 3 . 6 × 10 21 m 2 of the cross-section most widely reported by theorists [12,13,14] or the most recent experimental value [15] if one admits a medium 250 μ m offset. The larger value 4.5 × 10 21 m 2 , which was found to be the most probable in the 2014 measurement [12] (although with a large ± 14 % uncertainty) would also be compatible with the observation, assuming a δ = 400 μ m offset.

4. Discussion

We have shown that optical-cavity enhancement can make photodetachment an actual means of neutralizing the greater part of a H beam, and produce a neutral beam efficiently. Up-scaling remains to be done as concerns the beam diameter and ion velocity, but the demonstration already dealt with cavity finesses of the order of magnitude to be met in real-size neutral beam injectors. The power fluxes reached, due to intra-cavity amplification, were already of the order of magnitude of the fluxes to be dealt with, when more power is stored in larger cavities, with larger beam diameters. The corresponding thermal effects may explain the reduction of the finesse observed at higher intensities. Mechanical compensation of these effects was not implemented, as it will be easier on larger mirrors. Testing such a compensation at a reduced scale would thus be an unnecessary challenge.
The use of a ring cavity, instead of a stationary-wave one, appears highly recommendable, since it does not add to the difficulty and prevents the light reflected at the input mirror to go back to the laser. Beam-refolding makes it possible for the intracavity light beam to pass several times on the ion beam [16] and future designs should not be limited to the tested three-mirror triangular scheme. The maximum practical number of mirrors or refoldings will be determined by the reflectivity of the mirrors (the better the reflectivity, the larger the possible refolding index) and the smallest allowable spectral width of a cavity mode (the longer the cavity, the smaller the spectral width).
Investigations are carried out, on the other hand, on the possibility of having a H or a D beam efficiently photodetached by incoherent light recycling, in a so-called “photon cell” [17]. Both ways appear worthy of being investigated further. The pros and cons of coherent intracavity amplification vs. incoherent intensity summation have thus to be balanced:
Table 1 shows that the current state of the art makes both solutions potentially equivalent, as for the numbers of advantages and drawbacks. A typical illustration of that balance is that the amplification obtained by amplitude summation, of the order of the squared finesse F 2 , gets counterbalanced by the weakness of the transmission of the input mirror, necessarily of the order of 1 / F . Nevertheless, some of the listed difficulties could prove easier to overcome, in the one or the other solution.
The major drawbacks of the optical cavity scheme are that resonance makes it necessary for the input laser to be spectrally narrower than a resonant mode of the cavity and for the laser wavelength to be continuously locked on a sub-multiple of the cavity length. This is a fundamental difficulty that cannot disappear, but making tunable lasers spectrally narrow has been the bread-and-butter business of laser technology for nearly 50 years.
Incoherent summation by the multiplication of non-overlapping laser beams in a stable cavity may appear more tentative. Distributed reflections, in that case, however spread over a larger area of the mirrors, which makes the geometrical stability of the ray pattern more sensitive to spherical aberrations. Coherently packing all reflections together in the TEM 00 mode, on the axis, should make it easier to keep these aberrations low and reach higher reflectivities, with smaller-diameter mirrors. Accordingly, one can expect the necessary power to be put into a resonant cavity to remain smaller, and the whole set-up, based on lower diameter mirrors, to remain cheaper. As a result, a coherent cavity would also be advantageous as concerns the power consumption and lost energy to be disposed of.

5. Conclusions

Photoneutralization of a negative-ion beam has been achieved with more-than-50% efficiency, thanks to the use of an optical cavity, at a reduced scale as concerns the beam diameter and ion velocity. The orders of magnitude of both the cavity finesse and light flux on the cavity mirrors, however, are already the same as those required in future real scale neutral beam injectors. As for the laser power needed to develop those injectors, laser technology gets closer and closer everyday to providing the few, spectrally narrow, kW of continuous laser power, suitable for cavity injection. All components of future photodetachment-based D 0 injectors are thus to become available in the near future, in a realistic scenario [18]. The development of a real-scale experiment, where a D beam of several centimetres would be detached in a cavity after acceleration to 1 MV, would thus appear highly recommendable, without prejudice against the parallel development of multipass cells, which can appear equally promising, for the implementation of photodetachment in future neutral beam injectors.

Author Contributions

Conceptualization, C.B. and C.D.; methodology, C.B. and C.D.; software, C.B. and D.B., validation, D.B. and C.D.; formal analysis, C.B., D.B. and C.D.; investigation, D.B. and C.D.; resources, D.B. and C.D.; data curation, D.B. and C.D.; writing original draft preparation, D.B.; writing review and editing, C.B.; visualization, C.B., D.B. and C.D.; supervision, C.B.; project administration, C.B.; funding acquisition, C.B.

Funding

This research was funded by the Agence nationale de la recherche (ANR) grant number ANR-13-BS04-0016-01 and by the Euratom research and training programme 2014–2018 grant number 633053. The views and opinions expressed herein do not necessarily reflect those of the European Commission.

Acknowledgments

This work was supported by grant ANR-13-BS04-0016-01 of the French Agence Nationale de la Recherche. It was also carried out within the framework of the Eurofusion consortium and has received funding from the Euratom research and training programme 2014–2018 under Grant No. 633053. The views and opinions expressed herein do not necessarily reflect those of the European Commission.

Conflicts of Interest

The authors declare no conflict of interest.

References

  1. Fink, J.H.; Alessi, J.G. Neutralizer options for high energy H beams. AIP Conf. Proc. 1987, 158, 618–630. [Google Scholar]
  2. Fink, J.H. Photodetachment technology. AIP Conf. Proc. 1984, 111, 547–560. [Google Scholar] [CrossRef] [Green Version]
  3. Vanek, V.; Hursman, T.; Copeland, D.; Goebel, D.M.; Prelec, K. Technology of a laser resonator for the photodetachment neutralizer. AIP Conf. Proc. 1984, 111, 568–586. [Google Scholar]
  4. Van Zyl, B.; Utterback, N.G.; Amme, R.C. Generation of a fast atomic hydrogen beam. Rev. Sci. Instrum. 1976, 47, 814–819. [Google Scholar] [CrossRef]
  5. Chaibi, W.; Blondel, C.; Cabaret, L.; Delsart, C.; Drag, C.; Simonin, A. Photoneutralization of Negative Ion Beam for Future Fusion Reactor. AIP Conf. Proc. 2009, 1097, 385–394. [Google Scholar] [CrossRef]
  6. Ervin, K.M.; Ho, J.; Lineberger, W.C. A study of the singlet and triplet states of vinylidene by photoelectron spectroscopy of H2C = C, D2C = C, and HDC = C. Vinylidene–acetylene isomerization. J. Chem. Phys. 1989, 91, 5974–5992. [Google Scholar] [CrossRef]
  7. Kim, J.B.; Wenthold, P.G.; Lineberger, W.C. Ultraviolet Photoelectron Spectroscopy of o-, m-, and p-Halobenzyl Anions. J. Phys. Chem. A 1999, 103, 10833–10841. [Google Scholar] [CrossRef]
  8. Bresteau, D.; Blondel, C.; Drag, C. Saturation of the photoneutralization of a H beam in continuous operation. Rev. Sci. Instrum. 2017, 88, 113103. [Google Scholar] [CrossRef] [PubMed]
  9. Available online: http://www.pelletron.com/ (accessed on 27 February 2019).
  10. Guiraud, G.; Traynor, N.; Santarelli, G. High-power and low-intensity noise laser at 1064 nm. Opt. Lett. 2016, 41, 4040–4043. [Google Scholar] [CrossRef] [PubMed]
  11. Black, E.D. An introduction to Pound–Drever–Hall laser frequency stabilization. Am. J. Phys. 2001, 69, 79–87. [Google Scholar] [CrossRef]
  12. Vandevraye, M.; Babilotte, P.; Drag, C.; Blondel, C. Laser measurement of the photodetachment cross section of H at the wavelength 1064 nm. Phys. Rev. A 2014, 90, 013411. [Google Scholar] [CrossRef]
  13. Scott, M.P.; Kinnen, A.J.; McIntyre, M.W. Photon collisions with atoms and ions within an intermediate- energy R-matrix framework. Phys. Rev. A 2012, 86, 032707. [Google Scholar] [CrossRef]
  14. McLaughlin, B.M.; Stancil, P.C.; Sadeghpour, H.R.; Forrey, R.C. H photodetachment and radiative attachment for astrophysical applications. J. Phys. B At. Mol. Opt. Phys. 2017, 50, 114001. [Google Scholar] [CrossRef]
  15. Génévriez, M.; Urbain, X. Animated-beam measurement of the photodetachment cross section of H. Phys. Rev. A 2015, 91, 033403. [Google Scholar] [CrossRef]
  16. Kovari, M.; Crowley, B. Laser photodetachment neutraliser for negative ion beams. Fusion Eng. Des. 2010, 85, 745–751. [Google Scholar] [CrossRef]
  17. Popov, S.; Atlukhanov, M.G.; Burdakov, A.V.; Ivanov, A.; Kasatov, A.; Kolmogorov, A.V.; Vakhrushev, R.V.; Ushkova, M.Y.; Smirnov, A.; Dunaevsky, A. Neutralization of negative hydrogen and deuterium ion beams using non-resonance adiabatic photon trap. Nucl. Fusion 2018, 58, 096016. [Google Scholar] [CrossRef] [Green Version]
  18. Simonin, A.; Achard, J.; Achkasov, K.; Bechu, S.; Baudouin, C.; Baulaigue, O.; Blondel, C.; Boeuf, J.P.; Bresteau, D.; Cartry, G.; et al. R&D around a photoneutralizer-based NBI system (Siphore) in view of a DEMO Tokamak steady state fusion reactor. Nucl. Fusion 2015, 55, 123020. [Google Scholar]
Figure 1. View of the experimental set-up. The optical cavity is suspended inside the vacuum chamber so as to reduce its coupling to external vibrations. The triangular optical circuit is about 1 m long. The laser beam is injected into the cavity horizontally, and (unshown) photodiodes and/or powermeters can be set to measure transmitted and reflected intensities, respectively, to get a measurement of the cavity finesse and amplification factor. The intensity is multiplied by a factor of 1000 inside the cavity, with respect to the input laser power, which makes typically a 10 kW laser beam circulate between the mirrors, with only 10 W of input power. Before reaching the laser beam, the ions pass (right to left) through an adjustable diaphragm made of two vertical plates mounted on micrometer screws, so as to make a quantitative measurement possible of the detachment rate, for ions that actually cross the intracavity optical mode. The neutral beam produced continues straightforward to be either detected by an electron multiplier or visualized by a beam imager made of microchannel plates and a phosphor screen. The intensity of the residual anion beam can be monitored by subsequent diversion of the remaining ions by deflection plates towards a Faraday cup.
Atoms 07 00032 g001
Figure 2. Two-dimensional chart of the finesse F (light) and amplification factor Γ (dark), as functions of the input mirror transmission T 1 and other intracavity losses S, assuming that the intracavity reflection factor of the input mirror is just equal to 1 T 1 (no other losses). The finesse has been divided by π to make it conspicuous that T 1 = S is the place where Γ = F / π . When S happens to be much smaller than T 1 , the Γ / F ratio can go up to 2 / π . However, in every section of constant S, the maximum value of Γ is found on the T 1 = S diagonal, with a Γ / F ratio of only 1 / π . The ellipse shows the working point for the present study.
Atoms 07 00032 g002
Figure 3. Intensity reflected by the input cavity mirror as a function of time, for a scanning velocity of one of the cavity mirrors 175 ( 2 ) μ m s 1 . The time derivative of the varying cavity length L can be directly measured by extending the scan to times large enough to make resonances appear in succession, which they do every time L has changed exactly by λ . The fitting curve here corresponds to a finesse F = 3681 . Dynamic reflection at the input mirror does not only give information about the cavity finesse, but on the transmission coefficient T 1 of the input mirror too. The result here is T 1 = 6.0 ( 1 ) × 10 4 .
Atoms 07 00032 g003
Figure 4. Visual monitoring of neutral beam production. The undetached ions are deflected by an electric field weak enough not to send them out of the detector, leading to simultaneous observation of both the ion (below) and neutral (above) beams. The beams are offset by 6.2 mm. The intracavity light power was 0, 1.3, 1.45, 2, 3, 6.5 and 11.5 kW (it being understood that the ions cross twice a beam of that power), from left to right.
Atoms 07 00032 g004
Figure 5. Photodetachment ratio η , measured as the attenuation of the negative ion beam when the laser is switched on, as a function of the intracavity power P. The black dots are the experimental points. The continuous lines correspond to what can be predicted by theory, for a 3.6 × 10 21 m 2 cross-section and three different hypotheses for the offset δ of the two laser beams, the one with respect to the other, in the direction perpendicular to the ion beam: zero, 250 and 400 μ m , from top to bottom, respectively. The open circles ○ show the photodetachment ratios that would be obtained for twice heavier, hence 2 times slower D ions, for the most probable δ = 250 μ m value.
Atoms 07 00032 g005
Table 1. The lesser (⊕), greater (⊖) or similar difficulties (⊙) of coherent amplitude summation in an optical cavity vs. incoherent intensity summation in a multipass cell. The orders of magnitude are estimated for a real-size neutral beam injector, with a kinetic energy of 1 MeV per D 0 atom, assuming that the width of the ion beam could be reduced to 1 cm.
ParameterResonant CavityMultipass
Summation carried out⊕ Amplitude summation⊖ Intensity summation
Input coupling 1 / F ⊕ 1
Laser required⊖ Locked single mode⊕ Multimode admitted
Laser power required⊙ 1 kW⊙ 500 kW
Laser power available in 2018⊙ 100 W⊙ 100 kW
Price in 2018⊕ ca. 100 k€⊖ ca. 2 M€
Dissipated power⊕ a few kW⊖ > 1 MW
Intended amplification × 5000 × 100
Required stability δ L λ ⊕ a few degrees’ angular accuracy
Spatial filtering⊖ TEM 00 filtering < 3 divergence

