Abstract
Modeling of the spectral line and continuum radiation emitted by hydrogen isotopes in peripheral regions of magnetic fusion is presented through profiles of the Zeeman-Doppler broadened Hα/Dα line and those of the Stark broadened high-n Balmer lines extending beyond the series limit for recombining plasmas. The Hα/Dα line profiles should be modelled while accounting for several populations of neutrals to mimic real situations and analyze experimental data for isotopic ratio determination. On the other side, high-n Balmer lines of hydrogen are used for plasma electron density and temperature diagnostics. Moreover, modelling whole spectra including the continuum radiation contributes to the development of synthetic diagnostics for future magnetic fusion devices for which they can give predictive results through coupling to numerical simulation tools.
1. Introduction
Decades after the first experiments on controlled thermonuclear fusion in tokamaks, and despite the large amounts of scientific and technological progress and the high quality of our scientific knowledge, the path towards a power plant based on this principle has been shortened but there still remains some major problems to overcome. Indeed, several issues need to be solved like the mitigation of disruptions and the retention of tritium by the plasma-facing components or materials (PFCs) and the control of the power and particle loads on these materials as well. For safety reasons, it is crucial to determine the isotopic ratio for deuterium-tritium (D-T) plasmas. However, except for very few D-T discharges in the past and some planned in the near future at JET (Joint European Tokamak), fusion plasma experiments use deuterium gas or sometimes a mixture of hydrogen and deuterium. Therefore, it is crucial to determine as accurate as possible the isotopic ratio H/(H+D) in D-D and H-D plasma experiments in order to fulfill the tight constraints required by the D-T experiments in terms of tritium concentration. Concerning the other major issue of power exhaust, it is mandatory to reduce the huge heat and particle flux loads to acceptable levels because the most advanced target materials do not support power loads in excess of 10–20 MW/m2. A solution widely used to mitigate power and particle loads consists in the creation of a radiative dense, cold mantle in the divertor which leads to plasma detachment through the volume recombination processes. Detachment has been achieved in many tokamaks like Alcator C-mod [1], DIII-D [2], JET [3,4] and ASDEX Upgrade [5,6]. It is largely admitted that this scenario is the most efficient solution and it has even been foreseen for the operation of ITER (International Thermonuclear Experimental Reactor). Under the conditions of divertor plasma detachment, high-n lines of the Balmer series of hydrogen isotopes extending to (or beyond) the series limit can be observed. These spectra are used to infer both the plasma electron density and the temperature when compared to calculated spectra. Modeling the complete spectra of the radiation emitted in the visible domain by hydrogen or deuterium neutrals for plasma conditions relevant to recombining plasmas is therefore of great interest. This paper is organized as follows. Section 2 is devoted to the modeling of the Hα/Dα line emitted by several neutral populations of hydrogen and deuterium neutrals to mimic the recycling mechanisms taking place in tokamak divertors. Section 3 is focused on the modeling of hydrogen high-n Balmer lines and continuum emission for conditions relevant to recombining plasmas where the electron density is in the range 1014–1015 cm−3 and the electron temperature is around 1–2 eV or less.
2. The Zeeman–Doppler Hα/Dα Line Profile
In peripheral regions of tokamaks, especially in the divertor and the scrape-off layer (SOL), the Hα/Dα line is one of the most intense lines emitted by plasma in the visible domain. For typical electron densities of about 1014 cm−3 and temperatures of few eV, the profile of this line is dominated by Doppler broadening in addition to the Zeeman effect which splits and removes the degeneracy of the involved energy levels at n = 2 and n = 3, and introduces an anisotropy due to polarization. To a good approximation, the broadening due to the Stark effect can be neglected and the Hα/Dα line profiles can be modelled by retaining only Zeeman and Doppler effects. The treatment of the Zeeman effect depends, obviously, on the strength of the magnetic field. In addition, energy perturbation due to the Zeeman effect has to be compared to that due to the relativistic corrections which are part of the fine structure. Without any loss of generality, we consider situations with magnetic fields greater than 2 T and assume that the use of the strong field approximation is valid to account for Zeeman effect. Under such conditions, the fine structure effect can be neglected and if observed in a direction perpendicular to the magnetic field direction, one sees the well-known Lorentz triplet of the Balmer-α line composed of an un-shifted π component and two lateral components, known as the σ components, which are equally separated from the unshifted one. The separation between the p and s component depends linearly on the magnetic field strength. It should be noted that in the case of an observation parallel to the magnetic field, only the s components are observed. If the instrumental function of measurement apparatus is weak, each component will show a Gaussian profile due the thermal motion of the neutral emitters. The full width at half maximum (FWHM) of each component is proportional to the square root of the neutral temperature () according to Doppler broadening theory. However, in divertor tokamaks it is known that several processes contribute to the release of hydrogen or deuterium neutrals. This is known as particle recycling. Indeed, neutrals can be released following dissociative excitation of desorbed molecules, or through reflection as neutrals of impinging ions, or through charge exchange processes. These mechanisms are responsible for the coexistence of several populations of neutrals each with its own velocity distribution function. In addition, in the case of H-D mixtures, the same populations exist for both hydrogen and deuterium. For illustration purposes, as shown in Figure 1, the profiles of the Balmer-α line emitted by the population have a Maxwellian velocity distribution function (VDF) with a temperature of ~3 eV where hydrogen represents 5% and deuterium represents 95%. The chosen temperature roughly represents neutrals released through dissociation of H2 and D2 molecules in a tokamak. Detailed information about recycling and the different populations of neutrals in magnetic fusion devices can be found for instance in References [7,8,9].
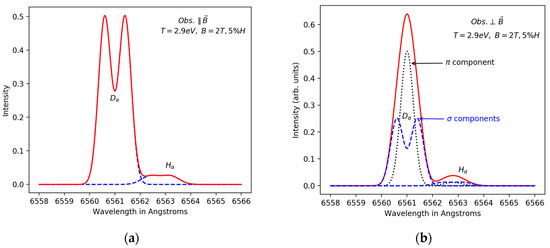
Figure 1.
Theoretical profiles of the Balmer-α line emitted by neutrals distributed as 5% of hydrogen and 95% of deuterium atoms, having the same Maxwellian velocity distribution with a temperature of ~3 eV in a plasma where the magnetic field B = 2 T. The Dα/Hα line centers are separated by ~1.8 Å and the Doppler broadening of the Hα is higher than that of the Dα line because of its lower mass. (a) Parallel observation: Only the lateral σ components are seen; (b) perpendicular observation: Both the lateral σ and central π components are shown.
A more complex situation is presented in Figure 2 where a second neutral population with a Maxwellian VDF corresponding to a neutral temperature of ~20 eV is added to the one shown in Figure 1. This temperature is an approximation of that of the population of neutrals released through reflection followed by a complete thermalization process due to elastic collisions with plasma ions. Note that this is different from the population of neutrals resulting from a charge exchange process whose temperature is in principle much higher depending on the ion temperature at the location where the charge exchange process takes place. For simplicity, equal contributions to the Balmer-α line from the two neutral populations for both hydrogen and deuterium has been assumed. However, for real situations, where experimental spectra of this line measured in tokamaks are analyzed, generally the three neutrals populations are necessary. The fitting procedures allow us to obtain their temperatures and their relative proportions or contributions, and this is a rather delicate task. For this refer to References [7,8,9] or to a more recent reference [10], where the fitting is explicitly used to obtain the isotopic ratio H/(H + D).
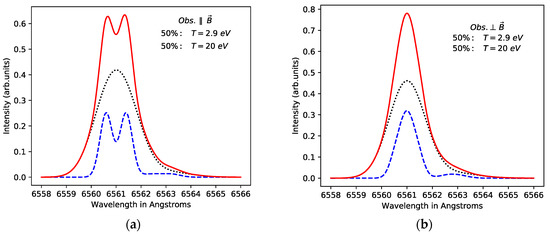
Figure 2.
Total profiles (solid red line) of the Hα/Dα line resulting from two neutral populations with equal concentrations but different temperatures: 2.9 eV (blue dashed line) and 20 eV (black dotted line) for B = 2T. A fraction of 5% hydrogen is considered here. (a) Parallel observation; (b) perpendicular observation.
3. The High-n Balmer Lines and Continuum
As mentioned previously, under detachment conditions, i.e., for recombining plasma conditions, e.g., for ne = 1014 cm−3 and Te = 1 eV, high-n lines of the Balmer series as well as the continuum radiation can be emitted by hydrogen or deuterium neutrals in divertors of tokamaks. This radiation can therefore be observed and recorded to be used further for divertor diagnostics. The corresponding spectra can allow the extraction of very useful information. Indeed, high-n lines of the Balmer series are very sensitive to Stark broadening and allow us to infer the plasma electron density of the emissive zone. On the other side, the use of the relative intensities of several lines of this series or the continuum slope allow for electron temperature determination. Of course, the determination of these parameters requires the use of theoretical models for line broadening and line shapes retaining all the broadening mechanisms, or at least the major ones. It is therefore necessary to model spectra of both lines and continuum radiation. However, as the Stark broadening increases with the upper quantum number n, beyond a given value called the Inglis-Teller limit [11], adjacent lines overlap and eventually merge into the continuum part of the spectrum leading to an apparent advance of the continuum. One should note that even if this transition region between lines and continuum is not usually used for diagnostics, it should be modelled to obtain a whole or complete spectrum. Therefore, it is clear that from the diagnostic point of view, this discrete-to-continuum transition region is not important. However, from the point of view of synthetic diagnostics which are very important for future devices because of their predictive abilities, the spectrum as a whole plays a very important role and each part is necessary. This is one of the reasons to model a quasi-complete spectrum of the Balmer series say from the Hγ (n = 5) or Hδ (n = 6) to the theoretical Balmer series limit () and beyond. We present here briefly the background related to the spectra.
3.1. Modeling of the Bound–Bound Transitions
The high-n Balmer lines emitted by hydrogen in a typical recombining plasma are mainly broadened by the Stark effect. The Zeeman effect may be neglected except for a few lines at relatively low densities. The theory of Stark broadening is well established and there exists many codes (either models or numerical simulations) dealing with this. For the calculations shown here, we have used the PPP line shape code [12,13]. For the Stark broadening calculations, a collisional approach known as the impact approximation is used for the plasma electrons contribution while a quasi-static one is used to treat the ion contribution. More precisely, the electronic contribution is calculated using the Griem-Blaha-Kepple GBK model [14] taking into account the frequency dependence of the electronic operator. High order broadening contributions to line broadening such as interference terms in the collision operator and non-binary effects are neglected for the high-n Balmer lines emitted under detachment plasma conditions. For a given transition between levels i and j (j→i) corresponding to a frequency ν, the intensity is calculated following the expression:
where is the Einstein coefficient of the corresponding transition, the population of the upper level j of the transition and the normalized line shape. The profiles of some Balmer lines are shown in Figure 3a.
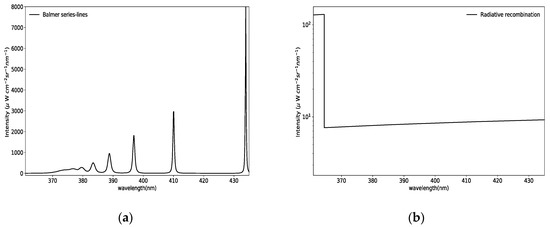
Figure 3.
(a) Calculated profiles of some Balmer lines are calculated from n = 5 up to level n = 15 and are summed up together for the plasma condition ( = and = 1.1 eV). (b) Radiative recombination calculation for the same plasma conditions for an isolated atom.
3.2. Modeling of the Continuum Radiation
The continuum radiation results from two types of transitions: Bound-free and free-free contributions. For the typical plasma conditions considered here, the radiation due to free-free transitions, known as bremsstrahlung, is negligible in comparison with that due to bound-free transitions. Therefore, for illustration purposes, only the bound-free contribution is retained in the calculations shown here. However, for the complete calculations all contributions are included. The free-bound radiative recombination power density can be written as:
where is the ion density, h is the Planck constant, is the electron velocity, f(ε) is the energy distribution function of free electrons and is the cross-section for the recombination process [15]. Here p designates the bound state (p = 2, 3, …). The cross-section, is obtained using Milne’s formula [15], from its relation with the photoionization cross section for the level p, . The expression can be rewritten for the transition to an energy level p, for a Maxwell-Boltzmann electron energy distribution, as:
where k is the Boltzmann constant, the electron mass, c the speed of light and the ionization potential for level p. The total free-bound contribution is obtained by additions all the contributions from free states to bound states p = 2, 3, …, as follows:
Since the continuum is dominated by Balmer radiative recombination (p = 2) and higher (p > 2) radiative recombination contributions are decreasing with increasing p, higher radiative recombination can be neglected. Here we have calculated the contributions up to an energy level of p = 10. The resulting calculation is shown in Figure 3b. Note that the bound-free continuum power density shown here was calculated without taking into account any plasma density effect but for a hypothetical isolated atom, hence the sharp transition seen at the series limit which comes from the recombination threshold.
3.3. The Total Spectrum and the Dissolution Approach
To obtain the total spectrum, one should also deal with the discrete-to-continuum transition to combine bound–bound and free–bound contributions. Here we use a dissolution factor approach as discussed in References [16,17] to take into account the merging of lines into the continuum. This method, which is also known as the occupation probability formalism (OPF) [16], is based on two simple suggestions: (i) The potential barrier of the atom is altered by the electric field which adds to the Coulombian field of interaction of the external electron with the core of the atom. For electric microfields exceeding a certain critical value that corresponds to a level above the potential barrier, the energy of that level vanishes. This means that some bound-bound transitions transform partially or totally to free-bound transitions by conserving the oscillator strength density. The probability of energy level j, realization is called the ‘dissolution factor’ and it is given by:
where P(F) is the micro field distribution calculated using [18]. Based on the second suggestion, the radiative recombination continuum should be multiplied with () to conserve the oscillator strength density. By using an approach like this one, one can take into account the density effect on the atom energy levels. Indeed, with increasing electron densities, the model of the isolated atom becomes less and less valid. The charged particles surrounding the neutral emitter (hydrogen atom) strongly disturb the structure (energy levels and wave functions) of the latter. The dissolution approach states simply that for a given electron density, atomic energy levels which are discrete for an isolated atom cannot be considered as discrete or bound but a combination of free and bound states. A level observed in a pure discrete or bound state has a realization probability of one. In contrast, a level in a pure free state has a realization probability of zero. Note that in the previous expression, j stands for both discrete and continuum states. Numerically speaking, in the emission spectrum calculation, the recombination contribution is extended into lines and dissolution factors are applied at corresponding positions and interpolated. Each line is multiplied by its probability of realization at its upper energy level of the transition and the sum over the line is shown in Figure 4a. Summing up all the contributions together will result in the complete Balmer spectrum calculation as shown in Figure 4b. One can see on this figure that the apparent advance of the continuum which starts at about instead from the theoretical value of 346.6 nm.
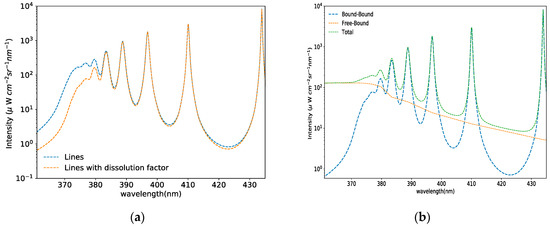
Figure 4.
(a) Density effect (dissolution factor approach) on the Balmer lines as computed for = and = 1.1 eV. (b) Total spectrum for the same plasma conditions.
4. Discussion and Conclusions
We have shown how the Balmer-α line emission spectra emitted by hydrogen and its isotopes in the peripheral regions of magnetic fusion devices allow the determination of an important quantity: The isotopic ratio. This quantity is crucial for the D-T experiments as the tritium concentration is tightly controlled and should not exceed some value for safety reasons. Of course, the quality of the results depends strongly on both the measurements and on the accuracy of the modeling. In particular, modeling should account for all or at least the major broadening mechanisms as well as the inclusion of all the populations of hydrogen/deuterium neutrals. On the other side, we have seen the spectra of high-n Balmer lines extending to the series limit or beyond it. This can be seen for conditions relevant to recombining plasmas characterized by typical electron densities in the range 1014–1015 cm−3 and electron temperatures of the order of 1–2 eV. We have mentioned that such spectra can serve for plasma diagnostics. Indeed, comparing such spectra to experimental ones recorded along a given line of sight (LOS) allows the determination of the average electron density along the LOS from the Stark broadening of the discrete lines (bound-bound transitions). The average electron density can also be obtained from the comparison calculated and measured line intensities. However, modeling of such spectra can become more useful by extending its utility beyond diagnostics and using it also for predictive purposes: This is the role of synthetic diagnostics. The modeling presented here is now ready to be coupled to other simulation tools providing plasma parameter spatial distributions for calculating total spectra using these spatial distributions. The theoretical spectra calculated in this way take into account any inhomogeneity of the plasma emission zone along the considered line of sight. The first results of such synthetic spectra considered as synthetic diagnostics will be published elsewhere [19] for conditions relevant to WEST tokamak by using distributions provided by a numerical transport code SolEdge2D-Eirene [20].
Author Contributions
Equal contributions. Spectral calculations of the Balmer series of hydrogen were carried out by R.R.S. Calculations concerning the Ha/Da spectra were done by M.K. Writing of the draft and preparation done by M.K. R.R.S. wrote parts related to synthetic Balmer spectra.
Funding
This research received funding from EUROfusion WPEDU, MST1 and JET1.
Acknowledgments
This work has been carried out within the framework of the EUROfusion Consortium. The views and opinions expressed herein do not necessarily reflect those of the European Commission.
Conflicts of Interest
The authors declare no conflict of interest.
References
- Pigarov, A.Y.; Terry, J.L.; Lipschultz, B. Study of the discrete-to-continuum transition in a Balmer spectrum from Alcator C-Mod divertor plasmas. Plasma Phys. Control. Fusion 1998, 40, 2055–2072. [Google Scholar] [CrossRef]
- Krasheninnikov, S.I.; Kukushkin, A.S.; Pshenov, A.A. Divertor plasma detachment. Phys. Plasmas 2016, 23, 055602. [Google Scholar] [CrossRef]
- Loarte, A.; Monk, R.; Martin-Solis, J.; Campbell, D.; Chankin, A.; Clément, S.; Davies, S.; Ehrenberg, J.; Erents, S.; Guo, H.; et al. Plasma detachment in JET Mark I divertor experiments. Nucl. Fusion 1998, 38, 331–371. [Google Scholar] [CrossRef]
- Field, A.R.; Balboa, I.; Drewelow, P.; Flanagan, J.; Guillemaut, C.; Harrison, J.R.; Huber, A.; Huber, V.; Lipschultz, B.; Matthews, G.; et al. Dynamics and stability of divertor detachment in H-mode plasmas on JET. Plasma Phys. Control. Fusion 2017, 59, 095003. [Google Scholar] [CrossRef]
- Potzel, S.; Wischmeier, M.; Bernert, M.; Dux, R.; Müller, H.; Scarabosio, A. A new experimental classification of divertor detachment in ASDEX Upgrade. Nucl. Fusion 2013, 54, 13001. [Google Scholar] [CrossRef]
- Potzel, S.; Dux, R.; Müller, H.W.; Scarabosio, A.; Wischmeier, M. Electron density determination in the divertor volume of ASDEX Upgrade via Stark broadening of the Balmer lines. Plasma Phys. Control. Fusion 2014, 56, 025010. [Google Scholar] [CrossRef]
- Kubo, H.; Takenaga, H.; Sugie, T.; Higashijima, S.; Suzuki, S.; Sakasai, A.; Hosogane, N. The spectral profile of the Ha line emitted from the divertor region of JT-60U. Plasma Phys. Control. Fusion 1998, 40, 1115. [Google Scholar] [CrossRef]
- Koubiti, M.; Marandet, Y.; Escarguel, A.; Capes, H.; Godbert-Mouret, L.; Stamm, R.; De Michelis, C.; Guirlet, R.; Mattioli, M. Analysis of asymmetric Dα spectra emitted in front of a neutralizer plate of the Tore-Supra ergodic divertor. Plasma Phys. Control. Fusion 2002, 44, 261. [Google Scholar] [CrossRef]
- Hey, J.; Chu, C.C.; Mertens, P.H.; Brezinsek, S.; Unternberg, B. Atomic collision processes with ions at the edge of magnetically confined fusion plasmas. J. Phys. B 2004, 37, 2543. [Google Scholar] [CrossRef]
- Neverov, V.S.; Kukushkin, A.B.; Stamp, M.F.; Alkseev, A.G.; Brezinsek, S.; von Hellermann, M.; JET contributors. Determination of divertor stray light in high-resolution main chamber Ha spectroscopy in JET-ILW. Nucl. Fusion 2017, 57, 016031. [Google Scholar] [CrossRef]
- Inglis, D.R.; Teller, E. Ionic depression of series limits in one electron spectra. Astrophys. J. 1939, 90, 439. [Google Scholar] [CrossRef]
- Calisti, A.; Mossé, C.; Ferri, S.; Talin, B.; Rosmej, F.; Bureyeeva, L.A.; Lisitsa, V.S. Dynamic Stark broadening as the Dicke narrowing effect. Phys. Rev. E 2010, 81, 016406. [Google Scholar] [CrossRef] [PubMed]
- Ferri, S.; Calisti, A.; Mossé, C.; Rosato, J.; Talin, B.; Alexiou, S.; Gigosos, M.A.; González, M.A.; González-Herrero, D.; Lara, N.; et al. Ion Dynamics Effect on Stark-Broadened Line Shapes: A Cross-Comparison of Various Models. Atoms 2014, 2, 299–318. [Google Scholar] [CrossRef]
- Griem, H.; Blaha, M.; Kepple, P. Stark profile clacultaions for Lyman series lines of one electron ions in dense plasmas. Phys. Rev. A 1979, 19, 2421. [Google Scholar] [CrossRef]
- Goto, M.; Sakamoto, R.; Morita, S. Experimental verification of complete LTE plasma formation in hydrogen pellet cloud. PPCF 2007, 49, 1163. [Google Scholar] [CrossRef]
- D’yachkov, L.G. Smooth transition from spectral lines to a continuum in dense hydrogen plasma. High Temp. 2016, 54, 5. [Google Scholar] [CrossRef]
- Stehle, C.; Jacquemot, S. Line shape in hydrogen opacities. Astron. Astrophys 1993, 271, 348. [Google Scholar]
- Iglesias, C.A. Electronic microfield distributions in strongly coupled plasmas. Phys. Rev. A 1983, 28, 1168. [Google Scholar] [CrossRef]
- Sheeba, R.R.; Koubiti, M.; Calisti, A.; Ferri, S.; Marandet, Y.; Rosato, J.; Stamm, R. Synthetic diagnostics based on hydrogen Balmer series in recombining plasmas for WEST tokamak. High Density Energy Phys. 2019. to be submitted to High Energy Density Physics. [Google Scholar]
- Bufferand, H.; Ciraolo, G.; Marandet, Y.; Bucalossi, J.; Ghendrih, P.; Gunn, J.; Mellet, N.; Tamain, P.; Leybros, R.; Fedorczak, N.; et al. Numerical modeling for divertor design of the WEST device with a focus on plasma-wall interactions. Nucl. Fusion 2015, 55, 053025. [Google Scholar] [CrossRef]


© 2019 by the authors. Licensee MDPI, Basel, Switzerland. This article is an open access article distributed under the terms and conditions of the Creative Commons Attribution (CC BY) license (http://creativecommons.org/licenses/by/4.0/).