Article

Charge-Exchange Emission from Hydrogen-Like Carbon Ions Colliding with Water Molecules

by
Dennis Bodewits
1,* and
Ronnie Hoekstra
2,3
1
Physics Department, Auburn University, Allison Laboratory, Auburn, AL 36849, USA
2
Zernike Institute for Advanced Materials, University of Groningen, Nijenborgh 4, 9747 AG Groningen, The Netherlands
3
Advanced Research Center for Nanolithography, Science Park 110, 1098 XG Amsterdam, The Netherlands
*
Author to whom correspondence should be addressed.
Atoms 2019, 7(1), 17; https://doi.org/10.3390/atoms7010017
Submission received: 14 January 2019 / Revised: 27 January 2019 / Accepted: 29 January 2019 / Published: 1 February 2019

Abstract

:
Absolute Extreme Ultraviolet emission cross-sections have been measured for collisions between C 5 + and H 2 O in the range of 0.113 to 3.75 keV/amu (170–979 km/s). These results are used to derive velocity-dependent triplet-to-singlet ratios and emission cross-sections of the Cv K-series following single-electron capture. Comparison with existing measurements of integral charge-changing cross-sections indicates that auto-ionizing multi-electron capture is a significant reactions channel. This reaction may indirectly populate the n = 2 states and thus add strength to the K α emission of Cv ions thereby co-determining the hardness ratio of K-series emission of Cv.

1. Introduction

Charge exchange occurs anywhere a hot plasma meets a colder gas [1]. It is a temperature-dependent and highly state-selective process and its subsequent line emission very suitable as a diagnostic tool. While charge-exchange emission has long been widely applied to study plasmas in the lab (such as fusion research), its astrophysical manifestation was first discovered in comets [2,3]. In astrophysical environments, charge-exchange emission is characterized by strong forbidden lines from helium-like ions. The relative strengths of the forbidden, resonance, and intercombination lines following charge exchange are distinctly different from those due to other excitation mechanisms [4,5]. Charge-exchange emission (CXE) has since been observed in planetary atmospheres [6,7,8], the geocorona [9,10], supernova remnants [11,12], and star-forming regions [13]. Several small spacecraft are being planned or developed to monitor the Earth’s magnetosphere through solar-wind charge-exchange emission [14].
Comets emit X-rays when highly charged ions in the solar wind interact with neutral molecules in the coma. This emission has been used to determine properties such as the velocity, composition, and freeze-in temperature of the solar wind (cf. [15,16,17,18,19]), to identify and map plasma interaction structures [20], and to determine the distribution and composition of the neutral gas [10,21,22]. For this it is essential to have reliable predictions of the induced line-emission spectra which requires accurate state-resolved electron-capture cross-sections. To generate synthetic X-ray K-series spectra of hydrogen-like ions such as Cv and Ovii, a triplet-to-singlet population ratio of 3:1 is generally assumed. However, preliminary theoretical results suggested a strong velocity dependence of the Ovii triplet-to-singlet ratio for electron capture from helium [22,23]. The long lifetimes of 2 metastable states populated by cascades from higher lying states directly populated by electron-capture make it very difficult, if not impossible, to measure the resulting K α emission in laboratory experiments. For example, in Cv the 2 3 S state has a lifetime of 20 ms in [5,24] implying that at typical solar-wind velocities, the ions would cover on average a distance in the order of 10 km.
Here, we present crossed-beam measurements of cross-sections of Extreme Ultraviolet (EUV) emission following electron capture by one of the most abundant H-like ions in the solar wind, C 5 + , colliding with H 2 O, the most abundant molecule in the inner coma of most comets [25]. Based on those cross-sections, the velocity dependence of the ratio between population of specific 3 and 4 triplet and singlet terms of Cv ions is assessed and discussed. Finally, associated hardness ratios for the Cv K-series emission are determined and compared to theoretical predictions.

2. Methods

2.1. Photon Emission Spectroscopy

The experimental crossed-beam set up was hosted at the Nuclear Accelerator Institute (KVI) at the University of Groningen. Details of the set up can be found in our previous publications [16,26]. In brief, ions produced by an Electron Cyclotron Resonance Ion Source (ECRIS) are guided through a neutral gas jet in this case water molecules. Collision velocities could be controlled by floating the collision region on (high) voltage. In this way the standard energy range of the projectile C 5 + ions of 15–150 keV could be lowered to 1.5 keV. The ions enter the collision region via a multi-element ion optics system. We monitored the ion current using a Faraday cup. Photons emitted during the ions’ relaxation cascades were observed with a 1.5 m grazing incidence spectrometer equipped with a position sensitive multichannel plate with a wavelength bite of about 15 nm. The spectrometer can cover a range of 5–80 nm in wavelength with a resolution of 0.3 nm FWHM. All spectra were analyzed by fitting Gaussian-shaped peaks to the data. The resulting photon yields were converted to absolute emission cross-sections by comparison to He 2 + + H 2 O line emission in the 25–30 nm spectral range for which emission cross-sections are well-established [26,27].

2.2. Uncertainties

The results are subject to several uncertainties. The dominating absolute uncertainty is that arising from the spectrometer’s wavelength-dependent sensitivity calibration. The wavelength range of 25 to 30 nm is absolutely calibrated by using He 2 + + H 2 O emission lines, and we estimate the uncertainty to be approximately 20% [26]. Extrapolation of the sensitivity to shorter wavelengths in the range of 15–30 nm introduces an additional uncertainty, which we estimate to be of the order of 15%. Added in quadrature these uncertainties lead to an absolute systematic uncertainty of 25% for wavelengths below 20 nm. The uncertainty associated with the wavelength-dependent sensitivity by itself may influence the relative line strengths which are of importance when assessing cascade contributions. Target density fluctuations were controlled by performing regular calibration measurements, but lead to a random error in the order of 5%. Statistical errors for these experiments were small due to high photon yields and never exceeded 1% (1 σ ). Therefore we assume a relative uncertainty of 10% in the line-emission cross-sections.

3. Results

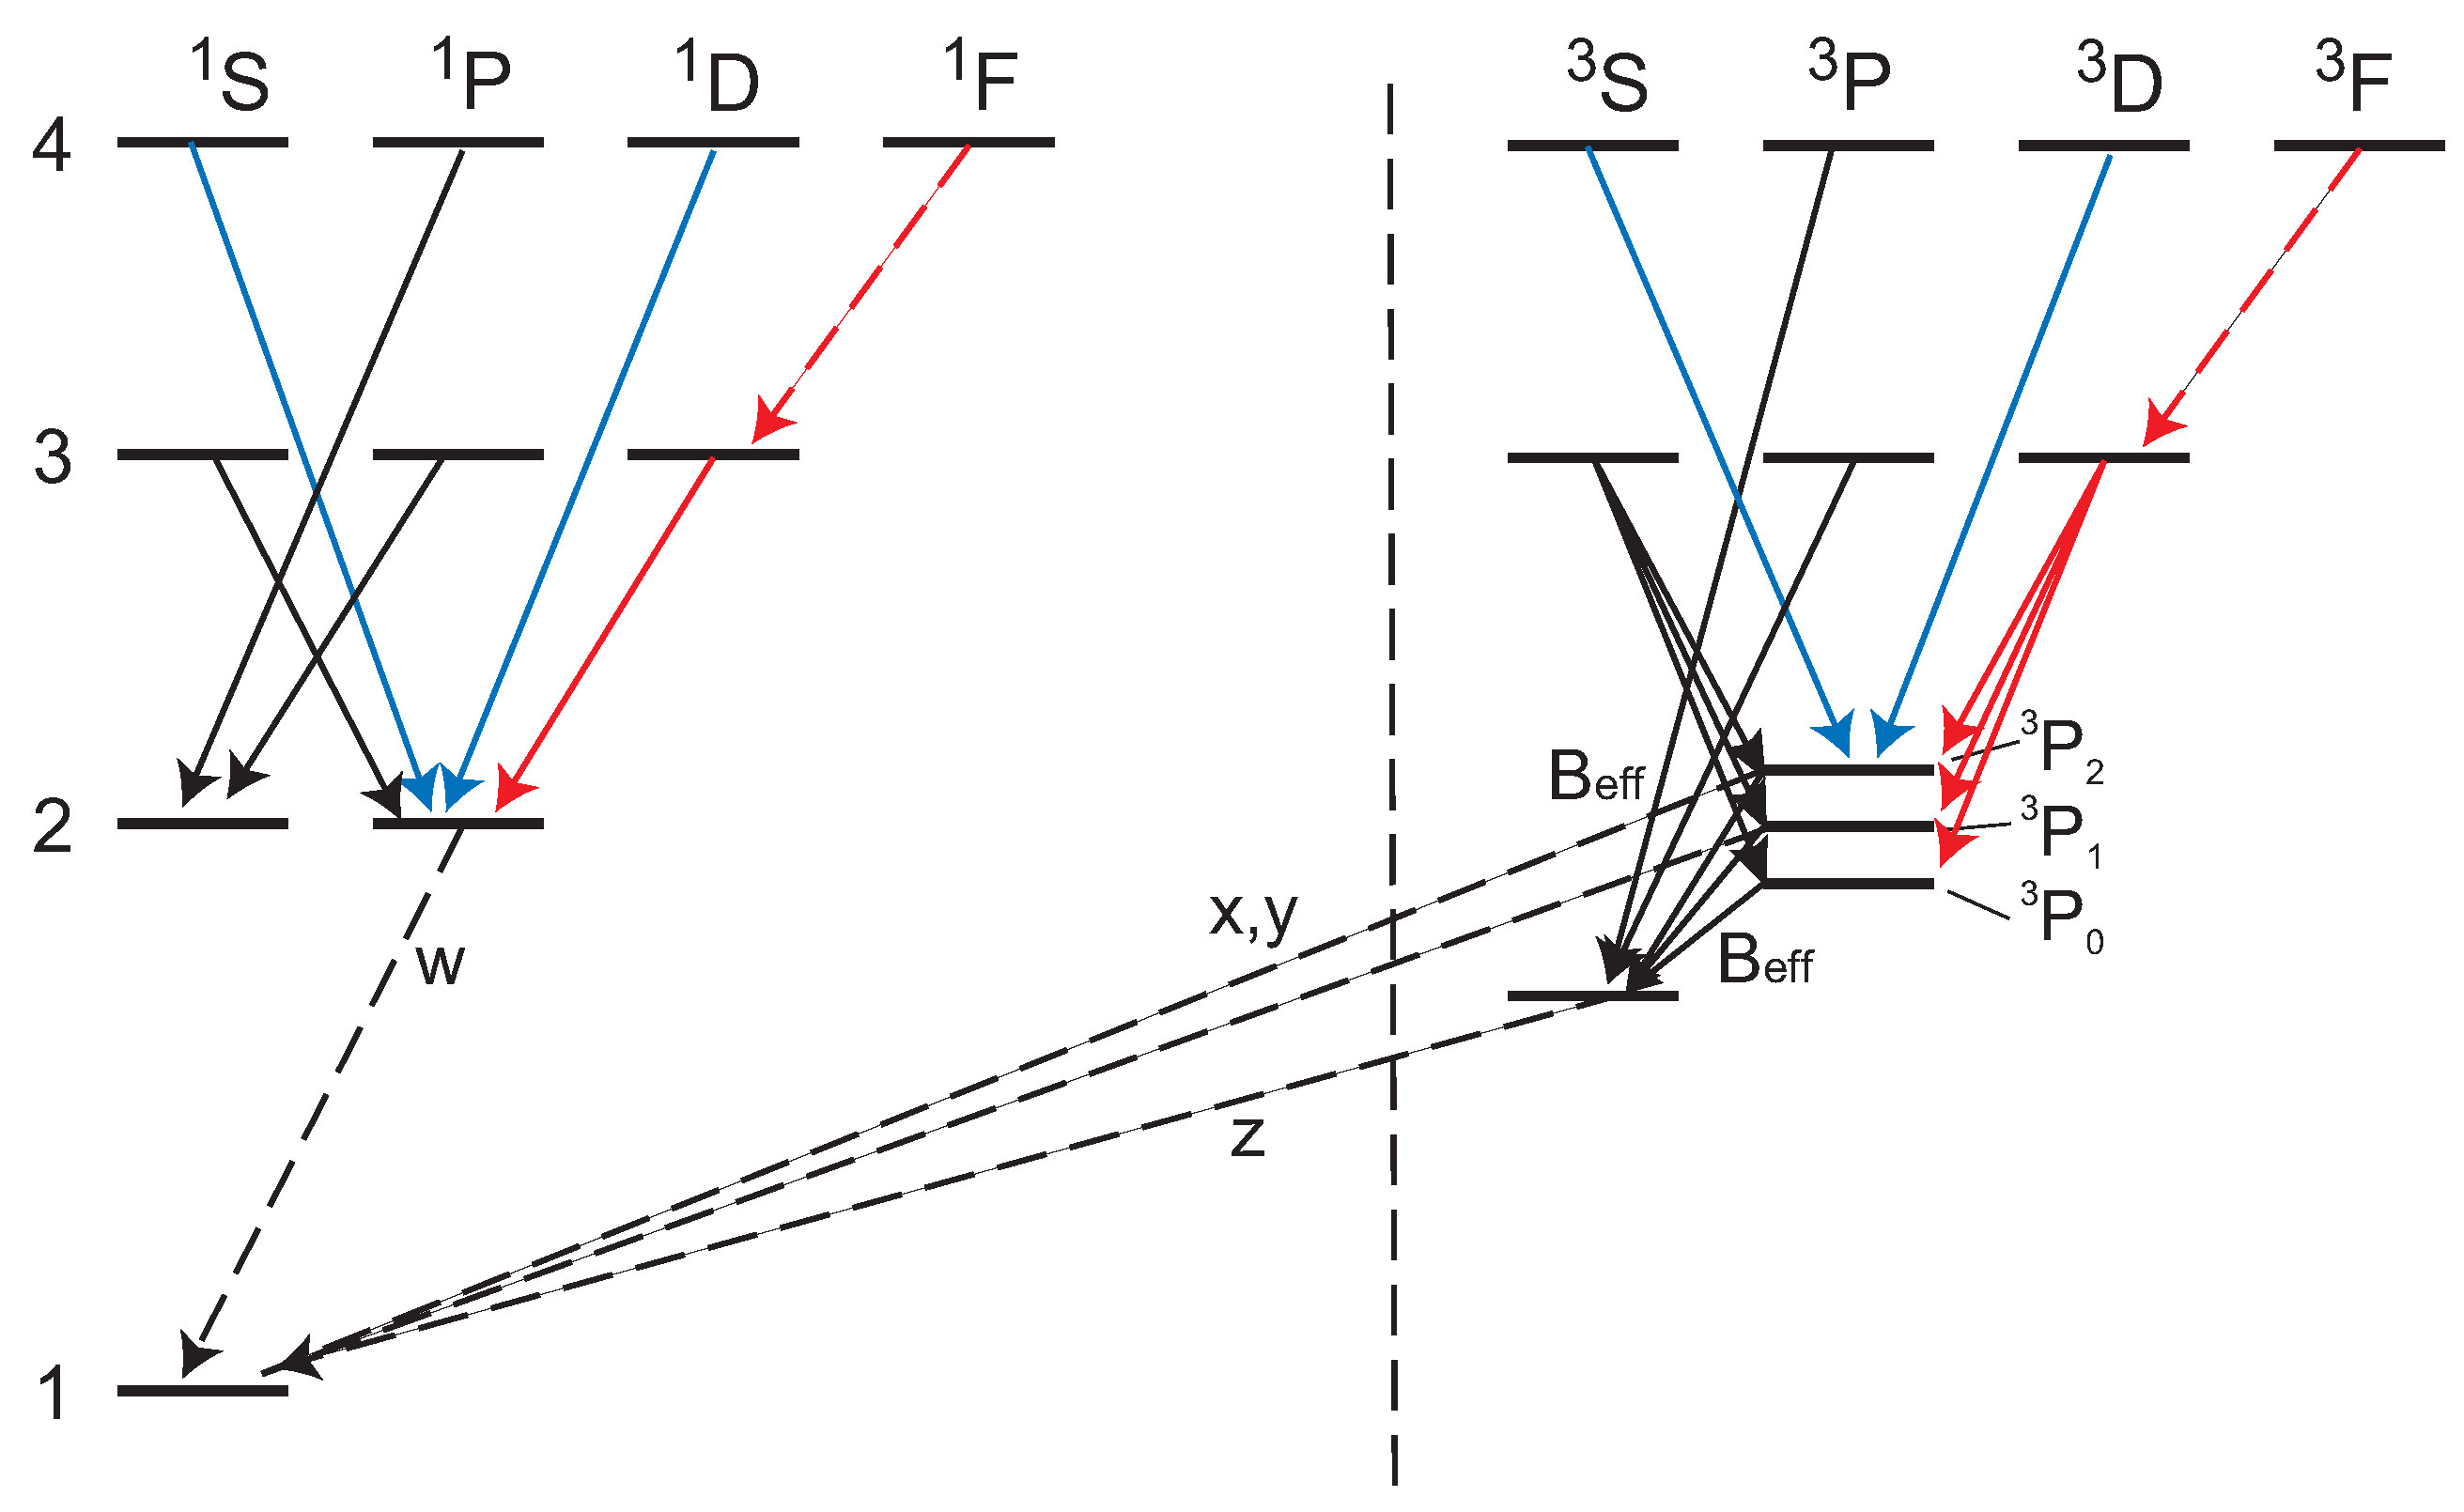
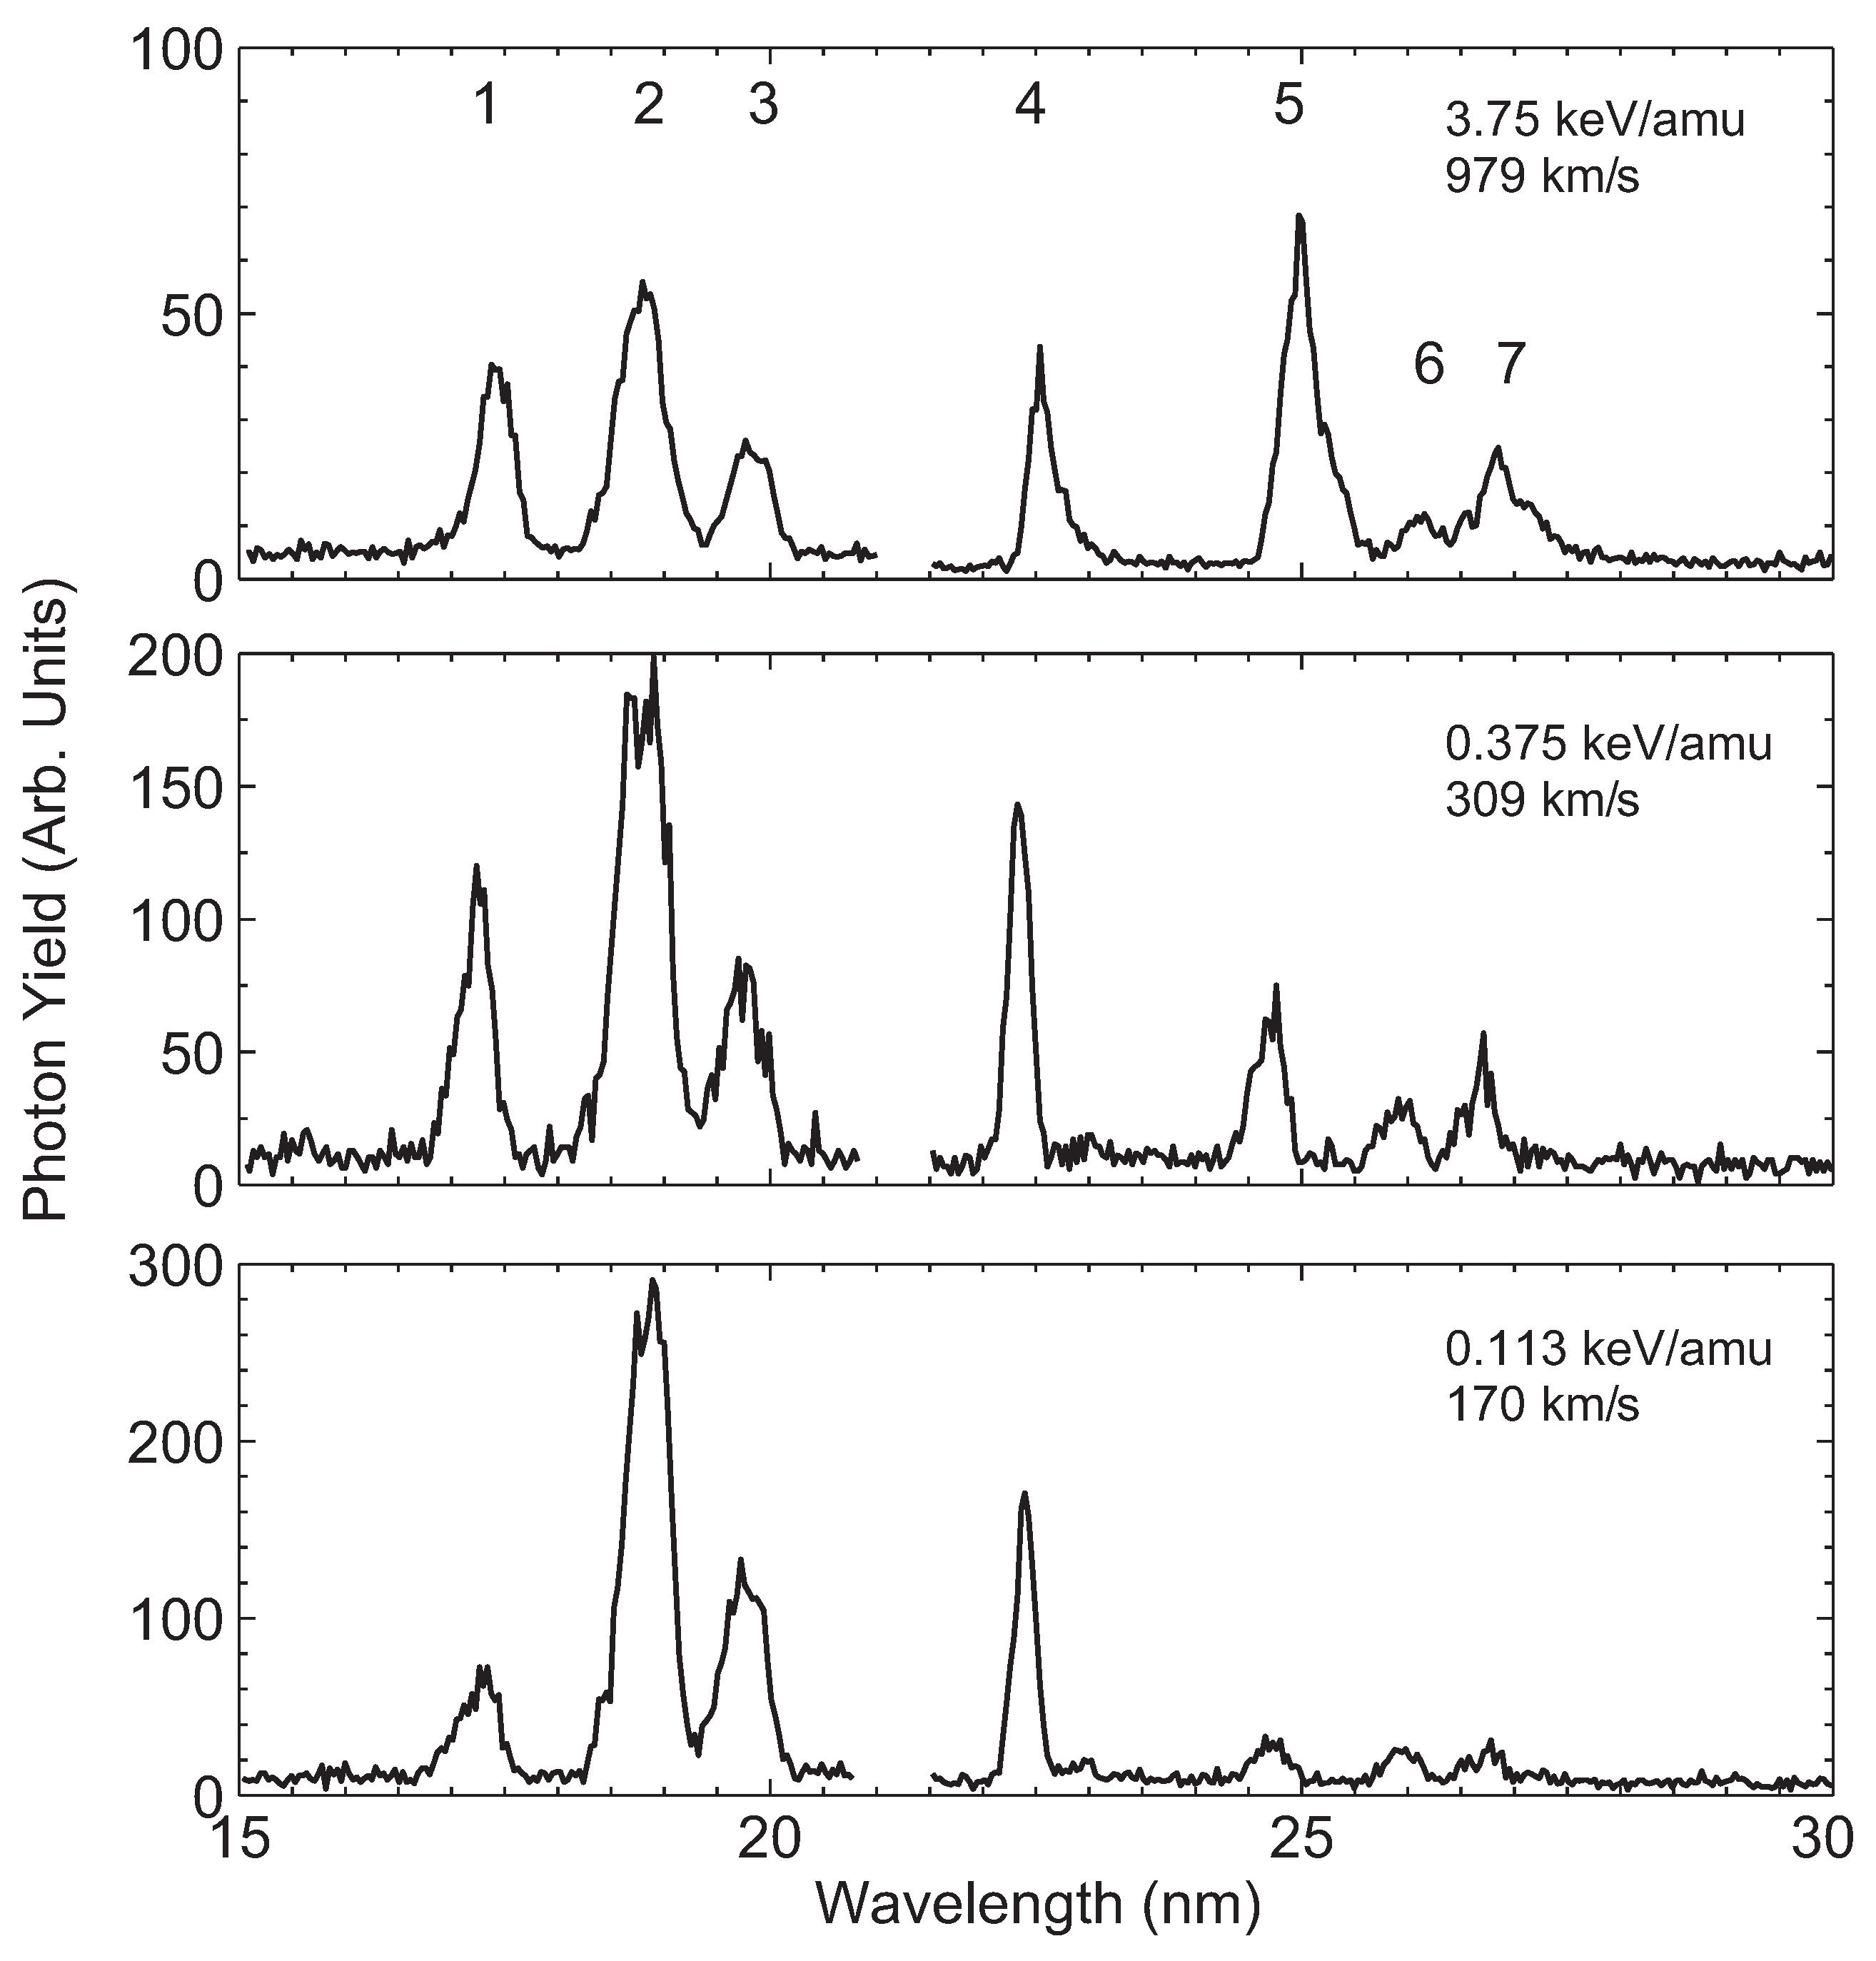
3.1. Cv EUV Line-Emission Spectra

Single electron capture by C 5 + from H 2 O can near-resonantly populate the n = 4 shell in Cv [28], and given the large energy separations to n = 3 and n = 5 predominantly 4 1 , 3 L terms will be populated. The population of the excited 4 terms results in complex relaxation cascades that produce many emission lines, cf. Figure 1. At the wavelengths covered by our spectrometer, we can only observe n = 4 2 transitions stemming from the charge exchange populated n = 4 shell. In addition, cascade-driven n = 3 2 transitions are detected.
EUV line-emission spectra for collisions of C 5 + with H 2 O are shown in Figure 2 for collision energies of 0.113, 0.375, and 3.75 keV/amu, corresponding to velocities of 170, 309, and 979 km/s, respectively. At the resolution of our spectrometer, 7 different emission features are apparent between 15–30 nm. Three of these features contain 2 or 3 transitions that cannot be resolved. The spectra clearly change with increasing velocity: at low velocity, emission features associated with n = 4 2 transitions (between 15–20 nm) dominate, with the strongest feature at 18.8 nm. The second strongest feature is the 3 3 P–2 3 S transition at 22.7 nm. At higher energies, the emission from the 4 2 transitions decreases and the feature at 24.8 nm, which includes the 3 3 D–2 3 P and 3 1 P–2 1 S transition, becomes the strongest feature in the spectrum. This is a signature of the well-known population shift towards higher angular momentum states with increasing energy. Here, for C 5 + ions, this means the population of the 4 f 3 F term. Its yrast cascade contributes fully to the 3 3 D–2 3 P transition making up the line at 24.8 nm line. There is no evidence for detectable emission from Cv n = 5 2 between 15.6–16.8 nm. The absence of Cv n = 5 2 emission is in line with the notion capture near-resonantly populates the Cv ( n = 4 ) shell. We do not detect Civ n = 4 2 emission at 24.5, 29.7, and 28.9 nm indicating that double collisions are insignificant. The line-emission cross-sections resulting from our spectral analysis are summarized in Table 1.

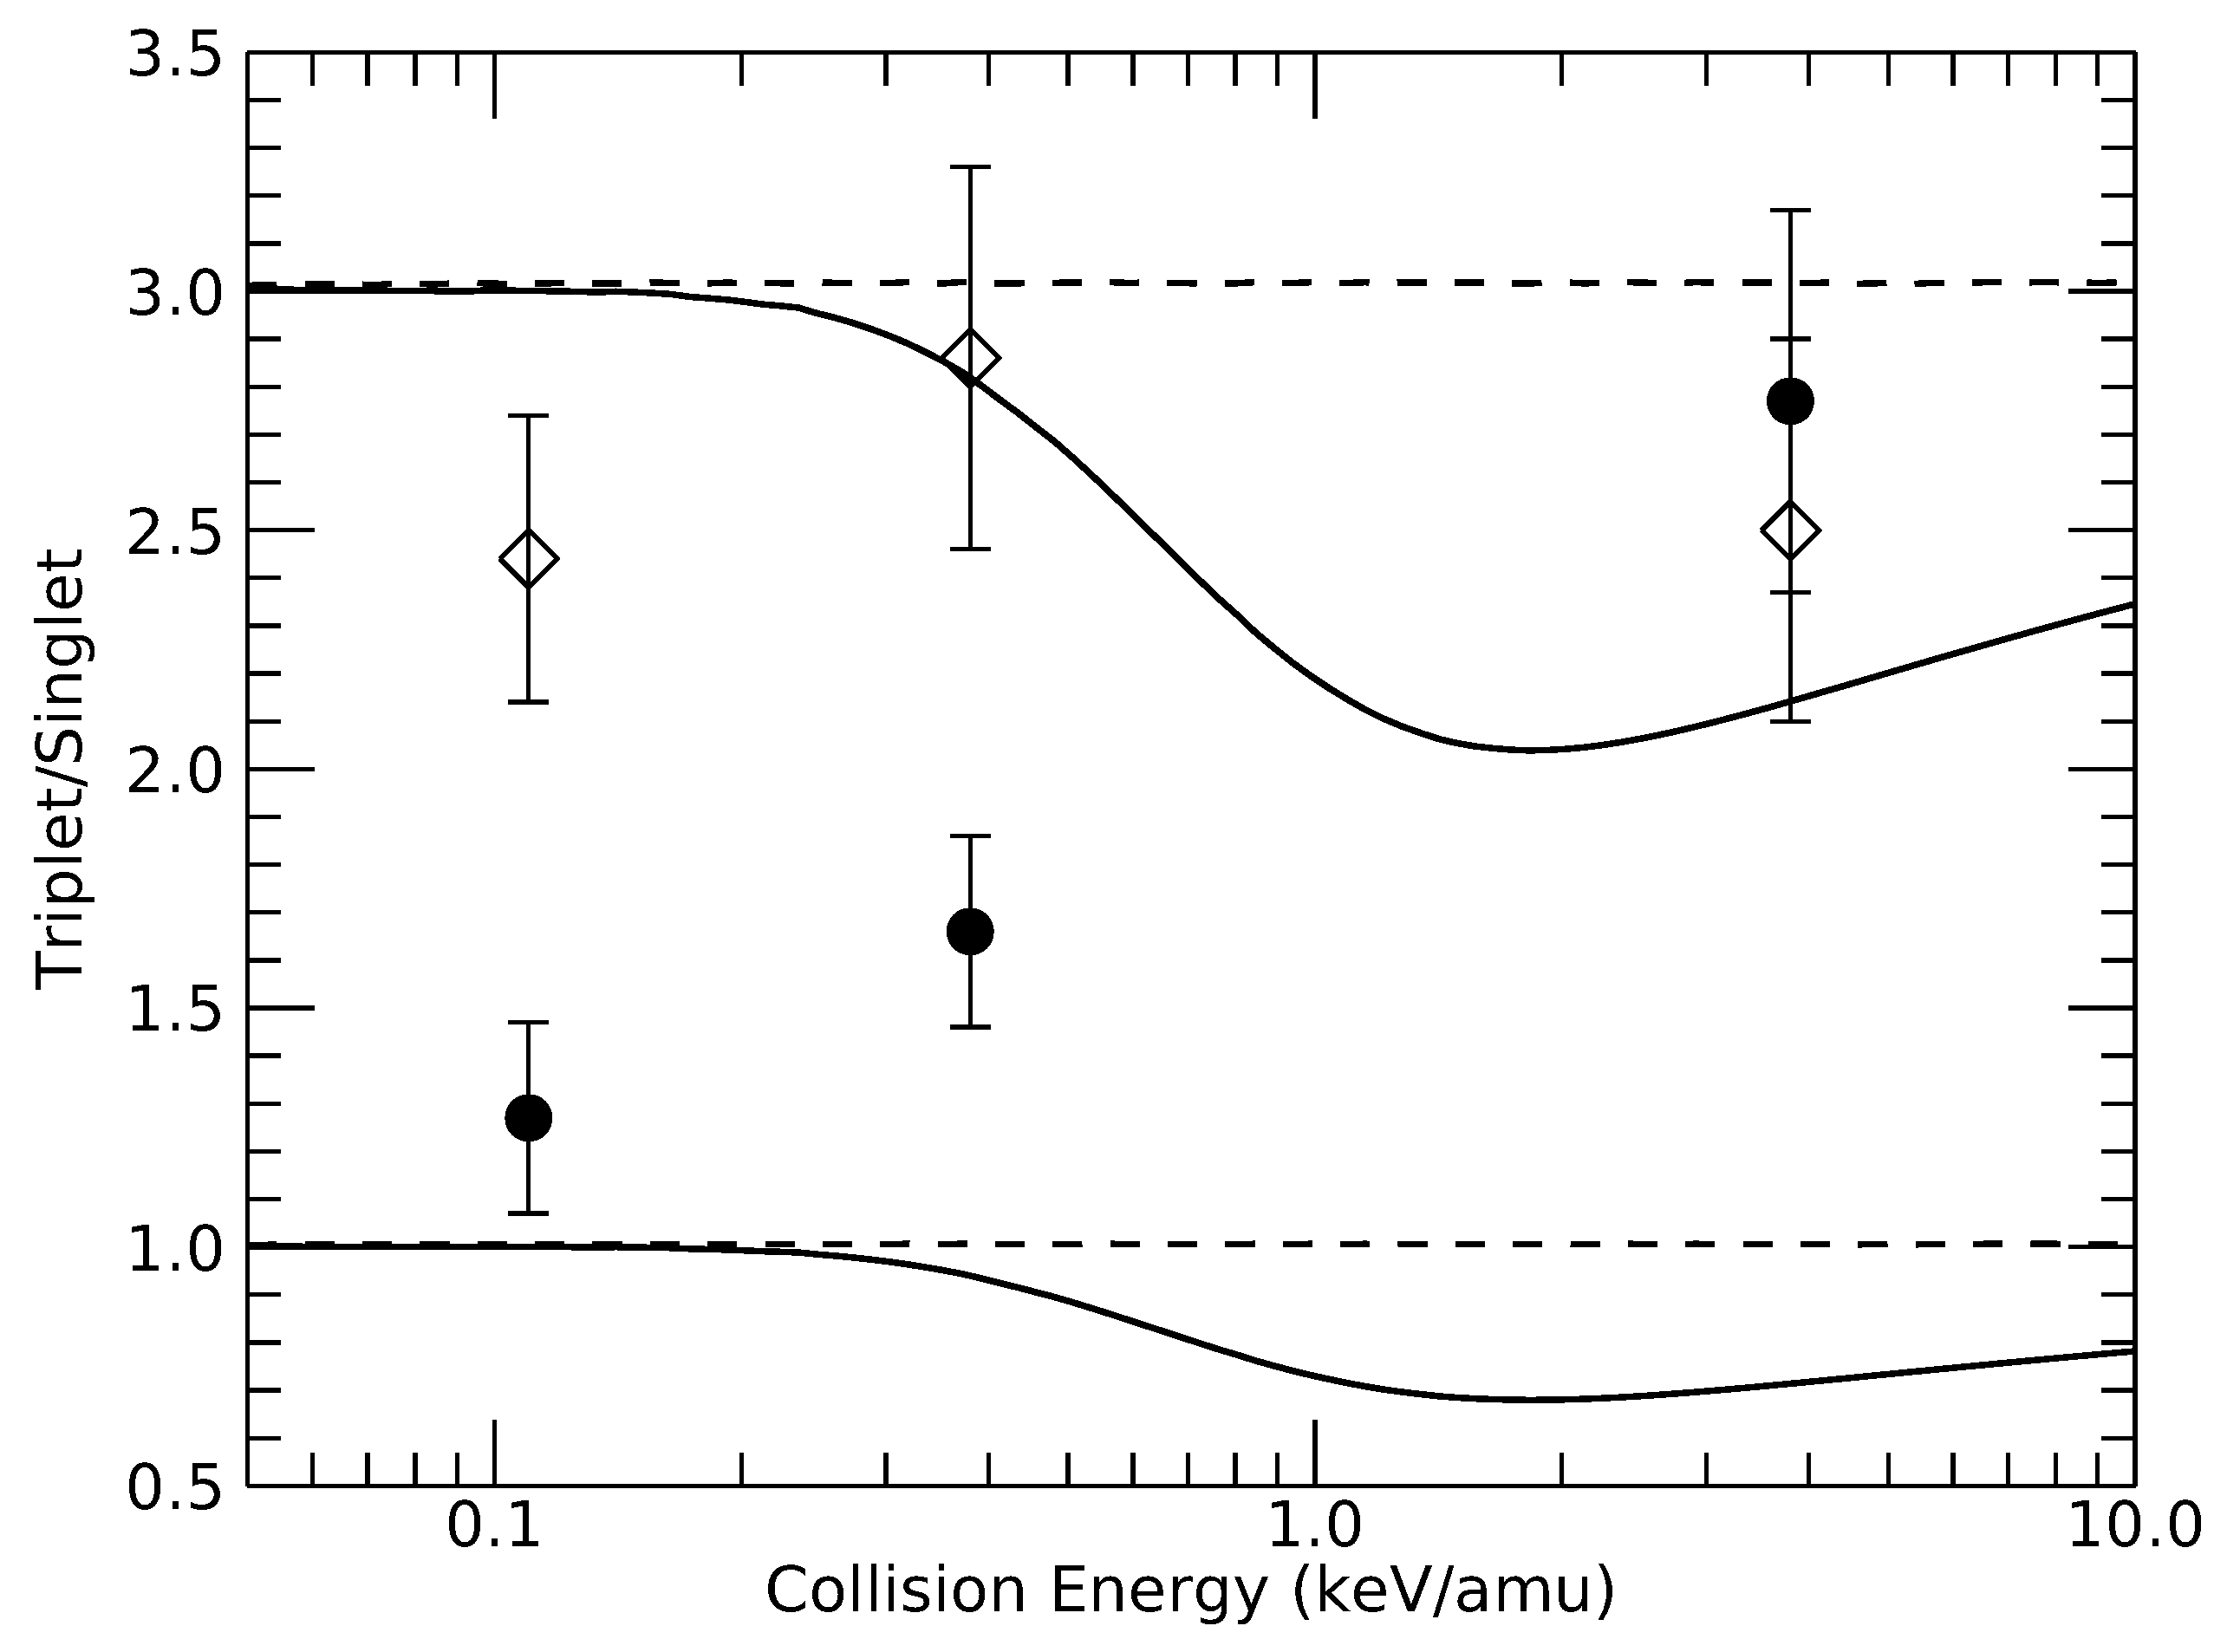
3.2. Triplet-to-Singlet Population

The observed emission lines provide two independent, direct measures of the triplet-to-singlet ratio: the ratio between the triplet and singlet 1 s 3 d 1 s 2 p transitions, T S 3 , and the ratio between the triplet and singlet 1 s 4 s , d 1 s 2 p transitions, T S 4 (see Figure 1). We derive T S 3 from the ratio between the state-selective capture cross-sections σ ( n ) into the 1 s 3 d and 1 s 4 f states in the triplet and singlet configurations:
T S 3 = σ ( 3 3 D ) + σ ( 4 3 F ) σ ( 3 1 D ) + σ ( 4 1 F )
To obtain the T S 3 ratio, the σ ( 3 3 D ) population cross-section should be corrected for cascade population from the (4 3 P)-state in the triplet system. The cascade contribution of the 4 1 P state to the 3 1 D is negligible. This transition has a very small branching ratio in the singlet system (0.003) as most decay will go straight to the 1 1 S ground state.
σ ( 3 3 D ) = σ em ( 24.8 nm ) 0.04 σ em ( 17.3 nm )
The second triplet-to-singlet ratio we can derive from our measurements is based on the emission cross-sections of the 1 s 4 d 1 s 2 p and the 1 s 4 s 1 s 2 p transitions:
T S 4 = σ em ( 18.8 nm ) σ em ( 19.8 nm )
The resulting singlet-to-triplet ratios are shown in Figure 3.

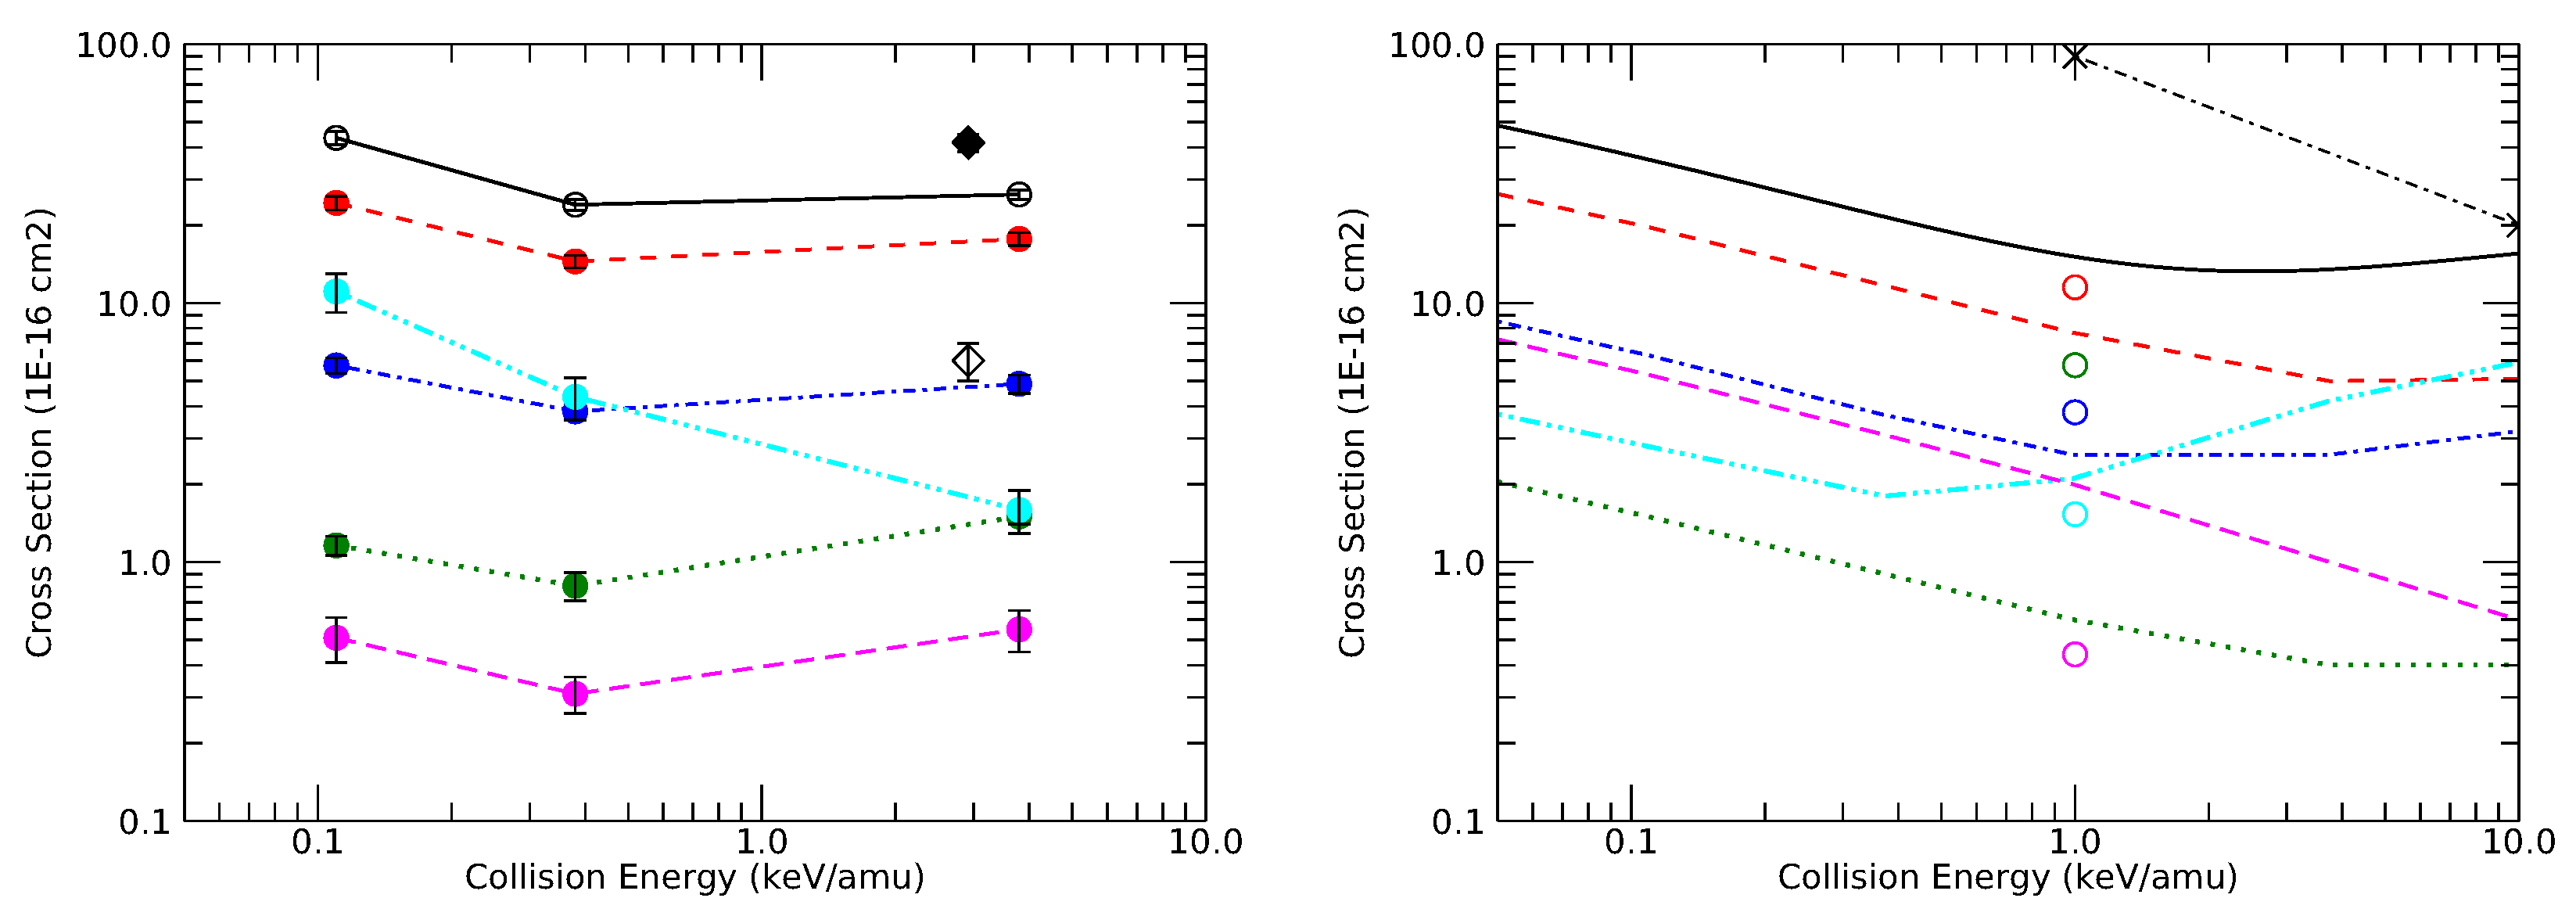
3.3. Emission Cross-Sections for the Cv K-series

Although the X-ray emission from K-series transitions is not detectable with our set up, we can use the observed EUV emission which feeds into the K-series to deduce emission cross sections for the K-series. To do this, we neglect the small contributions of the singlet 1 s n p 1 s 2 s transitions to the observed emission features. This is justified because the singlet 1 s n p 1 s 2 s transitions have very small branching ratios compared to transitions directly to the 1 s 2 1 S ground state (Figure 1); less than 0.06 for n = 3 , 4 . As mentioned in Section 3.1, inspection of the measured spectra (Figure 4) shows no appreciable traces of n = 5 2 transitions between 15.6–16.8 nm. It is, therefore, safe to assume that contributions from capture into the 5 s , 5 p , and 5 d states are negligible. This argument does not exclude significant population of 5 f and 5 g states, but those states do cascade into the transitions that we measure. If populated appreciably their contributions to the K-series X-ray emission are thus automatically included. Finally, we assume that the n -distribution is equal in the triplet and singlet systems.
We will first deduce the cascade population cross-sections σ of the 2 3 S and 2 3 P states from the measured emission cross-sections:
σ ( 2 3 S ) = σ em ( 17.3 nm ) + σ em ( 22.7 nm ) + 0.89 σ ( 2 3 P )
σ ( 2 3 P ) = σ em ( 18.8 nm ) + σ em ( 24.8 nm ) + 0.32 σ em ( 17.3 nm ) + T S 3 T S 3 + 1 σ em ( 26.0 nm )
Next, we need to determine the apparent branching ratios for the decay of the 2 3 P state by weighting theoretical transition rates [5,24] by an assumed statistical population of the triplet P’s J levels:
B eff = j = 0 2 ( 2 j + 1 ) ( 2 L + 1 ) ( 2 S + 1 ) · B j
The resulting effective branching ratios are 0.11 for 1 1 S 0 –2 3 P 1 , 2 and 0.89 for 2 3 S 1 –2 3 P 0 , 1 , 2 . Combining the cascade population cross-sections with the effective branching ratios yield the following relations for the emission cross-sections of the forbidden (z) and intercombination lines ( x , y ):
σ em ( x + y ) = 0.11 σ ( 2 3 P )
σ em ( z ) = σ ( 2 3 S )
Similarly, the emission cross-section of the resonance line (w) is found from the population of the 1 s 2 p ( 1 P 1 ) state:
σ em ( w ) = σ em ( 19.8 nm ) + σ em ( 26.7 nm ) + 1 T S 3 + 1 · σ em ( 26.0 nm )
We can estimate emission cross-sections for K β and K γ lines by weighting the triplet populations with the triplet-singlet ratio and the relevant branching ratios:
σ em ( K β ) = 1 T S 3 · σ em ( 22.7 nm )
σ em ( K γ ) = 0.95 0.76 1 T S 4 · σ em ( 17.3 nm )
Finally, using the derived emission cross-sections we calculated the commonly used line ratio diagnostics G, cf. [5]:
G = z + x + y w
and the hardness ratio H of the emission cross-sections of the K-series [32]:
H = n = 2 K n K α
Both G and H are listed in Table 2. While the line ratio diagnostics measure G hardly changes with velocity, the hardness ratio increases from 0.4 to 2 with decreasing velocity, a similar trend was first reported by Beiersdorfer et al. [32] for collisions involving bare oxygen and neon ions. Owing to this behavior the hardness ratio provides a remote diagnostic of ion velocities for solar-wind ions traversing H 2 O dominated cometary atmospheres.

3.4. Total Cross-Sections

Total single electron capture cross-sections can be estimated using:
σ t = σ em ( w ) + σ em ( x , y ) + σ em ( z ) + 1.05 σ em ( K β ) + 1.05 σ em ( K γ )
The results are listed in Table 2 and shown in Figure 4. The total single electron-capture cross-sections deduced from our EUV spectra do not include appreciable contributions from two-electron capture followed by autoionization as autoionization does not lead to additional population of 1 s n with n 3 . Autoionization to 1 s 3 requires an initial population of highly excited 1 s 4 l n l with n 5 configurations. These configurations are not to be expected to get populated as single-electron capture of the least bound H 2 O electron goes into 1 s 4 , capturing an additional stronger bound electron one expects its principal quantum number after capture to be n 3 . For comparison, two-electron transfer in collisions on He and H 2 populates initially 1 s 2 n with n 3 and 1 s 3 3 configurations which subsequently decay by autoionization.

4. Discussion

Velocity-dependent triplet-to-singlet ratios for capture into n = 4 are shown in Figure 3. Within the error margins of the individual measurements, the σ ( 1 s 4 s ) + σ ( 1 s 4 d ) ratio may be constant at a level of approximately 2.6, slightly lower than a statistical population of 3. Remarkably, the measurement of the triplet-to-singlet ratio based on the population of σ ( 1 s 3 d ) (thus sampling capture into the 1 s 4 f state too) shows a very strong variation with collision energies, approaching statistical levels at higher energies.
For C 5 + + H 2 theoretical CTMC [30] studies assumed a statistical population of the triplet and singlet states to reproduce previous experimental data [33]. By comparing X-ray and EUV spectra of collisions between C 5 + and H 2 , Suraud et al. [33] were able to directly measure the ratio between capture into the triplet and singlet 1 s 4 p states. They measured a population ratio of 3.7 at a collision energy of 4.3 keV/amu, which is in the range of statistical triplet-to-singlet ratios just as our results for collisions with H 2 O. Experiments with lower charged ions (O 3 + , N 4 + ) and H and H 2 showed that at collision energies below 1 keV/amu, the triplet-to-singlet ratio changes significantly with decreasing collision energy [34,35]. However, electron capture by these ions mostly populates lower levels ( n = 3 ) where the difference in binding energy between states with the same n quantum numbers but belonging to either the triplet and singlet system is relatively large. These energy differences on their turn affect the radial coupling strengths and thus the cross-sections.
Recent MCLZ calculations [22,36] however calculated the n state population of the triplet and singlet states without spin-statistical weights added to the capture channels for collisions on closed shell targets such as H 2 , He, and H 2 O. Using those population cross-sections for C 5 + on H 2 O collisions as made available through the KRONOS package1, we compare the experimental and MCLZ triplet-to-singlet ratios in Figure 3. In line with the experiment the model predicts the 1 s 4 s + 1 s 4 d triplet-to-singlet ratio to be constant with velocity at collision energies between 0.1–10 keV/amu. However, the predicted ratio is much lower ( T S 4 = 1 ) than our experimental ratio, which approaches the statistical value of 3.
Our T S 3 ( 1 s 3 d + 1 s 4 f ) ratio increases from roughly 1 at 0.1 keV/amu to 3 at 10 keV/amu, a trend different from the MCLZ predictions. Multiplying the MCLZ data by 3 yields a value more similar to our measurements, in particular at higher energies. This implies that the decision not to include manually spin statistics into the MCLZ calculations might need to be revisited. The MCLZ model is basically a one-electron model which only takes into account the binding energy of the least bound target electron and the final state binding energies, and during the collision no direct interaction with other target or projectile electrons is considered. Therefore, assuming spin-statistical weights as done for one-electron targets (H, or alkali atoms) might be appropriate.
Total charge-changing cross-sections for C 5 + + H 2 O collisions have been measured by Mawhorter et al. [29] who found a charge-changing cross-section of ( 42 ± 3.2 ) × 10 16 cm 2 at 2.92 keV/amu, significantly larger than the one-electron capture cross-sections measured by us at comparable energies, which by interpolation would be ( 25 ± 6.6 ) × 10 16 cm 2 . We attribute this difference to auto-ionizing double electron capture (ADC) processes. As discussed in Section 3.4, such processes lead to population of 1 s n l with n = 1 , 2 states, population of which cannot be directly detected with our experiment. We note that a value of ≈ 0.6 for the ratio of ADC to single electron capture for C 5 + + H 2 O is comparable to similar collision systems (cf. [26,33,37,38]). It is of note that the cross-section for ADC ( 17 × 10 16 cm 2 from the difference between our total one-electron capture cross-section and the reported charge-changing cross-section) is three times larger than the double charge-changing cross-section of ( 6 ± 1 ) × 10 16 cm 2 reported by Mawhorter et al. [29]. This cross-section is likely to stem by and large from population of long-lived 1 s 2 2 configurations. In addition, autoionization following triple electron capture contributes to the double charge-changing cross-section (cf. [26]). The MCLZ calculations by Mullen et al. [22] of the total one-electron capture agree reasonably well with our measurements, while the CTMC predictions by Liamsuwan and Nikjoo [31] are a factor of 5 larger than our total single electron cross-section.

5. Conclusions

We have conducted laboratory measurements of charge-exchange reactions between hydrogen-like C 5 + ions and water molecules. We have deduced velocity-dependent emission cross-sections for the Cv K-series and total single electron capture cross-sections for collision energies typical for the solar wind (0.1–4.0 keV/amu, or 170–979 km/s).
Our results demonstrate that capture occurs mostly into the n = 4 shell and that the resulting EUV spectrum changes significantly with collision velocity. We derived two independent measures of the triplet-to-singlet ratio that have very different velocity-dependent behavior: the triplet-to-singlet ratio of capture into the 1 s 4 s and 1 s 4 d states is seemingly constant over the range of energies covered here, whereas the ratio between capture into the 1 s 3 d and 1 s 4 f states increases from 1.3 to 2.8.
We also used our data to determine total one-electron capture cross-sections. Comparing our results to a charge-changing measurement, we conclude that about 40% of the single charge-changing reactions are due to multi-electron processes, similar to what is seen in comparable collision systems. These processes may contribute to the population of the n = 2 level, which in turn will result in a different hardness ratio than is predicted based on pure single electron capture alone (such as done here). No single experimental technique can capture all the aspects of charge-exchange reactions, and our results emphasize the need for future experiments to combine multiple particle-detection techniques and spectroscopy at different wavelengths.
As demonstrated here, spectroscopy in the Extreme and Far Ultraviolet wavelength regime samples a large part of the relaxation cascade and can provide access to state-selective capture cross-sections and to triplet and singlet ratios, as it does not rely on the detection of forbidden transitions. For space applications, these wavelengths also provide access to charge-exchange emission from the most abundant ions in the solar wind, including protons, helium, and O 6 + .

Author Contributions

D.B. conducted experimental work. Both authors contributed to the analysis, interpretation, and to writing the manuscript.

Funding

This research received no external funding.

Acknowledgments

This research has made use of NASA’s Astrophysics Data System. We would gratefully like to acknowledge Phillip Stancil (UGA) and Renata Cumbee (NASA GSFC/NPP) for valuable discussions.

Conflicts of Interest

The authors declare no conflict of interest.

Abbreviations

The following abbreviations are used in this manuscript:
ADCAuto-ionizing Double Capture
CTMCClassical Trajectory Monte Carlo
CXECharge-Exchange Emission
ECRISElectron Cyclotron Resonance Ion Source
EUVExtreme UltraViolet
MCLZMultiChannel Landau Zener
SECSingle Electron Capture

References

  1. Dennerl, K. Charge Transfer Reactions. Space Sci. Rev. 2010, 157, 57–91. [Google Scholar] [CrossRef]
  2. Lisse, C.M.; Dennerl, K.; Englhauser, J.; Harden, M.; Marshall, F.E.; Mumma, M.J.; Petre, R.; Pye, J.P.; Ricketts, M.J.; Schmitt, J.H.M.M.; et al. Discovery of X-ray and Extreme Ultraviolet Emission from Comet C/Hyakutake 1996 B2. Science 1996, 274, 205–209. [Google Scholar] [CrossRef]
  3. Cravens, T.E. Comet Hyakutake x-ray source: Charge transfer of solar wind heavy ions. Geophys. Res. Lett. 1997, 24, 105. [Google Scholar] [CrossRef]
  4. Kharchenko, V.; Dalgarno, A. Variability of Cometary X-Ray Emission Induced by Solar Wind Ions. Astrophys. J. Lett. 2001, 554, L99–L102. [Google Scholar] [CrossRef]
  5. Porquet, D.; Dubau, J. X-ray photoionized plasma diagnostics with helium-like ions. Application to warm absorber-emitter in active galactic nuclei. Astron. Astrophys. Suppl. Ser. 2000, 143, 495–514. [Google Scholar] [CrossRef]
  6. Dennerl, K.; Lisse, C.M.; Bhardwaj, A.; Burwitz, V.; Englhauser, J.; Gunell, H.; Holmström, M.; Jansen, F.; Kharchenko, V.; Rodríguez-Pascual, P.M. First observation of Mars with XMM-Newton. High resolution X-ray spectroscopy with RGS. Astron. Astrophys. 2006, 451, 709–722. [Google Scholar] [CrossRef]
  7. Bhardwaj, A.; Elsner, R.F.; Randall gladstone, G.; Cravens, T.E.; Lisse, C.M.; Dennerl, K.; Branduardi- Raymont, G.; Wargelin, B.J.; Hunter Waite, J., Jr.; Robertson, I. X-rays from solar system objects. Planet. Space Sci. 2007, 55, 1135–1189. [Google Scholar] [CrossRef]
  8. Branduardi-Raymont, G. X-ray studies of solar system objects: Past, present, and the next decade. Astron. Nachrichten 2017, 338, 188–194. [Google Scholar] [CrossRef]
  9. Carter, J.A.; Sembay, S. Identifying XMM-Newton observations affected by solar wind charge exchange. Part I. Astron. Astrophys. Suppl. Ser. 2008, 489, 837–848. [Google Scholar] [CrossRef]
  10. Koutroumpa, D.; Lallement, R.; Kharchenko, V.; Dalgarno, A. The Solar Wind Charge-eXchange Contribution to the Local Soft X-ray Background. Space Sci. Rev. 2008, 143, 87. [Google Scholar]
  11. Katsuda, S.; Tsunemi, H.; Mori, K.; Uchida, H.; Kosugi, H.; Kimura, M.; Nakajima, H.; Takakura, S.; Petre, R.; Hewitt, J.W.; Yamaguchi, H. Possible Charge-exchange X-ray Emission in the Cygnus Loop Detected with Suzaku. Astrophys. J. 2011, 730, 24. [Google Scholar] [CrossRef]
  12. Cumbee, R.S.; Henley, D.B.; Stancil, P.C.; Shelton, R.L.; Nolte, J.L.; Wu, Y.; Schultz, D.R. Can Charge Exchange Explain Anomalous Soft X-Ray Emission in the Cygnus Loop? Astrophys. J. Lett. 2014, 787, L31. [Google Scholar] [CrossRef]
  13. Liu, J.; Wang, Q.D.; Mao, S. Charge-exchange X-ray emission of nearby star-forming galaxies. Mon. Not. R. Astron. Soc. 2012, 420, 3389–3395. [Google Scholar] [CrossRef]
  14. Ezoe, Y.; Miyoshi, Y.; Kasahara, S.; Kimura, T.; Ishikawa, K.; Fujimoto, M.; Mitsuda, K.; Sahara, H.; Isobe, N.; Nakajima, H.; et al. Small Satellites With MEMS X-Ray Telescopes for X-Ray Astronomy and Solar System Exploration; Tokyo Metropolitan University: Hachioji, Japan, 2018; p. 106990V. [Google Scholar]
  15. Bodewits, D.; Juhasz, Z.; Hoekstra, R.; Tielens, A.G.G.M. Catching Some Sun: Probing the Solar Wind with Cometary X-Ray and Far-Ultraviolet Emission. Astrophys. J. 2004, 606, L81–L84. [Google Scholar] [CrossRef]
  16. Bodewits, D.; Hoekstra, R. Electron capture in collisions between O6+ ions and H2O molecules. Phys. Rev. A 2007, 76, 32703. [Google Scholar] [CrossRef]
  17. Kharchenko, V.; Rigazio, M.; Dalgarno, A.; Krasnopolsky, V.A. Charge Abundances of the Solar Wind Ions Inferred from Cometary X-Ray Spectra. Astrophys. J. 2003, 585, L73–L75. [Google Scholar] [CrossRef]
  18. Krasnopolsky, V.A. CXO X-ray spectroscopy of comets and abundances of heavy ions in the solar wind. Icarus 2015, 247, 95–102. [Google Scholar] [CrossRef]
  19. Sibeck, D.G.; Allen, R.; Aryan, H.; Bodewits, D.; Brandt, P.; Branduardi-Raymont, G.; Brown, G.; Carter, J.A.; Collado-Vega, Y.M.; Collier, M.; et al. Imaging Plasma Density Structures in the Soft X-Rays Generated by Solar Wind Charge Exchange with Neutrals. Space Sci. Rev. 2018, 214, 79. [Google Scholar] [CrossRef]
  20. Wegmann, R.; Dennerl, K. X-ray tomography of a cometary bow shock. Astron. Astrophys. Suppl. Ser. 2005, 430, L33–L36. [Google Scholar] [CrossRef]
  21. Lisse, C.M.; Christian, D.J.; Dennerl, K.; Wolk, S.J.; Bodewits, D.; Hoekstra, R.; Combi, M.R.; Makinen, J.T.T.; Dryer, M.; Fry, C.D.; et al. Chandra Observations of Comet 2P/Encke 2003: First Detection of a Collisionally Thin, Fast Solar Wind Charge Exchange System. Astrophys. J. 2005, 635, 1329–1347. [Google Scholar] [CrossRef]
  22. Mullen, P.D.; Cumbee, R.S.; Lyons, D.; Gu, L.; Kaastra, J.; Shelton, R.L.; Stancil, P.C. Line Ratios for Solar Wind Charge Exchange with Comets. Astrophys. J. 2017, 844, 7. [Google Scholar] [CrossRef]
  23. Krasnopolsky, V.A.; Greenwood, J.B.; Stancil, P.C. X-Ray and extreme ultraviolet emissions from comets. Space Sci. Rev. 2004, 113, 271–373. [Google Scholar] [CrossRef]
  24. Porquet, D.; Mewe, R.; Dubau, J.; Raassen, A.J.J.; Kaastra, J.S. Line ratios for helium-like ions: Applications to collision-dominated plasmas. Astron. Astrophys. 2001, 376, 1113–1122. [Google Scholar] [CrossRef]
  25. Schwadron, N.A.; Cravens, T.E. Implications of Solar Wind Composition for Cometary X-Rays. Astrophys. J. 2000, 544, 558–566. [Google Scholar] [CrossRef]
  26. Bodewits, D.; Hoekstra, R.; Seredyuk, B.; McCullough, R.W.; Jones, G.H.; Tielens, A.G.G.M. Charge Exchange Emission from Solar Wind Helium Ions. Astrophys. J. 2006, 642, 593–605. [Google Scholar] [CrossRef]
  27. Seredyuk, B.; McCullough, R.; Tawara, H.; Gilbody, H.; Bodewits, D.; Hoekstra, R.; Tielens, A.; Sobocinski, P.; Pesic, D.; Hellhammer, R.; et al. Charge exchange and dissociative processes in collisions of slow He2+ ions with H2O molecules. Phys. Rev. A 2005, 71, 022705. [Google Scholar] [CrossRef]
  28. Bodewits, D. Cometary X-rays. Solar Wind Charge Exchange in Cometary Atmospheres. Ph.D. Thesis, University of Groningen, Groningen, The Netherlands, 2007. [Google Scholar]
  29. Mawhorter, R.; Chutjian, A.; Cravens, T.E.; Djurić, N.; Hossain, S.; Lisse, C.M.; Macaskill, J.; Smith, S.; Simcic, J.; Williams, I. Absolute single and multiple charge exchange cross sections for highly charged C, O, and Ne ions on H2O, CO, and CO2. Phys. Rev. A 2007, 75, 032704. [Google Scholar] [CrossRef]
  30. Otranto, S.; Olson, R.E.; Beiersdorfer, P. Cometary X-rays: Line emission cross sections for multiply charged solar wind ion charge exchange. J. Phys. B 2007, 40, 1755–1766. [Google Scholar] [CrossRef]
  31. Liamsuwan, T.; Nikjoo, H. Cross sections for bare and dressed carbon ions in water and neon. Phys. Med. Biol. 2013, 58, 641–672. [Google Scholar] [CrossRef] [PubMed]
  32. Beiersdorfer, P.; Lisse, C.M.; Olson, R.E.; Brown, G.V.; Chen, H. X-Ray Velocimetry of Solar Wind Ion Impact on Comets. Astrophys. J. 2001, 549, L147. [Google Scholar] [CrossRef]
  33. Suraud, M.G.; Hoekstra, R.; de Heer, F.J.; Bonnet, J.J.; Morgenstern, R. State selective electron capture into nl subshells in slow collisions of C5+ and N6+ with He and H2 studied by photon emission spectroscopy. J. Phys. B 1991, 24, 2543–2558. [Google Scholar] [CrossRef]
  34. Beijers, J.P.M.; Hoekstra, R.; Morgenstern, R. State selective charge transfer in slow collisions of O3+ with H and H2. J. Phys. B 1996, 29, 1397–1408. [Google Scholar] [CrossRef]
  35. Bliek, F.W.; Woestenenk, G.R.; Hoekstra, R.; Morgenstern, R. State-selective electron capture measurements for N4+-H and N4+-H2 collisions. Phys. Rev. A 1998, 57, 221–226. [Google Scholar] [CrossRef]
  36. Lyons, D.; Cumbee, R.S.; Stancil, P.C. Charge Exchange of Highly Charged Ne and Mg Ions with H and He. Astrophys. J. Suppl. Ser. 2017, 232, 27. [Google Scholar] [CrossRef]
  37. Beiersdorfer, P. Laboratory X-Ray Astrophysics. Ann. Rev. Astron. Astrophys. 2003, 41, 343–390. [Google Scholar] [CrossRef]
  38. Ali, R.; Neill, P.A.; Beiersdorfer, P.; Harris, C.; Rakovic, M.; Wang, J.; Schultz, D.R.; Stancil, P.C. On the Significance of the Contribution of Multiple-Electron Capture Processes to Cometary X-Ray Emission. Astrophys. J. 2005, 629, L125–L128. [Google Scholar] [CrossRef]
1.
Figure 1. Part of the decay scheme of the Grotrian diagram of Cv. Lines detected by our experiment are indicated by solid lines; other lines that were not observed but that are relevant to this work are indicated by dashed lines. Red indicates the transitions used for the TS 3 triplet-to-singlet ratio; Blue indicates the transitions used for the TS 4 ratio.
Atoms 07 00017 g001
Figure 2. Charge-exchange spectra for collisions between C 5 + and H 2 O at different velocities. The numbers in the top of the figure marking the spectral lines refer to Table 1.
Atoms 07 00017 g002
Figure 3. Experimental and theoretical [22] velocity dependence of triplet-to-singlet ratios for collisions between C 5 + and H 2 O. Shown are the TS 3 ratio for capture into 1 s 3 d and 1 s 4 f (filled circles and solid line) and the TS 4 ratio for capture into 1 s 4 s and 1 s 4 d (open diamonds and dashed line). For comparison, a second pair of the theoretical curves is depicted which are obtained by multiplying the original theoretical results by a factor of three to represent a statistical spin state population.
Atoms 07 00017 g003
Figure 4. (Left) Experimental velocity dependence of deduced K-series emission and total charge-exchange cross-sections for collisions between C 5 + and H 2 O. Indicated are total cross-sections (black solid line); the forbidden line z (dashed red line); intercombination line x + y (green dotted line); resonance line w (blue dashed-dotted line); K β (cyan dash-double dot); and K γ (magenta dashed line). Single and double charge-changing cross-sections measured by Mawhorter et al. [29] are represented by a filled and open diamond, respectively. (Right) Theoretical emission and total capture cross-sections. Colored lines indicate MCLZ calculations by Mullen et al. [22]. Open circles represent CTMC calculations for emission cross-sections by Otranto et al. [30]. The stars represent CTMC calculations of the total one-electron capture cross-section by Liamsuwan and Nikjoo [31].
Atoms 07 00017 g004
Table 1. Fit results—measured emission cross-sections for collisions between C 5 + and H 2 O, at different collision energies. All cross-sections are in units of 10 16  cm 2 . Only relative errors are given. The systematic uncertainty is approximately 20% for wavelengths above 20 nm and 25% for the shorter wavelengths, see text.
# λ  (nm)TransitionsCollision Energy (keV/amu)
0.1130.3753.75
117.34 3 P–2 3 S1.0 ± 0.10.7 ± 0.11.1 ± 0.1
218.84 3 D– 2 3 P, 4 3 S–2 3 P, 4 1 P–2 1 S6.1 ± 0.62.0 ± 0.22.0 ± 0.2
319.84 1 D–2 1 P, 4 1 S–2 1 P2.5 ± 0.20.7 ± 0.10.8 ± 0.1
422.73 3 P–2 3 S14 ± 1.47.2 ± 0.74.4 ± 0.4
524.83 3 D–2 3 P, 3 1 P–2 1 S2.7 ± 0.34.0 ± 0.410 ± 1.0
626.03 3 S–2 3 P, 3 1 S–2 1 P2.6 ± 0.31.9 ± 0.21.8 ± 0.2
726.73 1 D–2 1 P2.1 ± 0.22.4 ± 0.23.6 ± 0.4
Table 2. From the measured EUV line-emission cross-section for collisions of C 5 + on H 2 O the following quantities are derived: triplet-to-singlet ratios (TS 3 TS 4 ), total cross-section for pure one-electron transfer (SEC), cross-sections for cascade population of 2 3 S and 2 3 P and for K-series line emission and finally the diagnostic ratios G and H. All cross-sections are in units of 10 16 cm 2 .
E (keV/amu)0.1130.3753.75
v (km/s)170309979
TS 3 1.3 ± 0.21.7 ± 0.22.8 ± 0.4
TS 4 2.4 ± 0.32.9 ± 0.42.5 ± 0.4
SEC43.5 ± 2.624.0 ± 1.226.3 ± 1.1
2 3 S24.4 ± 1.514.5 ± 0.817.7 ± 1.0
2 3 P10.6 ± 0.77.4 ± 0.513.7 ± 1.0
x , y 1.2 ± 0.10.8 ± 0.11.5 ± 0.1
z24.4 ± 1.514.5 ± 0.817.7 ± 1.0
w5.8 ± 0.43.8 ± 0.34.9 ± 0.4
K β 11.1 ± 1.94.4 ± 0.81.6 ± 0.3
K γ 0.5 ± 0.10.3 ± 0.10.6 ± 0.1
G4.5 ± 0.44.0 ± 0.43.9 ± 0.4
H2.0 ± 0.41.2 ± 0.20.4 ± 0.1

