Abstract
Measurements of current and voltage are the basic diagnostics for electrical discharges. However, in the case of dielectric barrier discharges (DBDs), the measured current and voltage waveforms are influenced by the discharge reactor geometry, and thus, interpretation of measured quantities is required to determine the discharge properties. This contribution presents the main stages of the development of electrical diagnostics of DBDs, which are based on lumped electrical elements. The compilation and revision of the contributions to the equivalent circuit approach are targeted to indicate: (1) the interconnection between the stage of development, (2) its applicability, and (3) the current state-of-the-art of this approach.
1. Introduction
Dielectric barrier discharges (DBDs) are a well-established method to generate non-thermal plasmas at atmospheric pressure [1]. Their main peculiarity is the presence of at least one dielectric between the electrodes. It prevents the transition into a spark discharge. DBDs have many industrial applications, e.g., ozone generation, exhaust gas cleaning, surface activation, and light sources. They are further under investigation for plasma medicine, surface deposition, and flow control.
The non-thermal plasma produces highly-reactive species without an extensive heating of the gas. The application of non-thermal plasma generated by DBDs is of continuous interest for and permanently expanded to new technological areas such as conversion of carbon dioxide [2] or removal of odors [3]. DBD can also initiate very specific chemical processes, which are hardly accessible by other technologies, like ozone generation [4] or polymerization of D-ribose [5].
The parameters of the plasma are influenced by the discharge geometry and profound knowledge about the dissipated energy and power, the current and voltage in the gas gap are crucial for the characterization, comparability, and up-scaling of DBD reactors. Therefore, current, voltage, and charge measurements are used and interpreted based on equivalent circuits.
However, the growing interest in DBDs and the exploration of new applications has led to a great variety of DBD designs, reactor configurations, power excitation schemes, and discharge regimes, which differ from the DBD in the classical ozonizer [6]. Thus, the interpretation of electrical measurements is not straightforward, and equivalent circuits have been reviewed and further developed. This contribution aims to summarize the state-of-the-art of the stages of development of this approach.
It does not pretend to be a comprehensive review about electrical diagnostics of DBDs, but is focused on the principle stages of development of equivalent circuits, which gives information about a DBD’s properties directly from measured current/charge and voltage waveforms.
We will follow the historical development of the approach, starting with “the classical electrical theory of ozonisers” formulated by Manley [7]. First, the main principle of discharge operation and the challenges for the electrical diagnostics will be given (Section 2). The work [7] provides the basic principles of the DBD electrical characteristics and will be discussed in detail in Section 3. The development of the experimental techniques led to new insights, which could not be explained within the framework of the classical theory. The equivalent circuit approach was suggested by three groups independently [8,9,10] to overcome these difficulties. This will be reviewed in Section 4. Section 5 will revise the works [7,8,9] taking into account the previous revision described in [11,12,13]. Section 3, Section 4 and Section 5 deal with the volume DBD where the capacitances of the reactor do not depend on the operation conditions; in other words, the charges deposited on the dielectric surfaces cover the whole cross-section of the electrodes uniformly. Section 6 will describe the electrical diagnostic of DBDs when discharge expansion on the dielectric surfaces is influenced by the amplitude of the applied voltage [14,15,16]. The concluding Section 7 will summarize the state-of-the-art and remaining challenges for the equivalent circuit approach for DBDs.
2. Basics of DBD Operation and Challenges for the Electric Diagnostics
The basic design of a DBD is schematically shown in Figure 1. The discharge is ignited at sufficiently high applied voltage (range of a few kV) with frequencies in the range of 50 Hz–1 MHz. Electrical charges are deposited on the dielectric surfaces during discharge operation. The deposited charges shield the external electric field, and thus, the discharge is self-extinguished. In other words, the dielectric limits the charge transfer through the gas gap and restricts the heating of the gas. For the next discharge ignition, the applied voltage must be increased further or the polarity must be changed. Thereby, DBD has active and passive phases within one period of the applied voltage, with and without active charge transfer through the gas gap, respectively.

Figure 1.
Schematic presentation of the dielectric barrier discharge cell. Reprinted from [12] with the permission of ©AIP Publishing.
Since the charges deposited on the dielectric surfaces strongly influence the electric field in the gas gap, the gas gap voltage significantly differs from the applied voltage . The term is not defined neatly, as it assumes implicitly an equipotential internal dielectric surface. This is fulfilled only in the case homogeneous (or uniform/diffuse) discharge regimes, but obviously not for the more common filamentary modes. can be understood as an effective characteristic, averaged over the whole dielectric surface, with the following properties: the active DBD phase starts when overcomes the breakdown potential , and the passive phase begins when falls to the discharge extinguish voltage . This can be expected at the moment , when is reached near the maximum of the applied voltage, i.e., the increase of does not compensate the screening of the electric field by the deposited charges. The value of should be between zero and the breakdown potential (). The direct measurement of is impossible, but sometimes, it can be obtained via an interpretation of the externally-measured voltage and current . The methods to infer and are revised in the present work.
The measured current contains the current associated with charge transfer in the gas gap (the discharge current ) and the displacement current in the gas gap. At the low amplitude of the alternating applied voltage , the discharge is not ignited, and there is no charge transfer in the gas gap. In this situation, the reactor cell behaves as an ideal capacitor , and the measured current will be determined by the relation:
The index off in this equation emphasis that the current is measured without discharge ignition (passive or plasma-off phase). The difference of currents measured with and without discharge ignition reflects the discharge current, but is not entirely equal to this due to the following reason. The displacement current in the gas gap is proportional to the derivative of , which does not coincide with the derivative of in the active DBD phase. Therefore, is not always equal to the displacement current in the gas gap, and additional efforts are required to establish the relation between measured and discharged current.
The total power dissipated in a DBD, averaged over the voltage period T, can be deduced directly from the measured and :
The product of measured current and voltage gives the power dissipated in the discharge and stored on the dielectric surfaces. Thus, only the power averaged over the whole discharge period is available from directly-measured and . However, the knowledge of and can provide instantaneous power:
The relations between and , as well as and depend on the DBD reactor geometry. The comparison of DBDs with different geometries should be based on internal discharge characteristics and , which can be obtained by means of the equivalent circuit approach. It allows one to infer the measured waveform comprehensively, but the applicability of the approach should be accurately examined. This is the main aim of the present work.
3. The Classical Electrical Theory of Ozonizers
DBD was introduced by Siemens in 1857 [4] as a low-temperature discharge for ozone generation. The principle ideas for electrical characterization of DBD were formulated much later by Manley in 1943 [7], now referred to as “The classical electrical theory of ozonisers”. It is the base for the equivalent circuit approach. Other approaches to infer electrical characteristics can be found in [17], but they are not further discussed here.
The main results of the classical theory are based on measurements of three quantities: applied voltage , current waveform, and charge as a function of the applied voltage . The charge can be obtained as an integral of the measured current waveform:
or can be measured as a voltage drop across a given capacitor inserted in series into the reactor cell:
If the charge is measured via capacitance, it can be shown as a function of the applied voltage directly on the oscilloscope. Examples of such oscilloscope screen shots [7] are reproduced in Figure 2.
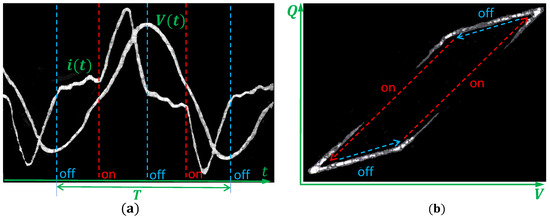
Figure 2.
Oscilloscope screen shots of the measured electrical characteristics of DBD from [7]. (a) Measured voltage and current waveforms . Vertical lines indicate moments of switching between active (discharge on) and passive (discharge off) phases of DBD. T is the discharge period. (b) Charge voltage characteristics (-plot). The arrows indicate temporal development. The screen shots are reprinted from [7] with the permission of ©Electrochemical Society.
The discharge cell was driven by sinusoidal voltage , whereas the current waveform is more complex. The active discharge phase is associated with a hump on the current waveform, which ends when the voltage reaches its maximum. The hump can be well identified by the variation of the voltage amplitude . It appears when is high enough and rapidly grows with . When reaches its maximum, the discharge turns to the passive phase. The switching between passive and active phases can be verified with synchronous measurements of the light emission [7]. The phases of the discharge can be seen more distinctly in the charge-voltage characteristics (-plot). It appears as a parallelogram, and each side corresponds to one of the discharge phases. The discharge power averaged over period T is determined by the integration of the product (see Equation (2)) or as the area of the -plot multiplied with the frequency :
Further conclusions can be drawn from detailed discussions of the -plot, which is schematically shown in Figure 3. When the amplitude of the applied voltage is too low for the discharge being ignited, the reactor cell behaves as a capacitor . can be represented as a serial connection of the capacitances associated with a gas gap and dielectric barriers :
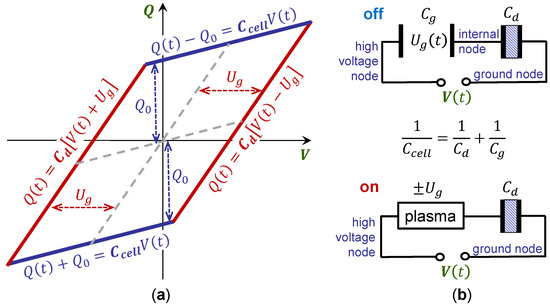
Figure 3.
Interpretation of the classical charge-voltage characteristics of sinusoidal voltage-driven ozonizers. (a) Schematic presentation of the -plot. (b) Equivalent circuits corresponding to passive (plasma-off) and active (plasma on) discharge phases.
Then, the -plot is a straight line with slope (i.e., ). In the case of the passive discharge phase, the measured charge is shifted by due to the charges deposited on the dielectric surfaces; see Figure 3a. Therefore, the measured charge can be described as:
This can be inferred in terms of the equivalent circuit for the passive discharge phase (off); see Figure 3b. is part of the internal node charge, which is present on the plate of the capacitor ; see [12] for details.
In the active part of the discharge, the plasma connects the electrodes, and the reactor capacitance is only determined by the dielectric barriers as represented in the equivalent circuit for the active part of the discharge (on); see Figure 3b. The corresponding part of the measured -plot is a straight line with the slope of shifted by the gas gap voltage ; see Figure 3a. does not depend on the applied voltage and is constant over the whole active discharge phase ():
The work of Manley [7] contains an additional important result, which is not often mentioned. The gas gap voltage of the DBD in the active phase, measured for different gas gaps distances (d) and pressures (p), was compared with the breakdown voltage of the gas (air) between the parallel plate electrodes. The influence of the gas temperature was accounted for by an extrapolation of measured values to the zero discharge power. appears as a function of , similar to the breakdown voltage in a homogeneous electric field. However, the absolute values were somehow lower. The breakdown voltage strongly depends on pre-ionization of the gas; thus, the residual charges, left from a previous DBD cycle, are responsible for the reduction of the . The influence of the residual charges is also confirmed by the dependence of the breakdown voltage on the time between external re-ignitions [18]. Nevertheless, the observation, that is a function of , supports the use of also in the case of filamentary DBDs, as investigated in [7], in spite of the implicit assumption about the equipotential barrier surfaces.
The classical electrical theory of ozonizers can be summarized as follows: (a) DBD can be represented by two equivalent circuits, which correspond to passive and active discharge phases (see Figure 3); (b) during the active discharge phase, is constant and does not depend on the voltage amplitude, but it is a function of the inter-electrode distance and the gas density (as assumed by Paschen’s law); (c) geometrical parameters of the discharge cell can be determined from the -plot, namely capacitances and ; (d) there is no conclusion about discharge current; however, it is assumed that the total current, measured in the active phase, corresponds to the charge transfer through the gas gap (as seen from the equivalent circuit for active discharge phase; see Figure 3b (on)). This means that Equation (1) could not be used for the determination of the displacement current in the active discharge phase.
4. Suggestions for the Equivalent Circuit Approach
With the improvement of experimental techniques for the generation of high voltages, as well as for the measurement of current and voltage waveforms, new types of -plots were reported, which differ significantly from a parallelogram and, thus, cannot be explained by the classical theory in a straightforward manner. Examples of such -plots are presented in Figure 4. The most exotic -plots are obtained under pulsed excitation (Figure 4b,c), but even the -plot for a sinusoidal operated DBD, in Figure 4a, requires additional explanations.
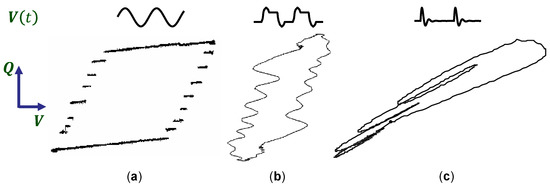
Figure 4.
Schematic presentation of different types of the voltage waveforms (upper line) and the corresponding -plots (lower line). (a) Staircase-shaped -plot measured for a sinusoidal operated DBD [19]. ©Penerbit UTM Press. (b) -plot measured for bipolar pulsed operated DBD [8]. ©V.E. Zuev Institute of Atmospheric Optics SB RAS, reproduced with permission. (c) -plot measured for pulsed operation in the form of damped oscillations [20] ©IOP Publishing. Reproduced with permission. All rights reserved. The figures are reproduced with the kind permission of the authors.
It was inferred that the gas gap voltage is varying during the active discharge phase. For more detailed interpretation of the DBD electrical characteristics, an equivalent circuit approach was presented in 2001 by Lomaev [8], as well as Liu and Neiger [9]; see Figure 5. The approach was also used by Bibinov et al. at the same time [10]. These equivalent circuits contain a capacitor associated with dielectric barriers in serial connection to the gas gap. The latter is represented as a parallel connection of a gas gap capacitor and a time-dependent current source or resistor R. This resistor/current-source is a “black box” approximation of the discharge, i.e., the plasma is just characterized by the current .
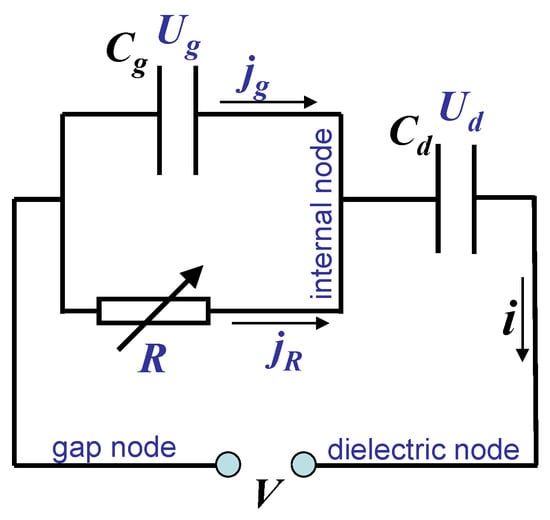
Figure 5.
Simplest equivalent circuit of a DBD. Reprinted from [12] with the permission of ©AIP Publishing.
Four coupled equations based on the definition of capacitance and Kirchhoff’s laws can be derived from Figure 5:
where is the voltage across dielectric barriers and is the current through the gas gap capacitance . Note that these equations do not contain any information or definition for R; thus, they are valid for any element R. This approach strongly differs from circuits with linear elements, where all circuit parameters can be obtained from a specified applied voltage . The element R can be nonlinear, and its properties are unknown. However, the measured current is an input parameter, in addition to .
Substituting Equation (12) into (13) gives an expression for the discharge current, as already suggested in [8,21]:
Equation (15) indicates that the measured current is the sum of discharge current and displacement current through the gas gap. It can be seen that the expression (12) differs from Equation (1) for current . Therefore, the difference of the measured current with and without discharge ignition is not equal to the discharge current in this approach either.
5. Revision of the Equivalent Circuit Approach and the Classical Electrical Theory of Ozonizers
The equivalent circuit approach provides new possibilities to infer measured electrical characteristics. However, two important questions remain: (1) Why is the equivalent circuit appropriate, or why does it reflect the properties of DBDs? The replacement validity of the reactor cell (see Figure 1) by the equivalent circuit in Figure 5 is not obvious. (2) How does one determine the capacitances , , ? Capacitances can be calculated in the case of simple geometries, but it is difficult to account for edge effects and non-uniform gaps, especially for small-sized laboratory reactors. These questions were in focus in [11,12,13] and are revised in this section.
5.1. Validity of the Equivalent Circuit Approach
The work [12] discusses the circuit in Figure 5 as the simplest equivalent circuit for the interpretation of classical -plots. Namely, the circuit (i) describes the change of the DBD capacitances by varying the resistance of the “black box” R and (ii) provides the same Equations (8) and (9) for the charge measured in passive and active phases of the discharge as in the classical theory. The charge in Equation (8) can be related to the charge transferred through the gas gap. The relation is the same, whether the classical theory or the equivalent circuit is applied. The absence of the contradictions between the theories was concluded. Two antiparallel Zener diodes can be considered as a specific case of the “black box” R for the description of the classical -plot, as was suggested by Kogelschatz [22].
Here, we demonstrate the close relation between the theories in a slightly different way. The classical theory [7] implicitly suggests two equivalent circuits for active and passive discharge phases, respectively; see Figure 3. When there is no current flow through the “black box” R, the equivalent circuit in Figure 5 coincides with the suggestion of the classical theory for the passive discharge phase. When current flows through the “black box” R, the equivalent circuit will be identical to the circuit of the classical theory for the active discharge phase, if the restriction of the gas gap voltage is applied. If , then the displacement current through is zero (see Equation (12)), and the total measured current is associated with the charge transferred through the gas gap (see Equation (15)). Thus, the equivalent circuit approach (see Figure 5) generalizes the classical theory: (i) it uses one circuit instead of two, and (ii) it does not require the condition . The replacement of the box “plasma” with “black box” R does not increase the complexity of the description, nor does it introduce any additional assumptions. The main concerns about the applicability of the equivalent circuit approach are related to the term “gas gap voltage”, which assumes an equipotential surface of the dielectric barriers. This term was introduced in the classical theory.
5.2. Determination of and
The work [11] proposes to observe the point of maximal charge at different voltage amplitudes for the determination of the capacitances and ; see Figure 6. Figure 6a presents examples for volume DBDs operated by square voltage pulses from -plots. In the presented examples, the applied voltage oscillates around its amplitude value during the active part of the discharge, and an extreme value of does not correspond to the maximum charge. Point 5 on the -plot indicates the moment just before the beginning of the falling slope and the point. The point is at the upper right corner in the -plots, as shown by the arrows in Figure 6a. All points measured for different amplitudes of the applied voltages are displayed in Figure 6b, and a linear slope is obtained. Without discharge ignition, the slope of the line represents , and when the discharge is ignited, the slope of the line represents . In the example in Figure 6b, square voltage pulses with two different rise times (20 ns and 75 ns) were used for the same reactor. The resulting straight lines have slightly different slopes, but this uncertainty is included in the error bars of the values shown in Figure 6b.
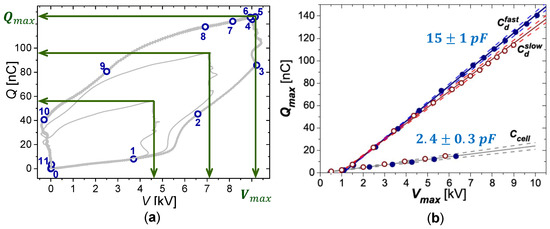
Figure 6.
Determination of the reactor capacitances, based on experimental data from [13]. (a) Examples of -plots for DBD operated by square voltage pulses. Arrows indicate values of and . Digits enumerate selected moments in the -plot with the largest amplitude of the applied voltage. (b) An example of the plot, reproduced from [13] with the permission of ©2013 WILEY-VCH Verlag GmbH & Co. KGaA, Weinheim. The points are the measured values of and for DBD operated by square voltage pulses with fast (solid circles) and slow (open circles) rise times. Solid straight lines have slopes corresponding o the capacitance, and dashed lines indicate linear fit uncertainties.
Without discharge ignition, the reactor cell acts as a capacitance , and its determination is obvious. For explanation of the determination, the measured charge can be expressed by Equation (14):
This is similar to Equation (9) (classical theory); however, Equation (14) is valid for the whole discharge period, and is not necessarily constant. Due to the dependence of the gas gap voltage on time in the active discharge phase, the corresponding part of the -plot is not linear; see the part between Points 1 and 5 in Figure 6a. The gas gap voltage at Moment 5, at the point, can be denoted as the residual gas gap voltage . Then, Equation (17) can be written as follows:
If does not depend on applied voltage amplitude , appears as a straight line with the slope . Therefore, the method suggested in [11], based on the assumption , is valid for volume discharges of different geometries and various applied voltage waveforms [11].
5.3. Discharge Current
The expression for the discharge current (16) contains the gas gap capacitance , which can be expressed by Equation (7):
In order to avoid an increase of the experimental uncertainty due to the direct use of Equation (19), this is substituted in (16). After re-arrangement, the form of the equation suggested in [12] is obtained:
Equation (20) contains only directly-measurable quantities and allows the interpretation of the measured current . The derivative of the applied voltage scaled on capacitance is the current , measurable without discharge ignition; see Equation (1). The difference of the measured current with and without discharge is in brackets in Equation (20). It is proportional (but not equal) to the discharge current. The proportionality coefficient depends on the geometrical properties of the discharge arrangement and .
Note that Expressions (20) and (15) represent the same relation between measured and discharge current. A simple physical meaning can be easily seen from Equation (15), namely that the measured current is the sum of the discharge and displacement current in the gas gap. Equation (20) has more practical impact as it contains only measurable quantities.
5.4. Dissipated Energy and Relevance of the Equivalent Circuit
An examples of the total energies derived from measured current and voltage and instantaneous energies from discharge current and gas gap voltage are shown in Figure 7. This illustrates the advantage of the equivalent circuit approach for the analysis of DBD electrical characteristics. The amplitude of the applied voltage and the geometry of the discharge cell are the same for the data in Figure 7a,b. The integration of the measured current and voltage product:
is the total energy, i.e., the dissipated energy and the energy stored on dielectric barriers. During the falling voltage slope, between Moments 5 and 11 (see also Figure 6), the energy stored on dielectric barriers is released. A part of this energy is not dissipated in the discharge and, thus, leads to the decrease of . The discharge current and the gas gap voltage derived from the equivalent circuit allow one to determine the instantaneous energy dissipated in the DBD:
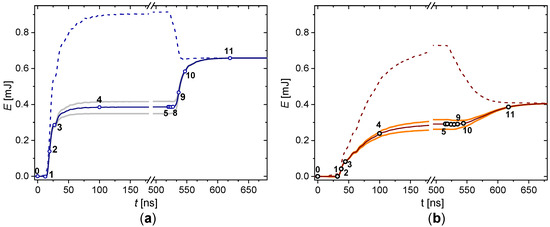
Figure 7.
Instantaneous energy dissipated in DBD excited by square voltage pulses of 9 kV in amplitude with a rise time of 20 ns (a) and 70 ns (b). Experimental data from [13]. Dashed lines are the total energy defined as the integral of the product . Solid lines are the discharge energy defined as the integral of the products . Grey lines correspond to the extreme values of the energy caused by uncertainties in capacitance and displayed in Figure 6b. Enumerated moments for fast switching (a) are the same as in Figure 6a.
Both energies ( and ) merge at the end of the discharge period, confirming that the determination of the energy or power averaged over the discharge period does not require knowledge about the equivalent circuit. However, the determination of the energy dissipated in rising and falling voltage slopes requires knowledge about and . The equivalent circuit allows concluding that (i) a larger portion of energy is consumed during the rising voltage slope and (ii) the energy dissipated in the falling voltage slope drops much more strongly with the decrease of the voltage rise time.
The decrease of the total energy dissipated over the period can be compensated by the increase of the voltage amplitude; however, the discharges with fast and slow voltage pulses will not be the same. The fast voltage pulses generate two comparable discharge pulses during one period, whereas slow voltage pulses couple the major energy during the rising edge of the voltage. Thus, the equivalent circuit approach is an important tool for electrical characterization of DBDs, which provides the instantaneous discharge power.
6. Further Development of the Equivalent Circuit Approach and Open Questions
The equivalent circuit approach is reliable for characterization of DBD geometries, where the capacitances of the reactor do not depend on the operation conditions. The simplest equivalent circuit (Figure 5) contains the non-linear element R, the “black box”. Current measurements in addition to the measurements of the applied voltage compensate the lack of knowledge about this element. The introduction of additional nonlinear elements, such as variable capacitances, is problematic. A large variety of the DBD geometries has been used in applications [6], and the capacitance might depend on the operation conditions for some of them. Examples of such DBD arrangements are shown in Figure 8 schematically and discussed in the following subsections.

Figure 8.
Schematic presentation of DBD arrangements with variable capacitance. (a) Tilted electrodes, (b) surface discharge, and (c) packed bed reactor.
6.1. Discharge with Tilted Electrodes and Partial Discharging
Peeters and van de Sanden [14] investigated a discharge with tilted electrodes under excitation by sinusoidal voltage. The measured charge-voltage characteristics are presented in Figure 9. The -plot for one amplitude of the applied voltage (Figure 9a) is nearly a classical parallelogram. Therefore, it could be assumed that reactor capacitances are constant over the discharge period. However, the corresponding non-linear -plot in Figure 9b could not be inferred in the framework of the classical theory or the simplest equivalent circuit. The authors [14] concluded that the discharge volume grows with the amplitude of the applied voltage, and thus, the reactor capacitance grows, leading to the non-linearity of the -plot.
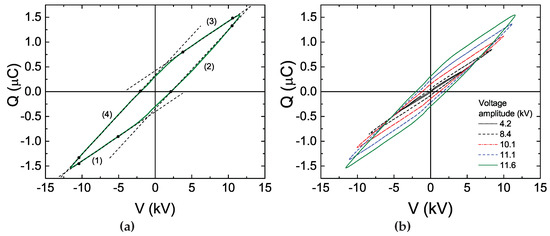
Figure 9.
-plots measured in [14] for DBD arrangement with tilted electrodes. (a) -plot for a single amplitude of the applied voltage. Dashed lines and black circles emphasize the linear parts of the plot. (b) -plots for different voltage amplitudes. ©IOP Publishing. Reproduced from [14] with permission of the authors and IOP Publishing. All rights reserved.
For interpretation of the charge-voltage characteristics, the authors suggested an equivalent circuit where the reactor cell is divided into a discharging () and non-discharging () part; see Figure 10a. The sum of the reactor parts is: . This representation has an additional physical meaning. The non-discharging part can be considered as a parasitic capacitance , and for simplicity, the equivalent circuit in Figure 10b can be considered.
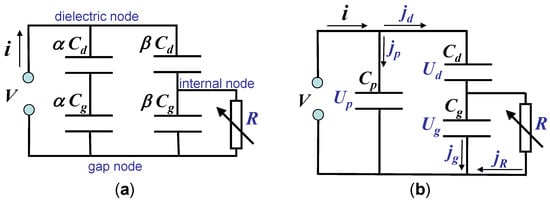
Figure 10.
The equivalent circuit for partial discharging (a) suggested in [14] and the equivalent circuit accounting for parasitic capacitance (b).
The parasitic capacitance will influence the measured slopes of the -plot. The measured slopes will be for the passive phase and for the active phase of the discharge. It can be seen from the circuit in Figure 10b and was discussed also in [14,23]. In order to illustrate the role of equations for gas gap voltage and discharge current , they are re-derived here.
Note that Equations (14) and (20) obtained for the simplest equivalent circuit (Figure 5b) are valid for the circuit with parasitic capacitance (Figure 10b) if the measured current is replaced by a current through the dielectric capacitance: and the same for the charge . Taking into account the relations from the circuit in Figure 10b, it follows:
and introducing notations and for capacitance values measurable from the QV plot gives:
After re-arrangement, the relations for and can be obtained in the following form, similar to Equations (14) and (20):
Both equations depend on the parasitic capacitance via the factor in the curly brackets.The value of often cannot be determined. If the capacitance values measured from the charge-voltage characteristics and are used for the determination of and , then the unknown factor in curly brackets may introduce a significant error. This error grows with the value of . Surprisingly, the instantaneous power, the product of and , does not depend on this factor and can still be evaluated accurately.
Besides the change of the slopes of the -plot, the parasitic capacitance has one more effect on the interpretation of the -plot. In classic theory, the measured charge during the active phase is shifted by the value ; see Figure 3 and Equation (9). Expressing the measured charge from Equation (25), the equation analogous to Equation (9) can be obtained:
Equation (27) indicates that the shift of the charge is proportional to , but it is smaller by the factor in the curly brackets, which depends on the value .
It is important to note the difference between the situations with parasitic capacitance (Figure 10b) and partial discharging (Figure 10a). In Figure 10b, the contribution of to and could not be evaluated due to the unknown value of ; whereas the partial discharging (Figure 10a) assumes experimental conditions when the whole reactor cell is discharged, which enables one to determine and thereafter the coefficients and and all parameters of the circuit for arbitrary experimental conditions.
The corresponding equations for the circuit of the partial discharging (Figure 10a) can be obtained by substitutions , , , and in Equations (24)–(26). The results for the coefficients and were already suggested in [14]:
The equation for the discharge current corresponds to the simplest equivalent circuit [14]; see Equation (20). For the equation for the gas gap voltage, we will use the directly-measured values instead of coefficients and in contrast to [14]:
This form is more similar to the equation for from the simplest equivalent circuit; see Equation (14). In the case , Equation (29) is undetermined [14] because is the voltage on capacitance (see Figure 10a) and .
The idea of the partial discharging is an important stage of development for the equivalent circuit approach. It is applicable when (i) the parasitic capacitance is negligible, (ii) the experimental condition of complete discharging () is reachable (i.e., the results of the simplest equivalent circuit can be used to determine ), and (iii) the measured -plot resembles a parallelogram, indicating constant capacitances during the active discharge phase, as is observed, e.g., for sinusoidal applied voltage with constant gas gap voltage.
6.2. Surface Discharge
The surface discharge is a type of DBD, and the plasma expansion over the dielectric surface depends on the applied voltage amplitude. An example of the experimental data obtained from electrical diagnostics of a surface DBD [15] are presented in Figure 11. The measured -plot of a surface discharge has an almond-like shape (Figure 11a), and the authors suggest to use the charge derivative as a measure of the effective capacitance of the reactor. The examples of obtained values correlated with the voltage waveform are shown in Figure 11b.
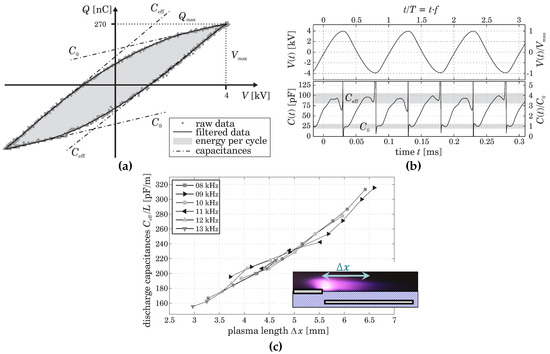
Figure 11.
Experimental data for surface DBD [15]. (a) -plot, (b) applied voltage (top) and charge derivative (bottom) waveforms, and (c) effective capacitance as a function of discharge expansion for different frequencies of the applied voltage, reprinted from [15] with the kind permission of authors and ©AIP Publishing. The added color inset in (c) shows schematically.
In the passive discharge phase, equals , which is indicated as in Figure 11a,b. The passive phase starts just after the moment when the applied voltage reaches the amplitude and is characterized by a straight line with minimal slope in the -plot. During the active discharge phase, increases until it saturates as . The value measured for different amplitudes and frequencies of the applied voltage is shown in Figure 11c as a function of the visual plasma expansion . The values were determined as the length of the luminescent area from photographs taken form the discharge at the different experimental conditions.
However, the charge derivative can be associated with a capacitance only in the classical theory where the gas gap voltage and dielectric capacitance are constant over the discharge cycle. There is no evidence that this assumption is valid if the measured -plot differs from a parallelogram. The alternation of the reactor capacitance during the active discharge phase can be represented as a variable capacitance in the simplest equivalent circuit (see Figure 5), and the charge derivative can be deduced from Equation (17):
The variation of the gas gap voltage alone can make the charge derivative undetermined; see the -plot in Figure 6a between Moments 3 and 4. A variable capacitance makes this consideration even more complex. Note that the expressions for the discharge current are not valid with variable . The substitution of Equation (14) into Equation (15) accounts for additional terms related to the derivative of the dielectric capacitor. In any case, the introduction of a new “black box” into the equivalent circuit makes the evaluation of the discharge properties impossible without additional measurable parameters.
Nevertheless, the charge derivative in Figure 11b has a plateau where the derivative is constant . In this time period, just before the voltage maximum, it can be assumed that and are constant and is associated with the dielectric capacitance . The linear dependence of on the discharge expansion (see Figure 11) is an argument in favor of this assumption.
6.3. Packed Bed Reactor
The electrode arrangement of the packed bed reactor (see Figure 8c) is similar to a DBD with tiled electrodes (see Figure 8a), as well as to the surface discharge (see Figure 8b). These similarities were pointed out in [16], which emphasized that the -plots of packed bed reactors are far away from the classical parallelogram, namely an almond-like shape (similar to surface discharge). The suggested scheme of the -plot formation is presented in Figure 12.
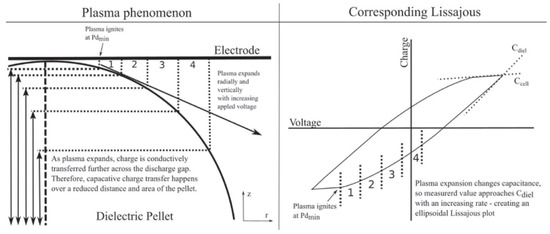
Figure 12.
Formation scheme of the -plot for a packed bed reactor suggested in [16]. Reprinted from [16] with the kind permission of the authors, used under the terms of the Creative Commons Attribution 3.0 license, https://creativecommons.org/licenses/by/3.0/.
The left side of Figure 12 depicts the region of contact between the dielectric pellet and the top electrode. The numerated areas are associated with the moments of discharge expansion over the pellet surface within the voltage period. The discharge expansion should lead to an increase of the effective reactor capacitance, and the selected moments might correlate with parts of the -plots, as shown in Figure 12. Similar to the surface discharge, the charge derivative near the maximum of the voltage amplitude reflects the dielectric capacitance for this voltage amplitude. At higher voltage amplitudes, the discharge occupies a larger surface, and consequently, the effective dielectric capacitance increases. This fact was inferred in terms of the equivalent circuit for partial discharging [14]; see Figure 10a. Thus, the current and voltage waveforms can be used for the estimation of the spread of the discharge, characterized by the coefficients and .
7. Summary
The present work emphasizes that the equivalent circuit approach is a generalization of the classical electric theory of ozonizers [7]. This approach does not introduce additional assumptions, but does not require a constant gas gap voltage during the active discharge phase. This allows one to correlate measured current and voltage waveforms with the discharge current and the gas gap voltage . It is applicable to volume DBDs, where the reactor cell capacitance and the dielectric capacitance are independent of the experimental conditions. In the case of a significant (although with an unknown value) parasitic capacitance, and could not be evaluated separately, however, the product , i.e., the instantaneous power, can still be measured accurately. The instantaneous power allows one to separate the energy dissipated in the discharge from the energy stored on the dielectric surfaces. However, it should not be confused with the dissipated power averaged over the discharge period, which does not require the detailed considerations of the equivalent circuit at all.
The equivalent circuit is applicable for any type of voltage waveform; however, attention should be paid to the technical difficulties of the accurate current measurement. For example, if the discharge current waveform is recorded for sinusoidal applied voltage, a sufficient time interval should be investigated with high sampling rate and resolution of analog-to-digital converter in a large dynamic range. This can be achieved with modern measurement technique (see [24]), but requires significant efforts.
The interpretation of the current and voltage waveform for DBDs with variable capacitance remains challenging, but the equivalent circuit for partial discharging can be used for characterization of the discharge expansion over the dielectric surface.
The range of applicability of the present approach is restricted to the situations where power dissipated in the dielectric is negligible. Dielectric losses strongly depend on the type and temperature of the dielectric, the discharge geometry, as well as the operation frequency. The power losses in the dielectric can be significant even for a glass dielectric and excitation frequency above kilohertz [25]. A further analysis of this point remains for future work.
For completeness, other approaches for electrical diagnostics of DBD should be mentioned: for example, statistical methods based on detailed analysis of the shapes of the current pulses measured in a DBD driven by sinusoidal voltage [24,26,27], modeling of the discharge processes [28,29,30], the simulation of the measured characteristics by defining the properties of lumped electrical elements of the equivalent circuit in XCOS/Scilab or the Simulink environment [31,32,33,34], or optical measurements of the electric field [35,36,37] and electron densities [38,39].
The peculiarity of the approach discussed here is that it is based on current/charge and voltage measurements and does not need any information about operation gas or discharge processes. The main attention was paid to the determination of instantaneous power dissipated in DBDs. The plasma chemistry is activated by electrons with energies above the threshold of the reaction. Thus, the maximum instantaneous power density can determine the chemical pathway and yield of reactions. The monitoring of the instantaneous power also would enable more reliable comparison of DBDs with different electrode configurations, since it accounts for the influence of the reactor geometry on the measured electrical characteristics. Additionally, the discharge current and the gas gap voltage obtained in the framework of the equivalent circuit can be used for consideration of the current voltage characteristics of the discharge [40,41] to gain more comprehensive analysis of the discharge processes.
We hope that the present work will encourage the use of the equivalent circuit approach and stimulate its further development.
Author Contributions
A.V.P. and R.B. have jointly contributed to the work.
Funding
This research received no external funding.
Acknowledgments
A.V.P. is thankful to Milivoje Ivković for the invitation to give a lecture at the 29th Summer School and International Symposium on the Physics of Ionized Gases, Belgrade, Serbia, 2018, which became the main motivation for this contribution. The authors are also thankful to Tomáš Hoder for useful discussions.
Conflicts of Interest
The authors declare no conflict of interest.
Abbreviations
The following abbreviations are used in this manuscript:
| DBD | dielectric barrier discharge |
| -plot | charge voltage characteristics |
| capacitance of the reactor cell without discharge | |
| the capacitance associated with dielectric barriers of the reactor cell, sometimes able to be seen as a reactor capacitance during the active discharge phase | |
| capacitance values obtained from the slopes of the -plot, which can coincide with and if a parasitic capacitance is negligible | |
| the capacitance associated with the gas gap of the reactor cell | |
| , , | measurable values: external current, applied voltage, and charge |
| current measured without discharge (discharge off) | |
| , | equivalent circuit parameters: discharge current and gas gap voltage |
| the values of the gas gap voltage corresponding to the ignition (breakdown) and extinguishing of the discharge | |
| the maximal value of the measured charge | |
| the value of the applied voltage when is reached, often corresponding to the voltage amplitude or the maximum of the applied voltage | |
| the value of the gas gap voltages when is reached, residual voltage | |
| the relative areas of the reactor cell, normalized on the whole area, which are not influenced and occupied by the discharge, respectively | |
| the value of the -plot derivative near to in the case of the sinusoidal applied voltage |
References
- Kogelschatz, U. Advanced Ozone Generation. In Process Technologies for Water Treatment (Earlier Brown Boveri Symposia); Stucki, S., Ed.; Plenum: New York, NY, USA, 1998; pp. 87–118. [Google Scholar] [CrossRef]
- Zhou, A.; Chen, D.; Ma, C.; Yu, F.; Dai, B. DBD Plasma-ZrO2 Catalytic Decomposition of CO2 at Low Temperatures. Catalysts 2018, 8, 256. [Google Scholar] [CrossRef]
- Xuan, K.; Zhu, X.; Cai, Y.; Tu, X. Plasma Oxidation of H2S over Non-stoichiometric LaxMnO3 Perovskite Catalysts in a Dielectric Barrier Discharge Reactor. Catalysts 2018, 8, 317. [Google Scholar] [CrossRef]
- Siemens, W. Ueber die elektrostatische Induction und die Verzögerung des Stroms in Flaschendrähten. Poggendorffs Ann. Phys. Chem. 1857, 102, 66–122. [Google Scholar] [CrossRef]
- Li, Y.; Atif, R.; Chen, K.; Cheng, J.; Chen, Q.; Qiao, Z.; Fridman, G.; Fridman, A.; Ji, H.-F. Polymerization of D-Ribose in Dielectric Barrier Discharge Plasma. Plasma 2018, 1, 13. [Google Scholar] [CrossRef]
- Brandenburg, R. Dielectric barrier discharges: Progress on plasma sources and on the understanding of regimes and single filaments. Plasma Sources Sci. Technol. 2017, 26, 053001. [Google Scholar] [CrossRef]
- Manley, T.C. The electric characteristics of the ozonator discharge. Trans. Electrochem. Soc. 1943, 84, 83–96. [Google Scholar] [CrossRef]
- Lomaev, M.I. Determination of energy input in barrier discharge excilamps. Atmos. Ocean. Opt. 2001, 14, 1005–1008. [Google Scholar]
- Liu, S.; Neiger, M. Excitation of dielectric barrier discharges by unipolar submicrosecond square pulses. J. Phys. D Appl. Phys. 2001, 34, 1632–1638. [Google Scholar] [CrossRef]
- Bibinov, N.K.; Fateev, A.A.; Wiesemann, K. Variations of the gas temperature in He/N2 barrier discharges. Plasma Sources Sci. Technol. 2001, 10, 579–588. [Google Scholar] [CrossRef]
- Pipa, A.V.; Hoder, T.; Koskulics, J.; Schmidt, M.; Brandenburg, R. Experimental determination of dielectric barrier discharge capacitance. Rev. Sci. Instrum. 2012, 83, 075111. [Google Scholar] [CrossRef] [PubMed]
- Pipa, A.V.; Koskulics, J.; Brandenburg, R.; Hoder, T. The simplest equivalent circuit of a pulsed dielectric barrier discharge and the determination of the gas gap charge transfer. Rev. Sci. Instrum. 2012, 83, 115112. [Google Scholar] [CrossRef] [PubMed]
- Pipa, A.V.; Hoder, T.; Brandenburg, R. On the Role of Capacitance Determination Accuracy for the Electrical Characterization of Pulsed Driven Dielectric Barrier Discharges. Contrib. Plasma Phys. 2013, 53, 469–480. [Google Scholar] [CrossRef]
- Peeters, F.J.J.; van de Sanden, M.C.M. The influence of partial surface discharging on the electrical characterization of DBDs. Plasma Sources Sci. Technol. 2015, 24, 015016. [Google Scholar] [CrossRef]
- Kriegseis, J.; Grundmann, S.; Tropea, C. Power consumption, discharge capacitance and light emission as measures for thrust production of dielectric barrier discharge plasma actuators. J. Appl. Phys. 2011, 110, 013305. [Google Scholar] [CrossRef]
- Butterworth, T.; Allen, R.W.K. Plasma-catalyst interaction studied in a single pellet DBD reactor: Dielectric constant effect on plasma dynamics. Plasma Sources Sci. Technol. 2017, 26, 065008. [Google Scholar] [CrossRef]
- Samojlovich, V.G.; Gibalov, I.V.; Kozlov, K.V. Physical Chemistry of the Barrier Discharge; DVS: Düsseldorf, Germany, 1997; pp. 1–261. ISBN 978-3-87155-744-6. [Google Scholar]
- Brandenburg, R.; Navratil, Z.; Jansky, J.; St’ahel, P.; Trunec, D.; Wagner, H.-E. The transition between different modes of barrier discharges at atmospheric pressure. J. Phys. D Appl. Phys. 2009, 42, 085208. [Google Scholar] [CrossRef]
- Buntat, Z.; Harry, J.E.; Smith, I.R. Generation of a Homogeneous Glow Discharge in Air at Atmospheric Pressure. Elektrika 2007, 9, 60–65. [Google Scholar]
- Mildren, R.P.; Carman, R.J. Enhanced performance of a dielectric barrier discharge lamp using short-pulsed excitation. J. Phys. D Appl. Phys. 2001, 34, L1–L6. [Google Scholar] [CrossRef]
- Massines, F.; Gherardi, N.; Naude, N.; Segur, P. Glow and Townsend dielectric barrier discharge in various atmosphere. Plasma Phys. Control Fusion 2005, 47, B577–B588. [Google Scholar] [CrossRef]
- Kogelschatz, U. Fundamentals of Dielectric-Barrier Discharges. In Non-Equilibrium Air Plasmas at Atmospheric Pressure; Becker, K.H., Kogelschatz, U., Schoenbach, K.H., Barker, R.J., Eds.; Institute of Physics: Bristol, UK, 2004; pp. 68–75. ISBN 9780750309622. [Google Scholar]
- Falkenstein, Z.; Coogan, J.J. Microdischarge behavior in the silent discharge of nitrogen-oxygen and water-air mixtures. J. Phys. D Appl. Phys. 1997, 30, 817–825. [Google Scholar] [CrossRef]
- Synek, P.; Zemánek, M.; Kudrle, V.; Hoder, T. Advanced electrical current measurements of microdischarges: Evidence of sub-critical pulses and ion currents in barrier discharge in air. Plasma Sources Sci. Technol. 2018, 27, 045008. [Google Scholar] [CrossRef]
- Cho, G.; Shin, M.; Jeong, J.; Kim, J.; Hong, B.; Koo, J.; Kim, Y.; Choi, E.; Fechner, J.; Letz, M.; et al. Glass tube of high dielectric constant and low dielectric loss for external electrode fluorescent lamps. J. Appl. Phys. 2007, 102, 113307. [Google Scholar] [CrossRef]
- Siliprandi, R.A.; Romana, H.E.; Barni, R.; Riccardi, C. Characterization of the streamer regime in dielectric barrier discharges. J. Appl. Phys. 2008, 104, 063309. [Google Scholar] [CrossRef]
- Tay, W.H.; Yap, S.L.; Wong, C.S. The Electrical Characteristics of a Filamentary Dielectric Barrier Discharge. AIP Conf. Proc. 2010, 1250, 532. [Google Scholar] [CrossRef]
- Takashima, K.; Yin, Z.; Adamovich, I.V. Measurements and kinetic modeling of energy coupling in volume and surface nanosecond pulse discharges. Plasma Sources Sci. Technol. 2013, 22, 015013. [Google Scholar] [CrossRef]
- Akishev, Y.; Aponin, G.; Balakirev, A.; Grushin, M.; Karalnik, V.; Petryakov, A.; Trushkin, N. Spatial-temporal development of a plasma sheet in a surface dielectric barrier discharge powered by a step voltage of moderate duration. Plasma Sources Sci. Technol. 2013, 22, 015004. [Google Scholar] [CrossRef]
- Becker, M.M.; Hoder, T.; Brandenburg, R.; Loffhagen, D. Analysis of microdischarges in asymmetric dielectric barrier discharges in argon. J. Phys. D Appl. Phys. 2013, 46, 355203. [Google Scholar] [CrossRef]
- Pinchuk, M.E.; Stepanova, O.M.; Lazukin, A.V.; Astafiev, A.M. A simple XCOS/SCILAB model of a DBD Plasma jet impinging on a target. In 29th Summer School and International Symposium on the Physics of Ionized Gases; Poparić, G., Obradović, B., Borka, D., Rajković, M., Eds.; Vinča Institute of Nuclear Sciences: Belgrade, Serbia, 2018; pp. 214–217. ISBN 978-86-7306-146-7. [Google Scholar]
- Fang, Z.; Ji, S.; Pan, J.; Shao, T.; Zhang, C. Electrical Model and Experimental Analysis of the Atmospheric-Pressure Homogeneous Dielectric Barrier Discharge in He. IEEE Trans. Plasma Sci. 2012, 40, 883–891. [Google Scholar] [CrossRef]
- Tay, W.H.; Yap, S.L.; Wong, C.S. Electrical Characteristics and Modeling of a Filamentary Dielectric Barrier Discharge in Atmospheric Air. Sains Malays. 2014, 43, 583–594. Available online: http://www.ukm.my/jsm/pdf_files/SM-PDF-43-4-2014/12%20W.H.%20Tay.pdf (accessed on 18 January 2019).
- Valdivia-Barrientos, R.; Pacheco-Sotelo, J.; Pacheco-Pacheco, M.; Benítez-Read, J.S.; López-Callejas, R. Analysis and electrical modelling of a cylindrical DBD configuration at different operating frequencies. Plasma Sources Sci. Technol. 2006, 15, 237–245. [Google Scholar] [CrossRef]
- Simeni, M.S.; Tang, Y.; Frederickson, K.; Adamovich, I.V. Electric field distribution in a surface plasma flow actuator powered by ns discharge pulse trains. Plasma Sources Sci. Technol. 2018, 27, 104001. [Google Scholar] [CrossRef]
- Obrusník, A.; Bílek, P.; Hoder, T.; Šimek, M.; Bonaventura, Z. Electric field determination in air plasmas from intensity ratio of nitrogen spectral bands: I. Sensitivity analysis and uncertainty quantification of dominant processes. Plasma Sources Sci. Technol. 2018, 27, 085013. [Google Scholar] [CrossRef]
- Ivković, S.S.; Obradović, B.M.; Cvetanović, N.; Kuraica, M.M.; Purić, J. Measurement of electric field development in dielectric barrier discharge in helium. J. Phys. D Appl. Phys. 2009, 42, 225206. [Google Scholar] [CrossRef]
- Cvetanović, N.; Galmiz, O.; Synek, P.; Zemánek, M.; Brablec, A.; Hoder, T. Electron density in surface barrier discharge emerging at argon/water interface: Quantification for streamers and leaders. Plasma Sources Sci. Technol. 2018, 27, 025002. [Google Scholar] [CrossRef]
- Konjević, N.; Ivković, M.; Sakan, N. Hydrogen Balmer lines for low electron number density plasma diagnostics. Spectrochim. Acta B 2012, 76, 16–26. [Google Scholar] [CrossRef]
- Naudé, N.; Cambronne, J.-P.; Gherardi, N.; Massines, F. Electrical model and analysis of the transition from an atmospheric pressure Townsend discharge to a filamentary discharge. J. Phys. D Appl. Phys. 2005, 38, 530–538. [Google Scholar] [CrossRef]
- Enache, I.; Naudé, N.; Cambronne, J.-P.; Gherardi, N.; Massines, F. Electrical model of the atmospheric pressure glow discharge (APGD) in helium. Eur. Phys. J. Appl. Phys. 2006, 33, 15–21. [Google Scholar] [CrossRef]
© 2019 by the authors. Licensee MDPI, Basel, Switzerland. This article is an open access article distributed under the terms and conditions of the Creative Commons Attribution (CC BY) license (http://creativecommons.org/licenses/by/4.0/).