Abstract
Runaway electrons present a potential threat to the safe operation of future nuclear fusion large facilities based on the tokamak principle (e.g., ITER). The article presents an implementation of runaway electron current estimations at COMPASS tokamak. The method uses a theoretical method developed by Fujita et al., with the difference in using experimental measurements from EFIT and Thomson scattering. The procedure was explained on the COMPASS discharge number 7298, which has a significant runaway electron population. Here, it was found that at least 4 kA of the plasma current is driven by the runaway electrons. Next, the method aws used on the set of plasma discharges with the variable electron plasma density. The difference in the plasma current was explained by runaway electrons, and their current was estimated using the aforementioned method. The experimental results are compared with the theory and simulation. The comparison presented some disagreements, showing the possible direction for the code development. Additional application on runaway electron energy limit is also addressed.
1. Introduction
In the last decade, nuclear fusion started to shift from science to industry, where the tokamak-based ITER is playing the leading role. Runaway electrons (REs) present a potential threat to the safe operation of the future nuclear fusion power plants based on the tokamak principle. Namely, in the latest issue of ITER Physics Basis [1], REs are considered as the second-highest priority for the ITER disruption mitigation.
COMPASS tokamak [2] is a suitable and low-risk test bed for studying RE disruption physics and RE model benchmarking. However, one of the common missing RE parameters for comparison of experiment and simulation is RE current or RE density. This article addresses this issue for certain cases.
The basic idea behind the used model was reported on ORMAK tokamak by Fujita [3]. In contrast to Fujita’s full-theoretical approach, we implemented experimental data from EFIT [4] and Thomson Scattering [5] to the calculation. The obtained results are in the acceptable range and their application on density scans and RE localization is presented.
The article starts with a description of an experimental observation of the particular discharge. Theoretical models and detailed description of the settings used in the models for comparison with the experiments are then reported. An estimation of the RE current is the first experimental analysis. Subsequently, the influence of the REs on the current ramp-up phase of the discharge is evaluated. Following that, a principle on how to localize RE beam is done in the next section, using the knowledge of the RE beam current and its maximum energy. Finally, discussions and conclusions are given in the last section with an outlook towards expected future works.
2. Experimental Setup: COMPASS Tokamak
The COMPASS tokamak is a compact experimental fusion facility with a major radius m and a minor radius m. The toroidal magnetic field is in the – T range (typically set to T), coming from 16 toroidal field coils. The plasma current can reach up to 400 kA using an air-cored transformer. The range for the electron densities is flexible and is typically in the – m domain. Plasma shaping varies from circular and elliptical to single-null D-shaped ITER-like plasmas. When circular, the plasma is limited by a carbon HFS wall. The regular pulse length is s, although low current circular discharges with RE can last almost 1 s [6,7].
The Thomson Scattering diagnostic system in COMPASS uses two Nd:YAG lasers of wavelength 1064 nm with an energy of 1.5 J for each laser. The whole system is oriented vertically and the scattered light is recorded in the radial direction. Each laser has 30 Hz repetition rate, which offers a ms time resolution if the two lasers are operated equidistantly.
The EFIT reconstruction provides relevant quantities on a 2D mesh cross-section of the poloidal plasma plane solving the Grad–Shafranov equation for plasma MHD equilibrium, constrained by the magnetic diagnostics at the COMPASS tokamak (current measured in plasma and field coils, pick-up coils). Additionally, in the analysis addressed here, a toroidal loop voltage in plasma for computing a maximum RE energy is calculated using METIS [8], a Multi-Element Tokamak-oriented Integrated Simulator.
3. Experiment: High RE Current Discharge
The very first magnetic observations of high RE current in the COMPASS tokamak are reported in Ref. [9] for discharge #7298. The discharge had circular-shaped limited plasma, with toroidal magnetic field T and plasma current kA. The plasma density was lower than m in the plasma core as measured by the Thomson Scattering system.
The COMPASS tokamak is well-supplied with the general plasma measurements, which provided us with the following list of observations in the discharge:
- Loop voltage measured plasma voltage bellow 1 V, while the typical range is –2 V;
- Electron temperature from Thomson Scattering was 1 order of magnitude colder than ordinary tokamak plasma;
- Hard X-ray scintillators observed a significant amount of RE losses;
- Poloidal internal pick-up coils detected inner structure that is moving outwards;
- Vertical field for feedback of horizontal plasma position was increasing during the discharge, even though plasma current was constant;
- EFIT reconstruction of poloidal cross-section depicted plasma shrinkage towards inner side, due to the increasing magnetic pressure coming from the above-mentioned vertical field;
- Plasma pressure in terms of its ratio to the poloidal magnetic field pressure (i.e., poloidal beta ), estimated from EFIT showed unrealistic large values.
All aforementioned information provides us with enough evidence to conclude that RE beam co-existed with the bulk plasma. For more detailed discussion on the measurements, the interested reader is referred to Section 5.1 in Ref. [10].
4. Method: RE Current Calculation
The overestimate of the is exploited here for the estimate of the RE current . The analysis is based on work done by Fujita et al. [3]. Even though the basic principle used here is the same as Fujita’s, the final approach to the calculation is different. While the original paper estimates all necessary parameters theoretically, we use direct measurements from the Thomson scattering and calculations from EFIT reconstruction. In this section, we only address our changes to the method. The main idea behind the Fujita’s model is an estimate of RE pressure from the difference between total plasma pressure (coming from EFIT )
and pure bulk plasma pressure (coming from the Thomson Scattering measured radial profile)
where r is the radial position along the minor radius . Examples of and are presented in Figure 1.
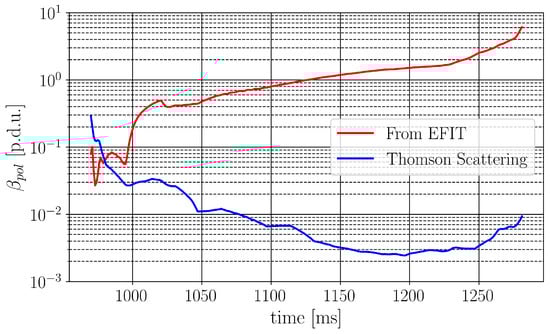
Figure 1.
Poloidal beta estimated by EFIT (red) and from Thomson Scattering (blue) for discharge #7298.
The is calculated as an average from obtained values corresponding to results when following conditions and are satisfied simultaneously, to reduce the propagation of error given by this approach. The first condition specifies the accuracy of Thomson Scattering measurements and thereby defines the minimal threshold necessary to distinguish between and and eliminates the error of Thomson Scattering measurements. The second condition is always valid in the case of non-negligible RE pressure and it is artificially taken as a conservative limit.
Furthermore, is connected to the RE density
where represents average in both spatial and momentum coordinates, is relativistic Lorentz factor, and and denote the RE velocity in the parallel and perpendicular direction to the magnetic field , respectively. By estimating the RE energy, one can estimate the RE density , from which RE current can be approximately derived using the following expression:
where is the area of the RE beam cross-section and is normalized relativistic velocity.
4.1. RE Energy Calculation
The model for maximum obtainable RE energy is based on Ref. [11], where radiation losses are subtracted from the acceleration. It is a 0D model, as there is no dimensional dependency, but only time evolution. Particularly, the lost power by synchrotron radiation and bremsstrahlung radiation are subtracted from the power gained by the RE thanks to the electric field
to obtain the time dependence of . The power gain by the toroidal electric field is simply calculated as
with standing for the plasma major radius. The synchrotron power loss
where and are the classical electron radius and mass, respectively. The curvature radius is calculated using Equation (9) from Ref. [12]:
where at the end of the denominator comes from the average taken over the gyro-motion angle, and where and is the drift velocity
with being the fundamental gyro-frequency. Finally, the angle brackets are making the whole calculation dependent on the RE distribution function (REDF).
4.2. RE Distribution Functions
With mentioning REDF, we need to address its influence on the calculation. The REDFs used by Fujita et al. and utilized here are monoenergetic , uniform , and linear . The definitions of the first three distributions as functions of RE energy w are as follows:
with being the Dirac delta function. The coefficients come from setting the REDF maximum value to 0 at and then normalizing the REDF to 1.
Furthermore, the exponential REDF
is introduced to present a distribution with a steep decrease that could be important if the avalanche mechanism were to dominate. Additionally, two more REDFs are considered here: skewed Gaussian [13]
with and Maxwell–Jüttner [14]
distributions. The (negatively) skewed Gaussian represents a more realistic case of , as it is not a delta-function. In other words, the negatively skewed Gaussian represents REDF where almost all RE tend towards but they never reach it. The Maxwell–Jüttner distribution function is selected as one of the most commonly relativistic distribution functions used in the literature. As all three latter functions have asymptotic behavior towards zero and/or , normalization has to be different than for the former three. Their parameters are set in such a way that asymptotic edge is smaller than , while maximum is located just over .
4.3. Pitch Angle
Equation (3) indicates that the pressure separation through the velocities and implies knowing the pitch angle . Fujita et al. omitted the term and approximated the other one by . However, we consider the influence to be consistent with the estimation of reported in Section 4.1, where plays a role through the parameter .
Table 1 shows the influence of different REDFs on essential parameters for calculation. Firstly, it is important to state that averages presented in Table 1 are done for energy span from 0 to using the mean of the variable, i.e., neglecting the RE limit at lower energies. The error is negligible due to the high reached in the COMPASS discharges. The average energy is calculated for illustration, while can be seen in Equation (4).

Table 1.
Comparison of parameters (RE energy w, relativistic , the term from Equation (3) and drift term for estimation) averaged over w for different REDFs.
From Equation (4), one would expect that the exponential REDF has the smallest for the same , as it has the far smallest . However, due to the term in Equation (3) used for the estimation (by knowing in Equation (3)), the result is opposite. Namely, difference in from Table 1 of an order of magnitude creates much larger difference in estimated between REDFs than does in Equation (4). Therefore, even though the exponential has by far the smallest , it has the largest .
Furthermore, even though two extreme values are taken for to investigate maximum possible effect from the corresponding variations, the difference due to is smaller than a few percent for every REDF. Furthermore, the aforementioned is calculated for rad, as it is zero at rad. Here, a significant influence of the pitch angle on the is observed. Henceforth, is implemented in that is relevant for calculation. Another expected dependence that can be noted from Table 1 is that the most similar REDF to the monoenergetic one is the skewed Gaussian REDF, as their parameters are close to each other.
5. Result: COMPASS Discharge 7298
The pitch angle is taken to be rad as a mean value found in Ref. [15]. The RE minor radius for the RE area calculation is assumed to be constant and equal to 5 cm. The METIS (with the effective ion charge ) data for the electric field and plasma pressure from Thomson scattering are interpolated and extrapolated to the EFIT time scale. As EFIT measures before the first and after the last Thomson scattering measurement, the first and the last point of the extrapolated are approximated to be 95% (arbitrarily taken) of the first and the last Thomson scattering measurement, respectively.
The main result is presented in Figure 2. The estimate of the RE current for different RE distribution functions are presented in Figure 2c and their maximum values are listed in Table 2. The plasma current is plotted in Figure 2b for comparison purposes. In the same figure, Shielded HXR and Standard HXR are also plotted.
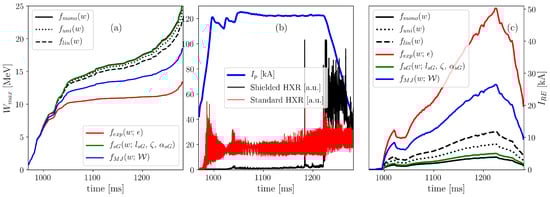
Figure 2.
(a) The maximum kinetic energy of discharge #7298 obtained for the different RE distribution functions: mono-energetic (black solid), uniform (black dotted), linear (black dashed), exponential (red), skewed Gaussian (green) and Maxwell–Jüttner (blue). (b) Time traces of the plasma current (blue), Shielded HXR (black) and Standard HXR (red). (c) Estimated RE current corresponding to each RE distribution function with the same labeling as on (a).
Table 2.
The maxima of and over the time domain of the whole discharge, plotted in Figure 2.
The comparison between the estimate coming from different RE distribution functions described in Section 4.2 is shown in Figure 2a and their maximum values are tabulated in Table 2.
In Figure 2a, one can see that only from the exponential and the Maxwell–Jüttner distribution function are significantly different, as could be expected from the values in Table 1.
Even though from EFIT increases significantly during the ramp-down phase of the discharge, a relatively strong decrease in RE current can be seen in Figure 2c. This is a consequence of the current drop in the total plasma pressure calculation from EFIT in Equation (1). It is interesting that the drop coincides with the RE losses seen from Shielded HXR signal, even though RE losses are not implemented in the calculation. Henceforth, the decrease can be seen as numerical artifact. However, physical interpretation could be an additional RE energy limit due to the RE beam drift, which is reported in Section 7. Next, notice that values span over two orders of magnitude—from a few kA to tens of kA.
Even though is the most unrealistic of all the used RE distribution functions, it gives minimum as , and have extreme values. Therefore, we conclude that at least a few kA of current should definitely be driven by the REs in the COMPASS discharge #7298. However, it is not possible to determine which REDF gives the most accurate RE current estimate from Figure 2.
The above experimental results are compared here with the Kruskal–Bernstein theory [16] and NORSE simulation [17] in Figure 3. Kruskal–Bernstein theory is the analytical solution for growth rate of the Dreicer mechanism of RE generation, whose last shape was derived by Connor and Hastie [16]. The Kruskal–Bernstein equation is a strong function of the . NORSE calculateS only Dreicer mechanism of RE generation and , and are taken as time-varying parameters, while and are constant. Finally, the is computed by multiplying the total electron density from measurements with the RE fraction calculated by NORSE.
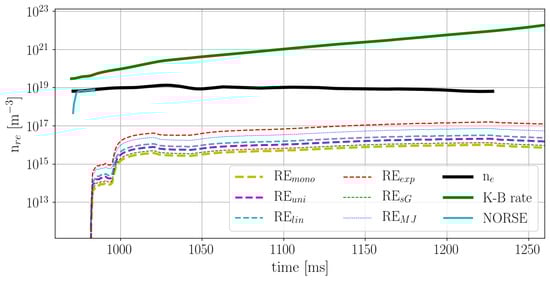
Figure 3.
Time traces of total electron density (black) measured with interferometer, RE density from Kruskal–Bernstein theory (green), RE density from NORSE simulation (cyan) and RE densities corresponding to RE currents from Figure 2c (dashed lines).
When applied to the COMPASS discharge #7298, the Kruskal–Bernstein theory predicts RE density larger by 1–3 orders of magnitude than the total . This is a non-physical result of course and we consider this theory not relevant for this particular case. Furthermore, NORSE reaches slide-away regime (i.e., when all electrons runaway) at the very beginning of the discharge. Such early slide-away regime is not supported by the experimental results.
The possible reasons for the overestimating results from Kruskal–Bernstein theory and NORSE simulation could result from overestimating the electric field by METIS or from too high sensitivity of the theories on the parameter. Moreover, RE energy calculation used here is also simplistic and EFIT results could be misleading in the presence of the RE.
6. Application: RE Influence on Ramp-Up
REs are frequently generated during the current ramp-up phase in the COMPASS tokamak. Here, the influence of the RE generation on the plasma current at the end of the ramp-up phase is investigated using the reported model for the RE current .
The density scan in the range 1– m was done during the second RE campaign. The scan consisted of 10 COMPASS discharges from #8552 to #8561. Plasma current was feedback controlled to 130 kA during the flat-top phase and the toroidal magnetic field was T for all discharges.
Figure 4a presents an estimate of , which is more suitable for comparison of the method reported here with Kruskal–Bernstein and NORSE theories. The three discharges were chosen to cover the standard tokamak discharge (#8553), the slide-away regime (#8559) and the transient between the previous two (#8555). To avoid redundant lines, was calculated only for the two most extreme REDF—the monoenergetic and the exponential ones.
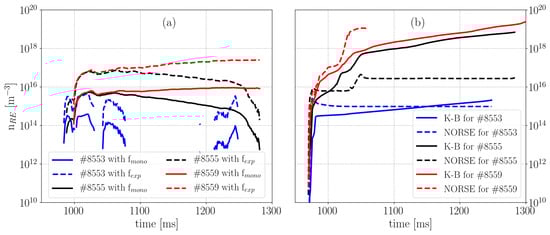
Figure 4.
Time traces of the estimated for the three typical discharges: #8553 (blue, standard discharge), #8555 (black, intermediate case) and #8559 (red, slide-away regime). (a) Estimates from measurements where for each discharge the two most extreme REDF: the monoenergetic (full line) and the exponential (dashed line). (b) Estimates from Kruskal–Bernstein theory (solid line) and NORSE simulation (dashed line).
The discharge #8553 has lower by an order of magnitude during the ramp-up phase than the other two discharges (see Figure 4). Surprisingly, discharges #8555 and #8559 have similar at the beginning of the discharge. However, drops for the former discharge as expected from the missing rise from EFIT and density drop, as observed by the Thomson Scattering system. Finally, the corresponding RE current at the end of the ramp-up phase for discharges #8553, #8555 and #8559 are – kA, – kA and – kA, respectively. Therefore, the expected trend is observed. Note that the non-continuous line for discharge #8553 comes from the defined thresholds of the method.
To complete the analyses, Kruskal–Bernstein theory and NORSE code were used to theoretically estimate . The results are presented in Figure 4b.
First to notice from Figure 4 is that both theories have the expected trend in density of RE rising from #8553 to #8559. Differently from discharge #7298 in Figure 3, the Kruskal–Bernstein theory does not give over , while do rise towards at the end of discharge for #8555 and #8559. For these two discharges, the Kruskal–Bernstein theory does not show a significant difference in . On the other hand, NORSE estimates that those two discharges are quite different—according to this code #8559 reaches slide-away regime already around 1060 ms, which is probably too early.
Interestingly, in the case of standard discharge #8553, both codes seem to approximately agree in the order of magnitude with the experimental (between and m). The same is valid when the NORSE simulation is compared with experimental using for discharge #8555. However, the NORSE code is not made to predict the drop of , clearly observed in Figure 4a and from from the EFIT reconstruction.
7. Application: RE Localisation
In this section, we investigate the RE energy limit from the RE outward drift through the analytically derived calculation reported by Zehrfeld [18].
Zehrfeld’s analysis provides the as a function of the normalized minor radius . One of the main messages from this analysis is that profile can have (depending on machine and plasma parameters) maximum value inside plasma (i.e., —dashed coinciding colored lines in Figure 5), which indicates that REs of certain energy can loose confinement before they reach the plasma edge (i.e., the last closed flux surface) that is represented by in Figure 5. Namely, peaking parameter of the plasma current profile m1 proved to be the most significant parameter for RE confinement in respect to the drift. Therefore, knowledge of the profile can be used for localization of the RE beam. Knowing at a given time of the discharge, one can find the minimum minor radius (solid colored lines in Figure 5) where , corresponding to the minor radius below which REs with energy cannot be confined.
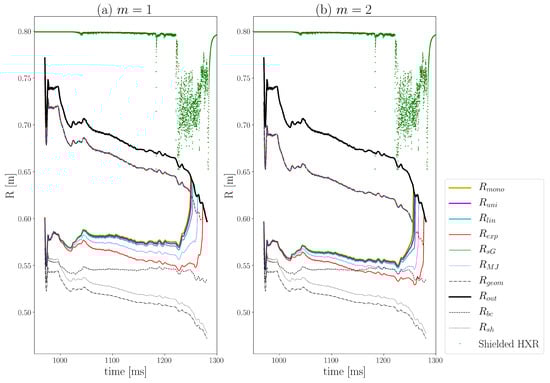
Figure 5.
Time traces for lower (solid colored lines) and upper (dashed coinciding colored lines) limits of RE major radii for all six REDFs are presented for discharge #7298. For orientation, major radius of plasma geometrical center (black dash-dotted line), outer plasma major radius (black solid line), plasma current barycenter (black dashed line) and theoretical bulk plasma barycenter from Shafranov shift (black dotted line) are added. Beside all major radii, the Shielded HXR signal (green points) is presented. Figure is plotted for two of current profile factor m values: (a) ; and (b) .
Generally, the major radius of plasma geometrical center and bulk plasma barycenter do not coincide in the tokamak plasma due to the Shafranov shift [19]. Additionally, there is RE beam present in the observed discharges shifting the plasma current barycenter more outwards. All these radii , and are taken from EFIT and shown in Figure 5 for orientation purposes.
EFIT predicts while Zehrfeld’s method assumes m to be an integer. Accordingly, we used both rounding integers values: and .
One can notice from Figure 5 that RE orbits are predicted in minor radius of 10–15 cm, which is not very limiting knowing that the COMPASS minor plasma radius is around 20 cm. RE orbits are localized more inside the plasma for higher m, as could be expected due to the higher peaking of profile. For the same reason, later significant losses of high energy RE are expected for higher m, which can be seen by slightly delayed equalization of the RE radius with (for 5–15 ms) for factor of current profile than in the case. However, both timings for significant high energy RE losses are a few tens of milliseconds after the Shielded HXR observes the losses, showing that these losses are probably due to the RE outward drift as is decreasing and connection of strong Shielded HXR signal and ramp-down phase is indeed observed in Figure 2b. On the other hand, this does not explain the interaction on the high-field side seen by the visible cameras.
8. Conclusions
Understanding RE physics gives us better prediction towards understanding RE generation and mitigation in ITER. One basic RE parameter to compare model and experiment is the RE current. Therefore, we have presented here one method for estimating the RE current in the COMPASS tokamak.
The pitch angle showed to be relevant for the RE energy calculation, which plays an internal role in the RE current estimate method. Implementation of the method on the COMPASS discharge #7298 shows that at least a few kA of the total plasma current is driven by the RE. The method is then used for -scan and showed the different amount of RE current present in the plasma at the expected trend. Namely, discharges with lower density have higher RE current. Commonly used Kruskal–Bernstein theory does not appear suitable for high RE current discharges. NORSE, a code built for such discharges, showed to be more sensitive to plasma parameters, but further development is necessary for better prediction of the RE dynamics. Applying the knowledge of RE current to the RE drift energy limit, a crucial role of the limit at the final stage of the COMPASS plasma discharge, is reported.
At the first instance, an implementation of the RE current into the equilibrium simulation is left for future work on the COMPASS tokamak. Furthermore, theories used here are also the most commonly used model basis in the RE research community. However, they obviously overestimate the number of REs. Their further development is far beyond the scope of this article. The results obtained from theories are here to show the issue is oversimplified and demonstrate the need for a better modeling of the RE generation.
Author Contributions
Conceptualization, M.V.; methodology, M.V.; software, M.V., O.F., E.M. and COMPASS IT Team; validation, M.V.; formal analysis, M.V.; investigation, M.V., O.F. and J.M.; resources, J.M.; data curation, M.V. and J.M.; writing—original draft preparation, M.V.; writing—review and editing, M.V., O.F., J.M, and E.M; visualization, M.V. and O.F.; supervision, J.M.; project administration, J.M. and COMPASS department; and funding acquisition, J.M., EUROfusion and COMPASS department.
Funding
This research was funded by Ministry of Education, Youth and Sport of the Czech Republic (MEYS) grant number LM2011021 that supported COMPASS operation and by the Euratom research and training programme 2014-2018 under grant agreement No 633053 with the Co-fund by MEYS project number 8D15001.
Acknowledgments
Erasmum Mundus Joint Doctoral Collage in Fusion Science and Engineering (often abbreviated as “Fusion-DC”) is acknowledged for providing the necessary infrastructure to the first author for his studies. Moreover, we would like to thank to the whole COMPASS team of scientist, engineers and technicians for their fruitful collaboration.
Conflicts of Interest
The founding sponsors had no role in the design of the study; in the collection, analyses, or interpretation of data; in the writing of the manuscript, or in the decision to publish the results. In addition, the views and opinions expressed in this work do not necessarily reflect those of the European Commission.
Abbreviations
The following abbreviations are used in this manuscript:
| RE | Runaway Electron |
| REDF | Runaway Electron Distribution Function |
| HXR | Hard X-ray |
References
- Hender, T.; Wesley, J.; Bialek, J.; Bondeson, A.; Boozer, A.; Buttery, R.; Garofalo, A.; Goodman, T.; Granetz, R.; Gribov, Y.; et al. Chapter 3: MHD stability, operational limits and disruptions. Nucl. Fusion 2007, 47, S128. [Google Scholar] [CrossRef]
- Pánek, R.; Adámek, J.; Aftanas, M.; Bílková, P.; Böhm, P.; Cahyna, P.; Cavalier, J.; Dejarnac, R.; Dimitrova, M.; Grover, O.; et al. Status of the COMPASS tokamak and characterization of the first H-mode. Plasma Phys. Control. Fusion 2016, 58, 014015. [Google Scholar] [CrossRef]
- Fujita, T.; Fuke, Y.; Yoshida, Z.; Inoue, N.; Tanihara, T.; Mori, K.; Fukao, M.; Tomita, Y.; Mohri, A. High-Current Runaway Electron Beam in a Tokamak Plasma. J. Phys. Soc. Jpn. 1991, 60, 1237–1246. [Google Scholar] [CrossRef]
- Havlíček, J.; Hronová, O. Magnetic Diagnostics of COMPASS Tokamak. 2010. Available online: http://www.ipp.cas.cz/vedecka_struktura_ufp/tokamak/tokamak_compass/diagnostics/magneticka-diagnostika/index.html (accessed on 16 January 2019).
- Bilkova, P.; Aftanas, M.; Bohm, P.; Weinzettl, V.; Sestak, D.; Melich, R.; Stockel, J.; Scannell, R.; Walsh, M. Design of new Thomson scattering diagnostic system on COMPASS tokamak. Nucl. Instrum. Methods Phys. Res. Sect. A 2010, 623, 656–659. [Google Scholar] [CrossRef]
- Mlynar, J.; Ficker, O.; Vlainic, M.; Weinzettl, V.; Imrisek, M.; Paprok, R.; Rabinski, M.; Jakubowski, M.; the COMPASS Team. Effects of Plasma Control on Runaway Electrons in COMPASS Tokamak. In Proceedings of the 42nd EPS Conference on Plasma Physics, Lisbon, Portugal, 22–26 June 2015; Number P4.102 in ECA. Volume 39E. [Google Scholar]
- Ficker, O.; Mlynar, J.; Vlainic, M.; Macusova, E.; Vondracek, P.; Weinzettl, V.; Urban, J.; Cerovsky, J.; Cavalier, J.; Havlicek, J.; et al. Long slide-away discharges in the COMPASS tokamak. In Proceedings of the 58th Annual Meeting of the APS Division of Plasma Physics, San Jose, CA, USA, 31 October–4 November 2016; Volume 61. [Google Scholar]
- Artaud, J.; Imbeaux, F.; Garcia, J.; Giruzzi, G.; Aniel, T.; Basiuk, V.; BÃcoulet, A.; Bourdelle, C.; Buravand, Y.; Decker, J.; et al. Metis: a fast integrated tokamak modelling tool for scenario design. Nucl. Fusion 2018, 58, 105001. [Google Scholar] [CrossRef]
- Vlainić, M.; Mlynář, J.; Weinzettl, V.; Papřok, R.; Imrísek, M.; Ficker, O.; Vondráček, P.; Havlíček, J. First Dedicated Observations of Runaway Electrons in COMPASS Tokamak. Nukleonika 2015, 60, 249–255. [Google Scholar] [CrossRef][Green Version]
- Vlainic, M. Study of Runaway Electrons at COMPASS Tokamak. Ph.D. Thesis, Ghent University, Ghent, Belgium, 2017. [Google Scholar]
- Yu, J.H.; Hollmann, E.M.; Commaux, N.; Eidietis, N.W.; Humphreys, D.A.; James, A.N.; Jernigan, T.C.; Moyer, R.A. Visible imaging and spectroscopy of disruption runaway electrons in DIII-D. Phys. Plasmas 2013, 20, 042113. [Google Scholar] [CrossRef]
- Pankratov, I.M. Analysis of the synchrotron radiation spectra of runaway electrons. Plasma Phys. Rep. 1999, 25, 145–148. [Google Scholar]
- Azzalini, A. The Skew-Normal and Related Families; Institute of Mathematical Statistics Monographs, Cambridge University Press: Cambridge, UK, 2013. [Google Scholar]
- Jüttner, F. Das Maxwellsche Gesetz der Geschwindigkeitsverteilung in der Relativtheorie. Ann. Phys. 1911, 339, 856–882. [Google Scholar] [CrossRef]
- Vlainic, M.; Vondracek, P.; Mlynar, J.; Weinzettl, V.; Ficker, O.; Varavin, M.; Paprok, R.; Imrisek, M.; Havlicek, J.; Panek, R.; et al. Synchrotron Radiation from Runaway Electrons in COMPASS Tokamak. In Proceedings of the 42nd EPS Conference on Plasma Physics, Lisbon, Portugal, 22–26 June 2015; Number P4.108 in ECA. Volume 39E. [Google Scholar]
- Connor, J.; Hastie, R. Relativistic limitations on runaway electrons. Nucl. Fusion 1975, 15, 415. [Google Scholar] [CrossRef]
- Stahl, A.; Landreman, M.; Embréus, O.; Fülöp, T. NORSE: A solver for the relativistic non-linear Fokker–Planck equation for electrons in a homogeneous plasma. Comput. Phys. Commun. 2017, 212, 269–279. [Google Scholar] [CrossRef]
- Zehrfeld, H.P.; Fussmann, G.; Green, B.J. Electric field effects on relativistic charged particle motion in Tokamaks. Plasma Phys. 1981, 23, 473. [Google Scholar] [CrossRef]
- Shafranov, V.D. Equilibrium of a toroidal pinch in a magnetic field. Soviet Atomic Energy 1962, 13, 1149–1158. [Google Scholar] [CrossRef]
| 1 | m is plasma current profile peaking factor, defined as: . |


© 2019 by the authors. Licensee MDPI, Basel, Switzerland. This article is an open access article distributed under the terms and conditions of the Creative Commons Attribution (CC BY) license (http://creativecommons.org/licenses/by/4.0/).