A New Procedure to Determine the Plasma Parameters from a Genetic Algorithm Coupled with the Spectral Line-Shape Code PPP


Abstract
1. Introduction
2. A Genetic Algorithm Coupled with a Stark Broadened Line-Shape Model
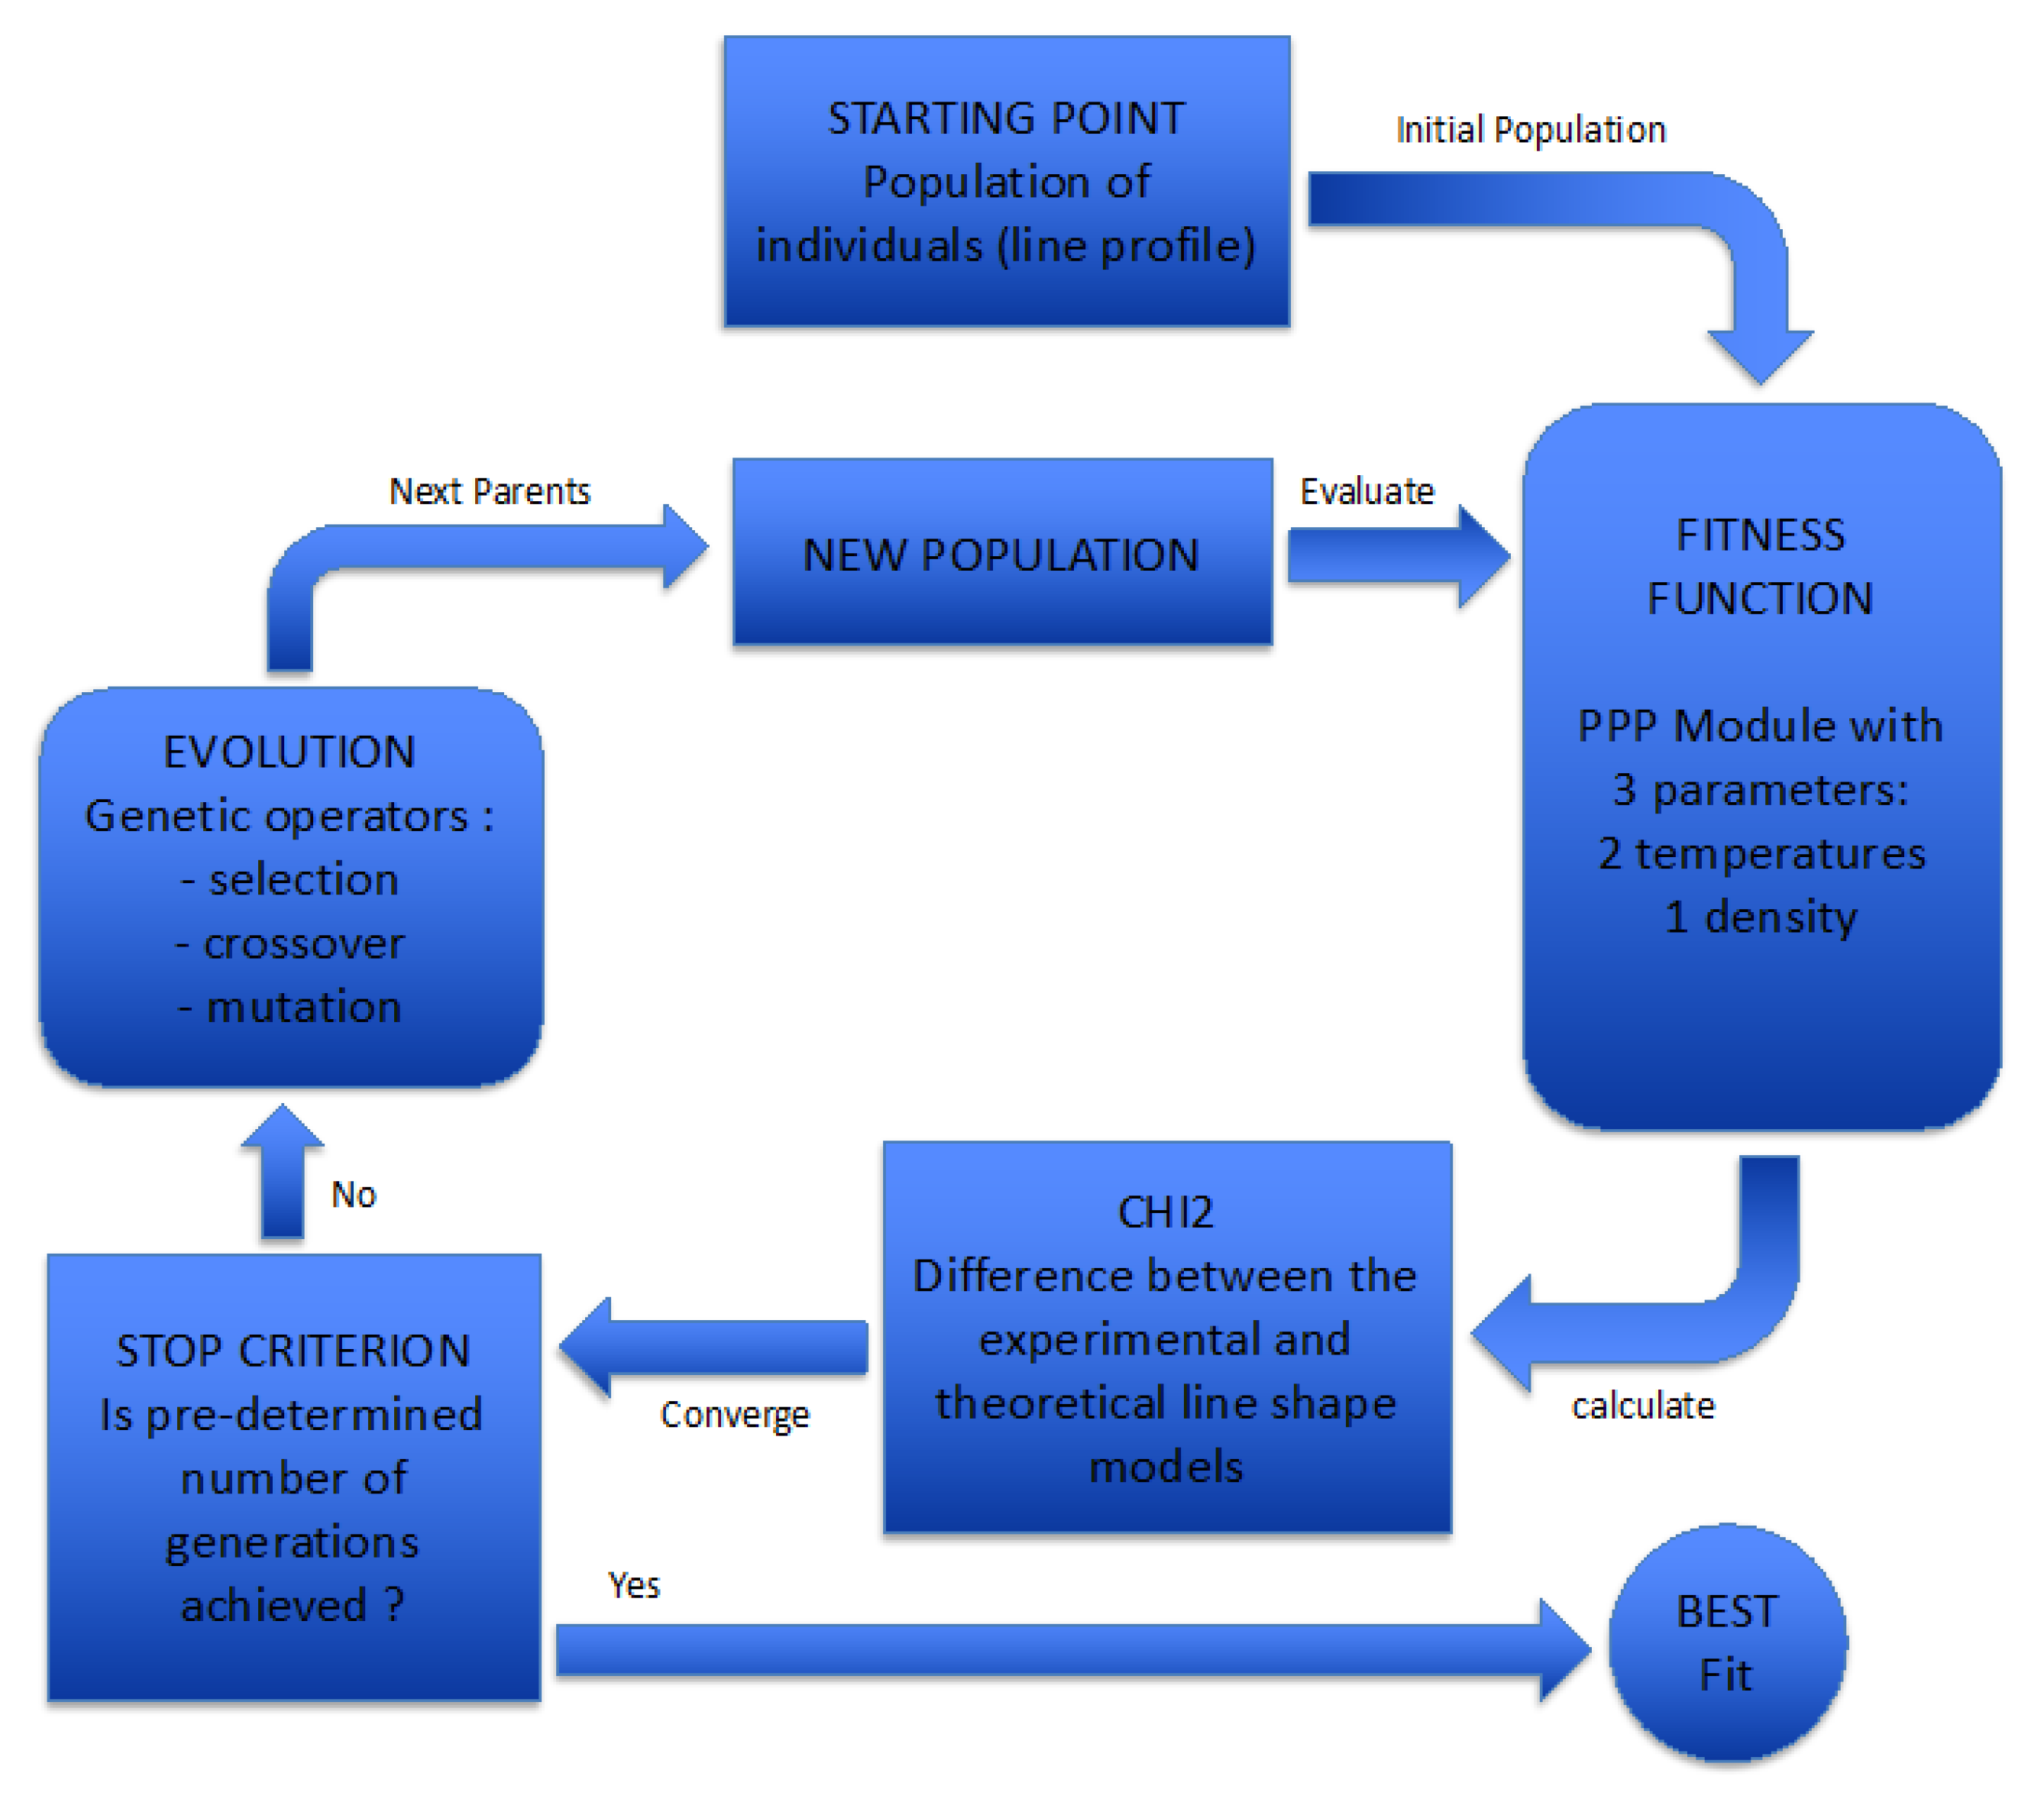
2.1. Genetic Algorithm
2.2. Spectral Line Shape Calculations
3. Analysis of the Hydrogen Balmer-β and He I 492.2 nm Lines in Corona Discharge Plasma
3.1. Corona Discharges Excited in Gaseous Helium: Experimental Setup and Methodology
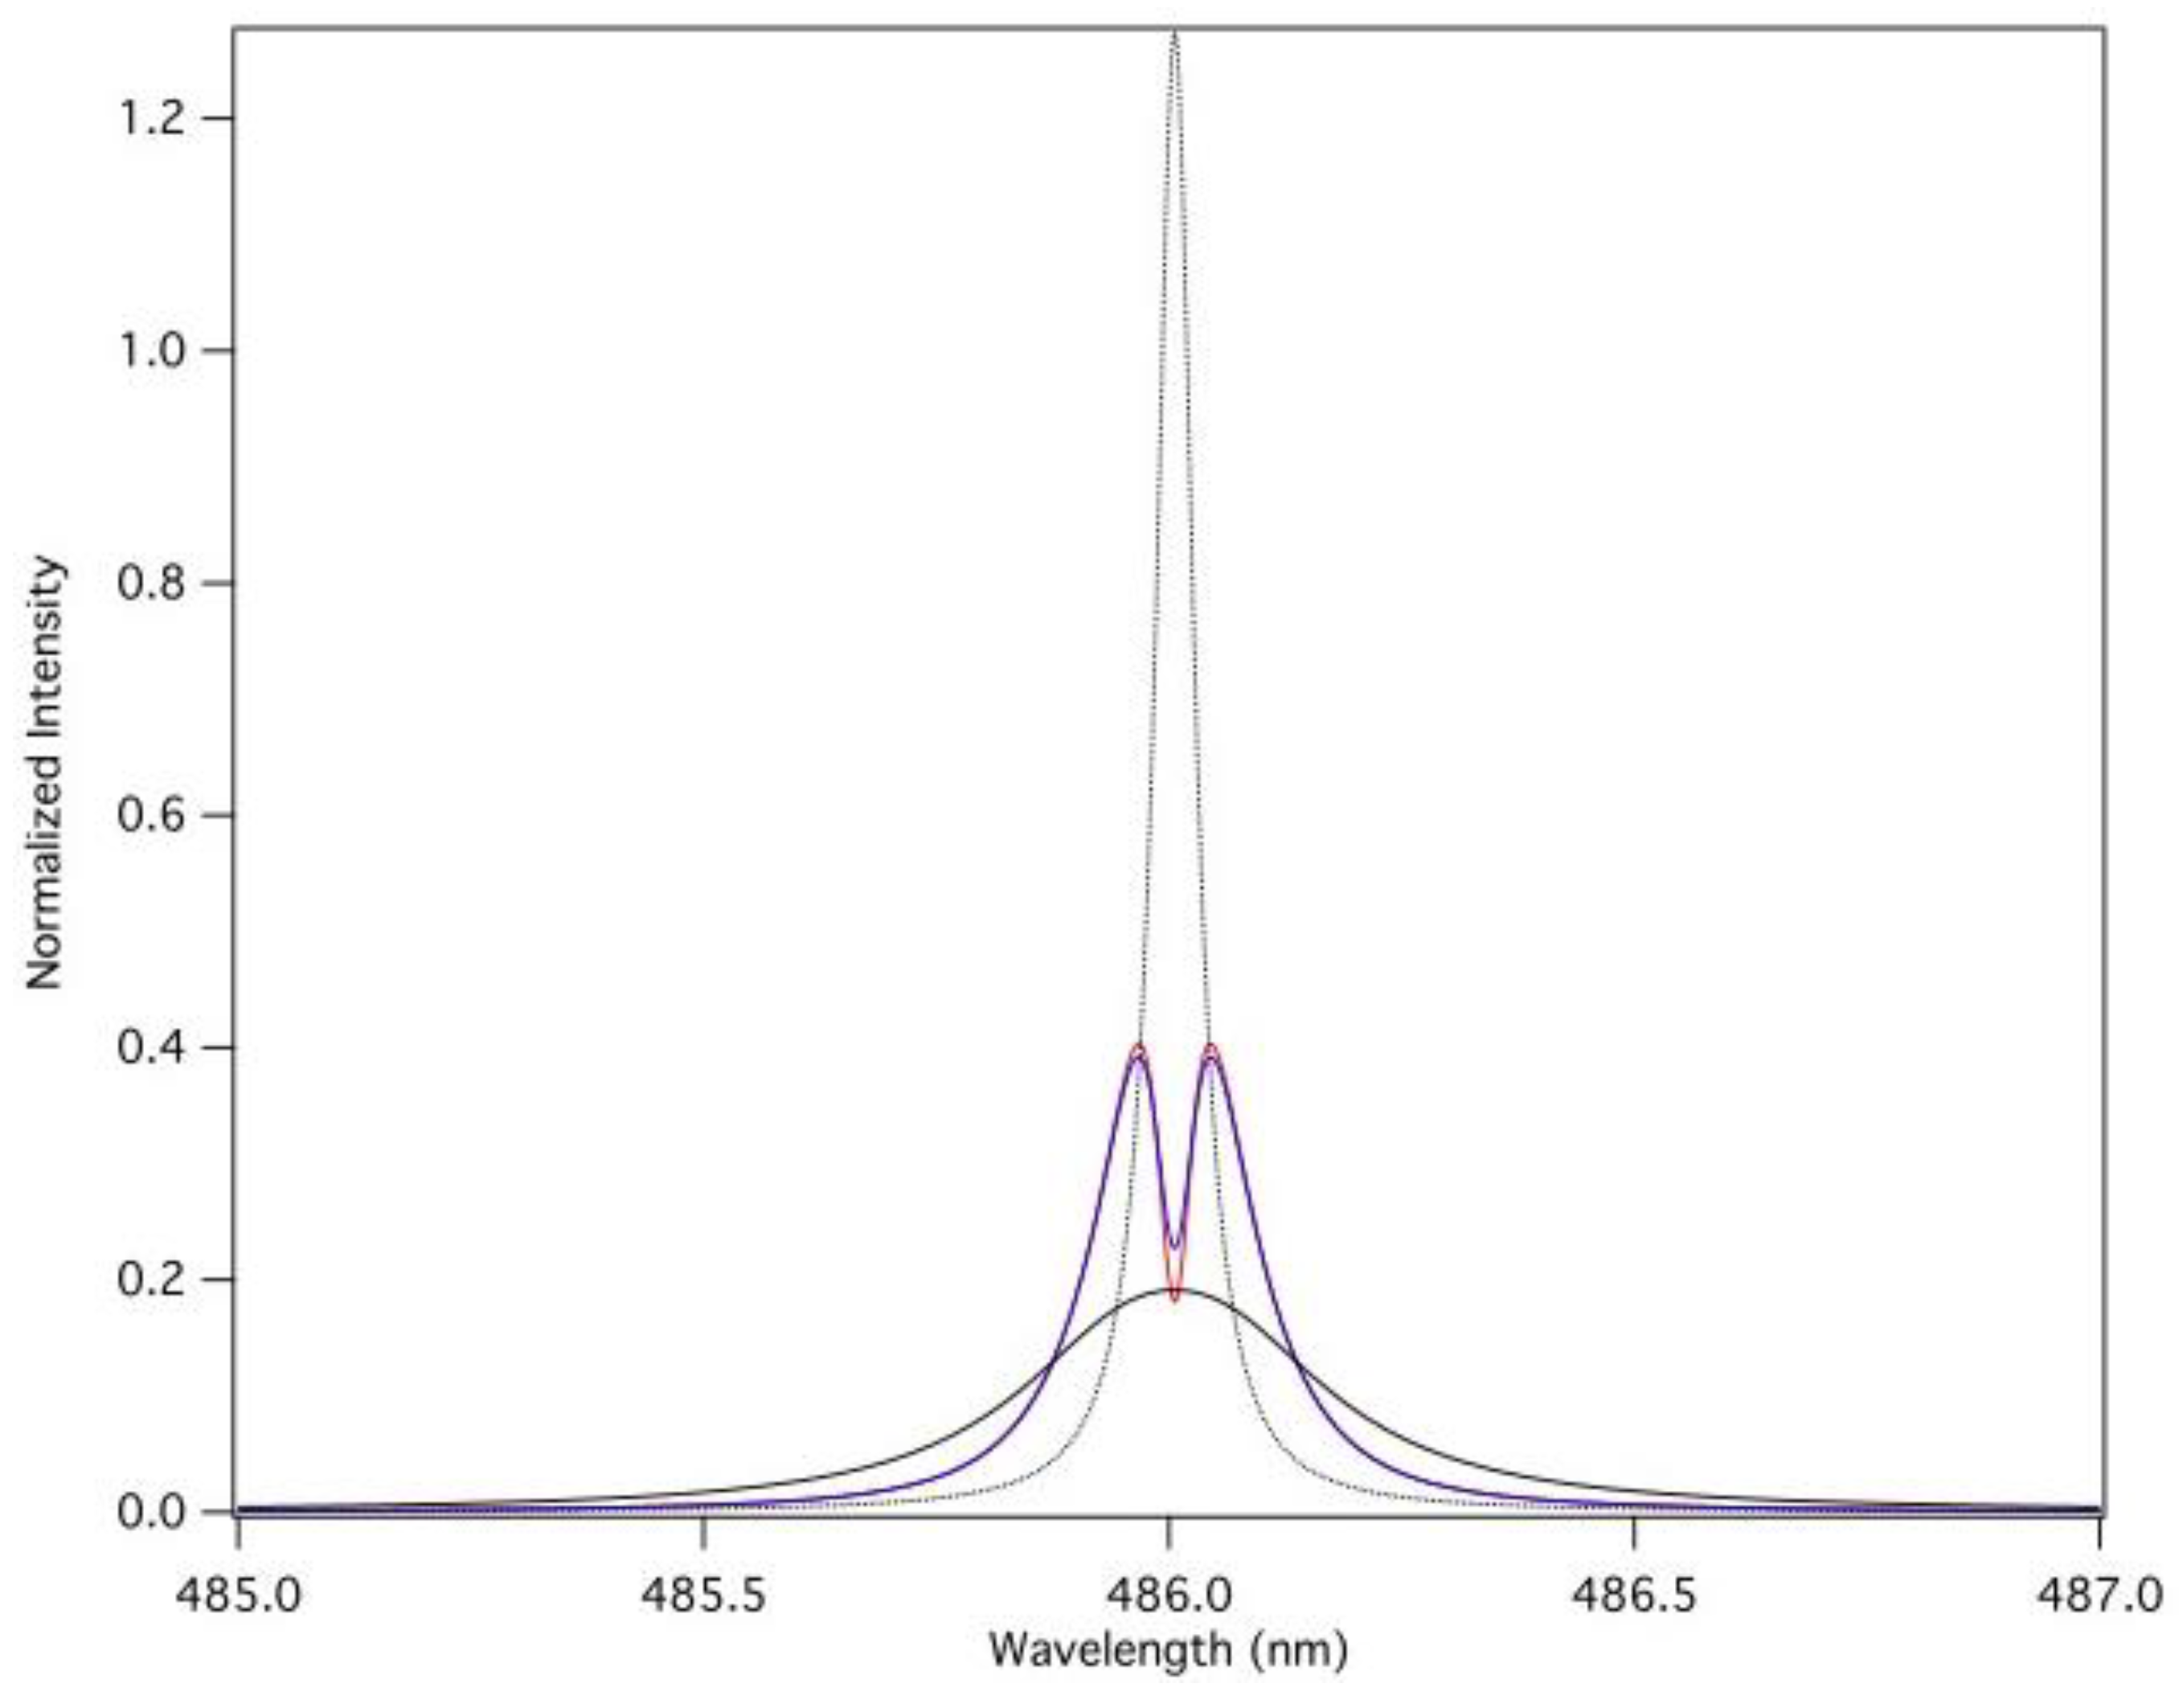
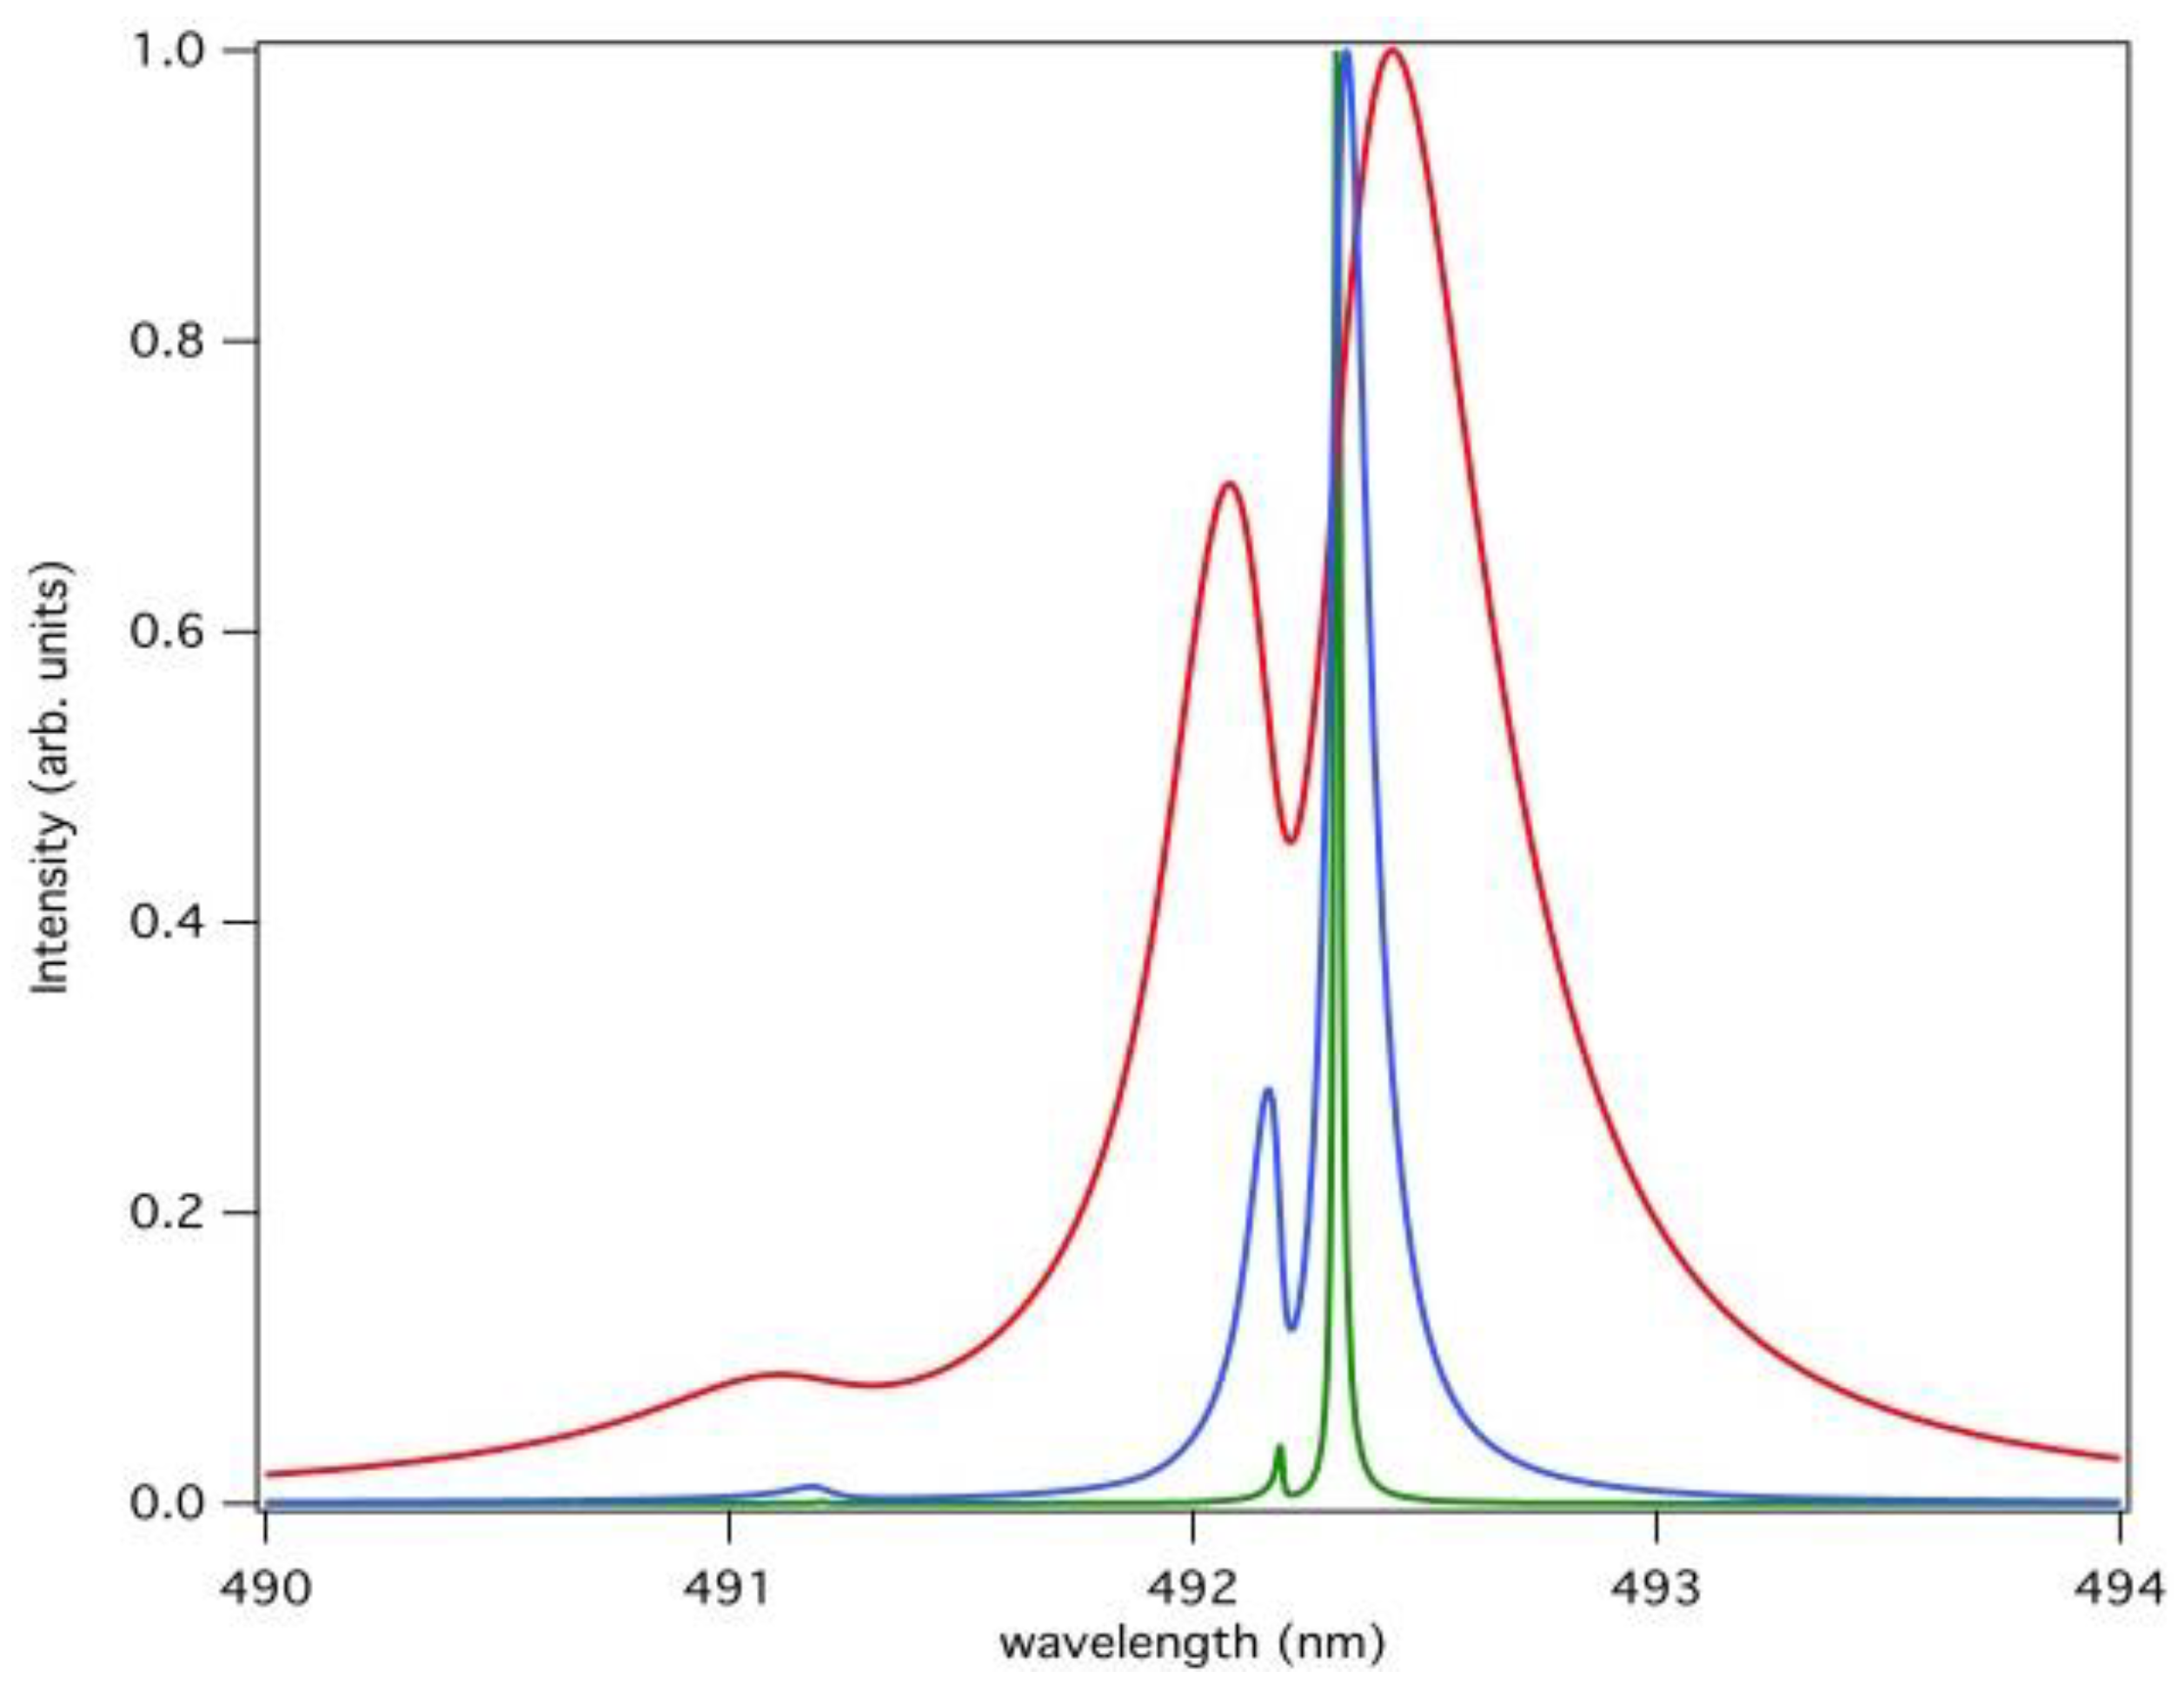
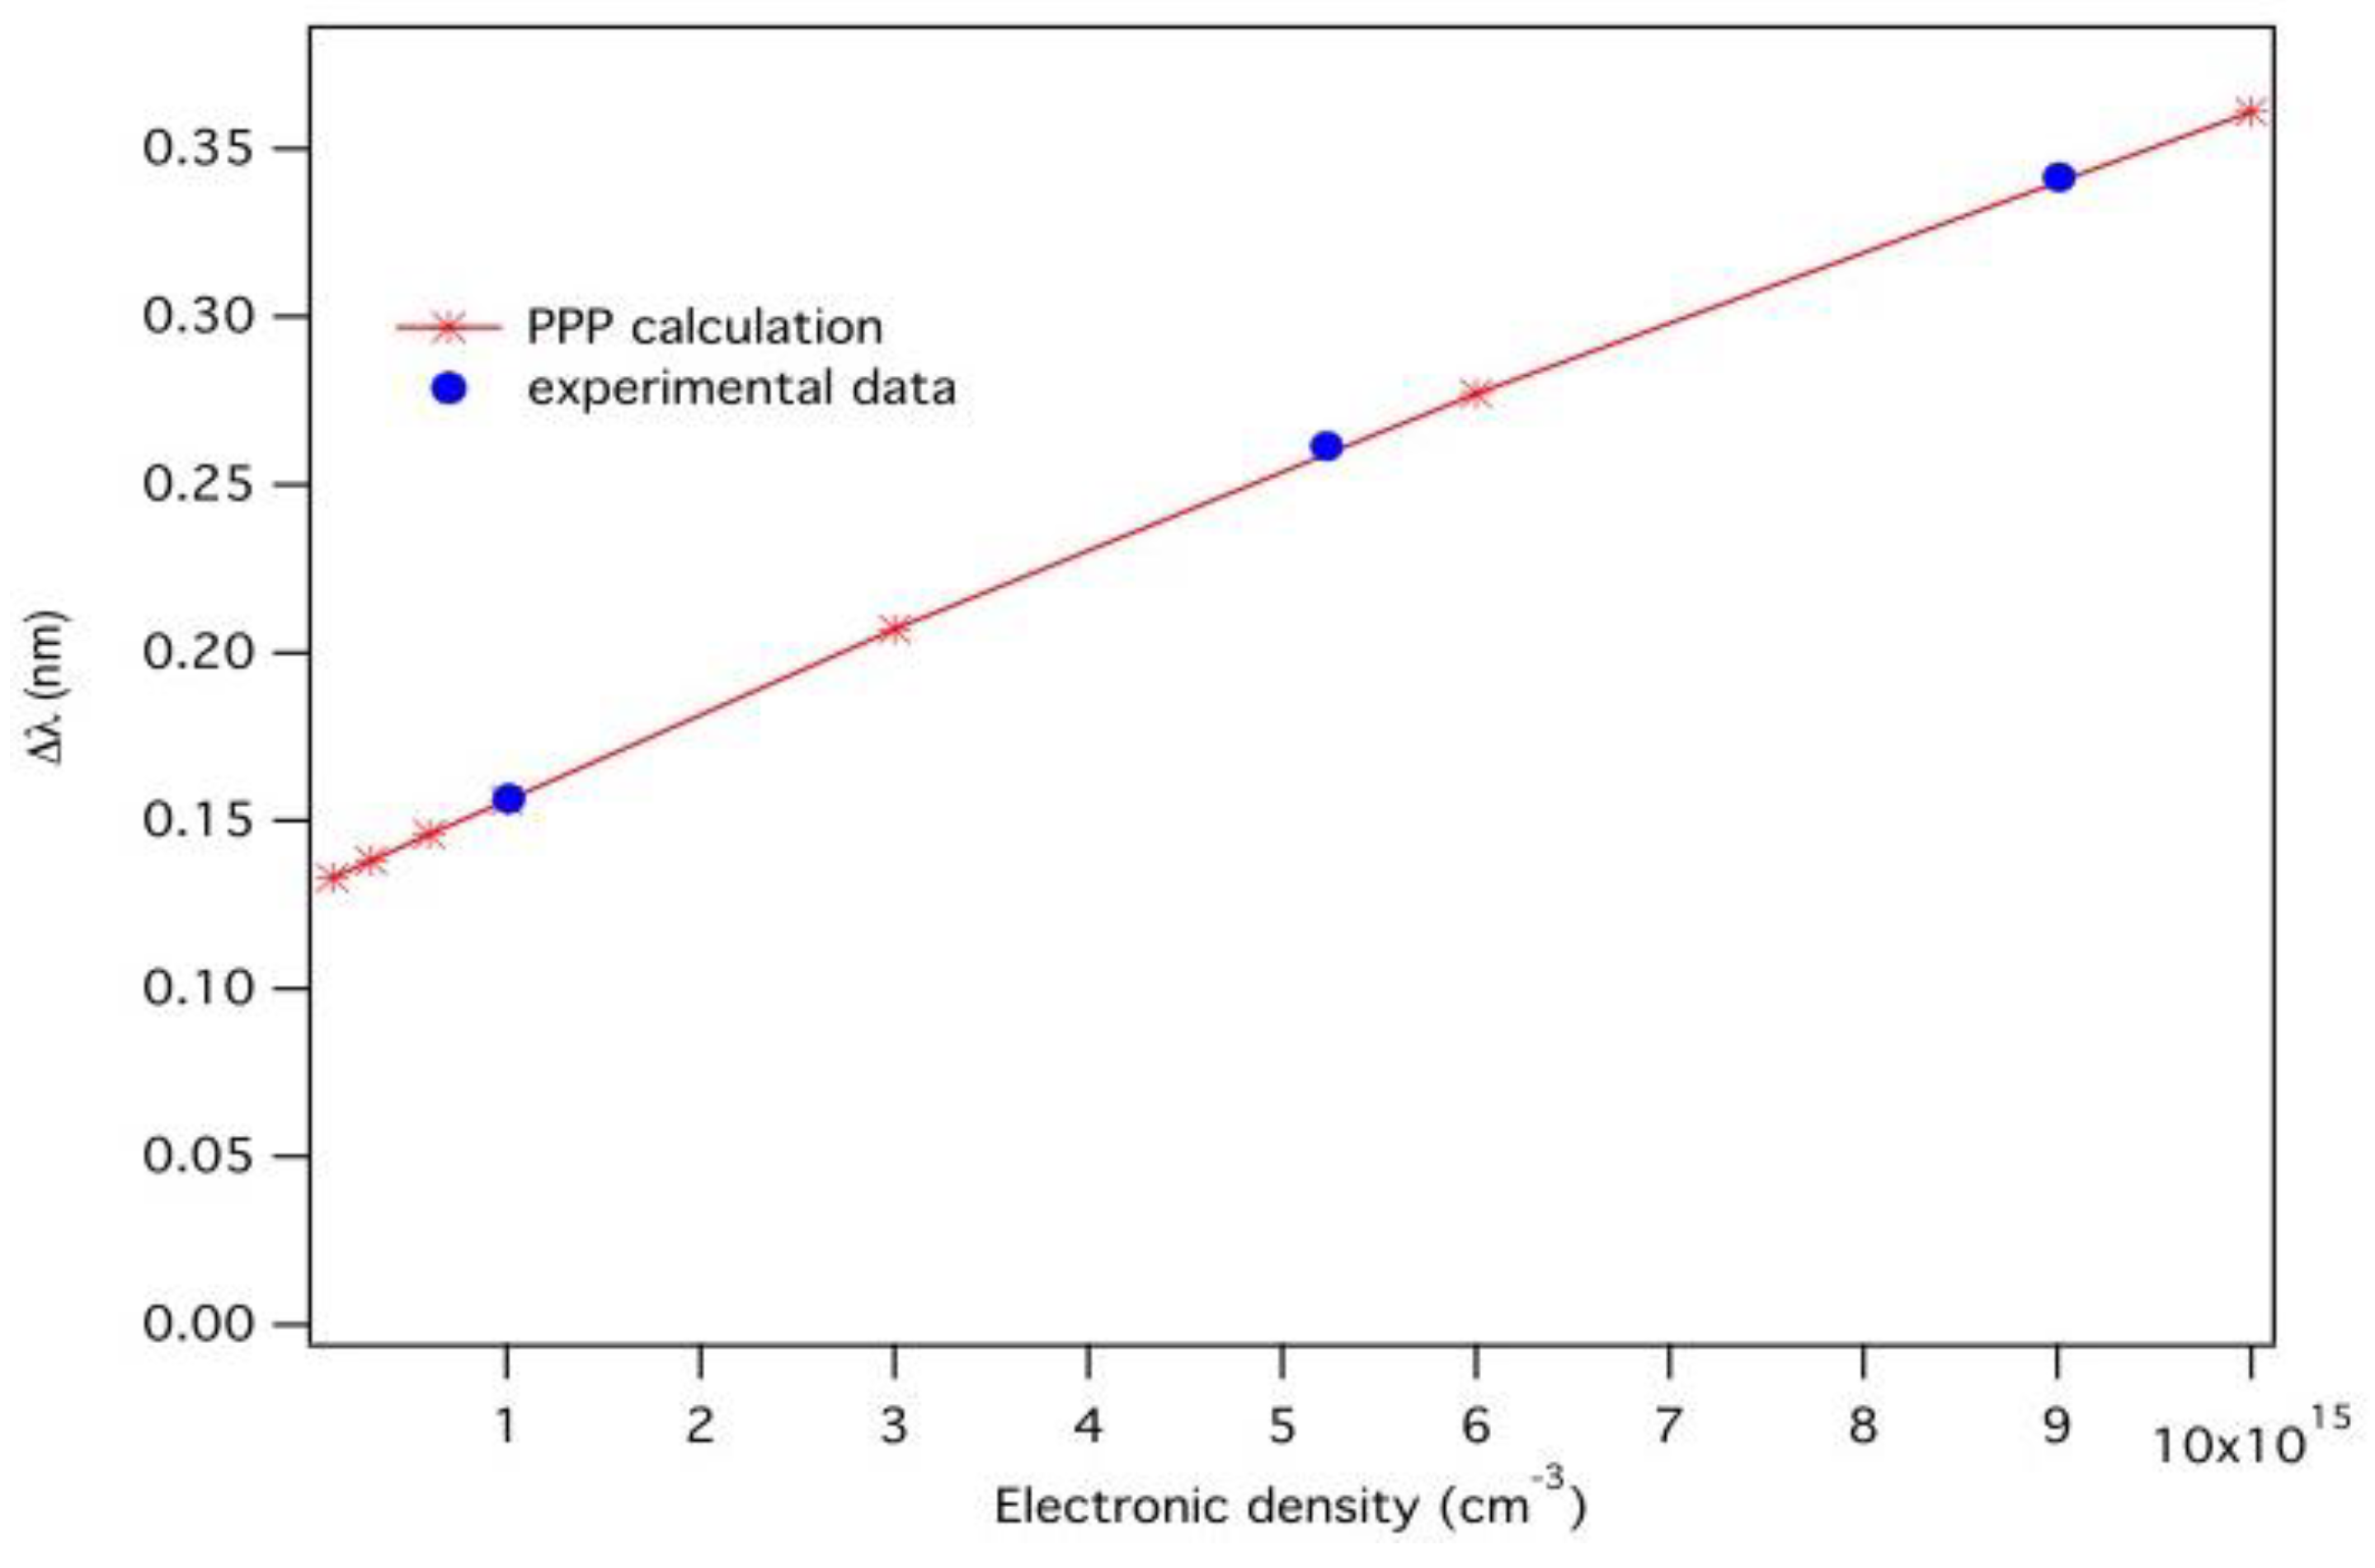
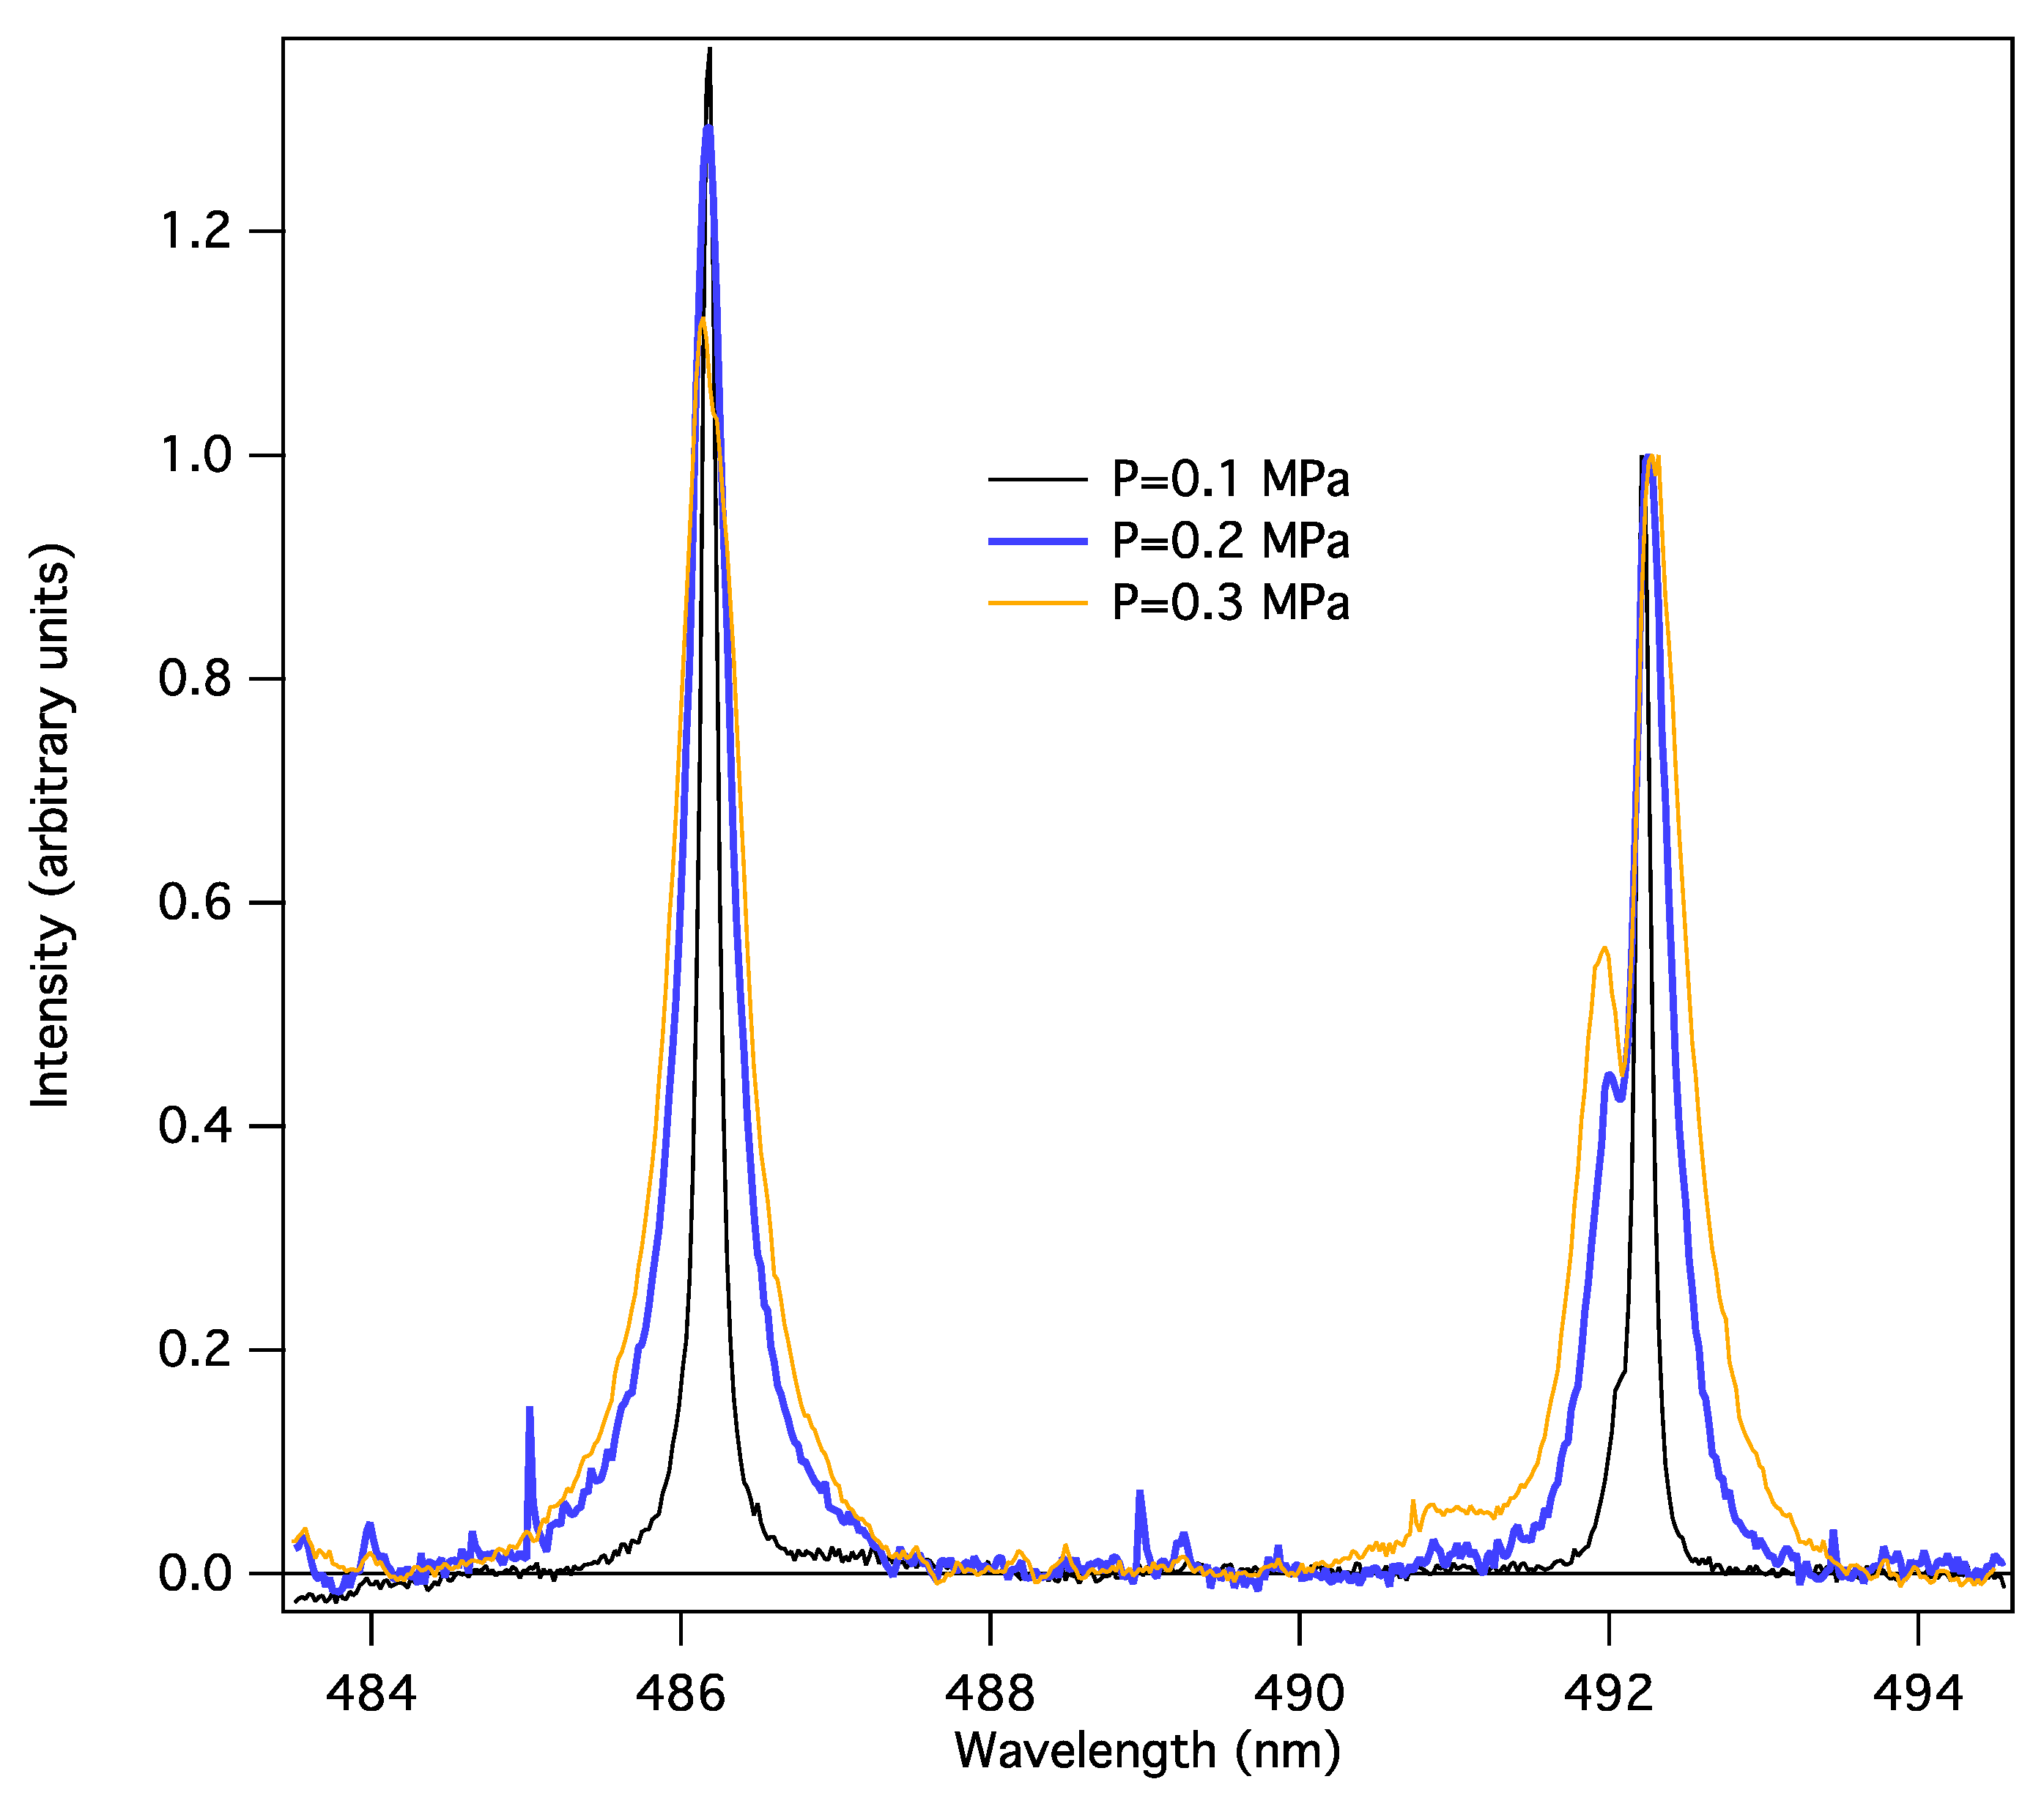
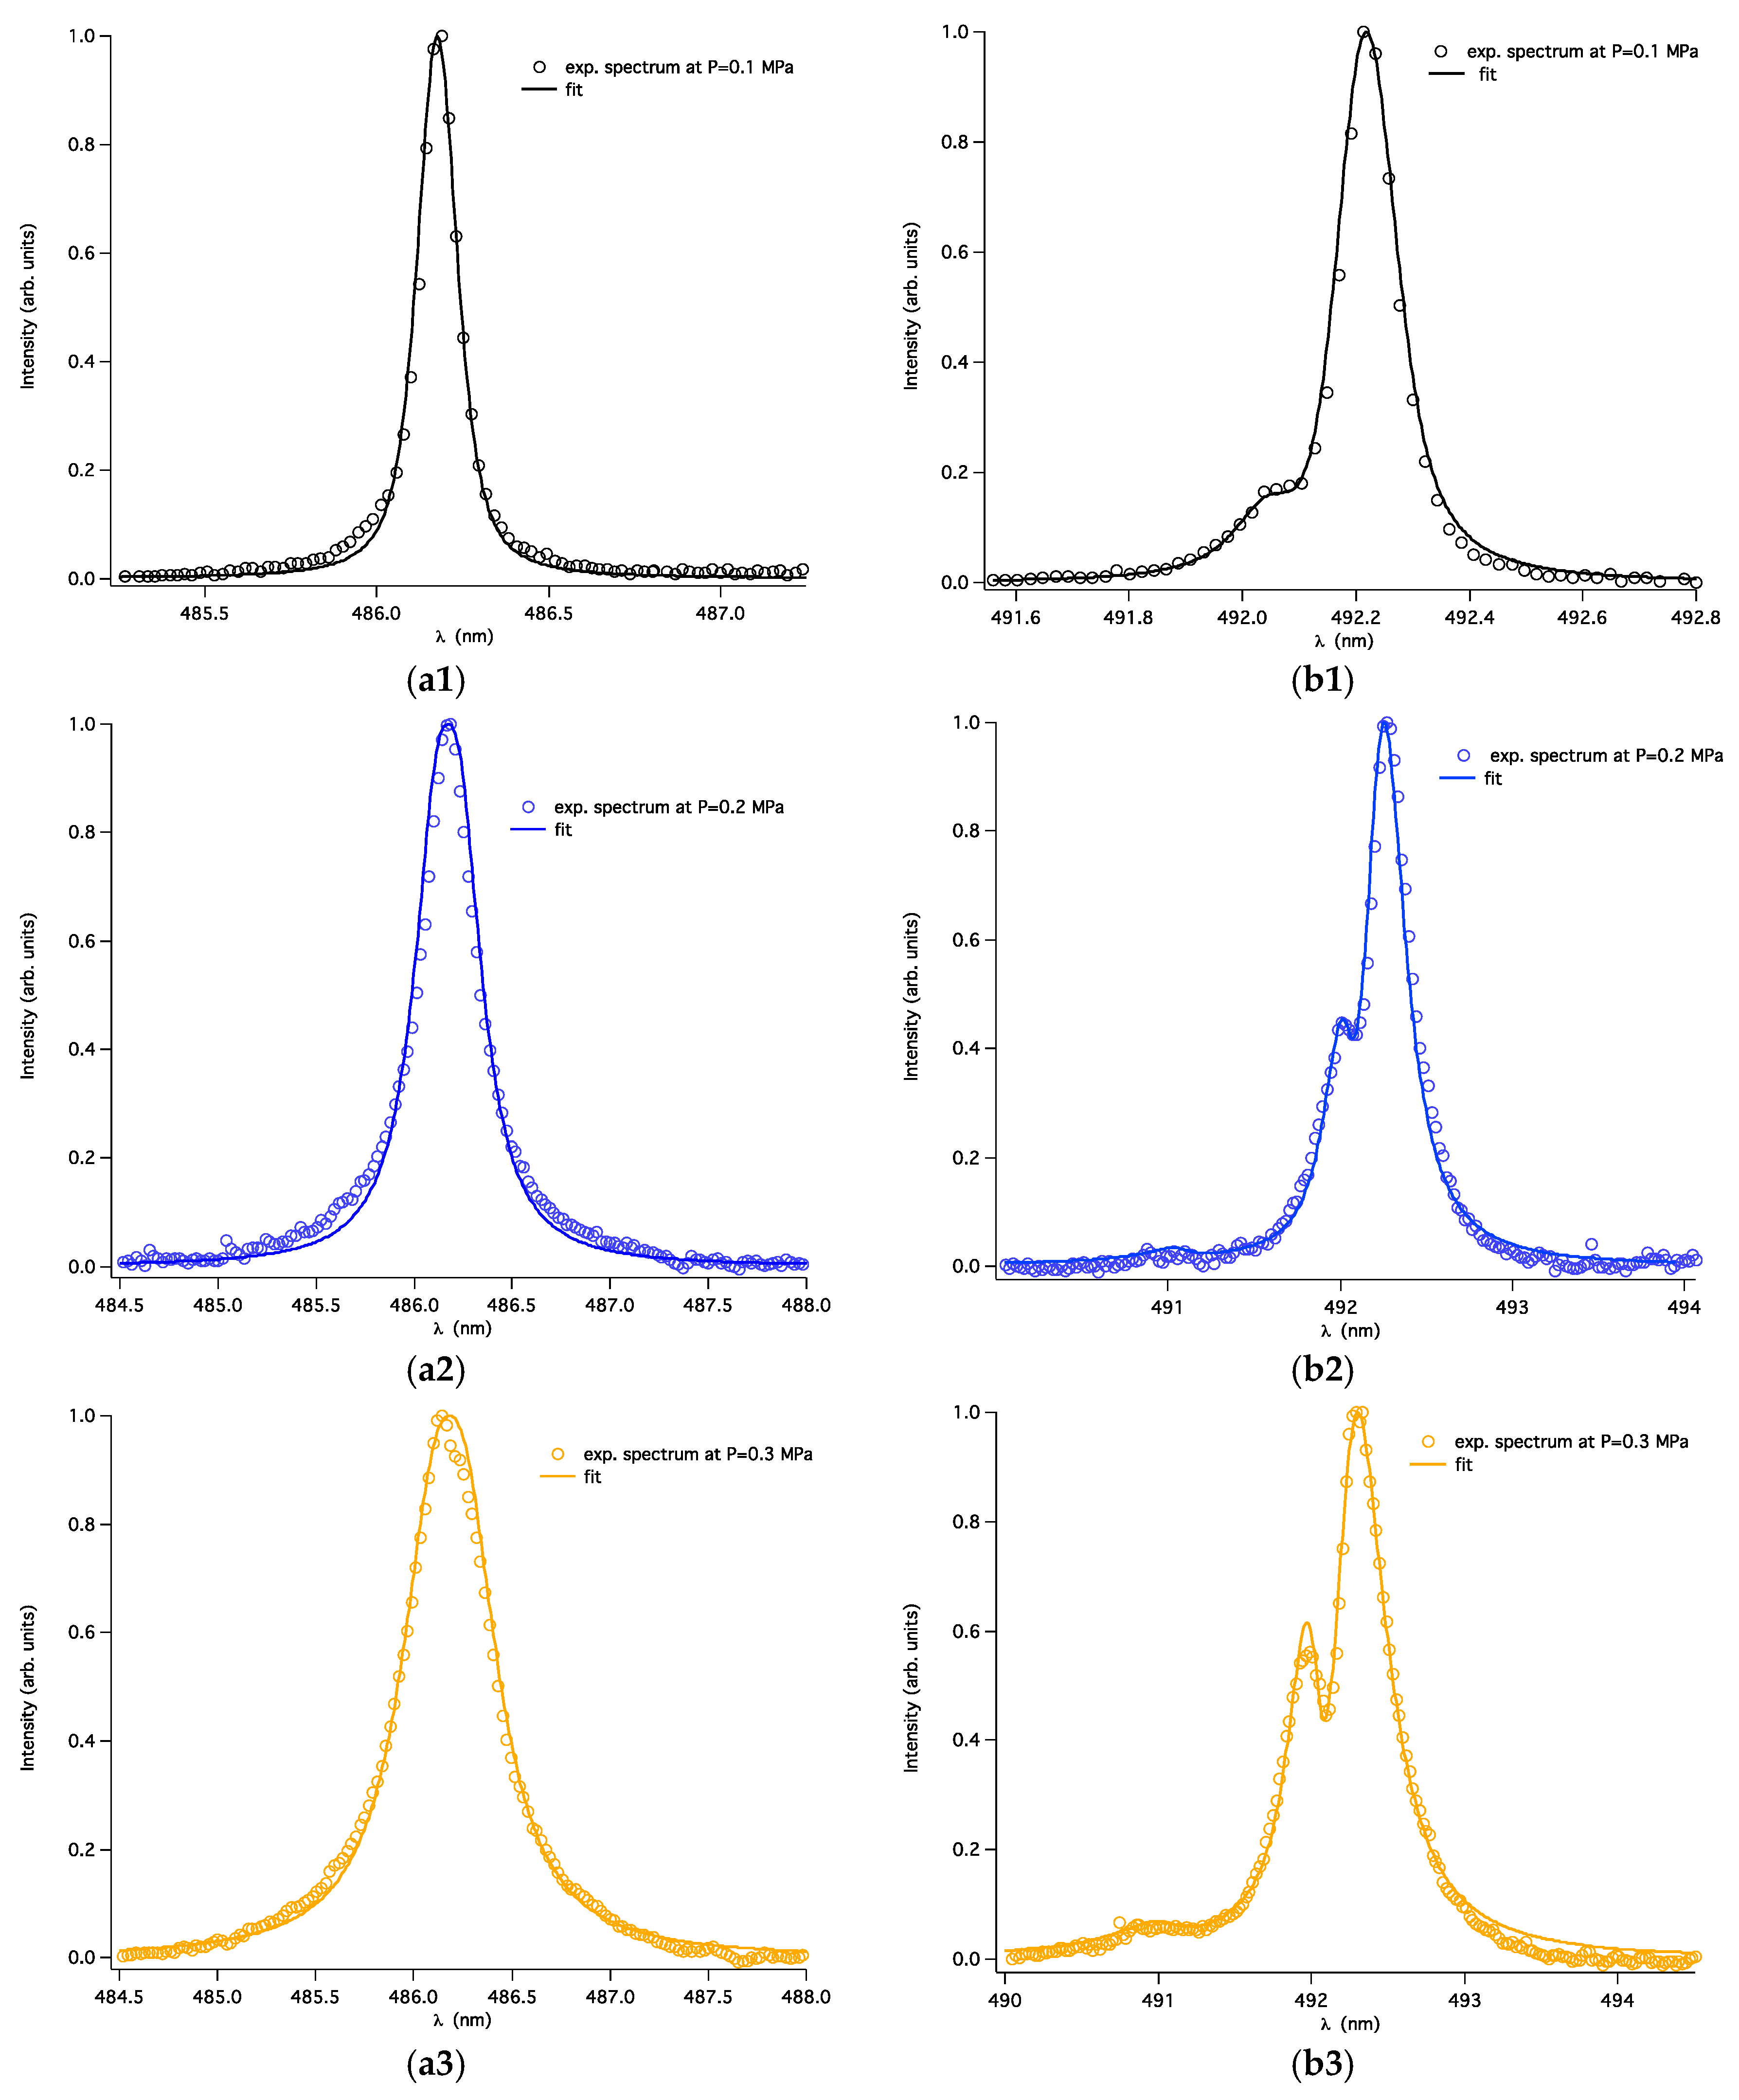
3.2. Analysis of the Observed H-β and He I 492 nm Lines
4. Conclusions
Author Contributions
Funding
Conflicts of Interest
References
- Griem, H.R. Spectral Line Broadening by Plasma; Academic Press: New York, NY, USA, 1974. [Google Scholar]
- Golovkin, I.E.; Mancini, R.C.; Louis, S.J.; Lee, R.W.; Klein, L. Analysis of X-ray spectral data with genetic algorithms. JQSRT 2002, 75, 625–636. [Google Scholar] [CrossRef]
- Chung, H.K.; Cohen, D.H.; MacFarlane, J.J.; Bailey, J.E.; Wang, P.; Moses, G.A. Statistical fitting analysis of Stark-broadened optically thick Ar II spectra measured in ion beam transport experiments. JQSRT 2000, 65, 135–149. [Google Scholar] [CrossRef]
- Marandet, Y.; Genesio, P.; Godbert-Mouret, L.; Koubiti, M.; Stamm, R.; Capes, H. Determination of edge plasma parameters by a genetic algorithm analysis of spectral line shapes. Contrib. Plasmas Phys. 2004, 44, 289–293. [Google Scholar] [CrossRef]
- 4th SLSP Workshop. Available online: http://plasma-gate.weizmann.ac.il/projects/slsp/slsp4/ (accessed on 22 February 2018).
- Sheeba, R.R.; Koubiti, M.; Bonifaci, N.; Gilleron, F.; Mossé, C.; Pain, J.-C.; Rosato, J.; Stambulchik, E. H-β Line in a Corona Helium Plasma: A Multi-Code Line Shape Comparison. Atoms 2018, 6, 29. [Google Scholar] [CrossRef]
- Sheeba, R.R.; Koubiti, M.; Bonifaci, N.; Gilleron, F.; Pain, J.-C.; Stambulchik, E. Broadening of the Neutral Helium 492 nm Line in a Corona Discharge: Code Comparisons and Data Fitting. Atoms 2018, 6, 19. [Google Scholar] [CrossRef]
- Calisti, A.; Khelfaoui, F.; Stamm, R.; Talin, B.; Lee, R.W. Model for the line shapes of complex ions in hot and dense plasmas. Phys. Rev. A 1990, 42, 5433–5440. [Google Scholar] [CrossRef] [PubMed]
- Talin, B.; Calisti, A.; Godbert, L.; Stamm, R.; Lee, R.W.; Klein, L. Frequency-fluctuation model for line-shape calculations in plasma spectroscopy. Phys. Rev. A 1995, 51, 1918–1928. [Google Scholar] [CrossRef] [PubMed]
- Charbonneau, P. Genetic algorithms in astronomy and astrophysics. Astrophys. J. Suppl. Ser. 1995, 101, 309. [Google Scholar] [CrossRef]
- Ferri, S.; Calisti, A.; Mossé, C.; Rosato, J.; Talin, B.; Alexiou, S.; Gigosos, M.A.; González, M.A.; González-Herrero, D.; Lara, N.; et al. Ion Dynamics Effect on Stark-Broadened Line Shapes: A Cross-Comparison of Various Models. Atoms 2014, 2, 299–318. [Google Scholar] [CrossRef]
- Godbert-Mouret, L.; Meftah, T.; Calisti, A.; Stamm, R.; Talin, B.; Gigosos, M.; Cardenoso, V.; Alexiou, S.; Lee, R.W.; Klein, L. Accuracy of stark broadening calculations for ionic emitters. Phys. Rev. Lett. 1998, 81, 5568. [Google Scholar] [CrossRef]
- Bonifaci, N.; Li, Z.; Eloranta, J.; Fiedler, S.L. Interaction of Helium Rydberg State Molecules with Dense Helium. J. Phys. Chem. A 2016, 120, 9019–9027. [Google Scholar] [CrossRef] [PubMed]
- Galtier, E.; Rosmej, F.B.; Calisti, A.; Talin, B.; Mossé, C.; Ferri, S.; Lisitsa, V.S. Interference effects and Stark broadening in XUV intrashell transitions in aluminum under conditions of intense XUV free-electron-laser irradiation. Phys. Rev. A 2013, 87, 033424. [Google Scholar] [CrossRef]
- Mancini, R.C.; Iglesias, C.A.; Ferri, S.; Calisti, A.; Florido, R. The effect of improved satellite line shapes on the argon Heβ spectral feature. High Energy Density Phys. 2013, 9, 731–736. [Google Scholar] [CrossRef]
- Iglesias, C.A.; DeWitt, H.E.; Lebowitz, J.L.; MacGowan, D.; Hubbard, W.B. Low-frequency electric microfield distributions in plasmas. Phys. Rev. A 1985, 31, 1698. [Google Scholar] [CrossRef]
- Iglesias, C.A.; Rogers, F.J.; Shepherd, R.; Bar-Shalom, A.; Murillo, M.S.; Kilcrease, D.P.; Calisti, A.; Lee, R.W. Fast electric microfield distribution calculations in extreme matter conditions. J. Quant. Spectrosc. Radiat. Transf. 2000, 65, 303–315. [Google Scholar] [CrossRef]
- Hooper, C.F., Jr. Electric microfield distributions in plasmas. Phys. Rev. 1966, 149, 77. [Google Scholar] [CrossRef]
- Hooper, C.F., Jr. Low-frequency component electric microfield distributions in plasmas. Phys. Rev. 1968, 165, 215. [Google Scholar] [CrossRef]
- Calisti, A.; Mossé, C.; Ferri, S.; Talin, B.; Rosmej, F.; Bureyeva, L.A.; Lisitsa, V.S. Dynamic Stark broadening as the Dicke narrowing effect. Phys. Rev. E 2010, 81, 016406. [Google Scholar] [CrossRef] [PubMed]
- Drake, G.W.F. Atomic, Molecular, and Optical Physics Handbook; AIP Press: Woodbury, NY, USA, 1996. [Google Scholar]
- Gigosos, M.A.; Cardenoso, V. New plasma diagnosis tables of hydrogen Stark broadening including ion dynamics. J. Phys. B Atomic Mol. Opt. Phys. 1996, 29, 4795. [Google Scholar] [CrossRef]
- Lara, N.; González, M.A.; Gigosos, M.A. Stark broadening tables for the helium I 492.2 line-Application to weakly coupled plasma diagnostics. Astron. Astrophys. 2012, 542, A75. [Google Scholar] [CrossRef]
- Nguyen, T.H.V. Spectroscopie d’émission d’un plasma crée par des décharges couronne dans l’hélium. Ph.D. Thesis, Université de Grenoble, Grenoble, France, 2015. [Google Scholar]
- Rosato, J.; Bonifaci, N.; Li, Z.; Stamm, R. A spectroscopic diagnostic of the electron density in a corona discharge. J. Phys. Conf. Ser. 2017, 810, 012057. [Google Scholar] [CrossRef]
- Rosato, J.; Bonifaci, N.; Li, Z.; Stamm, R. Line shape modeling for the diagnostic of the electron density in a corona discharge. Atoms 2017, 5, 35. [Google Scholar] [CrossRef]


| Transition | Δλth vdw |
|---|---|
| 4s – 2p | 2.20 × 10⁻⁵PT−7/10 |
| 4p – 2s | 2.12 × 10⁻⁵PT−7/10 |
| 4d – 2p | 1.98 × 10⁻⁵PT−7/10 |
| Wavelength (nm) | Transition | Δλth vdw |
|---|---|---|
| 491.0747 | 1Po – 1P0 | 1.6906 × 10⁻⁵PT−7/10 |
| 492.0612 | 1Po – 1F0 | 1.3342 × 10⁻⁵PT−7/10 |
| 492.1931 | 1P0 – 1D1 | 1.5424 × 10⁻⁵PT−7/10 |
| Pressure (105 Pa) | |
|---|---|
| 1 | 3.65 × 10⁻² |
| 2 | 7.31 × 10⁻² |
| 3 | 10.96 × 10⁻² |
| Pressure (105 Pa) | |
|---|---|
| 1 | 2.85 × 10⁻² |
| 2 | 5.69 × 10⁻² |
| 3 | 8.54 × 10⁻² |
| Pressure (bar) | ne (cm−3) | Te (104 K) | Δλins (nm) | |
|---|---|---|---|---|
| 1 | 1014 | 1.23 | 7.2 × 10⁻² | 8.0 × 10⁻² |
| 2 | 8 × 10¹⁴ | 1.17 | 15.2 × 10⁻² | 8.0 × 10⁻² |
| 3 | 1.85 × 10¹⁵ | 1.21 | 24.2 × 10⁻² | 8.0 × 10⁻² |
| Pressure (bar) | ne (cm−3) | Te (104 K) | Δλins (nm) | |
|---|---|---|---|---|
| 1 | 1015 | 1.21 | 2.93 × 10⁻² | 8.0 × 10⁻² |
| 2 | 3.96 × 10¹⁵ | 1.16 | 5.82 × 10⁻² | 8.0 × 10⁻² |
| 3 | 8 × 10¹⁵ | 1.16 | 9.7 × 10⁻³ | 8.0 × 10⁻² |
© 2018 by the authors. Licensee MDPI, Basel, Switzerland. This article is an open access article distributed under the terms and conditions of the Creative Commons Attribution (CC BY) license (http://creativecommons.org/licenses/by/4.0/).
Share and Cite
Mossé, C.; Génésio, P.; Bonifaci, N.; Calisti, A. A New Procedure to Determine the Plasma Parameters from a Genetic Algorithm Coupled with the Spectral Line-Shape Code PPP. Atoms 2018, 6, 55. https://doi.org/10.3390/atoms6040055
Mossé C, Génésio P, Bonifaci N, Calisti A. A New Procedure to Determine the Plasma Parameters from a Genetic Algorithm Coupled with the Spectral Line-Shape Code PPP. Atoms. 2018; 6(4):55. https://doi.org/10.3390/atoms6040055
Chicago/Turabian StyleMossé, Caroline, Paul Génésio, Nelly Bonifaci, and Annette Calisti. 2018. "A New Procedure to Determine the Plasma Parameters from a Genetic Algorithm Coupled with the Spectral Line-Shape Code PPP" Atoms 6, no. 4: 55. https://doi.org/10.3390/atoms6040055
APA StyleMossé, C., Génésio, P., Bonifaci, N., & Calisti, A. (2018). A New Procedure to Determine the Plasma Parameters from a Genetic Algorithm Coupled with the Spectral Line-Shape Code PPP. Atoms, 6(4), 55. https://doi.org/10.3390/atoms6040055