1. Introduction
Emission lines from multiply ionized nitrogen N
iii –
v are commonly observed in the spectra of various astrophysical objects. Analyzing these spectral lines provides valuable insights into the chemical abundance and physical characteristics of such objects [
1,
2,
3,
4,
5]. For example, Cameron et al. [
4] observed the brightness of N
iii 1750 and N
iv 1486 lines, proposing their use in analyzing the N/O abundance ratio by comparing them with faint O
iii lines. Rivero González et al. [
2,
3] used N
iii and N
iv emission lines for the abundance analysis of O-type stars. Chayer et al. [
1] pointed out that N
v 1240 doublet lines can be used in the determination of element abundances. In this context, accurate atomic data such as energy levels and oscillator strengths are crucial for analyzing chemical abundances and reliably interpreting observed spectra.
Given the astrophysical importance of these ions, numerous studies have been conducted in the past. The full lists of published papers can be accessed from the NIST Atomic Transition Probability Bibliographic database [
6]. The majority of transition probabilities related to multiply ionized nitrogen N
iii –
v originate from theoretical calculations. The current sets of calculated electric dipole transition probabilities (
A) in the Atomic Spectra Database of the National Institute of Standards and Technology (NIST-ASD; see Kramida et al. [
7]) are primarily based on Opacity Project calculations: Fernley et al. [
8] for N
iii, Tully et al. [
9] for N
iv, and Peach et al. [
10] for N
iv. Additionally, the
A values from Bell et al. [
11] for N
iii, Hibbert [
12] for N
iv, and Bièmont [
13], Lindgård and Nielsen [
14] for N
v, along with experimental values from Fang et al. [
15] and compilation data from Allard et al. [
16], have also been included in the NIST-ASD. Bell et al. [
11] calculated the
A values for the transitions among the 20 lowest-lying fine structure levels of the
states in N
iii, employing CIV3 code. Similarly, Hibbert [
12] utilized the same code to compute the oscillator strengths of transitions involving
terms in N
iv. Fang et al. [
15] used a cylindrical radio frequency ion trap to measure the
A values belonging to the
transitions. The other existing experimental transition probabilities were obtained from lifetime measurements [
17,
18,
19,
20,
21], beam-foil experiments [
22,
23,
24,
25], and the analysis of the relative intensities of the spectral lines emitted by these ions [
26,
27].
Froese Fischer and co-workers have conducted detailed investigations of N
iii [
28,
29], N
iv [
28,
30], and N
v [
31,
32], focusing on the low-lying levels. They employed multiconfiguration Hartree–Fock and the Breit–Pauli (MCHF-BP) approximation to compute the energy levels and various transition properties, including transition probabilities, oscillator strengths, and lifetimes. Using CIV3 code, Hibbert et al. also performed calculations on the energy levels and
A values for the transitions among the levels of low-lying configurations in N
iii [
11,
33,
34], and N
iv [
12,
35].
Calculations involving additional energy levels, such as those for
, and their corresponding transitions are also available. For example, Fernández-Menchero et al. [
36] adopted AUTOSTRUCTURE code, Aggarwal et al. [
37] used the General-purpose Relativistic Atomic Structure Package (GRASP), and Fernández-Menchero et al. [
38] utilized the B-spline box-based close-coupling method to calculate the atomic data in N
iv. However, these calculations included only limited electron correlation effects, which affected their accuracy. In addition, Wang et al. [
39] carried out calculations of energies and transition parameters in N
iv using the multiconfiguration Dirac–Hartree–Fock (MCDHF) and relativistic configuration interaction (RCI) method.
As part of our series of work on obtaining accurate atomic data of astrophysically important CNO elements [
40,
41,
42], new calculations were performed for the lowest 86, 125, and 53 states in N
iii –
v, respectively, using the fully relativistic MCDHF and RCI method. The electric dipole (E1) transition data among these levels, including wavelengths, transition rates, line strengths, and oscillator strengths, along with the corresponding lifetimes, are provided.
2. Calculations
The fully relativistic MCDHF method [
43], implemented through
Grasp2018 [
44,
45], was adopted in the present work. In this method, an atomic state function (ASF)
, is expanded over configuration state functions (CSFs);
Here,
J and
P represent the total angular momentum and parity of the system, respectively;
is a set of quantum numbers used to specify a CSF in addition to
JP; and
is the mixing coefficient.
The CSFs are
-coupled many-electron functions, which are constructed from the products of one-electron Dirac orbitals [
46]. Using the extended optimal level (EOL) scheme [
47], the radial components of the Dirac orbitals and the expansion coefficients of the targeted states are optimized in a relativistic self-consistent field procedure. This optimization is achieved by solving the MCDHF equations, which are derived through the variational approach. The primary quantum electrodynamic (QED) effects, namely, vacuum polarization and self-energy, along with the Breit interaction, are included in the following RCI calculation, using the radial functions obtained from the MCDHF optimization.
We started the calculations with a Dirac–Hartree–Fock (DHF) calculation based on a set of multireference (MR) configurations. The configurations included in the MR set for each ion are listed in the first column in
Table 1. The CSFs were then produced and progressively expanded using the multireference singles and doubles (MR-SD) method, allowing single and double excitations from the electrons of the MR sets to the orbitals in the active set (AS) [
43,
48,
49]. During this stage, different computational strategies were employed to compute the atomic properties for distinct ions. The CSFs were produced by allowing SD substitution from the
shells for N
iii –
v, with the restriction that at most one substitution was allowed for N
iii. The
core shell was kept frozen for N
iii and N
iv, while a maximum of one substitution from this core was permitted for N
v.
In the subsequent RCI calculations, the MR sets for N
iii and N
iv were expanded to include configurations with considerable contributions to the total wave functions. Higher-order configuration interaction effects were accounted for by permitting SD excitations from this extended MR set, as depicted in the second column in
Table 1. For N
iii, the CSF expansions in the final RCI calculation were generated by allowing SD substitutions from all subshells of the extended MR configurations, with the restriction that only one substitution could occur from the
core. In the case of N
iv, the CSFs were formed by allowing single, double, and triple (SDT) substitutions from all orbitals of the extended MR configurations, with the restriction of a maximum of one excitation from the
atomic core. As for N
v, the CSF expansions were enlarged by enabling all SDT substitutions from the extended MR orbitals to the largest AS of the orbitals. The maximum AS for N
iii –
v are presented in the last column in
Table 1.
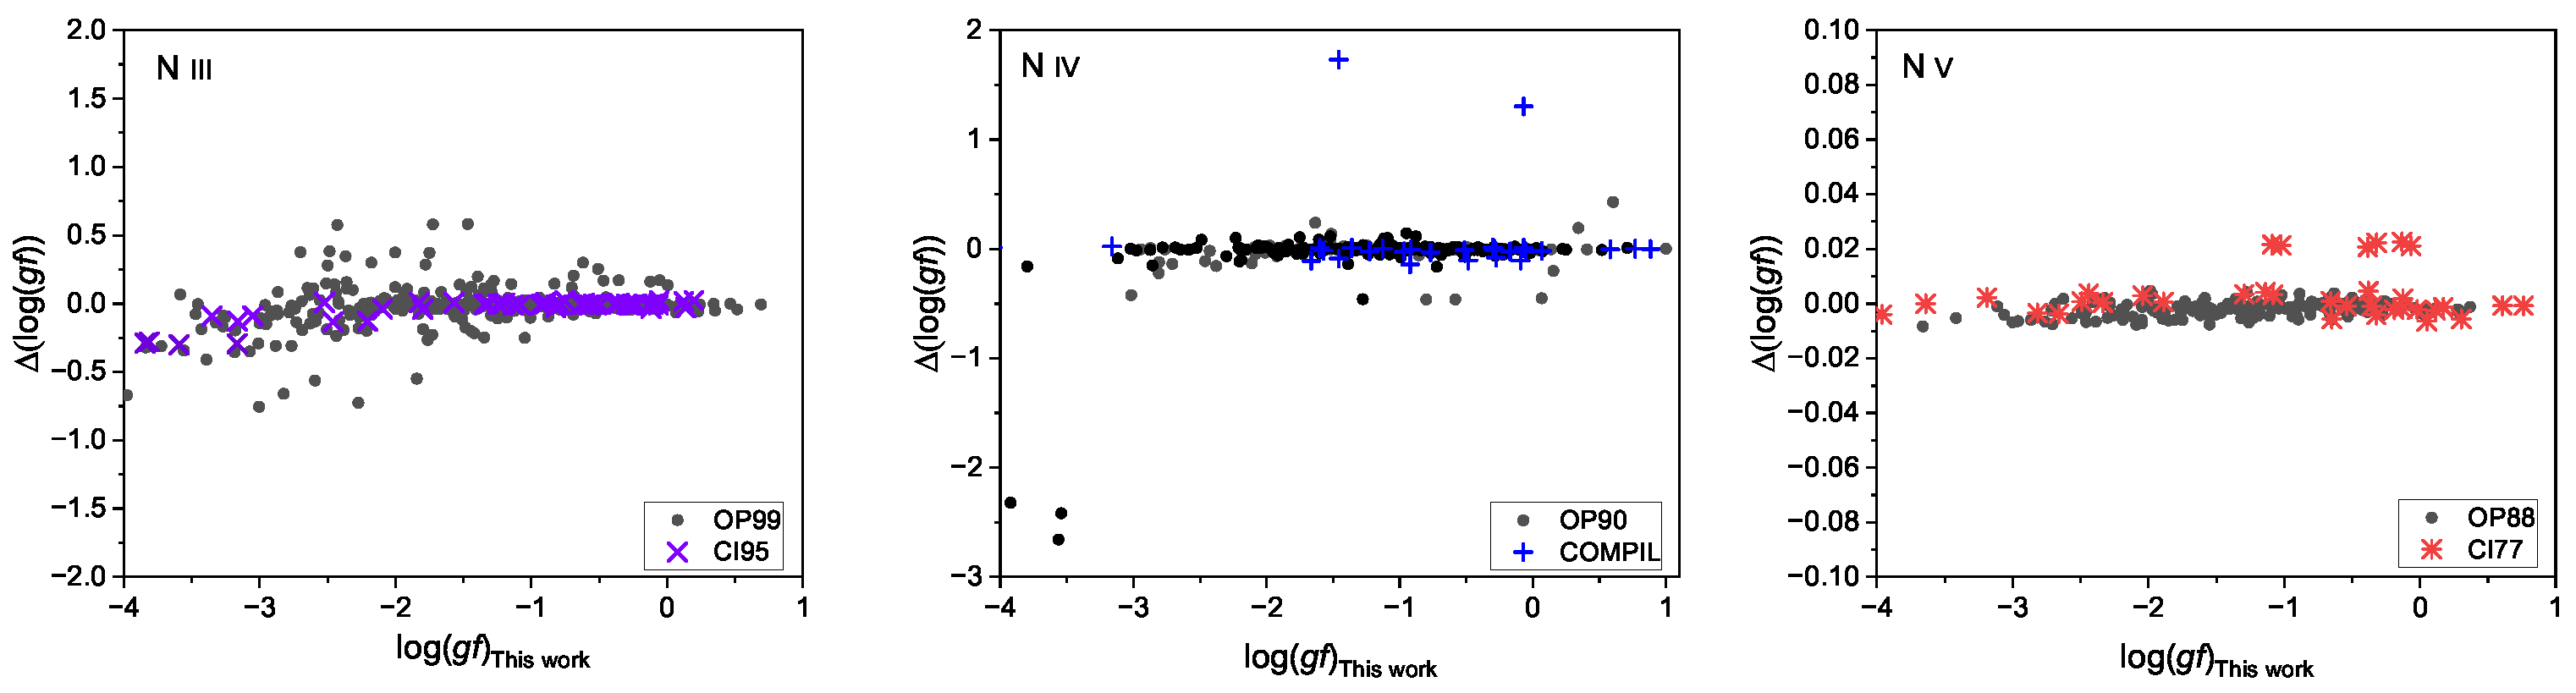
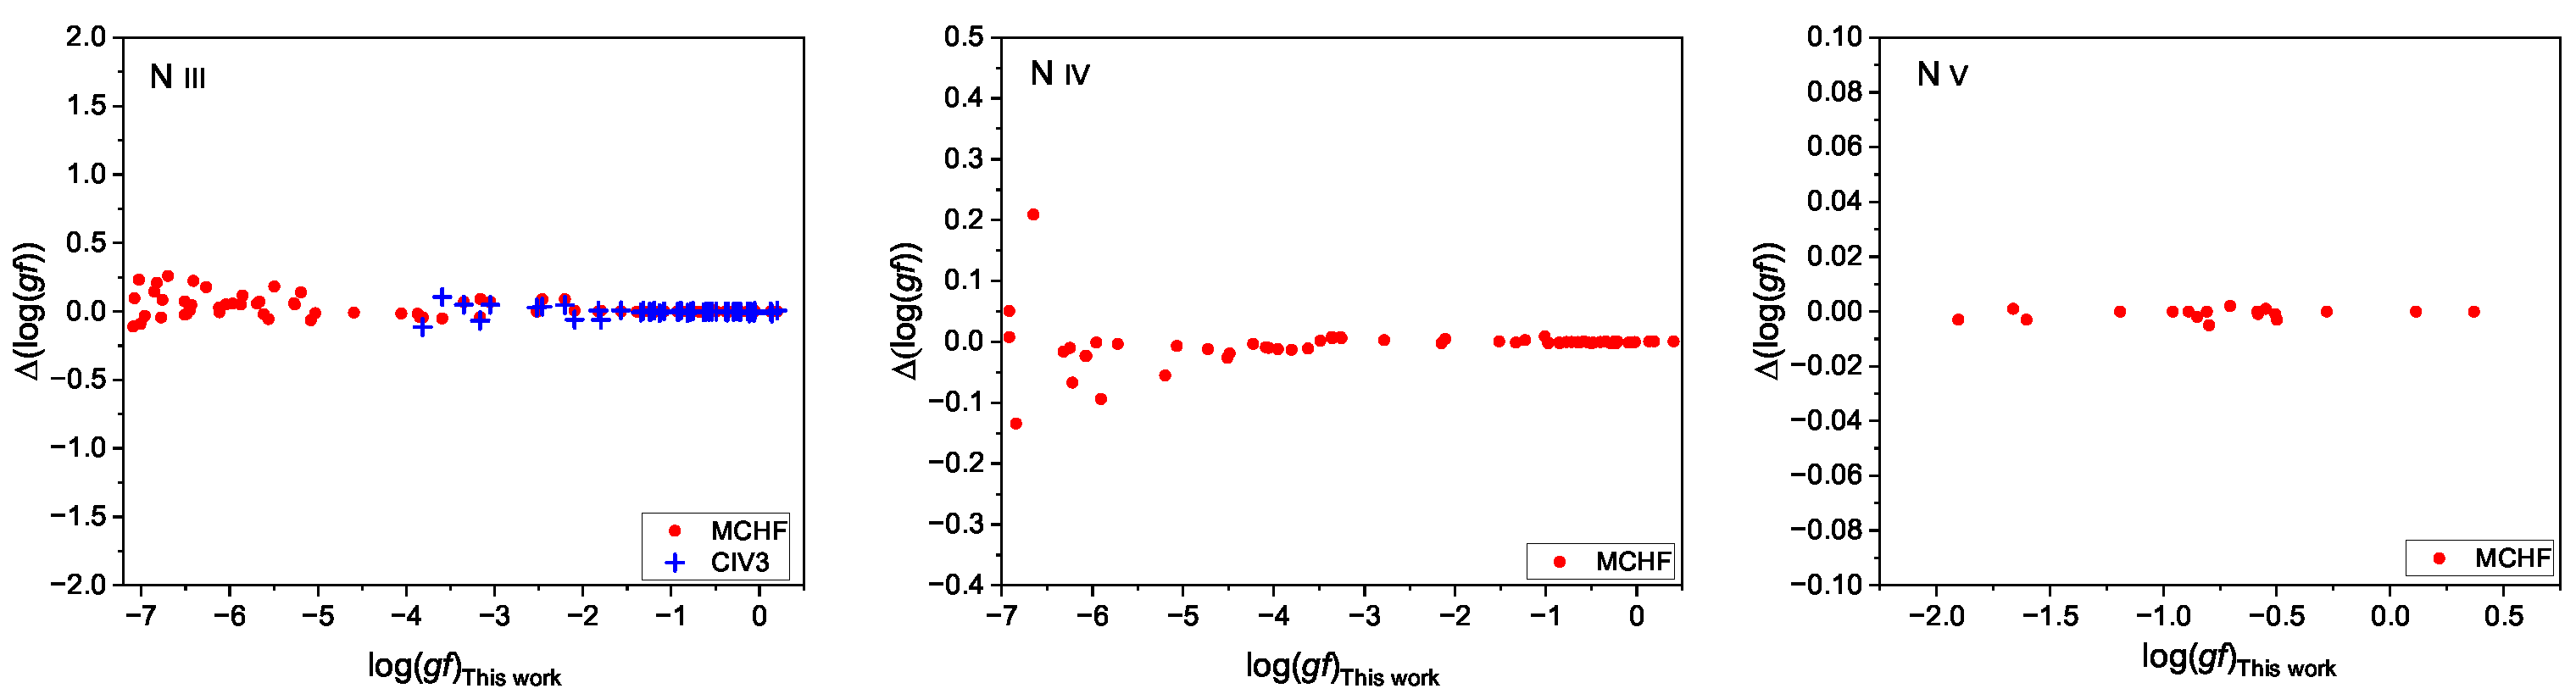
4. Conclusions
Using the MCDHF and RCI method, we present an extensive and accurate dataset of excitation energies, lifetimes, wavelengths, E1 line strengths, transition rates, and oscillator strengths for N iii – v. Our calculated level energies show excellent agreement with the observed values. The root mean square differences from the NIST values are 130, 103, and 6 , respectively.The accuracy of the transition data was validated through extensive comparisons with the NIST-ASD as well as previous theoretical and experimental results, and the overall agreement was good. However, for some transitions where levels deviate significantly from pure coupling, i.e., with strong relativistic configuration interaction effects and relativistic QED effects, the agreement between our computed values and the NIST-compiled values is poorer. We suggest that the current results be used as a reference for N iii – v for various astrophysical applications.


