Abstract
Accurate knowledge of the fine structure of low-ionisation-stage heavy elements is crucial for plasma modelling in stellar astronomy, galactic evolution studies, and nucleosynthesis investigations. The experimental determination of atomic energy levels and transitions in these elements is essential for the meaningful interpretation of high-resolution astrophysical spectra obtained with modern telescopes, as theoretical calculations of transition wavelengths and strengths often lack sufficient accuracy. This article provides a brief review of the major challenges in empirical atomic structure investigations of the low-ionisation open d- and f-subshell elements, which have the most complex atomic spectra.
1. Introduction
Elements that present significant challenges in laboratory and astrophysical atomic spectroscopy are the low-ionisation-stage heavy elements with electrons in open d- and f-subshells, which are commonly found in stellar atmospheres, nebulae, supernovae, and kilonovae. The spectra of these objects are highly complex when observed with high-resolution spectrometers at ground- and space-based telescopes. A major limitation in interpreting the spectra of the low-ionisation-stage open d- and f-subshell species is the large fraction of unknown reference transition wavelengths. The demand for more complete atomic transitions data has remained prominent in stellar astronomy [1] and nucleosynthesis studies, including galactic surveys [2] and analysis of kilonovae of neutron star merger events [3].
The accuracy of reference fine structure transition wavelengths must match, and ideally surpass, those set by the resolving powers of telescope spectrometers, which range from a few thousand (e.g., the Medium-Resolution Spectrometer on the James Webb Space Telescope [4]) to 100,000 (e.g., the Ultraviolet and Visual Echelle Spectrograph of the Very Large Telescope [5] and the Space Telescope Imaging Spectrograph on the Hubble Space Telescope [6]). However, the typical wavelength accuracies of ab initio theoretical calculations for the open d- and f-subshell species reach only a few percent. High-resolution laboratory spectroscopy of these species and the empirical determination of their fine structures are therefore essential in fulfilling demands for reference atomic transition data in astronomy. At spectral resolving powers of ∼100,000, hyperfine and isotope structures also become observable in stellar absorption lines [7] and must be characterised in the laboratory [8]. With new high spectral resolving power electromagnetic telescopes (e.g., the Extremely Large Telescope [9] and the Jiao Tong University Spectroscopic Telescope [10]) and gravitational wave telescopes (e.g., the Einstein Telescope [11] and the Cosmic Explorer [12]) under development, the demand for accurate atomic data is expected to persist and grow.
This article documents and expands upon the invited talk I gave at the 13th International Conference on Atomic and Molecular Data and Their Applications (ICAMDATA) on 24 September 2024 in Lanzhou, China. The discussion included examples from my experience with atomic spectroscopy of the open 4f-subshell species, specifically doubly ionised neodymium (Nd III, ) [13,14]. In astrophysical spectral analyses, reference transition wavelengths, transition probabilities (often referred to as log() values), hyperfine structure constants, and isotope shift constants are in high demand. Moreover, the parameters for interatomic interactions are also dependent on the atomic structure. Since knowledge of fine structure energy levels is a prerequisite for determining these data, the remainder of this article reviews the distinct challenges in empirically determining the fine structure energy levels of the low-ionisation stage open d- and f-subshell elements from high-resolution laboratory spectra.
2. Measuring Fine Structure Transitions of Heavy Elements
Astrophysical atomic spectra usually consist of blended lines of many species, whereas laboratory spectroscopy has the advantage of isolating individual elemental spectra, depending on the light source used. The energy level system of a low-ionisation-stage open d- or f-subshell species is empirically reconstructed using observed energy level separations (spectral lines). When measuring laboratory atomic spectra, the accuracy of observed transition wavelengths and the accuracy of the observed spectral line relative intensities must be maximised. Additionally, the number of spectral lines observed per energy level should be as high as possible for confident energy level identifications. Spectral lines of the low-ionisation-stage (from neutral to roughly triply ionised) open d- and f-subshell elements can lie across the mid-infrared and vacuum-ultraviolet ranges (from ∼10,000 to ∼10 nm). To meet these observational demands, laboratory spectrometers must balance a high spectral resolution, wide spectral range, and high sensitivity (dynamic range). Two types of instruments are widely used for this purpose: Fourier transform (FT) spectroscopy and grating spectroscopy [15].
FT spectrometers are interferometers that split collimated source radiation into two beams, introduce an optical path difference between them, and measure the intensity of the recombined beams at fixed optical path difference intervals (the interferogram). The resulting intensity measurements as a function of the optical path difference is the FT of the source spectrum. FT spectrometers can achieve spectral resolving powers of a few million, an order of magnitude above those used in telescopes. Commercially available FT spectrometers cover the mid-infrared-to-ultraviolet range, while those operating in the ultraviolet-to-vacuum-ultraviolet range exist only as specialised instruments [16,17,18] due to challenges involving manufacturing tolerances (e.g., motion precision, optical surfaces, and beamsplitter materials) and the maintenance of components at shorter wavelengths. FT spectrometers are limited to light sources with minimal spectral intensity variation over the interferogram scanning period, which typically takes a few minutes and is achievable for low-ionisation-stage open d- and f-subshell elements.
Grating spectrometers can be designed for high-resolution, wide spectral range measurements of atomic spectra. One example is the 10.7 m Normal Incidence Vacuum Spectrograph at the National Institute of Technology (NIST) in the US (see descriptions by J. Reader [17]), with a resolving power of several hundred thousand, which is significantly higher than that of telescope spectrometers. Another example is the 10 m vacuum spectrograph of the Paris-Meudon Observatory [19]. Although the highest achievable resolving power of grating spectroscopy is lower than that of FT spectrometers, they can measure at shorter wavelength regions in the vacuum-ultraviolet range below 135 nm, allowing observations of more transitions, including those of higher ionisation stages of the open d- and f-subshell elements. Grating spectroscopy also measures transition intensities individually, where local noise is unaffected by distant stronger lines. Thus, extending exposure durations for weaker lines is generally more effective compared with co-adding interferograms in FT spectroscopy. Furthermore, grating spectroscopy offers much greater flexibility for light sources. For example, time scales for significant spectral intensity variations can come down to nanoseconds when investigating laser-induced plasmas [20,21,22].
It is worth discussing that laser spectroscopic techniques provide unique measurements for a subset of experimentally determinable energy levels. For lifetime measurements, which are crucial for determining experimental transition probabilities when combined with branching ratio measurements, levels can be selectively populated in laser-induced fluorescence experiments [20], or a Boltzmann level population can be approximated in laser-induced breakdown spectroscopy [21,22]. For spectral resolving powers above , Doppler broadening reduction by atom trapping and cooling, atomic-beam laser spectroscopy, and Doppler-free techniques enable highly accurate measurements of fine structure transition wavelengths, as well as hyperfine structure and isotope shift constants. Solely using laser-based methods is not ideal for large-scale energy level and transition wavelength investigations due to their limited spectral coverage [15], but they can aid empirical energy level determinations by providing the most accurate transition wavelengths, transition probabilities, and nuclear perturbation constants for a subset of levels. Additionally, laser frequency comb spectroscopy may emerge as a potential alternative to FT and grating spectroscopy with further developments.
A summary comparing the FT, grating, and laser spectroscopic methods used in atomic spectroscopy of the fine structures of low-ionisation-stage open d- and f-subshell elements is shown in Table 1. In general, a comprehensive atomic structure and spectral analysis of a single open d- and f-subshell species requires measurements from all three spectroscopic techniques, as their respective strengths compensate for their individual limitations. For FT and grating spectroscopy methods used in large-scale empirical energy level determinations, wavelength accuracies reach up to a few parts in tens to hundreds of millions, respectively, the dynamic range can be up to an order of 10,000, and relative intensity accuracies reach up to a few percent [23].

Table 1.
Comparisons between common spectroscopic techniques used for atomic fine structure investigations of low-ionisation-stage open d- and f-subshell elements.
3. Producing Low-Ionisation-Stage Heavy Element Atomic Spectra
Atomic spectra of low-ionisation-stage open d- and f-subshell elements can be produced in various emission light sources for laboratory high-resolution atomic spectroscopy. The general recipe involves generating glow or arc discharges using the metal of the element of interest, a discharge carrier gas, and an electric field. Prominent examples of suitable light sources include hollow cathode discharge lamps [24,25], Penning discharge lamps [26,27], electrodeless discharge lamps [28], gas or vacuum sliding sparks [29], and stars [30], all of which are typically dominated by electric dipole (E1) transitions. Access to a variety of light sources is preferred in complex atomic structure and spectral investigations, as many clues for subsequent line identifications can be obtained through comparisons between spectra of differing plasmas.
In general, the strength of the electric field generating the metal discharge controls the effective temperature of the plasma, which in turn controls the generation of particular ionisation stages and energy level populations. This enables the disentangling of spectra containing transitions from multiple ionisation stages by analysing the spectral line intensity’s dependence on the effective temperature (e.g., [31]). Spectra are also often recorded in the same wavelength region under different discharge conditions for various other reasons, such as lowering the effective temperature to observe spectra with narrower Doppler widths for line blending analyses, comparing spectra at high and low currents to reveal weaker lines and avoid self-absorption [32], comparing spectral line Zeeman patterns due to external magnetic fields with calculated Landé-g factors as guidance for line classification, and selecting specific carrier gas compositions to populate particular energy levels [33,34]. The importance of observing under differing discharge conditions is demonstrated in Figure 1. Without accurate knowledge of the energy levels involved in the transitions of Figure 1, the number of spectral lines observed in the Penning discharge lamp spectrum is open to interpretation. With additional information from the hollow cathode lamp spectrum of a more optically thin plasma that is also cooler with narrower Doppler widths, the deviations from the expected Voigt profiles in the Penning lamp spectrum are concluded to most likely be due to isotope shifts and self-absorption, rather than additional fine structure transition lines in blends. The range of different experiments and instruments required for a comprehensive energy level analysis of the low-ionisation-stage open 4f-subshell species Nd III is summarised in Table 2. A similar strategy is required for open d-subshell species, such as the highly astrophysically important Fe II [35].

Figure 1.
A selection of spectral lines in a Nd FT spectrum [13] showing the signal-to-noise-ratio (S/N) and different line profiles observed in a Penning discharge lamp (PDL at 0.75 A, solid line) and a hollow cathode lamp (HCL at 0.45 A, dash-dotted line).
Table 2.
Experimental strategy employed for the open 4f-subshell species of doubly ionised Nd [13].
The feasibility of applying a discharge source and spectrometer to investigate a low-ionisation-stage open d- and f-subshell species of interest, as well as the associated safety measures, is often unknown and can be a limiting factor. For example, FT spectroscopy is unsuitable due to source noise if stable discharges cannot be maintained, as noted in the previous section. Additionally, the storage and handling of reactive metals require element-specific experimental designs, and radioactive metals are unavailable in the large quantities needed for many discharge instruments (e.g., see Pm [36]), not to mention the extreme safety measures that must be implemented.
4. Finding Energy Levels from Complex Atomic Spectra
When a comprehensive set of FT or grating spectra is obtained under varying discharge conditions across the IR-UV range for a single low-ionisation-stage open d- or f-subshell element, tens of thousands of fine structure transitions are observed. The task then is to extract transition wavelengths and intensities into a line list through model spectral line fitting. The greatest challenge in line list creation is the immense number of weak lines [37] and widespread line blending, which is frequently indistinguishable from line distortions caused by isotope shifts, hyperfine structures, self-absorption, and instrumental artefacts such as ringing of phase errors in FT spectra or the continuum seen with arc discharges and detector saturation in grating spectra. Ambiguities (e.g., discussions for Figure 1) not only result in inaccurate and incomplete line list wavelengths and relative intensities but also introduce the need for manual inspections and alterations to model spectral line fits [13], significantly increasing the labour cost of line list creation. Generally, careful line list creation through peak-finding algorithms and manual adjustments (e.g., [38,39]) takes a few months for spectra covering the IR-UV range for a single element. Without further knowledge of the energy levels and origins of line profile distortions, one must accept the initial state of the line list when starting the energy level analysis and allow for modifications to the spectral line fits as knowledge of the energy levels expands during the empirical energy level structure analysis.
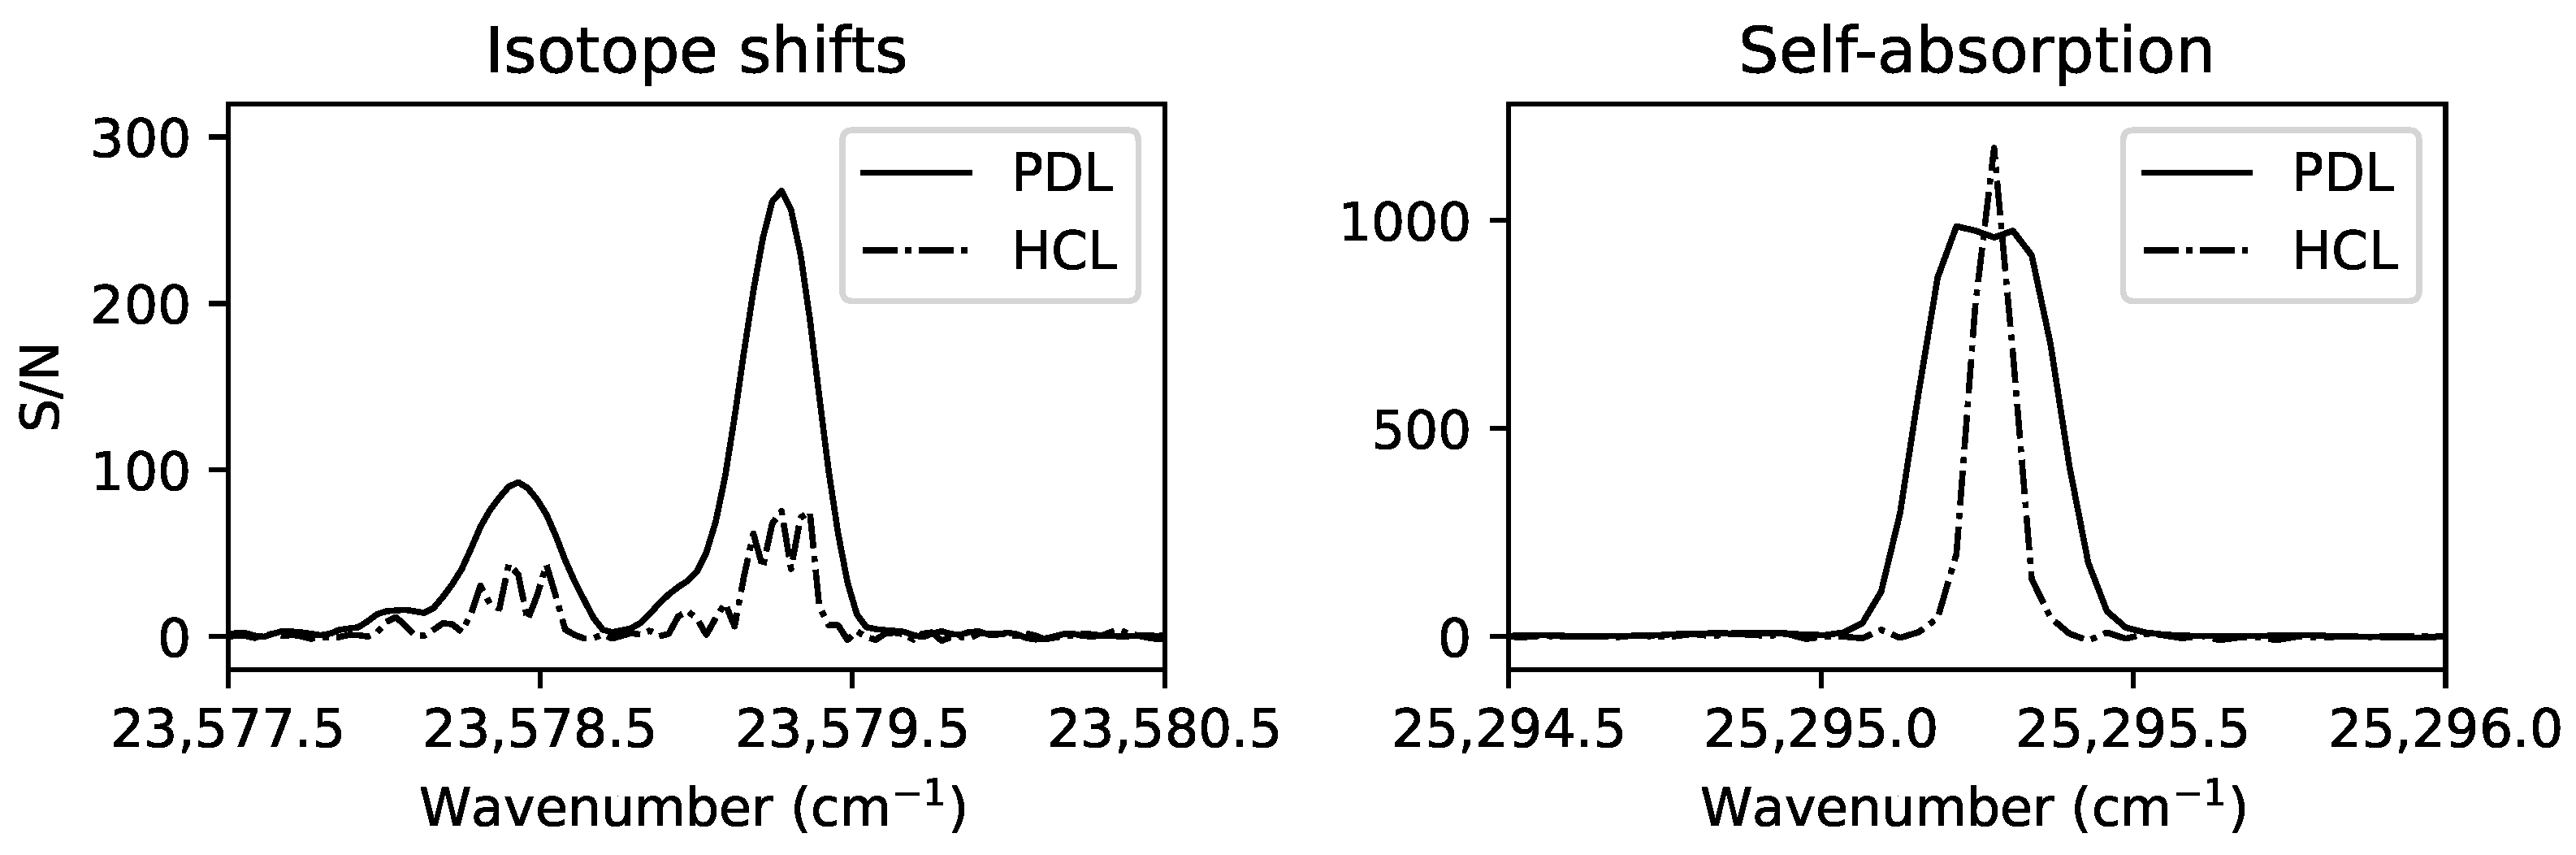
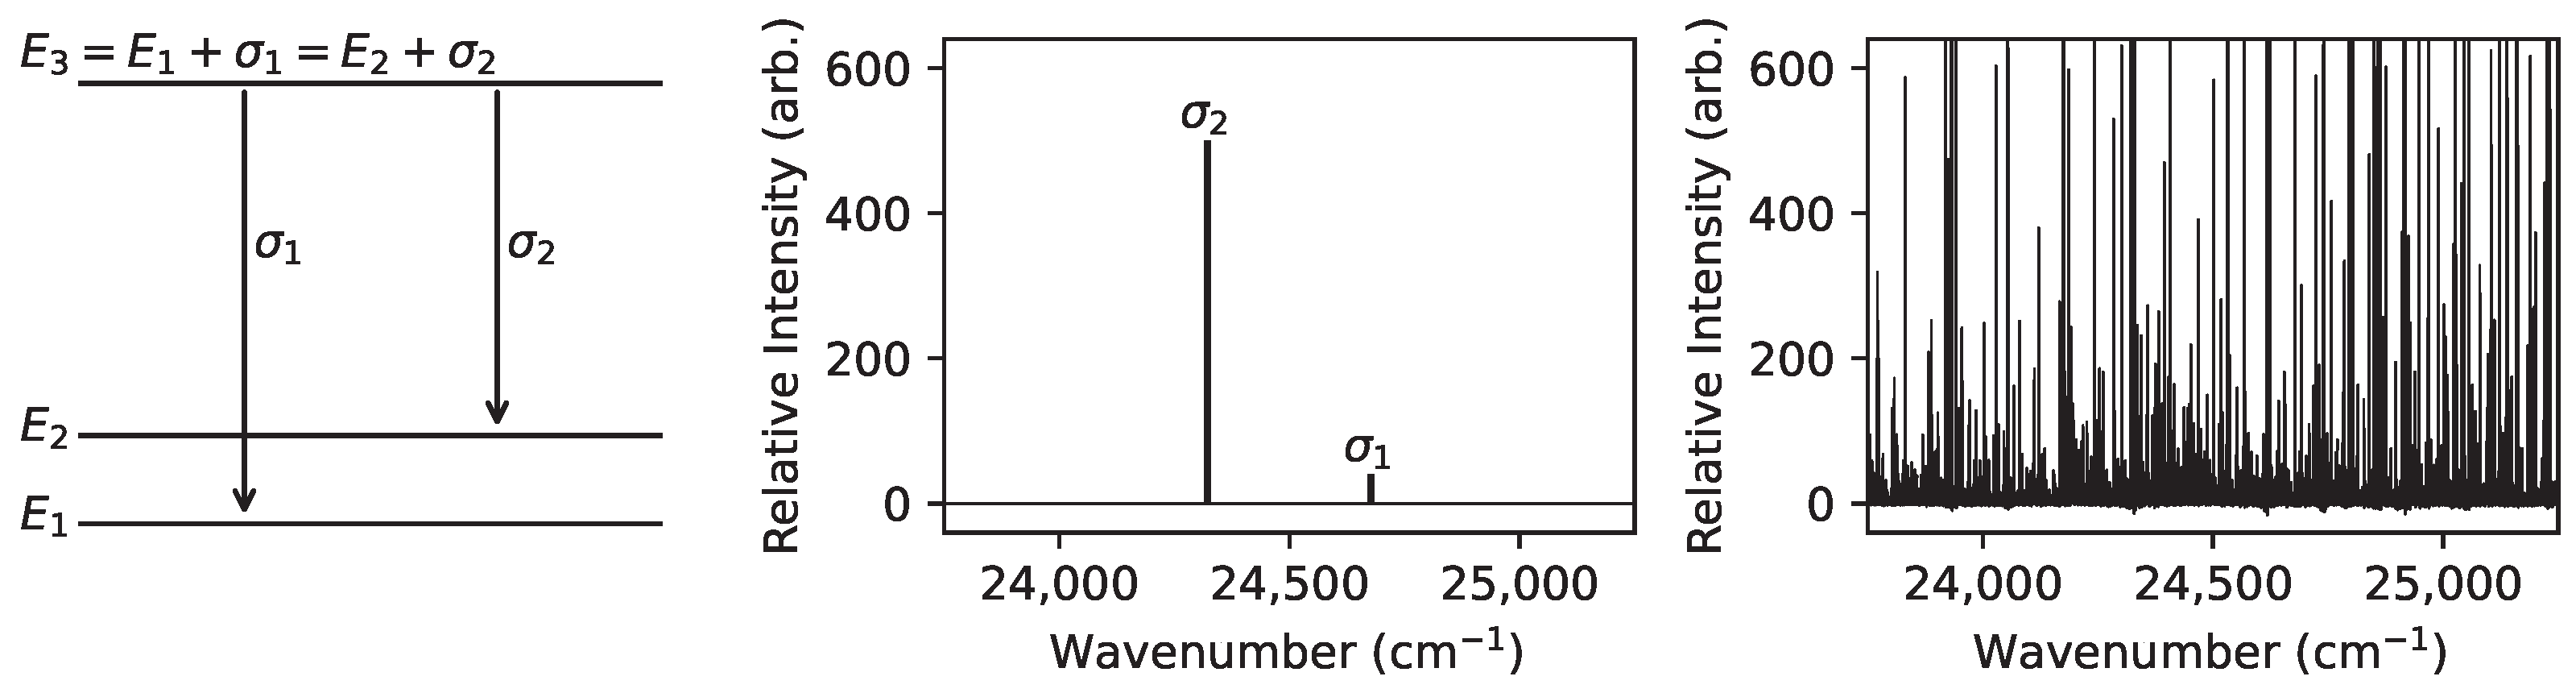
Empirical identification of fine structure energy levels involves guidance from atomic structure and spectrum calculations, where observed wavelengths and intensities are matched with the expected energy level separations, level populations, and transition probabilities [40,41,42,43]. An example attempt of energy level identification is illustrated in Figure 2, where the task is to match two observed lines to the two theoretically predicted transitions while ensuring consistency between the level energy and transition wavenumber, as well as the experimental and theoretical line intensity ratios, within associated uncertainties. Due to the immense number of spectral lines and the finite accuracy of both measurement and calculation of the wavelengths and relative intensities, ambiguous matches can arise for particular spectral line patterns. Such ambiguities are subject to elimination by ensuring consistency of the optimised level energies [44] (agreement between the observed and Ritz wavelengths within uncertainties) and corroboration with other experimental evidence, such as investigating line intensities and line profiles under varying discharge conditions (e.g., Figure 1), different carrier gases, and magnetic fields. In many cases, however, ambiguities cannot be fully eliminated and must be resolved through trial and error, particularly for levels with only weak lines, as there are far more weak lines than strong lines [37]. This is typically the case for higher-lying levels with lower populations and less accurate calculations.
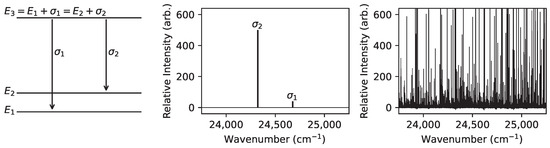
Figure 2.
An illustration of a search for an energy level with experimentally unknown energy using two connecting levels with experimentally known energies . The Grotrian diagram on the left shows the relationships between the transition wavenumbers and level energies . The predicted spectral lines are shown in the middle on the same scale as the corresponding search region within an example observed spectrum (Nd FT spectrum [13]) shown on the right.
Generally, at the end of an empirical energy level analysis, a significant fraction of observed and predicted spectral lines remain unclassified due to resource constraints and diminishing returns on accurate results. This is partly the result of the insufficient sensitivity of the instruments, meaning that there may be insufficient lines observed involving a particular level to allow its identification, as well as the limited accuracy of theoretically calculated weaker transitions and their corresponding levels, leading to poor guidance in the search for some levels. The length of the energy level analysis for a single low-ionisation-stage species of an open d- and f-subshell species typically takes at least a few years for an atomic spectroscopist, which includes spectrum acquisition, line list creation, wavelength and intensity calibrations, and energy level identifications with dynamic alterations to the line list as the analysis proceeds when, for example, ambiguous spectral line profiles (e.g., Figure 1) are reinterpreted.
5. Calculating Heavy Element Atomic Structure and Spectra
The quantum N-body problem of many-electron atoms requires significant approximations. State-of-the-art atomic structure codes, such as GRASP2K [45], FAC [46], HULLAC [47], and AUTOSTRUCTURE [48], are widely used in calculating the heavy element atomic structure and spectra. For empirical fine structure energy level analysis of low-ionisation-stage open d- and f-subshell elements, these codes provide impressive ab initio accuracies of a few percent, which enable reliable identifications of the lowest-lying levels of both even and odd parities of each species. However, as the analysis progresses to higher-lying levels, ab initio theoretical accuracies become a limiting factor due to increasing level densities. In these cases, lengthy semi-empirical calculations [49,50,51,52] are common approaches to achieving accuracies of a few tenths of a percent for energy levels in close proximity to known levels. These methods build upon the Slater–Condon approach, treating radial integrals of the Hamiltonian matrix elements and the configuration average energy as the most significant parameters that are obtainable by least-squares fitting with experimentally determined energy levels.
A comprehensive empirical energy level analysis often requires semi-empirical calculations to be conducted in parallel, systematically improving these calculations as new levels are found. It is important to note that transition wavelength uncertainties to the order of tenths of a percent are still insufficient for high-resolution (∼100,000 resolving power) astrophysical spectra. Similarly, while theoretically predicted wavelength accuracies to the order of tenths of a percent can resolve many ambiguities in energy level identifications from laboratory spectra with tens of thousands of spectral lines, spectra recorded under differing plasma conditions may still be necessary to confidently identify levels.
6. Outlook
Obtaining empirical fine structure level energies and transition wavelengths for just a single low-ionisation stage of an open d- or f-subshell species requires significant multi-disciplinary and international collaboration between different laboratories, theoretical atomic physicists, discharge plasma physicists, and astrophysicists. Data for energy levels and transition wavelengths are also essential for determining accurate transition probabilities, isotope shifts, and hyperfine structure constants, which are also of great interest in astrophysical spectroscopy. With ongoing developments in observational astronomy, the demand for atomic data is set to increase. Stellar spectroscopists are still waiting for many wavelengths and transition probabilities to be determined, and kilonova investigations still require large-scale open f-shell atomic structure and spectrum calculations to be constrained by empirical energy levels [53].
The experimental, analytical, and theoretical methods discussed in this article have been extensively applied to the iron-group (open 3d subshell) elements over the past 30 years [8,54], but there are, of course, still a few more rows of elements of the periodic table to be investigated comprehensively using these state-of-the art approaches. While most of the past three decades have focused on carrying out spectrum analyses, advances in experimental and theoretical techniques have enhanced the efficiency and quality of analyses. Another promising direction may emerge from the rapidly evolving field of artificial intelligence. Studies on applying artificial intelligence algorithms to atomic data have begun, and examples include transition probabilities modelling [55], fusion plasma spectra denoising [56], modelling corrections to ab initio calculations [57], electron-impact broadening parameters modelling [58], and FT atomic spectral line detection [59].
Funding
This research was funded by the Science and Technology Facilities Council (STFC) of the UK, the Physics Department of Imperial College London, and The Bequest of Professor Edward Steers.
Data Availability Statement
No new data were created or analysed in this study. Data sharing is not applicable to this article.
Acknowledgments
The author would like to thank Juliet C. Pickering for her suggestions regarding the contents of the conference talk and this article.
Conflicts of Interest
The author declares no conflcit of interest.
References
- Atkins, J.F.; Baranov, P.V. Nailing fingerprints in the stars. Nature 2013, 503, 437. [Google Scholar]
- Heiter, U.; Lind, K.; Bergemann, M.; Asplund, M.; Mikolaitis, Š.; Barklem, P.S.; Masseron, T.; de Laverny, P.; Magrini, L.; Edvardsson, B.; et al. Atomic data for the Gaia-ESO survey. Astron. Astrophys. 2021, 645, A106. [Google Scholar] [CrossRef]
- Cowan, J.J.; Sneden, C.; Lawler, J.E.; Aprahamian, A.; Wiescher, M.; Langanke, K.; Martínez-Pinedo, G.; Thielemann, F.K. Origin of the heaviest elements: The rapid neutron-capture process. Rev. Mod. Phys. 2021, 93, 015002. [Google Scholar] [CrossRef]
- Wells, M.; Pel, J.W.; Glasse, A.; Wright, G.S.; Aitink-Kroes, G.; Azzollini, R.; Beard, S.; Brandl, B.R.; Gallie, A.; Geers, V.C.; et al. The Mid-Infrared Instrument for the James Webb Space Telescope, VI: The Medium Resolution Spectrometer. Publ. Astron. Soc. Pac. 2015, 127, 646. [Google Scholar] [CrossRef]
- Dekker, H.; D’Odorico, S.; Kaufer, A.; Delabre, B.; Kotzlowski, H. Design, construction, and performance of UVES, the echelle spectrograph for the UT2 Kueyen Telescope at the ESO Paranal Observatory. In Proceedings of the Optical and IR Telescope Instrumentation and Detectors, Munich, Germany, 27–31 March 2000; Volume 4008, pp. 534–545. [Google Scholar]
- Rickman, E.; Rickman, E.; Brown, J. STIS Instrument Handbook, Version 23.0; STScI: Baltimore, MD, USA, 2024; Available online: https://hst-docs.stsci.edu/stisihb (accessed on 26 February 2025).
- Kurucz, R.L. Atomic data for interpreting stellar spectra: Isotopic and hyperfine data. Phys. Scr. 1993, 1993, 110. [Google Scholar] [CrossRef]
- Pickering, J.C.; Belmonte, M.T.; Clear, C.P.; Liggins, F.; Concepcion-Mairey, F. Recent advances in experimental laboratory astrophysics for stellar astrophysics applications and future data needs. Proc. Int. Astron. Union 2019, 15, 220–228. [Google Scholar] [CrossRef]
- Gilmozzi, R.; Spyromilio, J. The European Extremely Large Telescope (E-ELT). Messenger 2007, 127, 3. [Google Scholar]
- The JUST Team; Liu, C.; Zu, Y.; Feng, F.; Li, Z.; Yu, Y.; Bai, H.; Cui, X.; Gu, B.; Gu, Y.; et al. The Jiao Tong University Spectroscopic Telescope Project. Astron. Tech. Instrum. 2024, 1, 16–30. [Google Scholar]
- Punturo, M.; Abernathy, M.; Acernese, F.; Allen, B.; Andersson, N.; Arun, K.; Barone, F.; Barr, B.; Barsuglia, M.; Beker, M.; et al. The Einstein Telescope: A third-generation gravitational wave observatory. Class. Quantum Gravity 2010, 27, 194002. [Google Scholar] [CrossRef]
- Reitze, D.; Adhikari, R.X.; Ballmer, S.; Barish, B.; Barsotti, L.; Billingsley, G.; Brown, D.A.; Chen, Y.; Coyne, D.; Eisenstein, R.; et al. Cosmic Explorer: The U.S. Contribution to Gravitational-Wave Astronomy beyond LIGO. Bull. AAS 2019, 51, 035. [Google Scholar]
- Ding, M.; Ryabtsev, A.N.; Kononov, E.Y.; Ryabchikova, T.; Clear, C.P.; Concepcion, F.; Pickering, J.C. Spectrum and energy levels of the low-lying configurations of Nd III. Astron. Astrophys. 2024, 684, A149. [Google Scholar] [CrossRef]
- Ding, M.; Ryabtsev, A.N.; Kononov, E.Y.; Ryabchikova, T.; Pickering, J.C. Spectrum and energy levels of the high-lying singly excited configurations of Nd III—New Nd III experimental energy levels and wavelengths, with transition probability and ionisation energy calculations. Astron. Astrophys. 2024, 692, A33. [Google Scholar] [CrossRef]
- Thorne, A.; Litzén, U.; Johansson, S. Spectrophysics: Principles and Applications; Springer: Berlin/Heidelberg, Germany, 1999. [Google Scholar]
- Thorne, A.P.; Harris, C.J.; Wynne-Jones, I.; Learner, R.C.M.; Cox, G. A Fourier transform spectrometer for the vacuum ultraviolet: Design and performance. J. Phys. E Sci. Instrum. 1987, 20, 54. [Google Scholar] [CrossRef]
- Reader, J. Atomic spectroscopy at NIST: 2001. In Proceedings of the Harnessing Light: Optical Science and Metrology at NIST, San Digeo, CA, USA, 1 August 2001; Volume 4450, pp. 127–139. [Google Scholar]
- De Oliveira, N.; Joyeux, D.; Phalippou, D.; Rodier, J.C.; Polack, F.; Vervloet, M.; Nahon, L. A Fourier transform spectrometer without a beam splitter for the vacuum ultraviolet range: From the optical design to the first UV spectrum. Rev. Sci. Instrum. 2009, 80, 043101. [Google Scholar] [CrossRef]
- Tchang-Brillet, W.Ü.L.; Azarov, V.I. Recent laboratory studies of multiply charged ion spectra using high resolution VUV spectrographs. Phys. Scr. 2002, 2002, 104. [Google Scholar] [CrossRef]
- Zhang, Z.; Svanberg, S.; Palmeri, P.; Quinet, P.; Biémont, E. Measurement of lifetimes by laser-induced fluorescence and determination of transition probabilities of astrophysical interest in Nd III. Astron. Astrophys. 2002, 385, 724–732. [Google Scholar] [CrossRef]
- Kodangil, S.; Domoto, N.; Tanaka, M.; Kato, D.; Gaigalas, G.; Tanuma, H.; Nakamura, N. Measurement of transition probabilities of La II using Laser Induced Breakdown Spectroscopy (LIBS). J. Quant. Spectrosc. Radiat. Transf. 2024, 322, 109011. [Google Scholar] [CrossRef]
- Naoi, Y.; Iwata, M.; Yokota, D.; Gaigalas, G.; Kato, D.; Murakami, I.; Sakaue, H.A.; Sekiguchi, Y.; Tanaka, M.; Tanuma, H.; et al. Laser Induced Breakdown Spectroscopy of Er II for Transition Probability Measurements. Appl. Sci. 2022, 12, 2219. [Google Scholar] [CrossRef]
- Sikström, C.M.; Nilsson, H.; Litzén, U.; Blom, A.; Lundberg, H. Uncertainty of oscillator strengths derived from lifetimes and branching fractions. J. Quant. Spectrosc. Radiat. Transf. 2002, 74, 355–368. [Google Scholar] [CrossRef]
- Mavrodineanu, R. Hollow cathode discharges: Analytical applications. J. Res. Natl. Bur. Stand. 1984, 89, 143. [Google Scholar] [CrossRef]
- Danzmann, K.; Günther, M.; Fischer, J.; Kock, M.; Kühne, M. High current hollow cathode as a radiometric transfer standard source for the extreme vacuum ultraviolet. Appl. Opt. 1988, 27, 4947–4951. [Google Scholar] [CrossRef] [PubMed]
- Finley, D.S.; Jelinsky, P.; Bowyer, S.; Malina, R.F. A Penning discharge source for extreme ultraviolet calibration. In Proceedings of the X-Ray Calibration: Techniques, Sources, and Detectors, San Diego, CA, USA, 19–20 August 1986; Volume 689, pp. 6–10. [Google Scholar]
- Heise, C.; Hollandt, J.; Kling, R.; Kock, M.; Kühne, M. Radiometric characterization of a Penning discharge in the vacuum ultraviolet. Appl. Opt. 1994, 33, 5111–5117. [Google Scholar] [CrossRef] [PubMed]
- Worden, E.F.; Gutmacher, R.G.; Conway, J.G. Use of electrodeless discharge lamps in the analysis of atomic spectra. Appl. Opt. 1963, 2, 707–713. [Google Scholar] [CrossRef]
- Bockasten, K. A study of C III by means of a sliding vacuum spark. Ark Fys. 1955, 9, 457–482. [Google Scholar]
- Castelli, F.; Kurucz, R.L. New Fe II energy levels from stellar spectra. Astron. Astrophys. 2010, 520, A57. [Google Scholar] [CrossRef]
- Dieke, G.H.; Crosswhite, H.M. The spectra of the doubly and triply ionized rare earths. Appl. Opt. 1963, 2, 675–686. [Google Scholar] [CrossRef]
- Cowan, R.D.; Dieke, G.H. Self-absorption of spectrum lines. Rev. Mod. Phys. 1948, 20, 418. [Google Scholar] [CrossRef]
- Johansson, S.; Litzén, U. Possibilities of obtaining laser action from singly ionised iron group elements through charge transfer in hollow cathode lasers. J. Phys. B At. Mol. Phys. 1980, 13, L253. [Google Scholar] [CrossRef]
- Green, J.M.; Webb, C.E. The production of excited metal ions in thermal energy charge transfer and Penning reactions. J. Phys. B At. Mol. Phys. 1974, 7, 1698. [Google Scholar] [CrossRef]
- Nave, G.; Johansson, S. The spectrum of Fe II. Astrophys. J. Suppl. Ser. 2013, 204, 1. [Google Scholar] [CrossRef]
- Reader, J.; Davis, S.P. Fundamental Energy Levels of Neutral Promethium (Pm I). J. Res. Natl. Bur. Stand. Sect. A Phys. Chem. 1967, 71, 587. [Google Scholar] [CrossRef]
- Learner, R.C.M. A simple (and unexpected) experimental law relating to the number of weak lines in a complex spectrum. J. Phys. B At. Mol. Phys. 1982, 15, L891. [Google Scholar] [CrossRef]
- Nave, G.; Griesmann, U.; Brault, J.W.; Abrams, M.C. Xgremlin: Interferograms and Spectra from Fourier Transform Spectrometers Analysis. Astrophysics Source Code Library, Record ascl:1511.004. 2015. Available online: https://www.ascl.net/1511.004 (accessed on 26 February 2025).
- Engström, L. GFit, A Computer Program to Determine Peak Positions and Intensities in Experimental Spectra; Lund Reports in Atomic Physics; Lund University: Lund, Sweden, 1998; Volume LRAP-232. [Google Scholar]
- Azarov, V.I. Formal approach to the solution of the complex-spectra identification problem. I. Theory. Phys. Scr. 1991, 44, 528. [Google Scholar] [CrossRef]
- Azarov, V.I. Formal approach to the solution of the complex-spectra identification problem. 2. Implementation. Phys. Scr. 1993, 48, 656. [Google Scholar] [CrossRef]
- Azarov, V.I.; Kramida, A.; Vokhmentsev, M.Y. IDEN2—A program for visual identification of spectral lines and energy levels in optical spectra of atoms and simple molecules. Comput. Phys. Commun. 2018, 225, 149–153. [Google Scholar] [CrossRef]
- Johansson, S. Term analysis of a complex spectrum. Phys. Scr. 1996, 1996, 7. [Google Scholar] [CrossRef]
- Kramida, A.E. The program LOPT for least-squares optimization of energy levels. Comput. Phys. Commun. 2011, 182, 419–434. [Google Scholar] [CrossRef]
- Jönsson, P.; Gaigalas, G.; Bieroń, J.; Fischer, C.F.; Grant, I.P. New version: GRASP2K relativistic atomic structure package. Comput. Phys. Commun. 2013, 184, 2197–2203. [Google Scholar] [CrossRef]
- Gu, M.F. The flexible atomic code. Can. J. Phys. 2008, 86, 675–689. [Google Scholar] [CrossRef]
- Bar-Shalom, A.; Klapisch, M.; Oreg, J. HULLAC, an integrated computer package for atomic processes in plasmas. J. Quant. Spectrosc. Radiat. Transf. 2001, 71, 169–188. [Google Scholar] [CrossRef]
- Badnell, N.R. Autostructure: General Program for Calculation of Atomic and Ionic Properties. Astrophysics Source Code Library, Record ascl:1612.014. 2016. Available online: https://www.ascl.net/1612.014 (accessed on 26 February 2025).
- Cowan, R.D. The Theory of Atomic Structure and Spectra; University of California Press: Berkeley, CA, USA, 1981. [Google Scholar]
- Kurucz, R.L. Including all the lines: Data releases for spectra and opacities. Can. J. Phys. 2017, 95, 825–827. [Google Scholar] [CrossRef]
- Elantkowska, M.; Ruczkowski, J.; Dembczyński, J. Construction of the energy matrix for complex atoms Part I: General remarks. Eur. Phys. J. Plus 2015, 130, 14. [Google Scholar] [CrossRef]
- Uylings, P.; Raassen, T. Orthogonal Operators: Applications, Origin and Outlook. Atoms 2019, 7, 102. [Google Scholar] [CrossRef]
- Rahmouni, S.; Tanaka, M.; Domoto, N.; Kato, D.; Hotokezaka, K.; Aoki, W.; Hirano, T.; Kotani, T.; Kuzuhara, M.; Tamura, M. Revisiting Near-infrared Features of Kilonovae: The Importance of Gadolinium. Astrophys. J. 2025, 980, 43. [Google Scholar] [CrossRef]
- Kramida, A.; Ralchenko, Y.; Reader, J.; The NIST ASD Team. NIST Atomic Spectra Database, Version 5.12; National Institute of Standards and Technology: Gaithersburg, MD, USA, 2024.
- Michalenko, J.J.; Murzyn, C.M.; Zollweg, J.D.; Wermer, L.; Van Omen, A.J.; Clemenson, M.D. Machine learning predictions of transition probabilities in atomic spectra. Atoms 2021, 9, 2. [Google Scholar] [CrossRef]
- Saura, N.; Garrido, D.; Benkadda, S.; Ibano, K.; Ueda, Y.; Hamaguchi, S. Spectroscopic analysis improvement using convolutional neural networks. J. Phys. D Appl. Phys. 2023, 56, 354001. [Google Scholar] [CrossRef]
- Ma, K.; Yang, C.; Zhang, J.; Li, Y.; Jiang, G.; Chai, J. Machine Learning-Assisted Hartree–Fock Approach for Energy Level Calculations in the Neutral Ytterbium Atom. Entropy 2024, 26, 962. [Google Scholar] [CrossRef]
- Zakuskin, A.S.; Labutin, T.A. StarkML: Application of machine learning to overcome lack of data on electron-impact broadening parameters. Mon. Not. R. Astron. Soc. 2024, 527, 3139–3145. [Google Scholar] [CrossRef]
- Ding, M.; Lim, S.Z.J.; Yu, X.; Clear, C.P.; Pickering, J.C. A neural network approach for line detection in complex atomic emission spectra measured by high-resolution Fourier transform spectroscopy. arXiv 2025, arXiv:2501.12276. [Google Scholar]
Disclaimer/Publisher’s Note: The statements, opinions and data contained in all publications are solely those of the individual author(s) and contributor(s) and not of MDPI and/or the editor(s). MDPI and/or the editor(s) disclaim responsibility for any injury to people or property resulting from any ideas, methods, instructions or products referred to in the content. |
© 2025 by the author. Licensee MDPI, Basel, Switzerland. This article is an open access article distributed under the terms and conditions of the Creative Commons Attribution (CC BY) license (https://creativecommons.org/licenses/by/4.0/).