1. Introduction
The differential cross-section is a measure of the probability of a particle of a given energy scattering at a given angle from a target. From this knowledge, we can obtain information about the internal structure of the target and the nature of the interactions between the target and the projectile.
We investigated positron (e
+) elastic scattering on H and He:
below the positronium (Ps) formation threshold, which is at 6.8 eV for H and 17.78 eV for He.
We also extended this investigation into the so-called Ore gap, i.e., above the Ps formation threshold and below the first excitation threshold of the target, in which there are two open channels:
where the first excitation threshold for the e
+ impact is at 10.2 eV for H and at 20.61 eV for He. The main interest in the present study was in the elastic scattering process; however, we also considered Ps formation because of the importance of the coupling between both processes within the Ore gap. The differential Ps formation cross-section has been studied in detail for both of these atoms [
1,
2]. Note that a possible channel that is not included is the annihilation of the positron with one of the target electrons. The reason for this is that over the energy region considered presently, the cross-section is known to be negligible [
3,
4]. For detailed reviews of positron scattering on atoms with recommended cross-sections, see Chiari and Zecca [
5] and Ratnavelu et al. [
6].
It is a well-known feature of positron scattering that at high energy, the total cross-section will merge with that for electron impact. However, at low energy, the integrated elastic scattering cross-sections for positrons are significantly lower than for electrons. The magnitude of the elastic differential cross-section we considered in the present work becomes large as the positron wavenumber
k tends to zero, which means that the range of magnitudes over the whole energy region is very large, and therefore, we chose to plot the logarithm of the EDCS to reveal the structures of interest. In
Section 2, we present an outline of the scattering amplitude and more details of the s-wave positron–helium wave function. We also discuss the manner in which the scattering parameters we obtained with the Kohn variational method were used to obtain the EDCS. In
Section 3, we present three-dimensional plots of the scattering amplitudes and EDCSs both below and in the Ore gap for positron scattering on hydrogen and helium. We also present the EDCSs for electron scattering on the same targets over the same energy region and discuss the differences and similarities. In
Section 4, we discuss the structures shown in
Section 3 in more detail, showing how they arose from the combinations of the individual partial waves. In
Section 5, we discuss the difficulty one has relating the description of the results in terms of partial wave contributions and interference with a more physical picture. We used atomic units (a.u.) and angles in radians throughout so that the EDCS in a.u. was
per steradian.
2. Theory
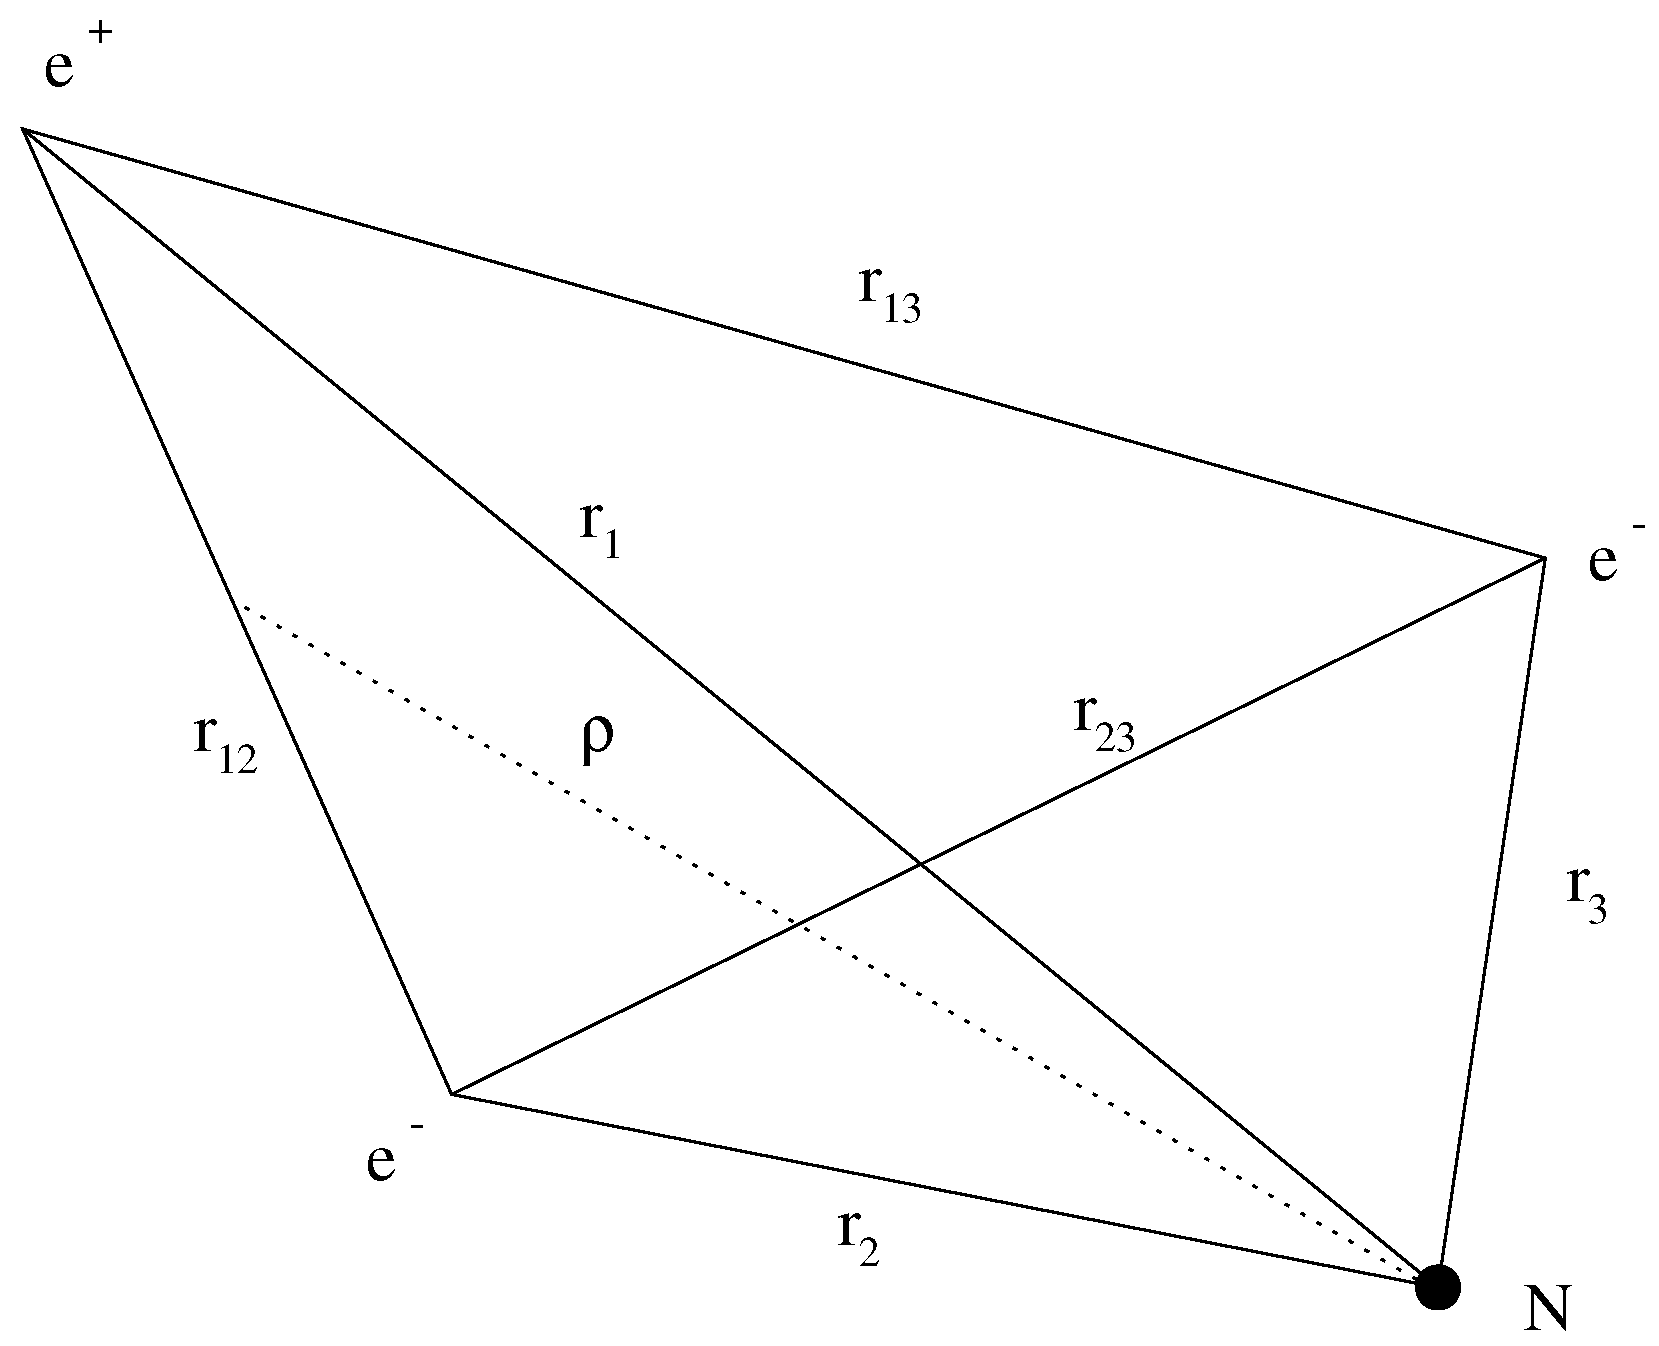
The general elastic scattering wave function is given as
i.e., a plane wave representing the incoming e
+ with wavenumber
k and coordinate
with respect to the nucleus (see
Figure 1) and an outgoing spherical wave representing the elastic scattered e
+. The latter is modulated by the scattering amplitude
, which can be expressed using a partial wave
expansion in terms of the calculated phase shifts
by
where
are the Legendre polynomials. We evaluated the scattering parameters using the Kohn variational method, as described in more detail by Charlton and Humberston [
3] and Armour and Humberston [
7]. The variational phase shifts were evaluated using two versions of this variational method, the Kohn and the inverse Kohn methods, based on different choices of the asymptotic forms of the trial wave functions. This allowed us to identify and reject results that were affected by Schwartz singularities [
8].
The elastic channel scattering trial wave function for an s-wave e
+ scattering on He [
9], using the inter-particle coordinates defined in
Figure 1, is given by
where
is the trial phase shift, and
and
are the s-wave Bessel and Neuman functions, with
shielding the singularity in the latter.
is the helium target ground state variational wave function with 22 terms, which is in agreement to within
with the most accurate value of the ground state energy and to within
with that of the dipole polarisability.
is the exchange operator for the two electrons.
The second line of Equation (
3) is a set of Hylleraas-type correlation functions, which describe the short-range behaviour of the wave function. Within the exponential term,
and
are non-linear variational parameters that can be chosen to optimise the wave function. The integer powers of the lepton coordinates and all inter-particle coordinates are such that
. Note that as the value of
m increases, more and more terms are included in the summation of Equation (
3), allowing for more flexibility in the trial wave function and an improvement in the convergence of the results. A similar scattering wave function is used for e
+ scattering on H, in which case, only three inter-particle coordinates are considered and the target wave function is now the known ground state eigenfunction for H [
10].
Within the Ore gap, where two channels are open, the trial wave function has two components with a 2 by 2
-matrix playing a similar role to the phase shifts. From this, the cross-sections for elastic scattering and positronium formation are obtained together with those for the scattering of the Ps atom on the ionised target—either elastically or leading to
capture. The details of the trial wave functions are described in [
1,
2]. In the present investigation, we concentrated mainly on elastic scattering; however, we found that the coupling to the Ps channel was important.
The elastic scattering differential cross-section can be obtained from the scattering amplitude as
where
A and
B are the imaginary and real parts of (
2) given by
From Equation (
4), one can see that in order to obtain an exact zero or very small value for the EDCS, both the real and imaginary part must be zero or very small—as we show below.
Within the Ore gap, where two channels are open, a similar expression to Equation (
2) for the scattering amplitude in terms of the
-matrix is used to evaluate the elastic scattering (
) and Ps formation (
) differential cross-section:
where
One can loosely associate these
-matrix elements as follows:
with
elastic scattering,
with Ps formation,
with the recombination of the
from the Ps atom with the ionised target and
with the Ps atom elastic scattering from the ionised target [
3].
3. Results
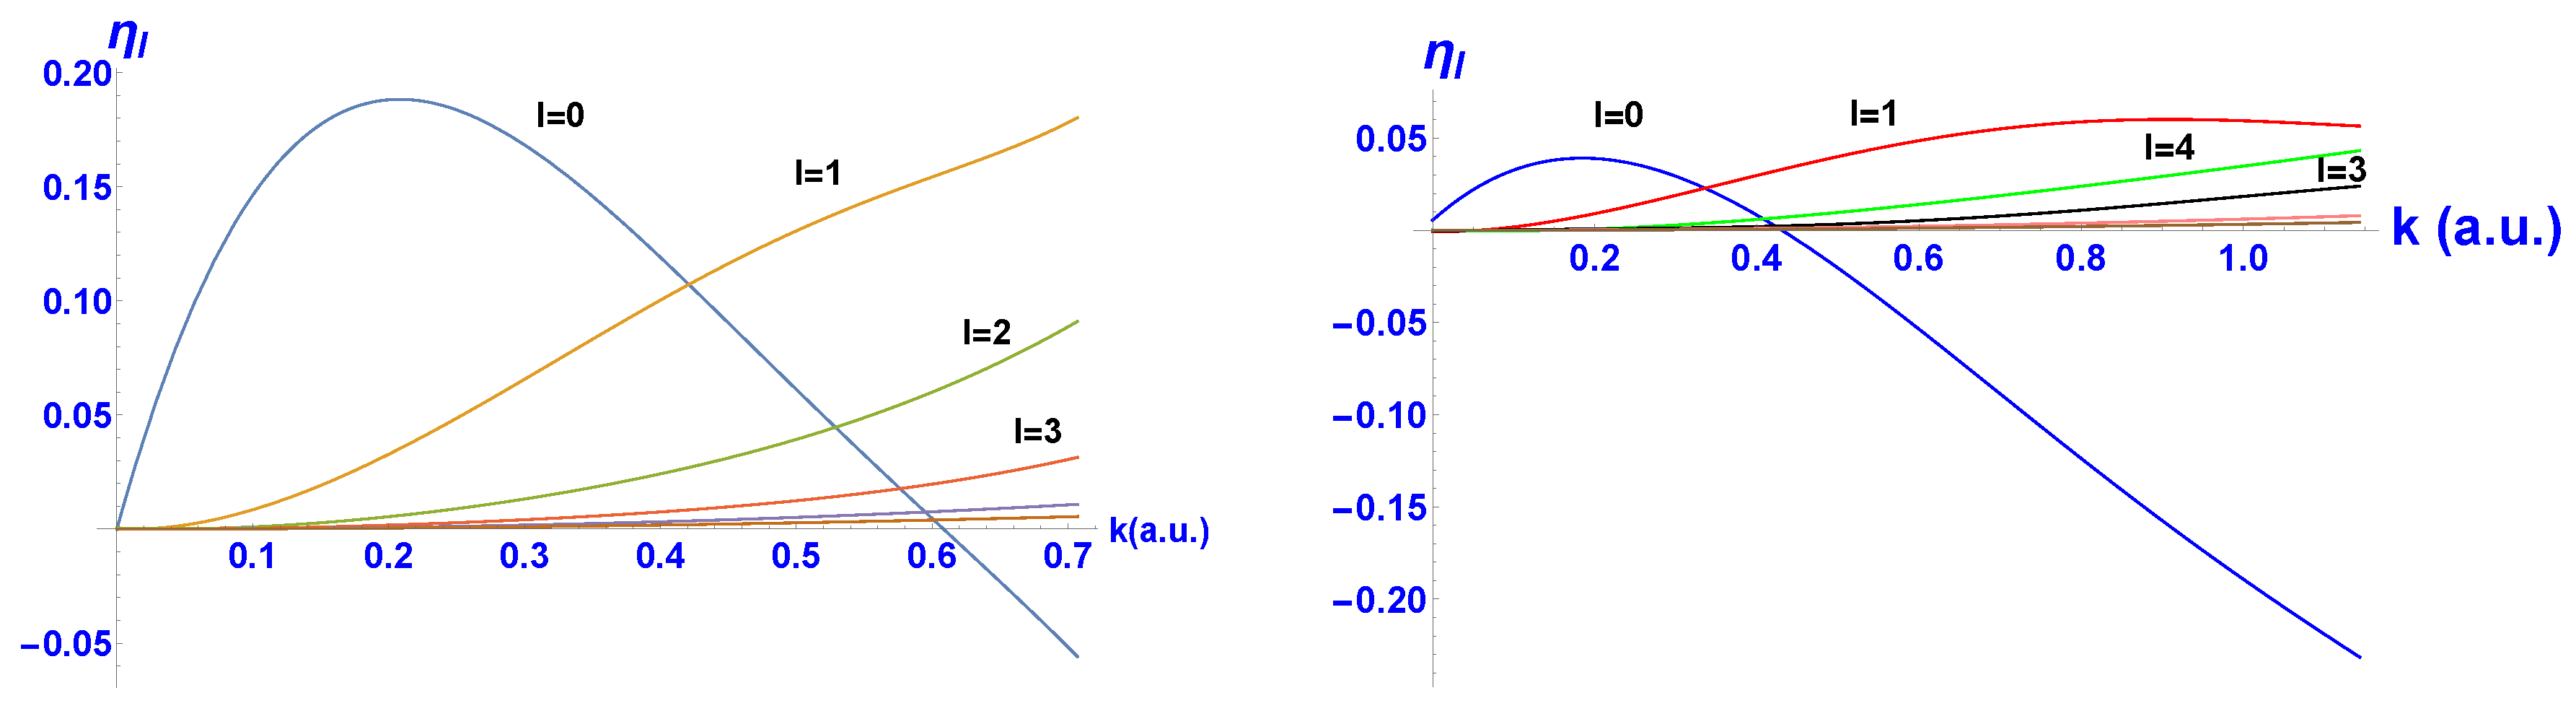
The phase shifts for
and 3 for both targets were evaluated using the Kohn and inverse Kohn methods [
7] are shown in
Figure 2. The threshold for Ps formation in terms of the wavenumber
k of the incoming positron for H is
a.u. and for He is
a.u., while the next threshold for H is
a.u. and for He is
a.u. For higher partial waves, as the phase shifts are small, we used the O’Malley formula [
11]:
where
is the dipole polarisability of the target. We found that this formula was in good agreement with the variational results for
, with at most a
difference for e
+-H and 10% for e
+-He at the highest
k values considered. Therefore, we used Equation (
9) for all partial wave contributions with
also shown in
Figure 2. For
l greater than 2, the phase shifts for e
+ scattering on both targets decreased by a factor of at least ≈ 2 as
l increased such that both the integrated and differential cross-sections converged reasonably rapidly. For both targets, the s-wave phase shift dominated at low energy, where it reached a maximum at
a.u. in the case of H and
a.u. for He and then decreased and became negative at
a.u. for H and
a.u. for He. This behaviour is explained by the fact that at low energy, the polarisation potential is attractive and dominates, so
. As the energy increases, the polarisation potential becomes less attractive, the static interaction takes over and the overall interaction becomes repulsive, so
. When the s-wave phase shift becomes zero, it gives rise to a minimum in the total elastic cross-section for H and He, i.e., the Ramsauer minimum [
3]. We discuss the effect of the zero in the s-wave phase shift on the EDCS in
Section 4. Note that, for instance, in some of the heavier noble gases, although the s-wave phase shift also goes though zero before the Ps formation threshold, the contributions of the higher partial waves are large enough to wash out the minimum in the total elastic cross-section, e.g, in Ar, while in Ne, the minimum is clearly present [
3,
6,
12].
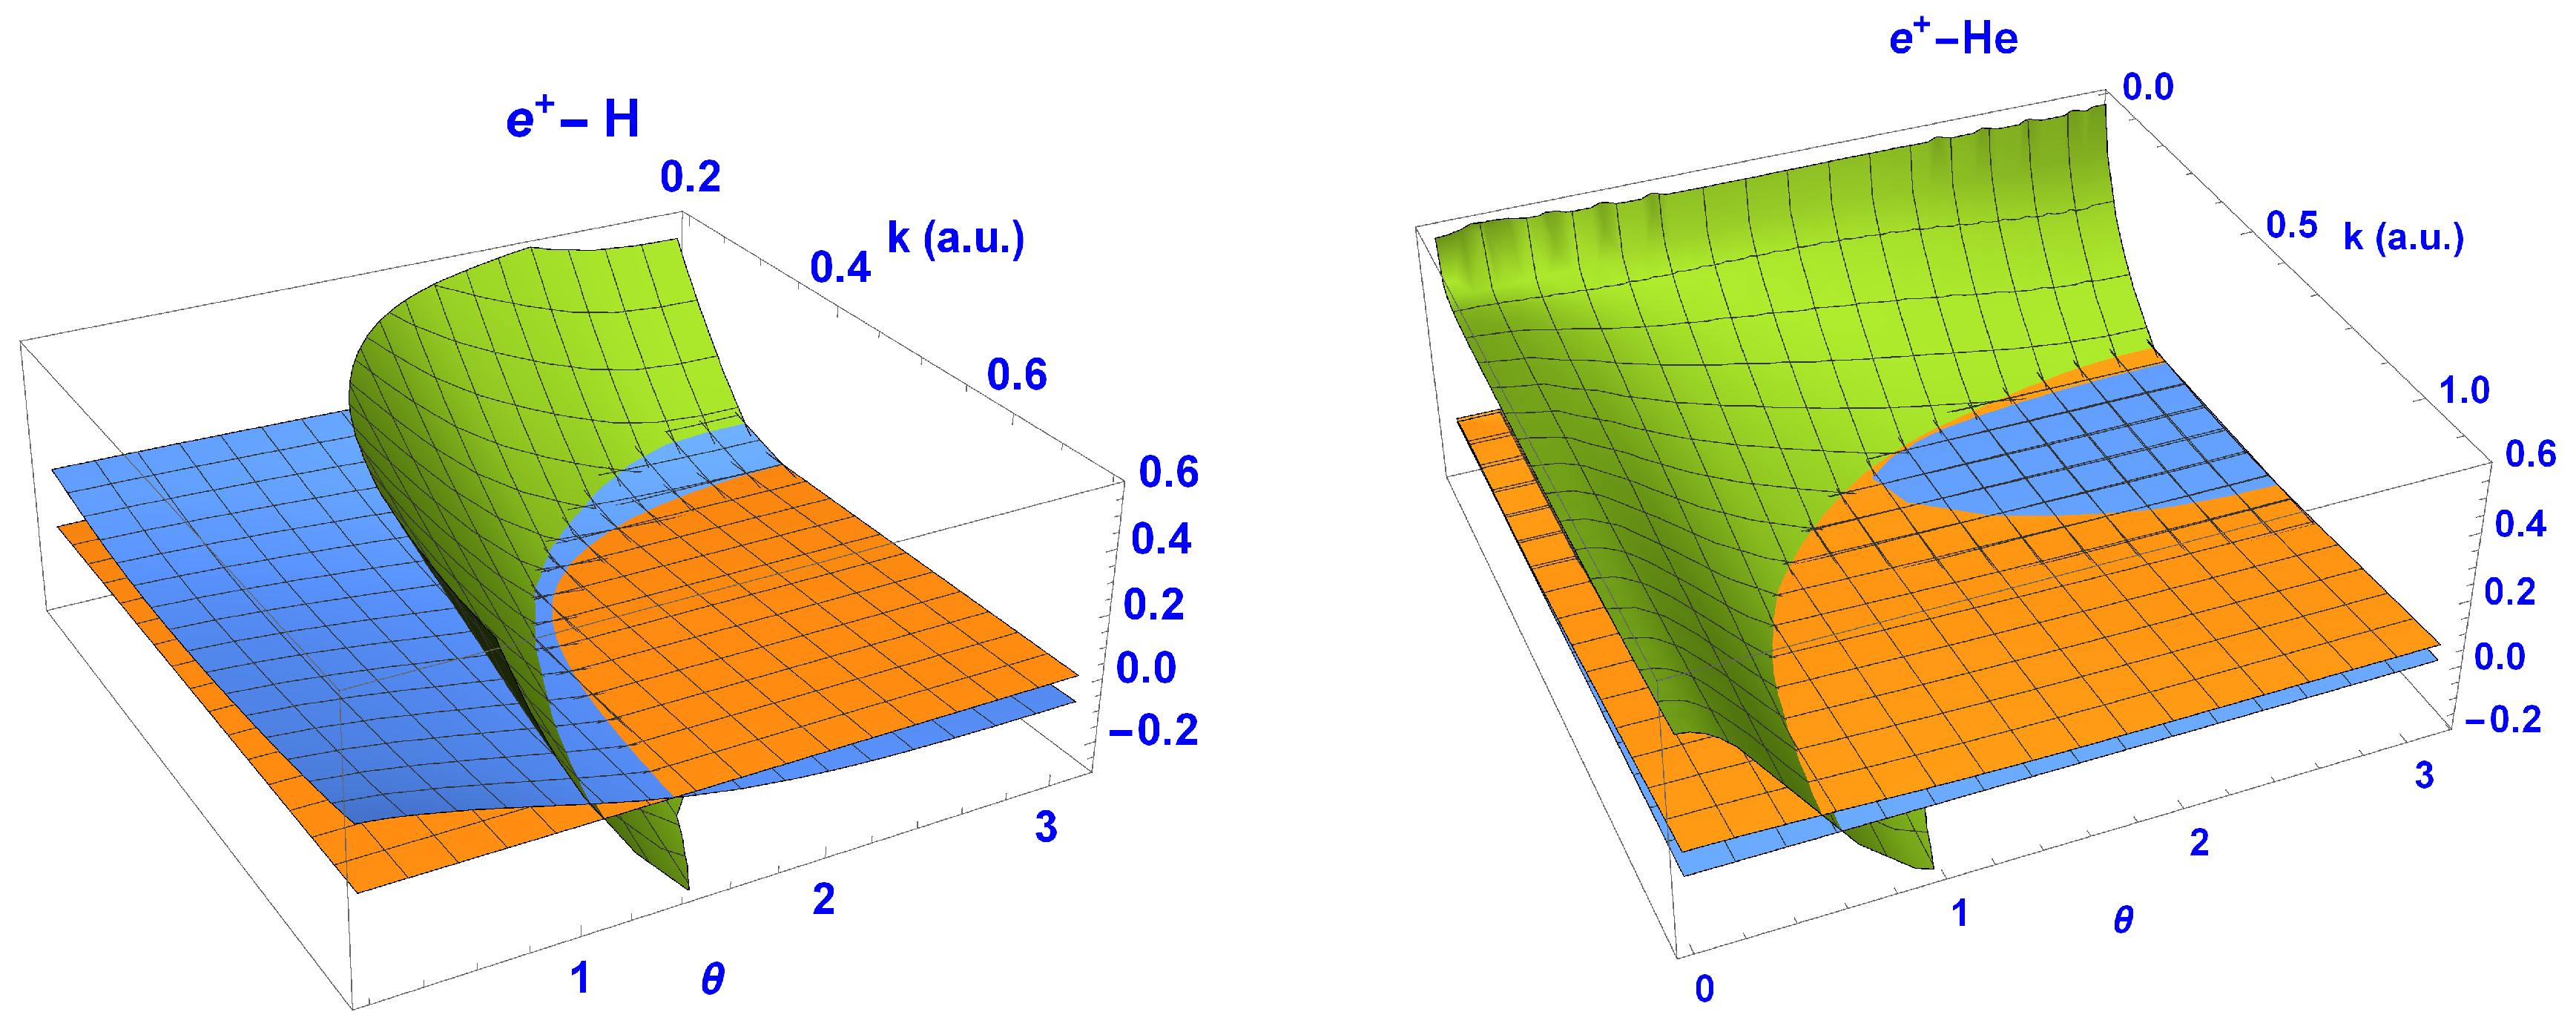
As discussed above, Equation (
4) can be split into the squares of the imaginary and real parts (Equations (
5) and (6)). These are shown in
Figure 3 as surfaces over
k and
.
In both cases, the imaginary and real surfaces of the scattering amplitude are seen to cut through the zero plane (orange) at different
k-
values, although in the case of e
+-He, the intersections are very close for
to
and
1.6 to 2.2. These results are well converged with respect to the number of partial waves used (up to
l = 6 for H and He). Hence, we are confident that these scattering amplitude surfaces would not change significantly and become zero at the same
k-
value if more partial waves were to be included. Therefore, no vortices, which require an exact zero in both Equations (
5) and (6), were to be expected in the velocity fields.
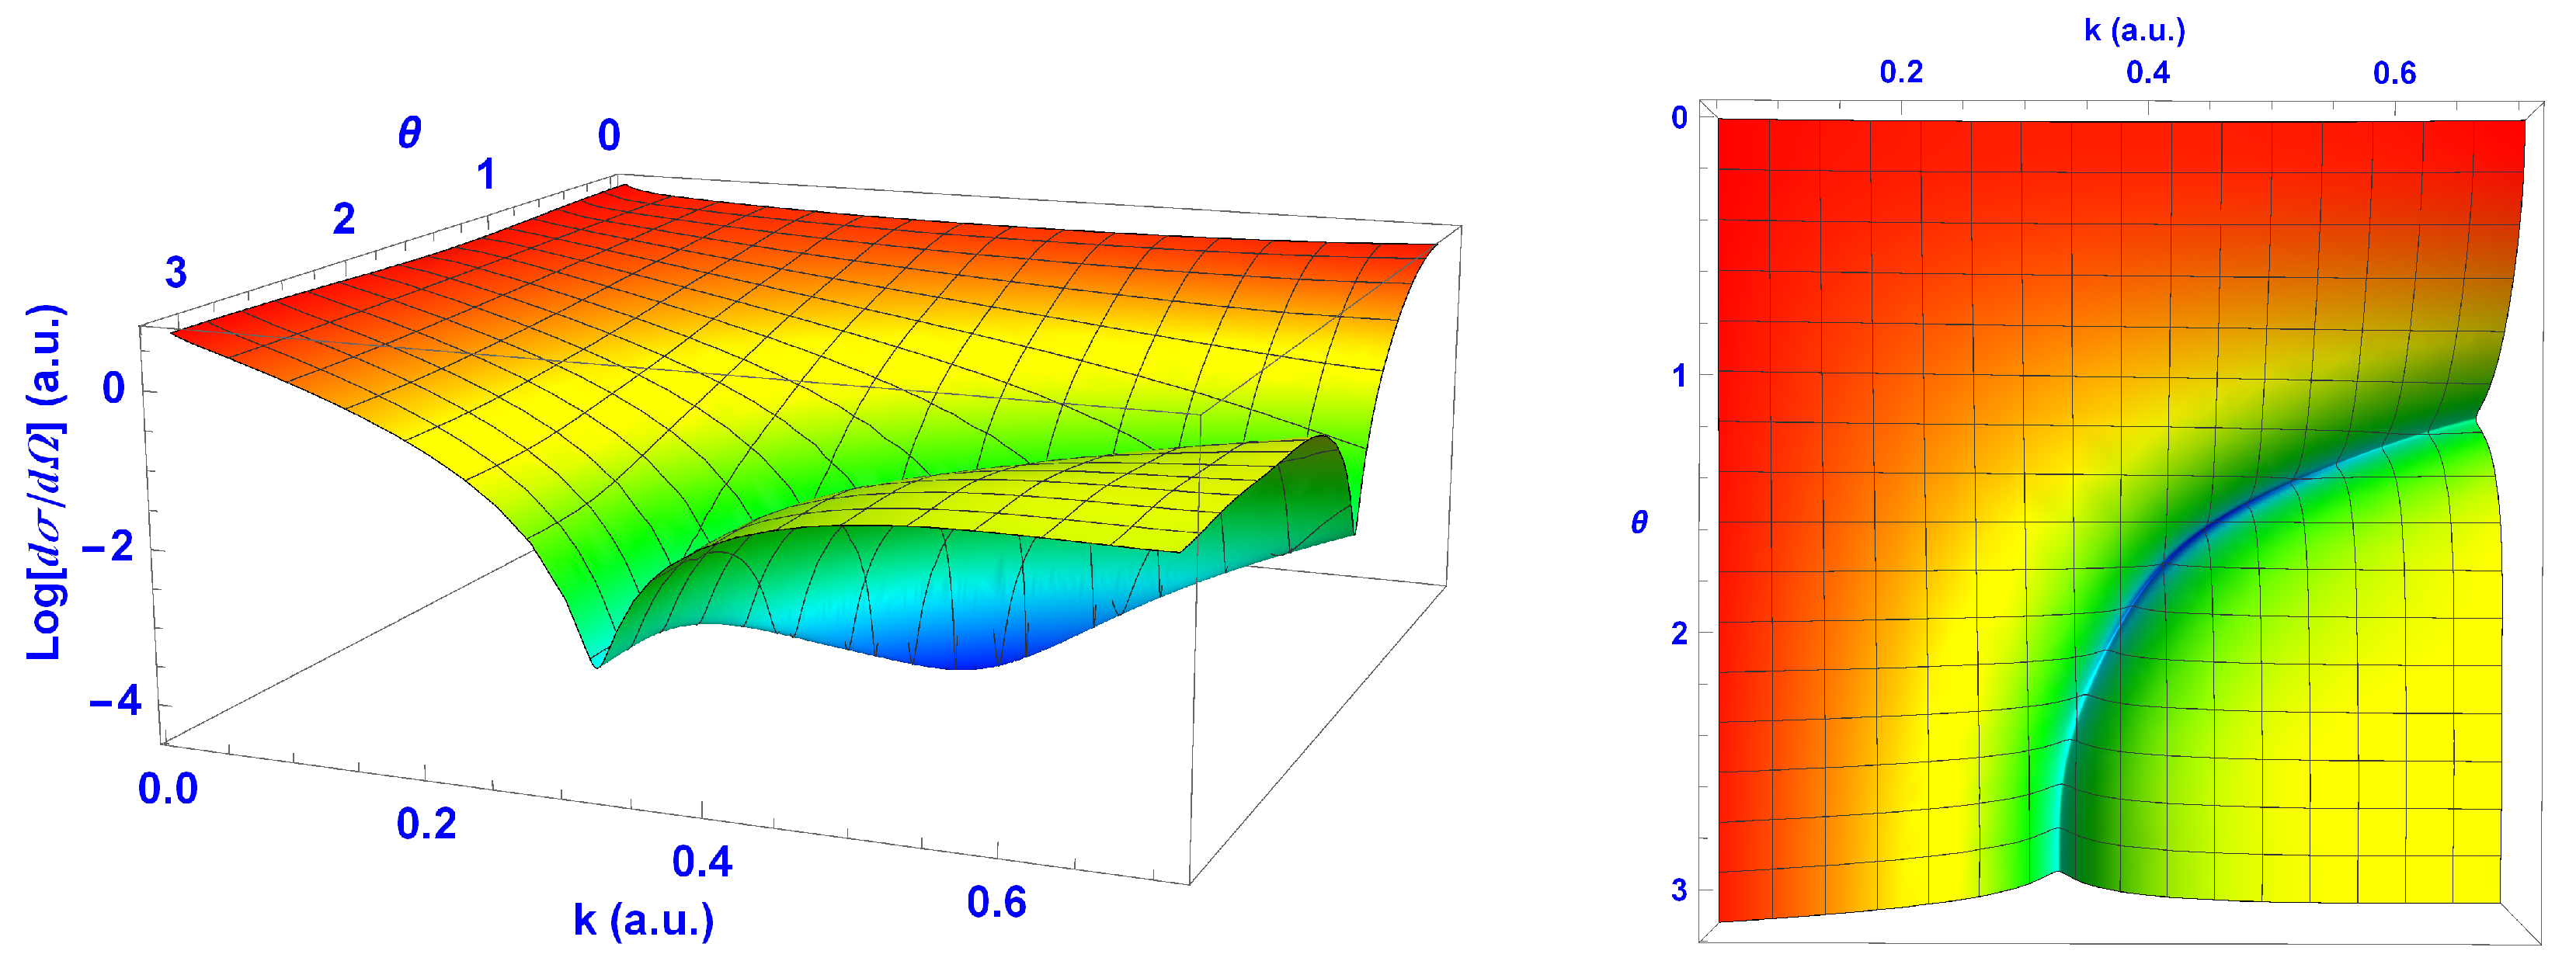
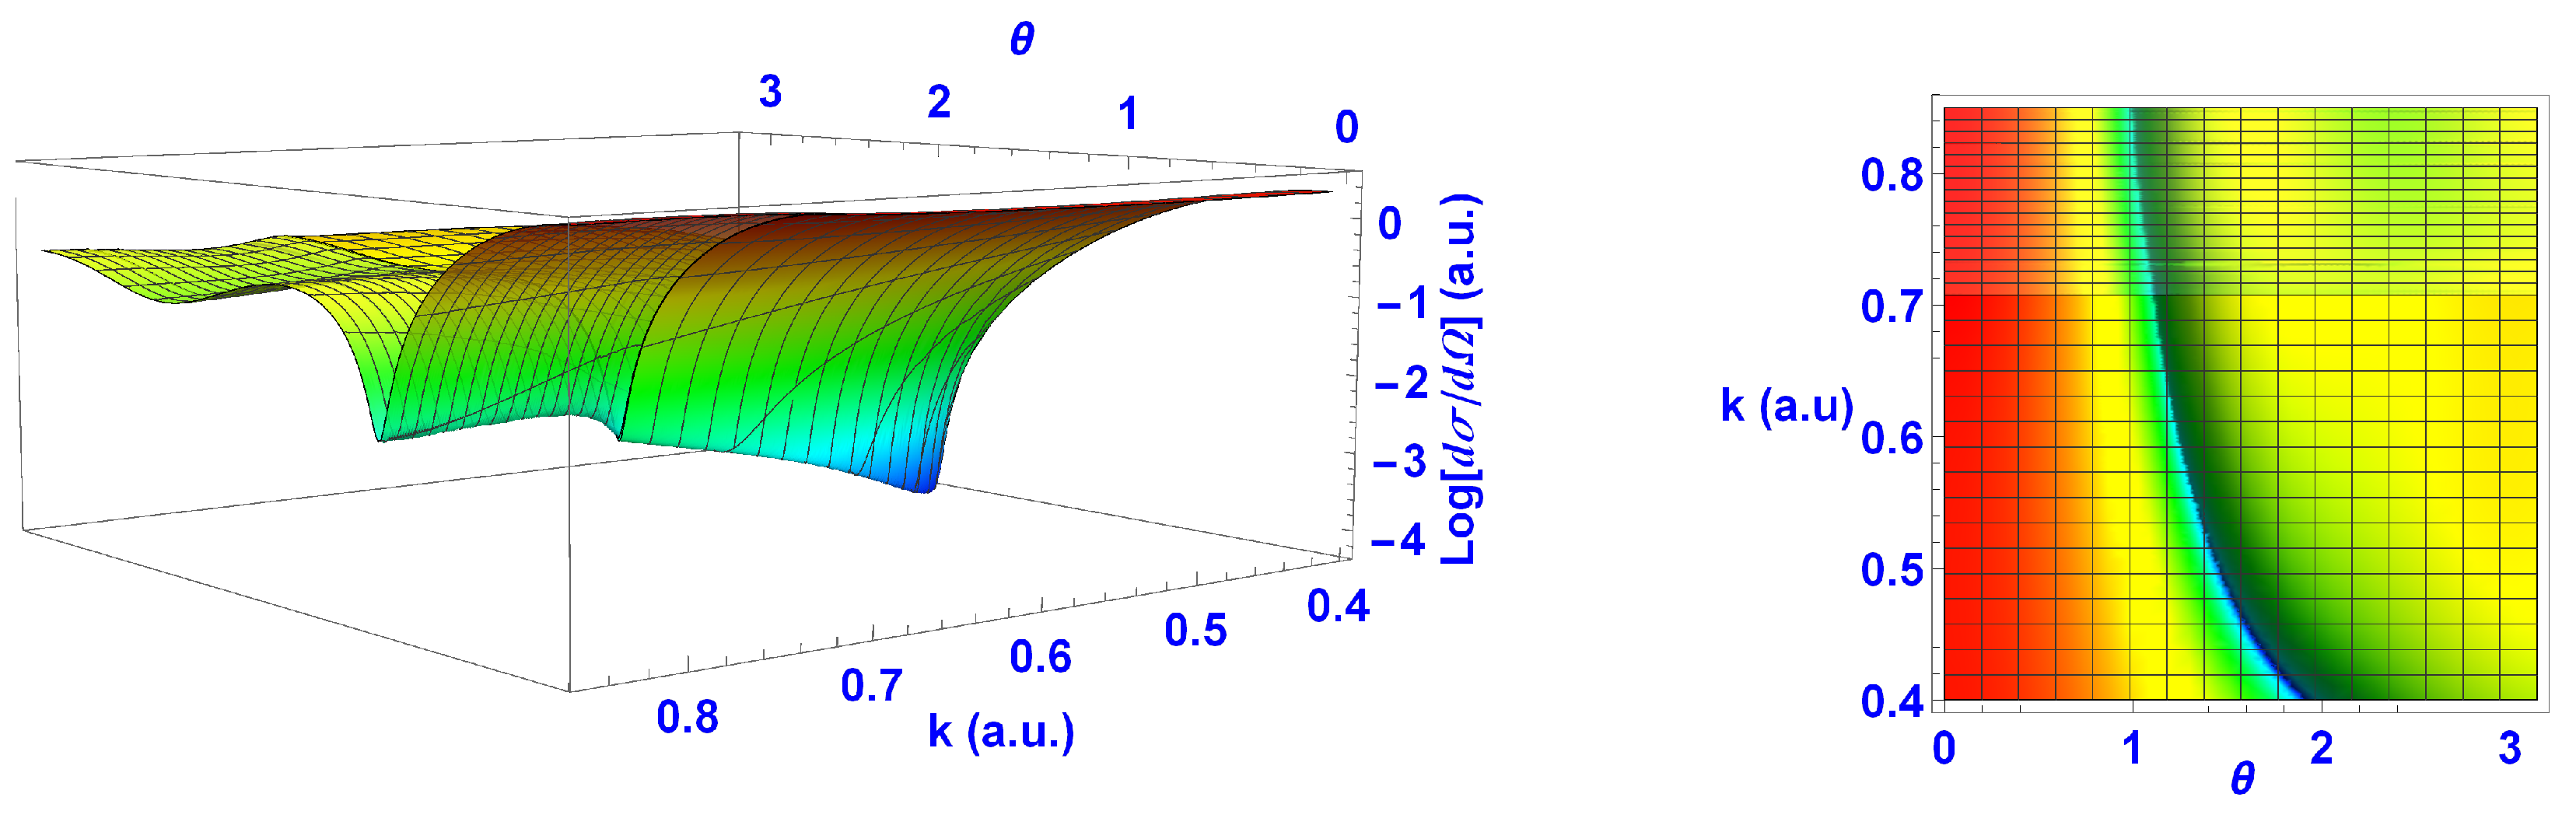
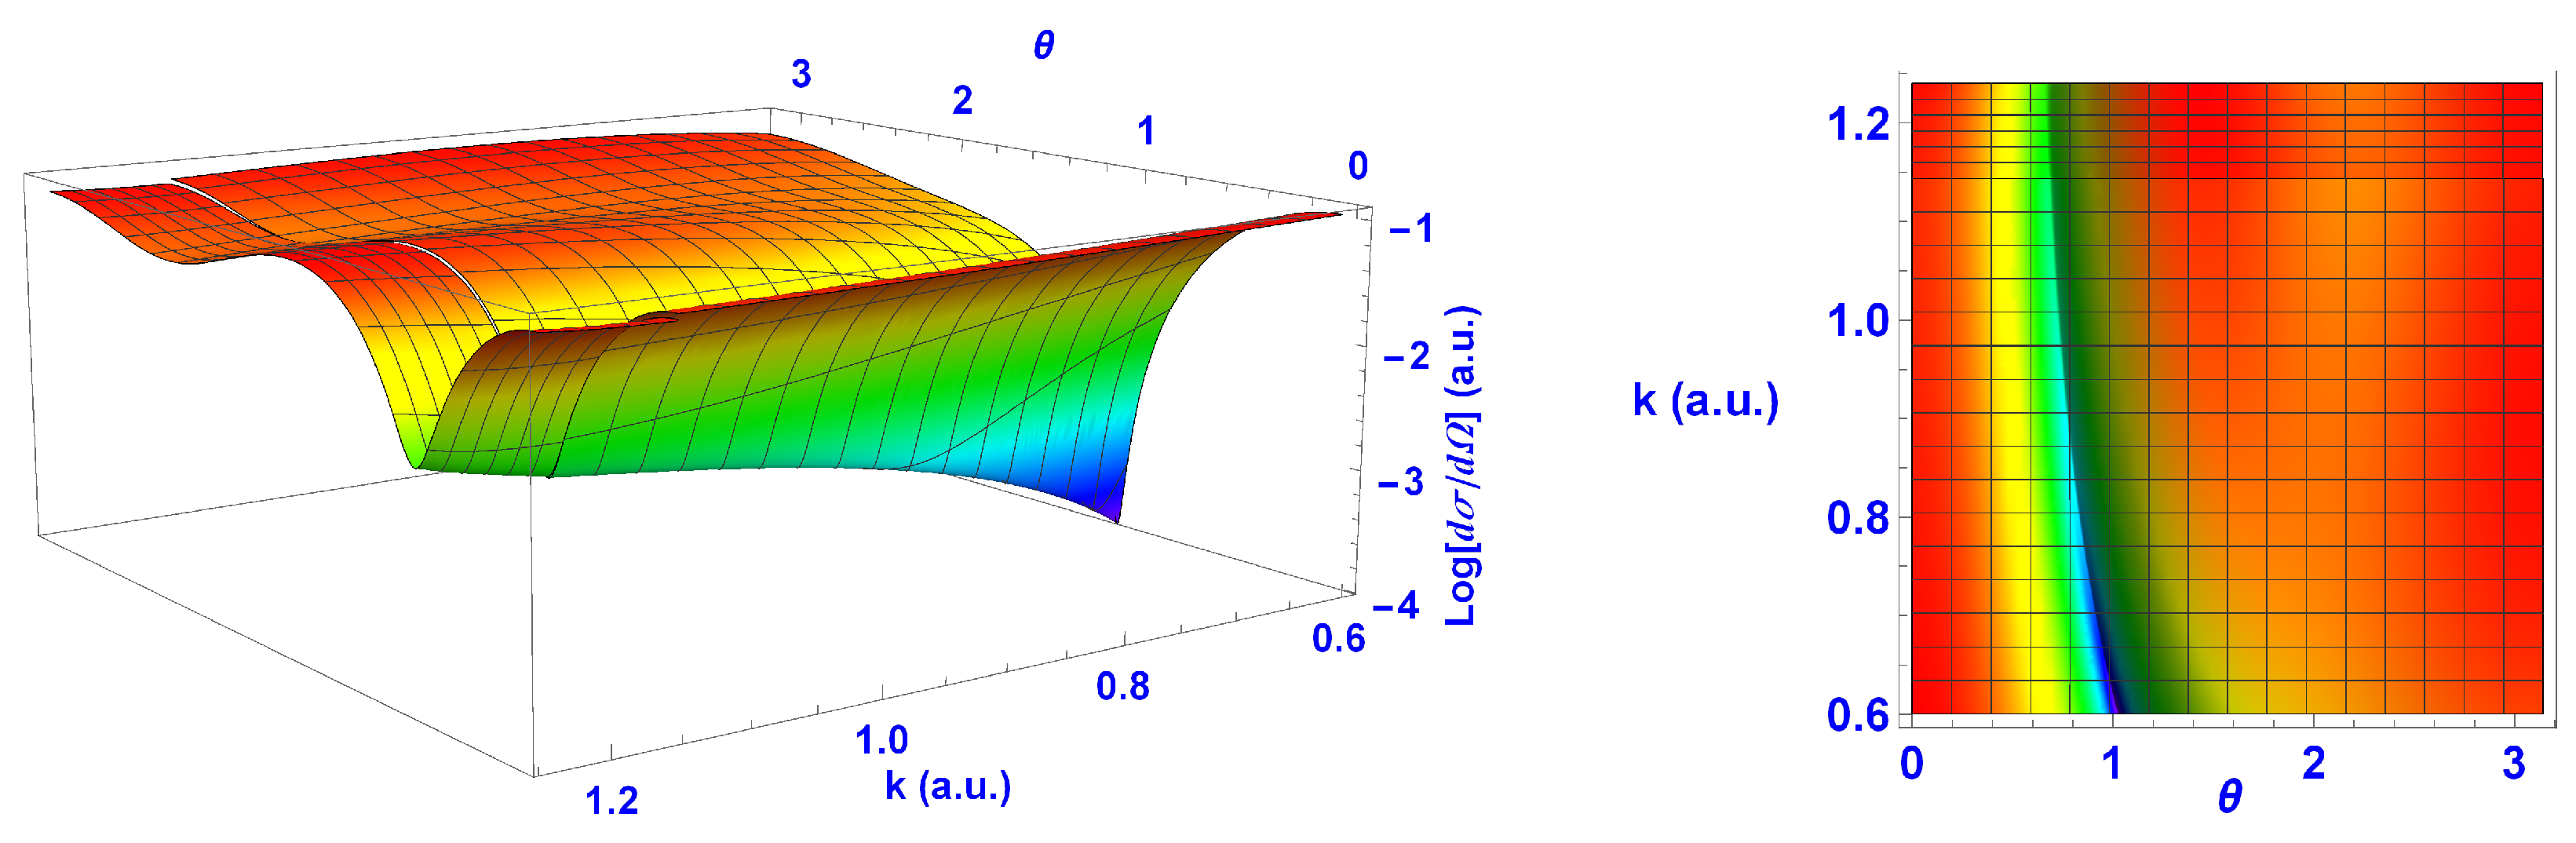
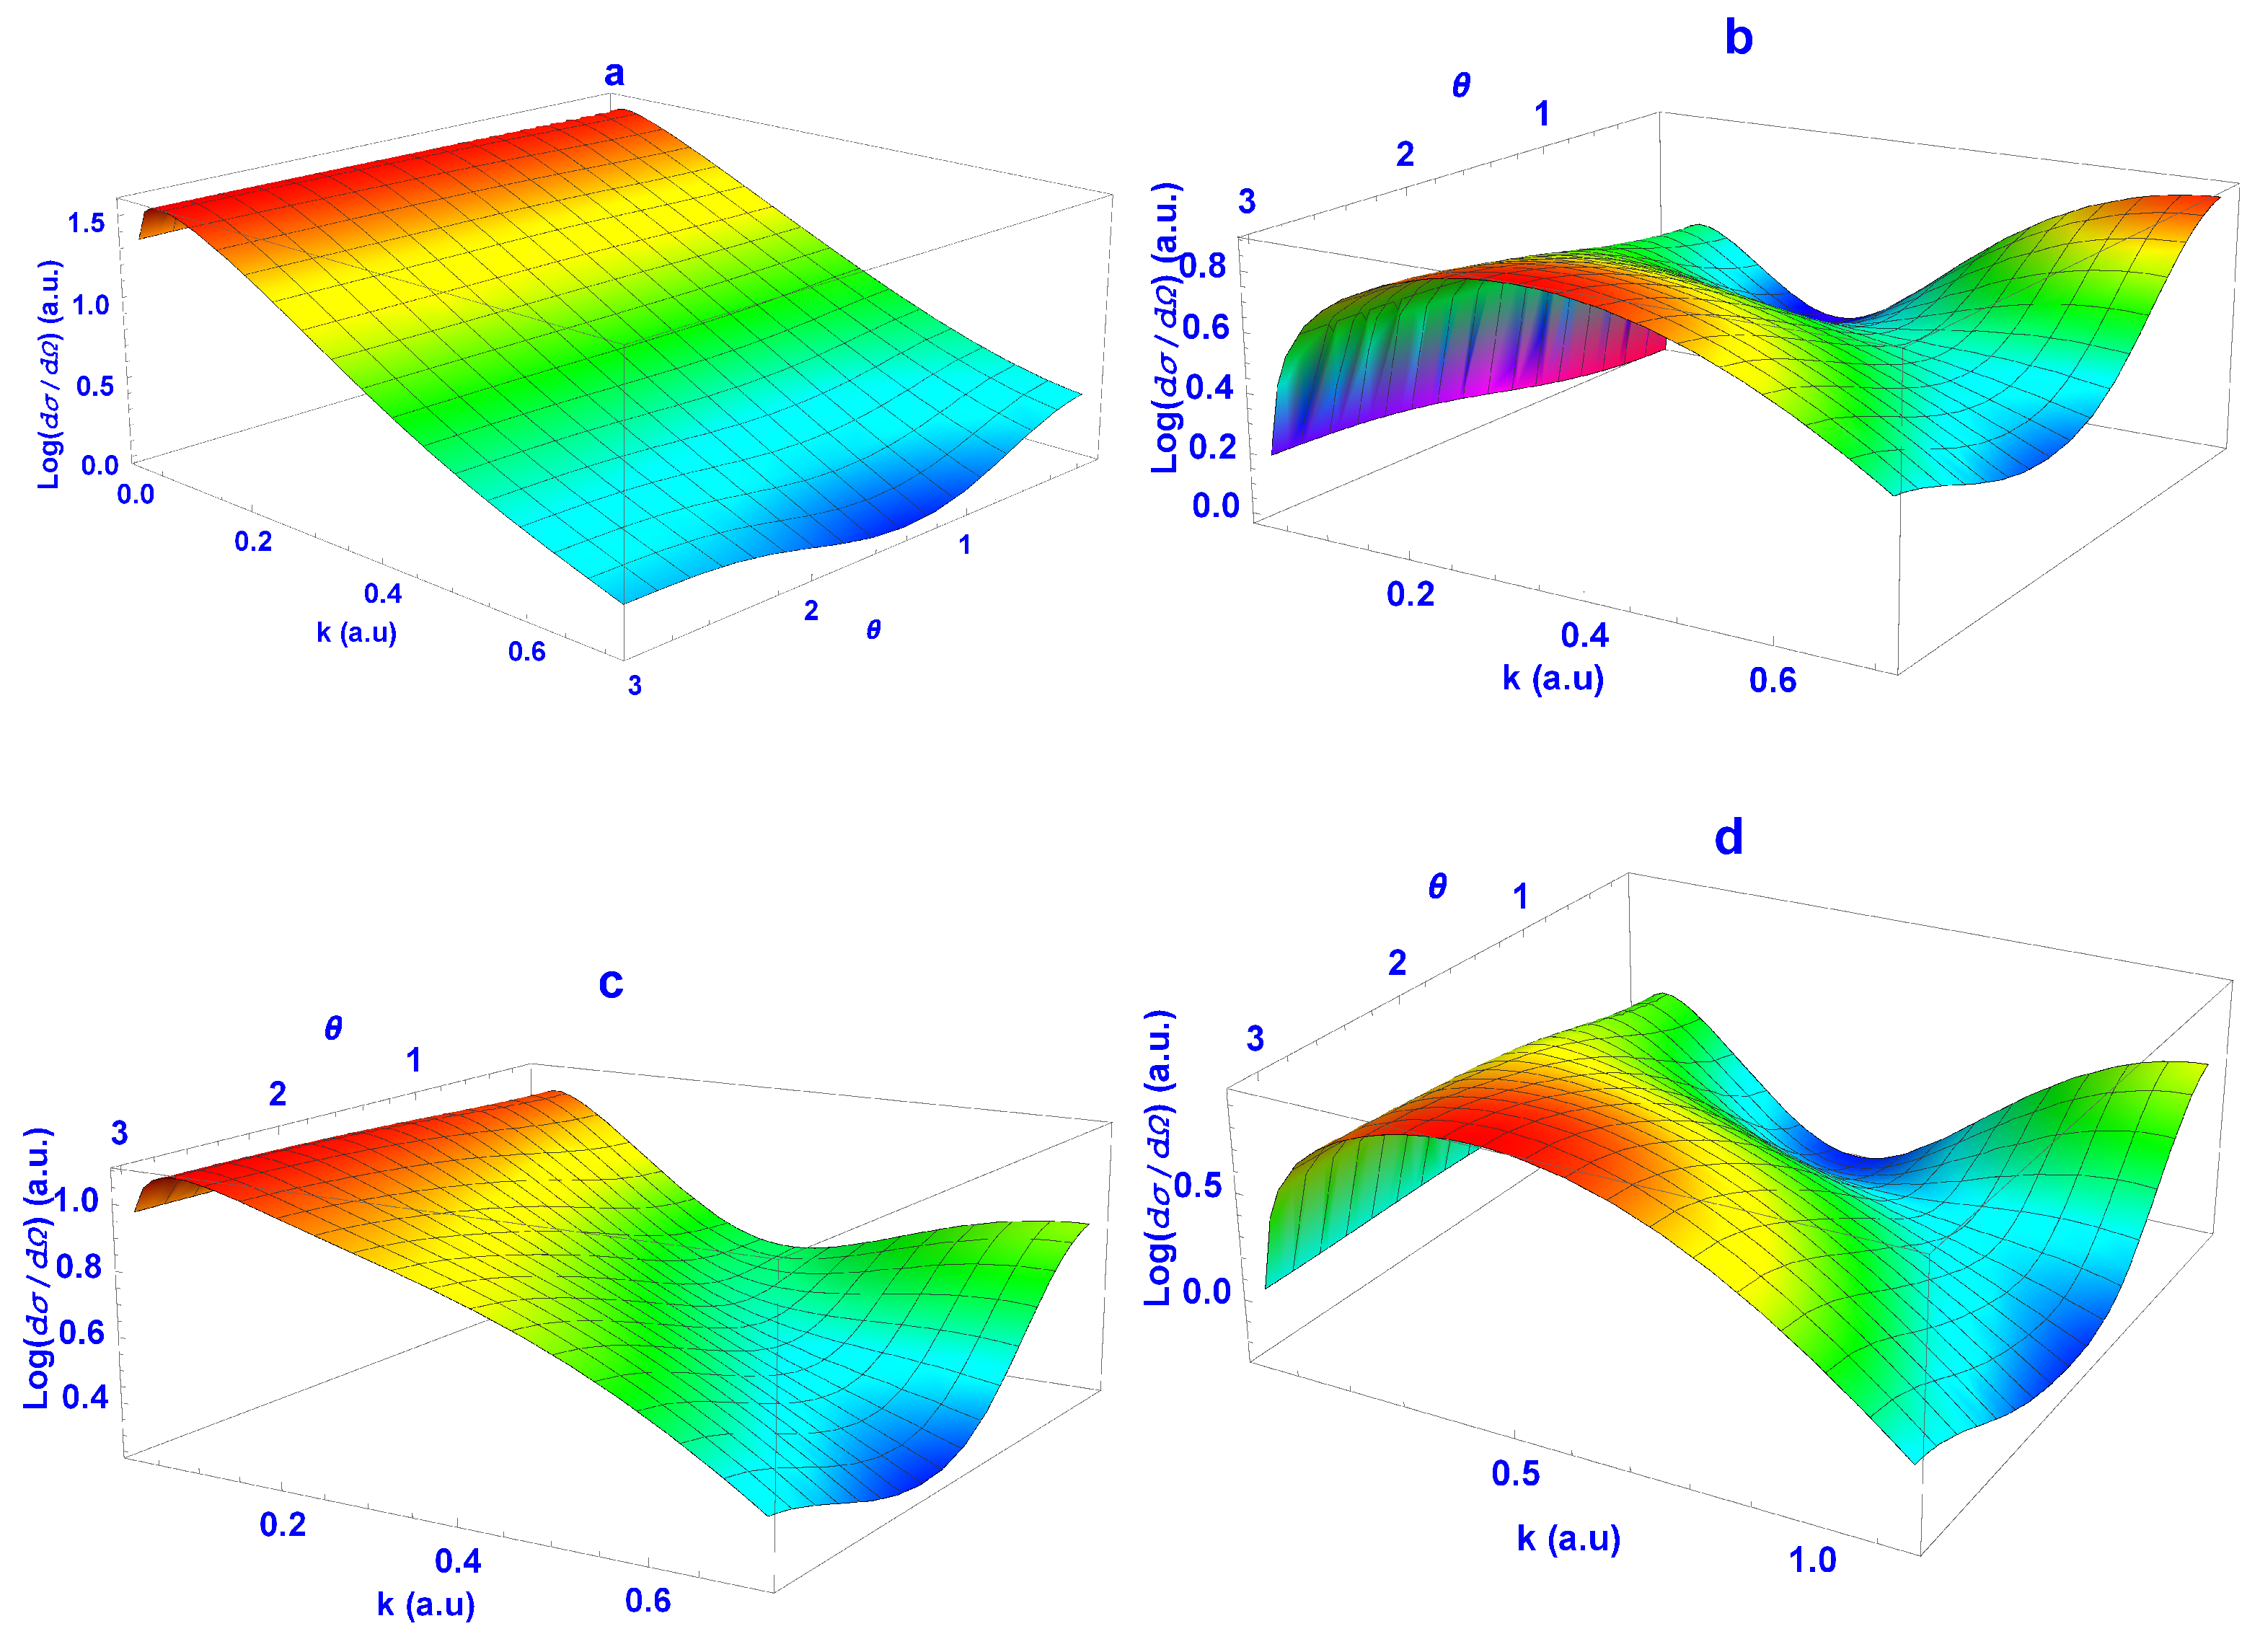
In
Figure 4 and
Figure 5, we present the 3D plots of the full EDCSs for both targets. In order to reveal the structure of interest, we took the logarithm of the EDCS, as the range of the magnitude was large. As can be seen, the minimum for He was more pronounced than for H, which corresponded to the imaginary and real scattering amplitude planes for He intersecting the zero plane close together (see
Figure 3). The plots on the right-hand side of
Figure 4 and
Figure 5 show that for both targets, we had similar valley-type structures, which started at
and
a.u. for H and
a.u. for He, and went smoothly through the minimum and reached the Ps formation threshold at an angle of
for H and
for He.
The
position of the minimum for each atom was well converged with respect to the number of partial waves, as can be seen in
Figure 6. We are therefore confident that the converged results to two significant figures for H were
and
and for He were
and
.
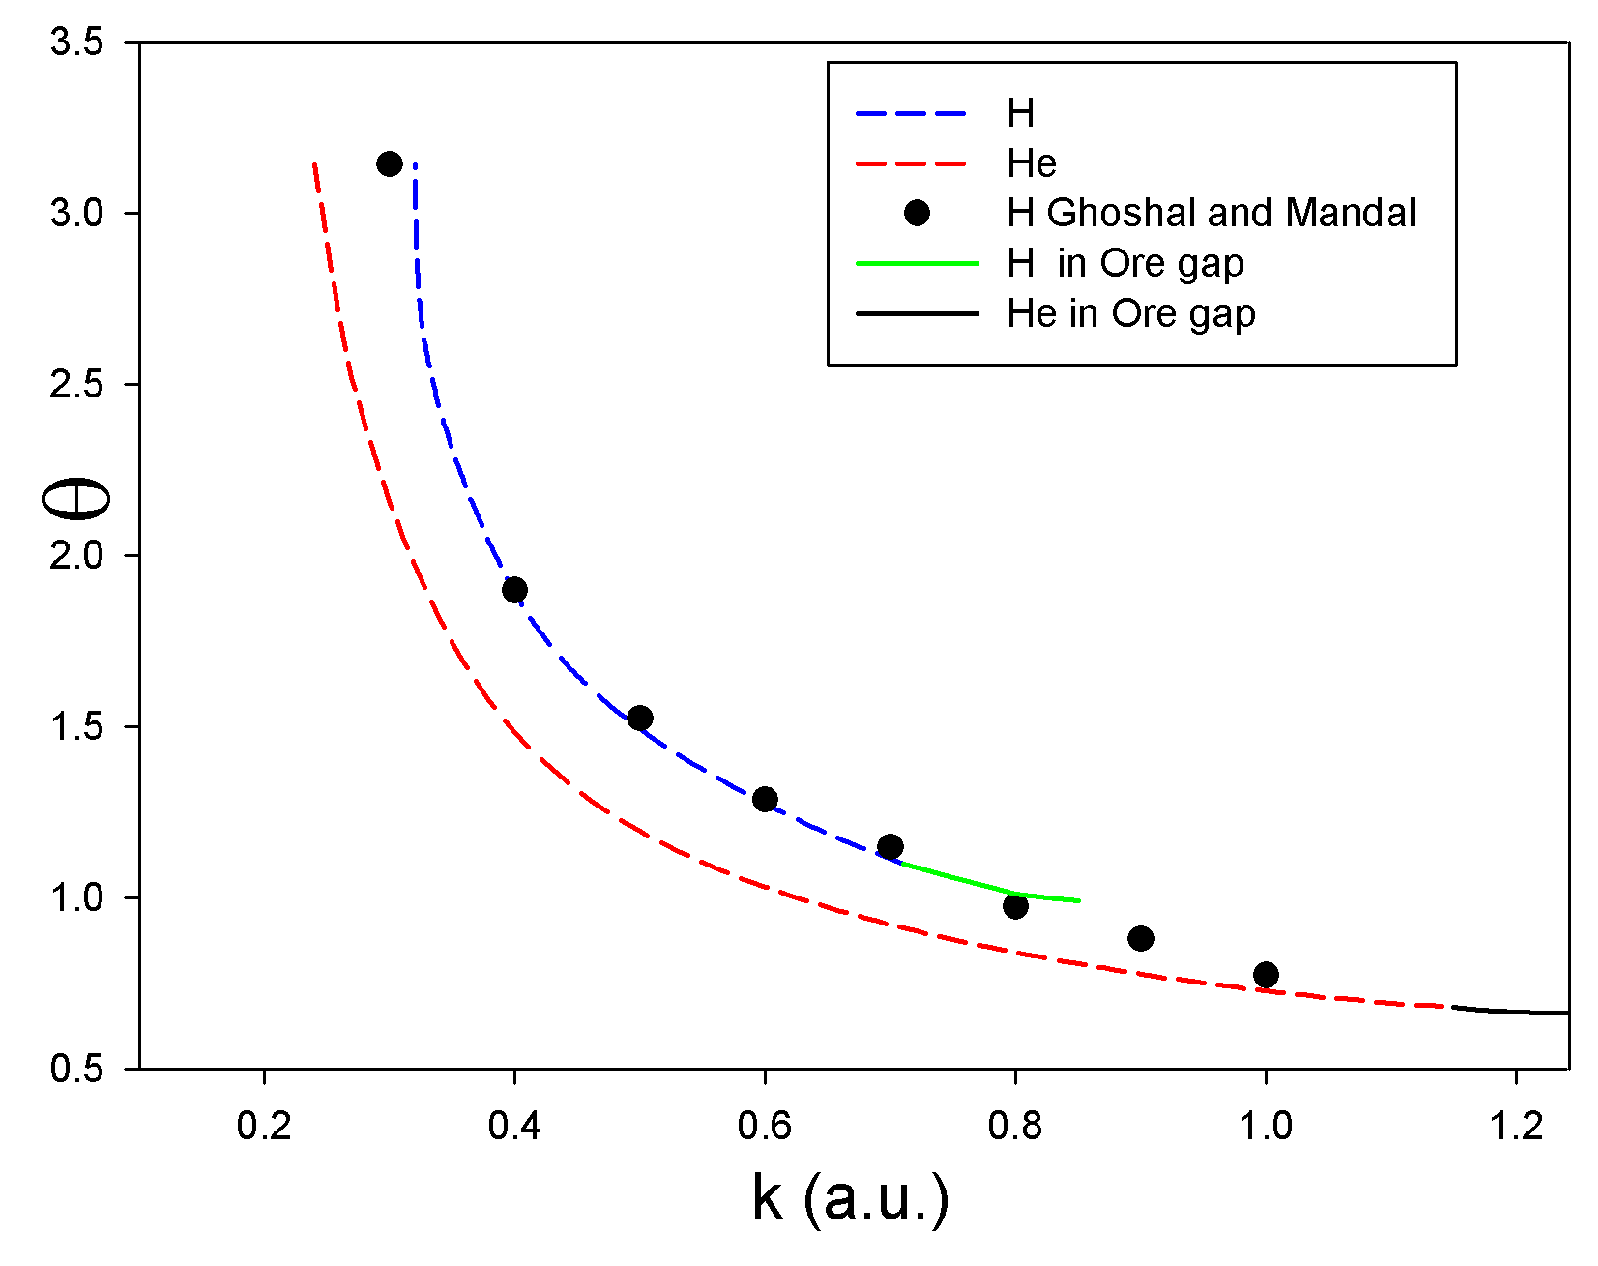
Ghoshal and Mandal [
13] studied low-energy positron–hydrogen scattering using the Schwinger variational principle and obtained good agreement with earlier results (see Table II in [
13]). In a subsequent paper [
14], these authors analysed the EDCS and obtained a deep minimum at an angle
and
a.u. close to the
-
k position we found for the minimum. Note that they evaluated their data in steps of
a.u. and also considered a larger range of
k values (0.1–3.5 a.u.). Their results also reveal an overall valley-type behaviour, which they labelled with a critical angle. The present
k dependence of the angle
in the valley region for H was extracted numerically and is presented in
Figure 7, together with the critical angle of Ghoshal and Mandal [
14], with which there is good agreement. A similar behaviour of the critical angle was also found by Rong-Mei et al. [
15]. At present, we have not found a simple expression for the
k dependence of
, which would have given us some insight as to a more physical understanding of its appearance in the EDCS.
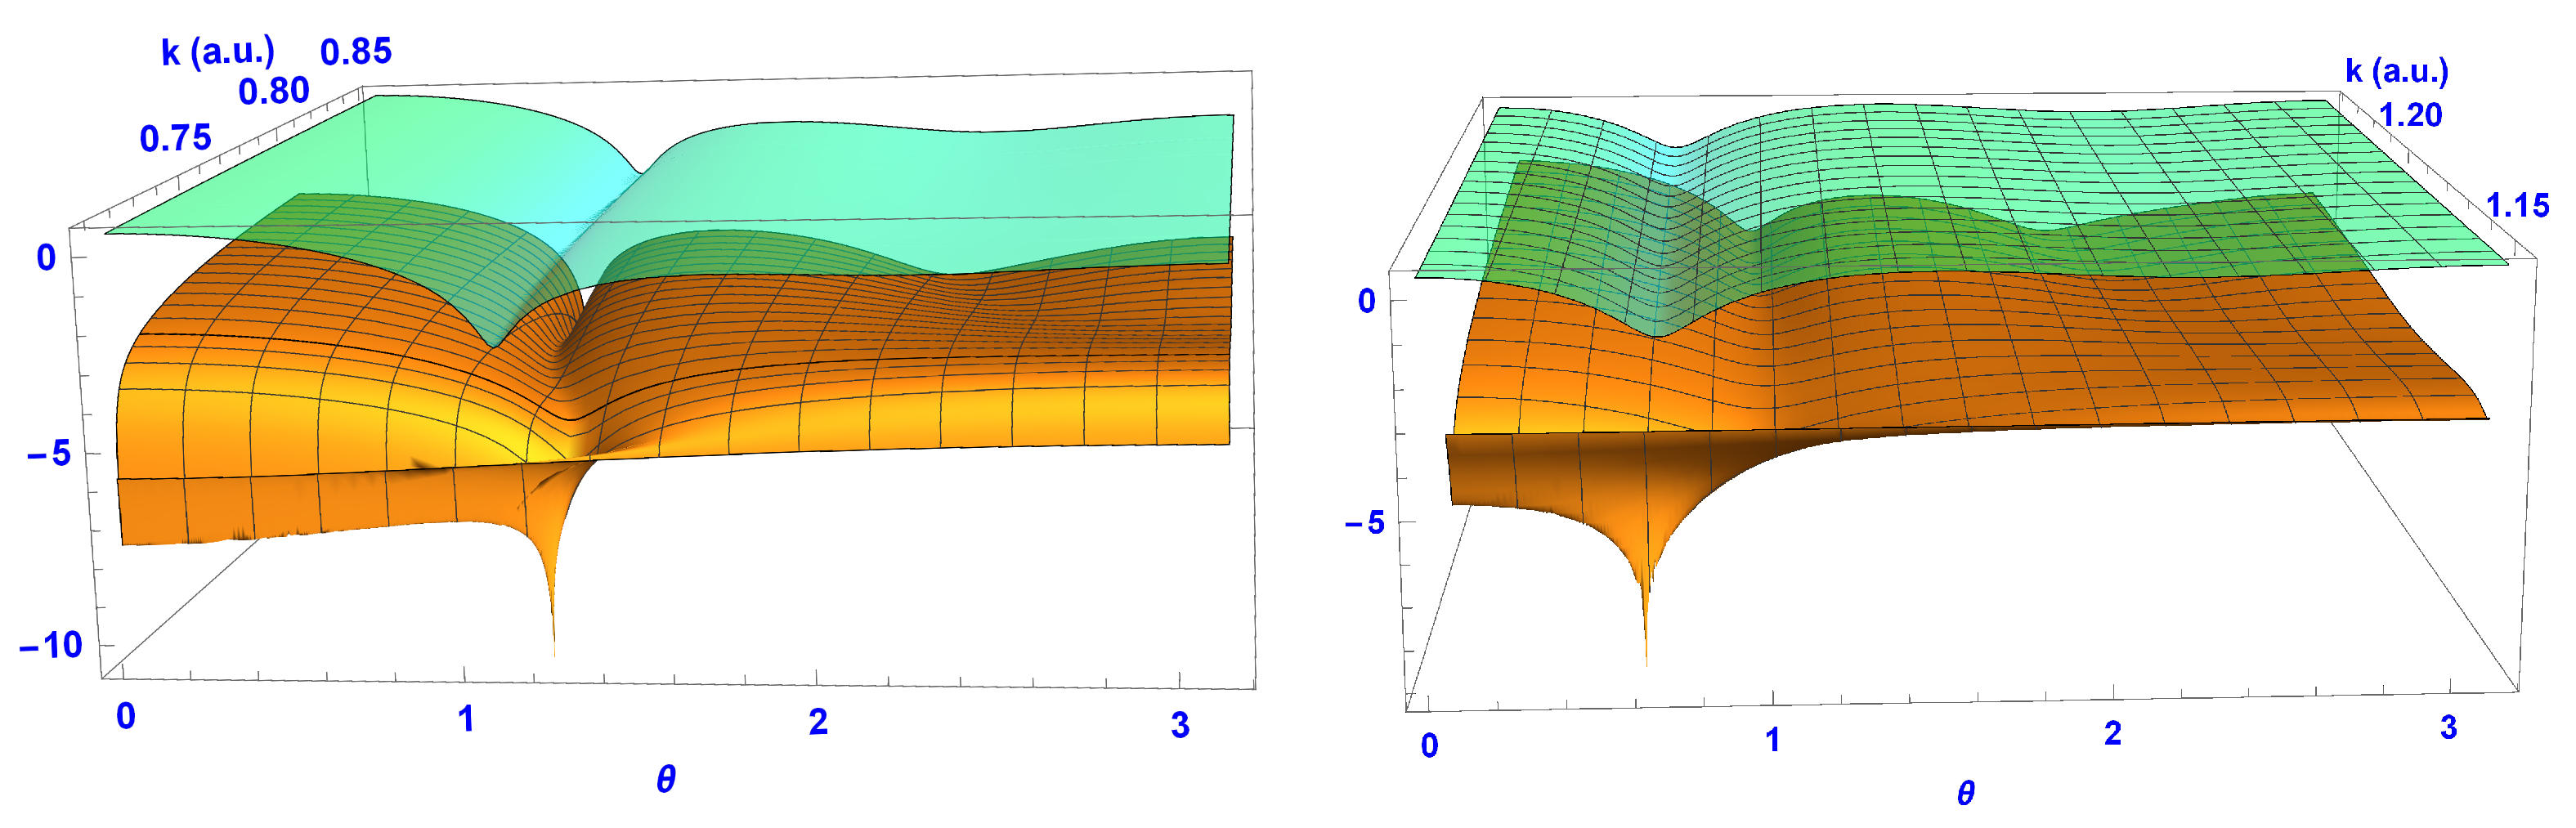
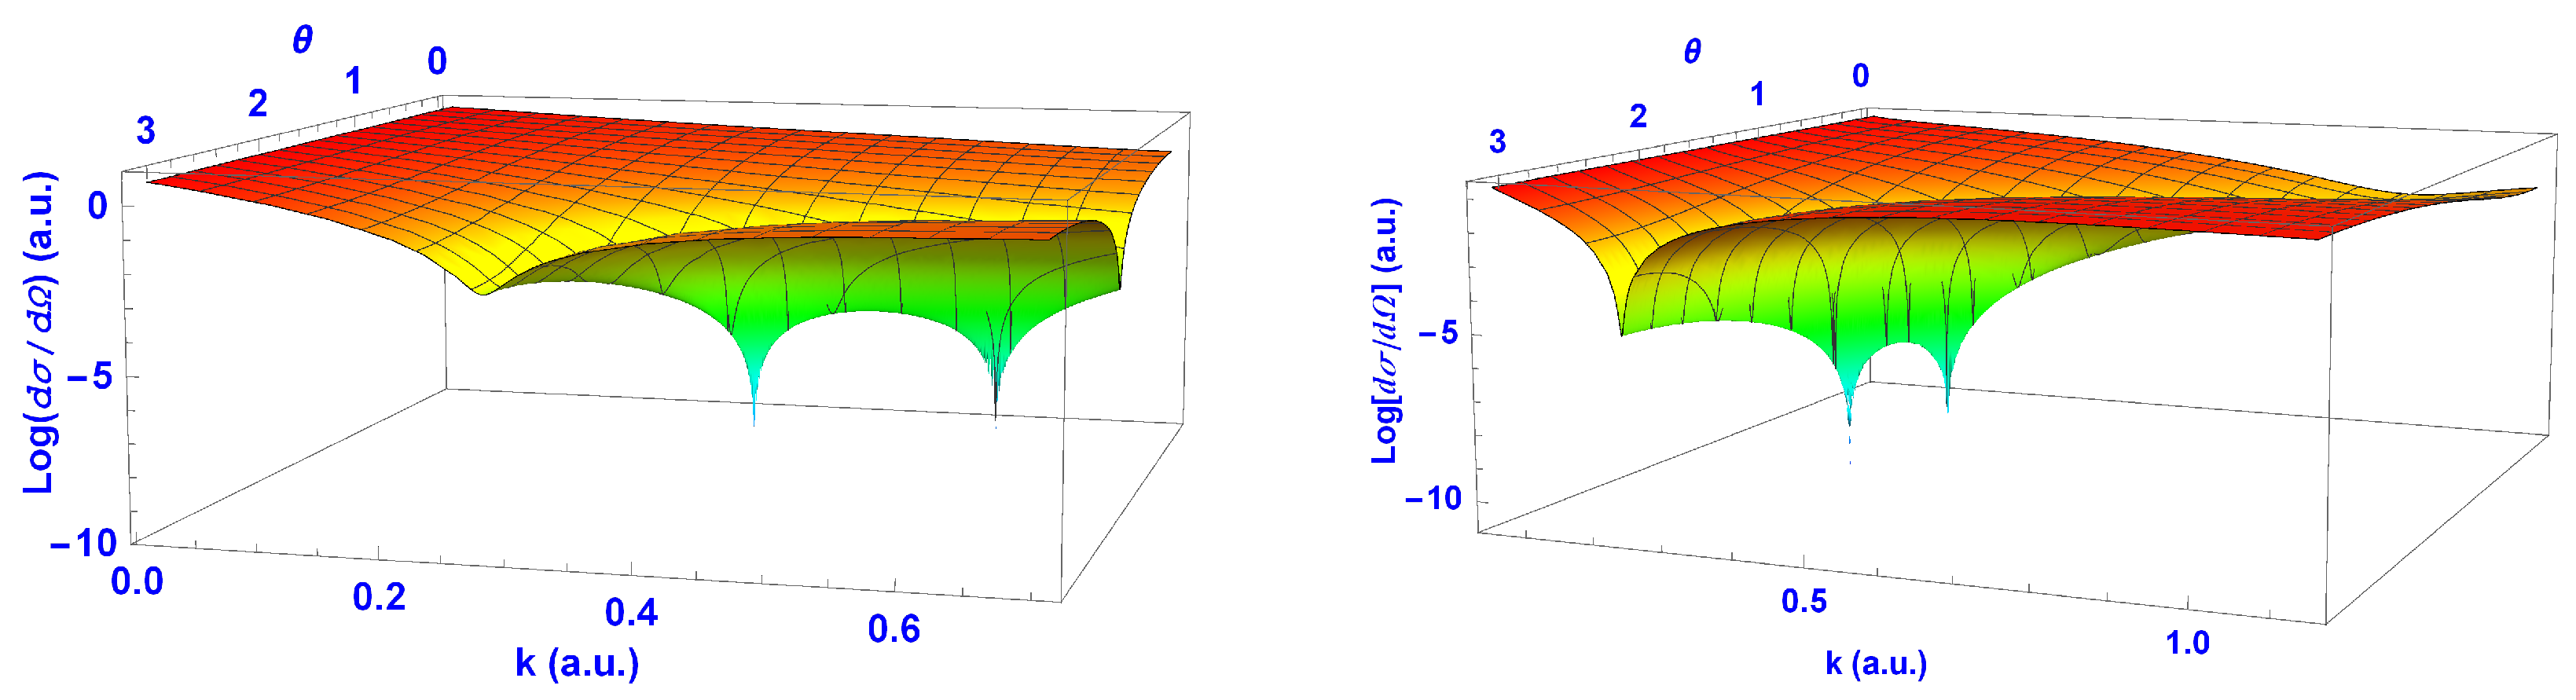
In
Figure 8 and
Figure 9, we show the EDCSs close to the threshold and within the Ore gap; these latter results were evaluated using the two-channel Kohn variational method with four partial waves included. We therefore compared these with the EDCS below the threshold evaluated with four partial waves instead of the six used earlier. We found that the valley-type structure went smoothly through the threshold in the case of e
+-He scattering, while for H, there was a significant increase just above the threshold. As we show in
Section 4 below, this difference between the two targets arose from the very small s-wave contribution in the Ore gap for H.
It is of interest to compare the EDCS with the Ps formation differential cross-section (PsDCS) in the Ore gap. For both of these atoms, detailed investigations of the PsDCS have revealed the presence of vortices and a valley-type structure [
1,
2]. Two vortices were found within the Ore gap in the case of H, with one very close to the threshold and another lying in a valley-type structure. As can be seen in
Figure 10, this structure started from the threshold, changed rapidly with the angle over a small
k range until it reached the first vortex and then went up at a fixed angle until the next threshold. It is remarkable that the valley in the EDCS followed very closely the
-independent part of the valley in the PsDCS. In the case of He (
Figure 10), there was only one vortex close to the threshold, but the overall valley structure was similar. However, the structure in the EDCS for this target seems be at a smaller angle than that in the PsDCS. The difference in the relative position of the EDCS with respect to the PsDCS was due to the different magnitudes of the s-wave contributions to the DCS, as discussed in
Section 4.
In order to complete the comparison discussed above, we also evaluated the EDCS for electron scattering. In the case of H, we evaluated the phase shifts over the same energy region using the Kohn variational method as was used for the positron scattering, i.e., a similar scattering wave function but with the explicit exchange between the projectile and the target electron. Therefore, there were two possible spin states that needed to be considered, i.e., the singlet and triplet states. As shown in
Figure 11a,b, there were totally different angular and energy dependences between the singlet and triplet results for the EDCS. In both cases, the s-wave phase shift was much larger than that for the higher partial waves. The dominance was very strong for the singlet scattering (
and
with at most
of
) such that there was no structure in the differential cross-section, except at the highest
k value. Note that the EDCSs shown in
Figure 11 are plotted on a logarithmic scale for consistency with the graphs of the positron scattering EDCSs, even though the range of magnitude was not as large as was the case for the positron EDCSs. In the triplet case, for which we had
and
with at most
and
of
, respectively, we found some structure at low
k values with a maximum now in the backscattering, a dip in the forward direction and a broad dip at the higher
k values. Combining these with the standard weightings, namely, 0.25 singlet + 0.75 triplet, gave the total elastic differential cross-section (
Figure 11c), which was similar to the triplet EDCS but smeared out. For He, we used the phase shifts available in the literature: for
, the confined variational calculation of Wan et al. [
16], and for
, McEachran and Stauffer [
17], who used the adiabatic exchange approximation. The overall angular and energy dependences in
Figure 11d are very similar to that of the triplet e
−-H EDCS, with a maximum in the backscattering and a minimum in the forward scattering at a similar energy, and a slight dip close to
/2 at the highest energy.
4. Discussion
Given Equations (
5) and (6), it is possible to write out a general analytical expression for the EDCS for e
+ scattering below the Ps formation threshold for a given number of partial waves; however, this will rapidly become rather complicated and not useful. However, noting that the phase shifts for all values of
l were between −0.2 and 0.2, we could use the small-angle approximation in Equations (
5) and (6), as the errors in the sine and cosine terms in Equation (
10) were at most
, to obtain
where
N is the maximum number of partial waves included. Furthermore, given the small magnitude of the phase shifts,
, and we could approximate further to obtain
If we restrict ourselves to the first three partial waves, we have
and when only the first two partial waves are included, we have
Hence, we found that the EDCS with
=1 was zero when
was zero and
and when
and
. These exact zeros gave rise to zeros in the EDCS, as shown in
Figure 12. Note, although these arise from exact zeros in the scattering amplitudes, they are not physical. Only the minima presented in
Figure 4 and
Figure 5 are potentially observable. It is interesting to note that the minimum in the backscattering,
, was already present with just two partial waves, although less pronounced in the case of H.
As can be seen from
Figure 6, the angular position of the minimum for both targets converged to a value close to
. Hence, setting
, i.e.,
= 1,
= 0 and
= −1/2, in Equation (
12), we obtained
Therefore, we found that the EDCS evaluated with only the first three partial waves were very small when
. Note that because we were at
, we had no contribution from the non-zero
phase shift in this case.
In order to analyse the behaviour of the backscattering in the EDCS, we set
, i.e.,
and
in Equation (
12):
The triples
that make this expression zero or approximately zero satisfy
and are different for the different targets. We found numerically that at
, the minimum for H was at
with
and for He, it was at
with
, and note that the ratios
were different for the two targets.
As discussed above and shown in
Figure 8,
Figure 9 and
Figure 10, there was a significant difference in the behaviour of the EDCS just above the Ps formation threshold in H and He. This difference can be explained by the difference in the s-wave contribution in this energy region to the EDCSs for both targets. When considering the
k dependence of the s-wave phase shift, shown in
Figure 2, we found that the overall shape was similar, but that
was zero at a
k value much closer to the Ps formation threshold in the case of H. This means that for these two atoms, the absolute values of
at the threshold were very different, with
0.054 for H and ≈ 0.234 for He, and their relative values with respect to the other partial waves were also very different. In the case of H, at the threshold,
was smaller than
by a factor of ≈3 and
by a factor of nearly 2. On the other hand, for He,
was clearly the dominant contribution, even when considering the factor
, which appeared in the evaluation of the scattering amplitude (Equation (
2)). In order to investigate the effect of a very small s-wave contribution, we evaluated the EDCS for e
+-He in the Ore gap by reducing the
contribution to the EDCS to effectively zero. We found a slight increase in the EDCS just above the threshold similar to that in H (
Figure 8) and, furthermore, the valley followed more closely that of the PsDCS as was the case for hydrogen in
Figure 10. This indicates that one of the main differences between the two targets in the Ps formation threshold region was that the isotropic behaviour of the scattering process was more important for He than H.
Although there were obvious differences in the EDCSs for the positron and electron scattering on hydrogen and helium (
Figure 4,
Figure 5 and
Figure 11), there were some resemblances that may be of interest. The main differences were that there was no deep minimum at
for electron scattering, which was expected as the s-wave phase shift for this projectile was never zero and that in the backwards scattering, we had a maximum for electron scattering, while we had a minimum for positron scattering. In the forward direction, there was a minimum for electron scattering, approximately at the energy at which the maximum in the backwards scattering occurred, while there was no structure in the positron case. A similarity was that at the next threshold, there was a minimum in all cases, at
for both targets for electron impact, and for positron impact, at
for H and at
for He.
