Abstract
Heavy Ion Beam Probing (HIBP) diagnostic is a powerful tool for electric field studies in the hot dense plasma of modern-day toroidal magnetic confinement devices. On the TUMAN-3M tokamak, the HIBP have been used in regimes with improved plasma confinement to clear up the role of the radial electric field in the transition to good confinement regimes. Recently, a modernization of the TUMAN-3M HIBP diagnostics was performed, aiming to reconfigure it for a work with a reversed plasma current direction and improvement of the overall stability of the diagnostic. The results of the first measurements of the plasma potential in the co-NBI scenario are reported and discussed.
1. Introduction
Diagnostics of hot dense plasma in magnetic confinement fusion devices using the HIBP [1] provides important information about the dynamics of the electric potential, electric field, plasma density and poloidal magnetic field, as well as their fluctuations, in a wide range of spatial localizations, from the periphery to the central region, and discharge scenarios [2,3]. In many cases, this information is unique, since HIBP is the only technique that allows direct measurements of the potential and electric field in the hot plasma region. This diagnostic is not routinely used on toroidal magnetic confinement devices due to a substantial technical complexity of its realization. A rare example of very interesting results and Alfven waves (AW) and GAM physics obtained using HIBP is experiments on the TJ-II stellarator and T-10 tokamak performed by Melnikov et al. [4]. Observations using the HIBP of a specific type of electric field pulsation were reported from CHS stellarator [5]. On LHD stellarator, the HIBP was used successfully for the investigation of the geodesic acoustic mode (GAM) induced by the energetic particles [6,7]. A detailed study of interplay between the GAM and the turbulence was performed on JFT-2M tokamak [8]. An overview of HIBP diagnostics and results obtained on reversed field pinch MST, with emphasis on poloidal flux and potential fluctuations studies, may be found in [9]. Applications of HIBP for plasma current and poloidal field profile measurements are being developed on ISTTOK tokamak [10]. In addition, many important issues of the diagnostic are addressed in conceptual design projects of the HIBP for T-15MD tokamak [11] and QUEST spherical tokamak [12].
The TUMAN-3M tokamak (circular cross-section with R = 0.53 m and a = 0.22 m, plasma current Ipl ≤ 0.18 MA, toroidal magnetic field BT ≤ 1 T, and chord-average electron density ≤ 6 × 10¹⁹ m−3) [13] has been operating for many years with the HIBP diagnostic, which was used to study the dynamics of the radial electric field in different operating modes of the tokamak. With the help of this diagnostic, the role of the radial electric field in switching the modes of high and low confinement (so-called L-H and H-L transitions) [14] was revealed in ohmically heated plasma, oscillations of the geodesic acoustic mode (GAM) [15] were found, and the dynamics of the electric field during the L-H transition were studied in a scenario when this transition was initiated by the NBI in the opposite direction to the plasma current, so-called counter-NBI [16]. Recently, the TUMAN-3M tokamak has been operating mainly in the mode of injection of the heating beam in co-direction with the plasma current (co-NBI setup), since, in such a configuration, the confinement of fast ions and, hence, the efficiency of plasma heating are noticeably higher. On the other hand, in this mode, the generation of a radial electric field occurs under the action of at least two mechanisms that cause a perturbation of the radial field Er of different signs: negative Er is generated due to the loss of fast ions, whereas positive Er arises due to the transfer of angular momentum to the plasma from the confined fast ions. These mechanisms act in different parts of the plasma cross-section, and their relative efficiency depends on the parameters of the plasma (electron density and temperature) and the heating beam (energy, current, injection geometry). The use of HIBP can provide important information on the generation mechanisms and dynamics of the radial electric field in this regime.
The principles of HIBP are based on the injection into the plasma of a beam of accelerated ions with high energy and large mass; this provides a sufficiently large Larmor radius of the injected ions in comparison with the plasma dimensions: rL = (2 mW)0.5/qB > a, where m, W, q are the mass, energy, and ion charge, B and a are the toroidal magnetic field and the minor radius of the plasma. For the parameters of the TUMAN-3M tokamak (B < 1 T, a = 25 cm), potassium, sodium and, in some cases, cesium ions with energies up to 100 keV are used. As a result of collisions with plasma electrons, ions with the double charge (secondary ions) are formed, the trajectories of which are separated from the trajectories of primary ions at the ionization point, since they have a different (factor of two smaller) radius of curvature in the magnetic field. The detector located outside the plasma receives secondary ions formed in some region localized in space along the trajectory of primary particles. From the characteristics of the secondary ion beam (energy, beam intensity), one can determine the plasma potential and density locally at the secondary ionization point, thus obtaining information about the evolution of the radial electric field and local density. The displacement of the secondary beam in the toroidal direction can be related to the magnitude and distribution of the poloidal magnetic field.
The next section briefly describes the composition of the HIBP diagnostic complex at the TUMAN-3M tokamak and presents an algorithm for modeling the trajectories of primary and secondary ions. Further, the upgrade of the diagnostic complex HIBP is considered, aimed at improving the reliability of the diagnostics, increasing the collected information and reproducibility of measurements. To this end, implemented:
- Autonomous isolated power supply system for thermionic source heating
- Control system for angle of entry and position of primary beam
- Primary beam profile control system
- Two-point detection system for secondary beam.
The last section presents the first results of plasma potential evolution study in the co-NBI caused L-H transition.
2. Heavy Ion Beam Probing Diagnostic at the TUMAN-3M Tokamak
The layout of the HIBP diagnostic on the TUMAN-3M tokamak is shown in Figure 1. Diagnostic complex consists of the following main parts: linear accelerator of primary ions (2), primary beam ion duct (17) with two sets of steering plates that change the direction of beam propagation in the poloidal and toroidal directions (two pairs of plates in each direction), secondary ion duct with plates deflecting the secondary beam in the toroidal direction (18), and a secondary ion energy analyzer (3). LT-100 and LT-30 blocks from Glassman (currently XPPOWER, www.xppower.com, accessed on 12 December 2022) were used as high-voltage sources for powering the accelerator and analyzer. The accelerator and the analyzer have a common grounding point, galvanically connected to the ground of the mains, while the tokamak vacuum vessel is isolated and during the plasma discharge is under a “floating” potential, reaching values of 500–1000 V due to the capacitive coupling between the chamber and the toroidal field coils. However, a voltage that high is observed only during the toroidal field ramp at the initial stage of the TUMAN-3M shot. In the time widow of HIBP measurements, the toroidal field coils (hence toroidal field itself) is kept constant within the 10% accuracy, so influence of capacitive coupling onto the HIBP signals is rather small. This subject is discussed in more detail in Section 6.
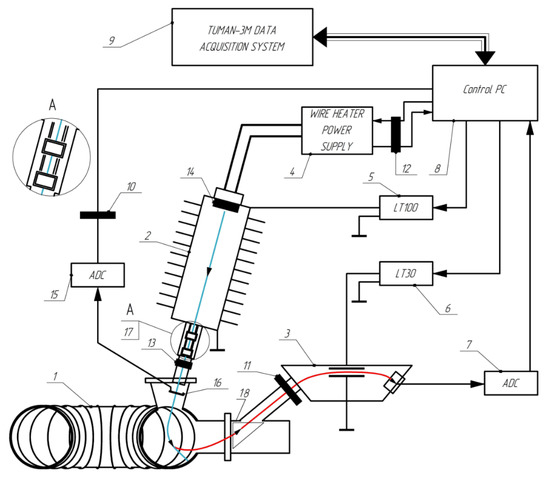
Figure 1.
Layout of HIBP diagnostics at the TUMAN-3M tokamak. 1—TUMAN-3M tokamak, 2—Primary beam accelerator, 3—Secondary ion energy analyzer, 4—Autonomous isolated power supply for thermionic source, 5—Accelerator high voltage power supply, 6—Secondary ion energy analyzer high voltage power supply, 7—DAC of secondary ion energy analyzer, 8—Main control PC of HIBP, 9—Data acquisition system of TUMAN-3M tokamak, 10–13–Galvanic isolation modules, 14—Thermionic source of primary ions, 15—DAC of primary beam wire array detector, 16—Primary beam wire array detector, 17—Primary beam steering plates box, 18—Secondary beam steering plates box.
The plasma potential Φpl at the ionization point of the primary beam is related to the energy of the primary W1 and secondary W2 beams by the following simple relationship:
where Δq is the change in the charge state of the ion during ionization. Usually Δq = −e, (here e is the electron charge), because the probability of double and even more triple ionization is small. The measurement of the potential by this technique is based only on the energy conservation law and the potentiality of the electrostatic field and, and as such is direct, because does not require additional assumptions and models of plasma behavior. At the same time, the determination of the spatial localization of the plasma region in which the measurement is made using the HIBP, is possible only by calculating the trajectories of primary and secondary ions by solving the equations of motion.
To solve the equation of motion, one has to know the magnetic field components in all the points of the beam trajectory, which itself is yet unknown and is to be found. However, the projection of the trajectories on the poloidal plane is mostly determined by the toroidal field component, and only weakly depends on the poloidal field. We use vacuum toroidal field calculated using Biot–Savart law and measured currents in toroidal field coils as a first approximation; more accurate mapping of the trajectories into the magnetic surface structure being made using equilibrium found with the help of ASTRA code or a dedicated program written by Sergei Tsaun [17].
On the other hand, poloidal field structure influences the toroidal component of secondary beam velocity and displacement at the exit point. The former is connected with the vector potential profile A(r) through a Volterra-type integral equation of the second kind, or with poloidal field distribution Bp(r) through a Volterra-type integral equation of the first kind, the latter is known to have unstable solution and requires regularization [18]. Depending on the data set size and dimensions of secondary beam parameters measured in the experiment, there are different problem-solving approaches but none of them is simple and straightforward, and rarely followed in practice. Examples of theoretical calculation of plasma current profile effect on the toroidal displacement of the secondary beam in the TUMAN-3 may be found in [19]. An alternative approach was proposed on ISTTOK tokamak in 1994, see the review paper [10] and references herein, where the multicell detector was used for a simultaneous detection of secondary beam at multiple neighboring toroidal locations, which allows the cancelation of the poloidal magnetic field integral path effects between the two neighboring points in plasma, thus retrieving information on the local poloidal field in the sample volume. Poloidal field structure was also studied on reversed field pinch MST using canonical momentum conservation principle [9]. Earlier, we reported the qualitative observation of the effect of poloidal field perturbation caused by the L-H transition on the toroidal displacement of secondary beam [14]. In our present study we do not claim to measure the poloidal field structure quantitatively, though. We estimate toroidal displacement of secondary beam just to initially adjust the diagnostic for registration of the secondary beam, and then optimize the setting in shot-to-shot procedure to have the better possible signals.
In contrast to plasma potential measurement with the HIBP, measurement of plasma electron density is not local. Attenuations of the primary and secondary beams along the trajectories are itself functions of electron density profile, thus influencing the secondary ion current at the detector:
here I0, IS—primary and secondary beam current, ne—electron density, <σi1→2ve>—averaged over electron distribution function the cross-section of ionization of primary beam ions into double-charged state, and —effective cross-sections of the processes responsible for the attenuation of the primary and secondary beams, ve—average electron velocity, vo—primary ion velocity, LSV—the length of the arc along the detector line from which the secondary ions reach the detector at the given energy [20]. It is assumed that attenuation of the beams is mainly due to the ionization by plasma electrons. If attenuation of the beams is important (i.e., if plasma is hot and dense enough, and trajectories are long), the secondary beam current on the detector depends on the density profile over all plasma cross-section, thus making the problem of density measurement with HIBP essentially non-local. With some simplifying assumptions about density profile, and with possibility to perform a spatial scan of sample volume location through the plasma, this problem is treatable [21]. However, for typical plasma parameters of the experiments on the TUMAN-3M (Te ~ 500 eV, ne ~ 2 × 10¹⁹ m−3, a = 0.25 m), using tabulated cross-sections for K+ and K2+ ions [22], an estimation for the two exponential factors in (2) gives 0.994 and 0.996, that is close enough to 1. This means that in our experiment attenuation is negligible and plasma density measurements are essentially local. Considering the ionization of primary ions by the electron impact to be the main process responsible for the beam attenuation and for the generation of the secondary beam fan, one can estimate the secondary beam current at the detector as
where α1 and α2 is the attenuation coefficients of primary and secondary beams, L1 ~ L2 ~ a = 25 cm are beam paths, exp(−α1L1) = 0.996, exp(−α2L2) = 0.994, LSV ~ 1 cm. This yields the estimation of the secondary current on the detector I2~12 nA, in a reasonable agreement with experimentally observed secondary beam currents of 10–15 nA.
At a fixed position of the primary ion accelerator and the secondary ion energy analyzer, the location of the detection point in the poloidal plane is uniquely determined by the poloidal entry angle αx and the energy of the primary ion W1 of the given species. An example of detector grids formed by lines of equal entry angle and equal energy is shown in Figure 2. Using detector grids calculated for different ions species, energies, magnetic configurations, etc., it is possible to adjust the HIBP layout for measurement in the required plasma region [14]. Generally speaking, since the Larmor radius depends on the energy W1 and the ion mass m and the magnetic field strength B as ∝ (2 mW1)0.5/B, the shape of the detector grids is determined precisely by this combination of parameters, which, in principle, allows instead of relatively light ions (Na+, K+) to use heavier ones (Cs+), reducing their energy accordingly. However, from a technical point of view, such a replacement is not quite equivalent, since at lower accelerating voltages, the focusing properties of the ion optic system deteriorate and the beam current decreases. On the other hand, when using light ions for access to the central parts of the plasma, it would be necessary to raise the energy of probing ions much higher than 100 keV, which is the maximum possible in this setup of the HIBP on the TUMAN-3M tokamak. As a result, Na+ or K+ ions with an energy of 60–100 keV should be used for measurements at the periphery of a plasma column (when studying L–H transitions, peripheral MHD activity, edge modes—ELM, etc.), while Cs+ ions with an energy of 25–55 keV—to study phenomena localized in the central part of the plasma, such as sawtooth oscillations, internal transport barriers, etc.
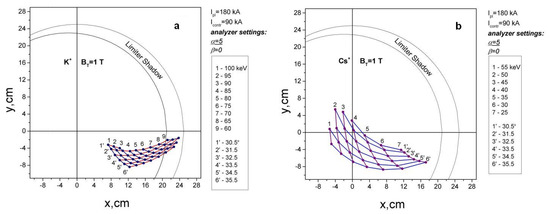
Figure 2.
HIBP detection grids for K+ (a) and Cs+ (b) primary ions. Toroidal field BT = 1T, plasma current Ip = 180 kA.
3. Autonomous Isolated Power Supply System for the Thermionic Source
The source of primary ions is a thermionic source, which is a small fragment of remolten feldspar, heated by a filament with a current of about 12–18 A to a temperature of about 500–1000 °C, and emitting singly charged K+ or Na+ ions, depending on the chemical composition of the feldspar. A feature of the diagnostic circuitry is that the thermionic source must be under a high accelerating voltage, which requires the use of a controllable filament current source decoupled from the mains’ ground. The previously used filament current source fed through an isolation transformer was unreliable and prone to breakdowns, which led to high voltage breakdowns and diagnostic failures. In the course of modernization, it was replaced by a specially designed autonomous fully isolated power supply powered by a lead battery with a voltage of 12 V and a capacity of 60 Ah, which makes it possible to carry out experiments for up to two days without recharging the battery. The source has an adjustable DC-DC converter, which makes it possible to control the filament current and, thus, to regulate the current of the primary HIBP beam. The source is enclosed in a metal equipotential shield electrically connected to the high voltage end of the primary ion accelerator and fixed on high-voltage insulators. To control the source, two optical light guide lines utilizing PWM technique with a length of about 20 m are used, connecting the HIBP located at the tokamak and the operator’s workplace in the control room of the tokamak, and allowing remote control and measurement of the filament current. As a result of this modernization, it was possible to completely eliminate high-voltage breakdowns in the heating and accelerating circuits. The total primary beam current is measured using a Faraday cup inserted into the primary beam propagation channel with the help of a remotely controlled electromagnet, while primary current density profile is registered a 2D wire detector, see below.
4. Control System of the Primary Beam
As noted above, HIBP is a direct method for the plasma potential measurements, since it does not require any a priori assumptions and models of the interaction between the plasma and the probing beam, except for the fundamental principles—the energy conservation law and the potentiality of the electrostatic field. At the same time, there are currently no experimental methods for determining the position of the potential measurement point. In order to find out exactly where the measurement of the potential (as well as other plasma parameters) was made using the HIBP, it is necessary to simulate the propagation of the primary and secondary beams taking into account the actual magnetic configuration of the plasma installation, i.e., to solve the equations of motion of the primary and secondary ions with appropriate initial conditions. For the equation of motion of primary ions, these are the magnitude and direction of the velocity vector at the point of entry into the plasma, and the position of this point. The value of the velocity is uniquely determined by the accelerating voltage and the ion mass of the primary beam. To control the direction of the velocity vector and the position of the entry point, steering plates are used with a voltage of the appropriate magnitude and sign applied to them. For independent control of the position of the point of entry into the plasma and the direction of the velocity vector, there are two pairs of such plates (deflecting capacitors) for each of the orthogonal (to each other and to the injector’s axis) coordinates x and z. The module with deflecting capacitors is installed between the primary beam accelerator and the inlet duct of the tokamak (position 17 in Figure 1). The transverse beam entry coordinate Δi (i = x, z) and the angle between the velocity vector and the injector axis αi are related to the voltages Ui1, Ui2 on the deflecting capacitors by the matrix equation
Here Vik is the voltage on the corresponding deflecting capacitor, normalized to the accelerating voltage W: Vik = Uik/W. Matrix elements Mi11 and Mi12 have the dimension “centimeter”, Mi21 and Mi22—“radian” and are determined by the geometric dimensions and position of the deflecting capacitors. For two transverse directions relative to the axis of the injector these matrices are
The matrices are non-degenerate, which allows for solving the equations for the voltages Ui1, and Ui2, this makes it possible to set voltages on the deflecting capacitors that are necessary to obtain the initial conditions for the trajectory of the primary beam which are necessary for measuring the plasma parameters using the HIBP at the pre-requested spatial point. Since the deflection angles and beam displacement are small, in practice the voltages on the deflecting capacitors rarely exceed 1–2 kV, which makes it possible to use relatively low-voltage remotely controlled voltage sources. Of course, the calculation results strongly depend on the position of the primary beam accelerator and the secondary beam energy analyzer, which must be known in each particular experimental configuration. In particular, the coordinate and angle of entry discussed above are defined with respect to the axis of the injector, and in order to calculate the trajectories, they must be recalculated taking into account the position of this axis in space, which can be changed mechanically within certain limits when adjusting the diagnostic. The diagnostic control software module has a built-in steering voltage adjustment interface, which accepts the required values Δi, αi (i = x, z) as input parameters and sets the required voltages on the controlled high-voltage sources. It is worth noting that steering plates located closer to the vacuum vessel of the tokamak mostly affect the entrance angle, whereas another pair of plates located further away from the vacuum vessel affects the position of the entrance point stronger. This circumstance may be used for a quick rough readjustment of the diagnostic between the tokamak shots.
5. Control System of the Primary Beam Profile
To ensure the locality of measurements of plasma parameters using HIBP, it is necessary to have the minimum possible width of the primary beam in the volume of secondary ionization (sample volume). The measurement of the cross-section of the primary beam and its position on entry into the TUMAN-3M vacuum vessel is carried out using a two-coordinate wire detector installed in the inlet duct of the tokamak; see pos. 16 in Figure 1. It comprises a set of 10 wires (6 × 4 wires, x-dimension: 30 mm; z-dimension: 18 mm) with 6 mm spacing between the wires. The X-axis denotes the direction along the wire detector in the poloidal plane; the Z axis is the toroidal direction. The beam passing through the detector creates a current on the wires. The wire current detection system, consisting of analog multiplexer and an ADC, interrogates the current of each of 10 channels (wires) and feeds it through the ADC and a galvanically isolated communication line to a computer. Next, the signal is processed, and the shape and parameters of the beam are restored. The software developed for this task processes the signal from the wires and, using the least squares method, restores the coordinates of the beam center, its width, and the total current; in the reconstruction, we used the assumption that the beam has a Gaussian shape, i.e., current density is given by:
where X0 and Z0 are the coordinates of the beam center along the corresponding axes, σx and σz—beam half-widths in the corresponding directions at the level e−0.5, and I0 is the total beam current. A visualization function is also provided that displays the spatial distribution in two orthogonal cross-sections and as a two-dimensional distribution of the current density in the beam (Figure 3a), which facilitates real-time tuning of the primary HIBP beam. The use of this system makes it possible to quickly adjust the position and width of the primary beam on entry into the tokamak vessel. When studying plasma using HIBP, it is necessary to know exactly the size and position of the secondary ionization region; when implementing a two-point measurement scheme (in which the analyzer is equipped with a double set of entrance slits and detector modules, thus making it possible to measure plasma parameters in two close spatial regions), it is also necessary to know the relative position and degree of possible overlap of the two sample volumes. The change in the beam width with its propagation along the trajectory in a given magnetic field of the tokamak is determined by two factors: focusing with an electrostatic lens in the injector and beam deformation in the inhomogeneous magnetic field. As a result of numerical calculation of the beam propagation, an optimal, from the point of view of the beam focusing on the measurement volume, beam size on the grid detector, which is slightly larger than the minimal possible, i.e., focusing of the primary beam, should be carried out somewhat further than the grid detector, near the point of beam entry into the plasma. In this case, the influence of the focusing action of the inhomogeneous magnetic field of the tokamak turns out to be minimal, and a situation is reached in which the beam has a minimum width at the sample volume. The focusing of the primary beam is controlled by means of an electrostatic lens formed by the potential distribution along the accelerating tube just near the thermionic source; see Figure 3b.
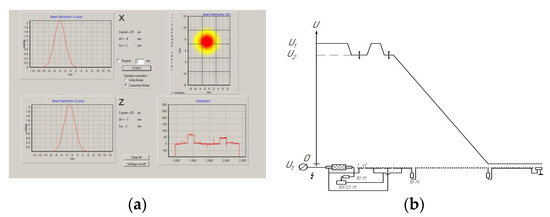
Figure 3.
(a) Program interface for primary beam current profile measurement and visualization. (b) Electric potential distribution along the accelerating tube of the primary beam. Beam propagates from left (thermionic source) to right (tokamak TUMAN-3M vacuum vessel entrance).
In the potential distribution in the accelerator shown in Figure 3b, the voltage U1 determines the energy of the primary ions W1 = |e|U1, and the potential difference U2–U1 forms an electrostatic lens; these voltages are set independently, which makes it possible to adjust focusing when the accelerating voltage changes. The focal length is calculated using the formula
where ϕ′1 and ϕ′2 are the potential gradients to the right and left of the lens. To check the correct operation of the primary ion acceleration system, the ion beam propagation in the injector was simulated using the QuickField Studen Edition Freeware numerical code [23]. The beam width was obtained from the modeling and measured experimentally using the grid detector described above. A comparison of the current profile of the K+ beam with an energy of 60 keV, determined using a grid detector and calculated using the SIMON code, is shown in Figure 4. When modeling, it was assumed that the ions emitted by the thermionic source have an angular spread of about 3° with respect to the axis of the system. In the experiment, the accelerating voltage U1 = 60 keV was fixed, and the change in the focal length of the lens was achieved by changing the “well” potential U2. As expected, the beam width has a minimum at a certain value of the voltage in the “well” corresponding to focusing on the detector. When the focus voltage is changed, the focus shifts from the grid detector in one direction or another. It can be seen that the positions of the minima on the experimental and calculated dependences of the beam width on the detector on the voltage in the “well” coincide quite well, the difference in the “sharpness” of focusing is possibly due to incorrect consideration of the angular spread of the ions emitted by the thermionic source when modeling.
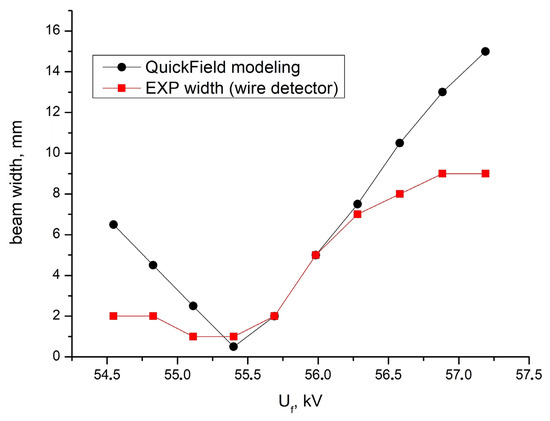
Figure 4.
Comparison of the primary ion beam with measured by wire array detector (red squares) and modeled by QuickField Student Edition Freeware [23] code (black circles) for different focusing voltages.
6. Measurement of the Radial Electric Field in the TUMAN-3M Tokamak Using HIBP in the Co-NBI Heating Scenario
Recently, we reported on the influence of co-NBI on poloidal rotation velocity in TUMAN-3M plasma [24]. In this study, the poloidal rotation velocity was measured using microwave Doppler backscattering. In particular, it was observed that co-NBI is accompanied by a pronounced change in poloidal rotation velocity profile, attributed to the generation of a strong negative radial electric field Er~−(7–8) kV/m 2.5 cm inside LCFS. These experiments were performed in 2018, when HIBP diagnostics was not operational due to modernization. Previously [16], the evolution of the electric potential was studied in the TUMAN-3M tokamak in case of a counter-NBI scenario, when the injection of a heating atomic beam is performed towards the plasma current. This scenario is unfavorable from the point of view of the efficiency of injection heating, since the confinement of fast ions is noticeably worse than in the case of injection of an atomic beam along the plasma current. Therefore, recently the tokamak power supply circuitry was re-switched for operating in the so-called co-NBI mode, when the directions of the plasma current and the velocity vector of the injected atoms coincide. The transition to this set up was implemented by changing the direction of the plasma current, since it was not possible to change the direction of atomic beam injection. As a result, both the direction of the poloidal magnetic field and the toroidal drift of the probing and secondary beams of the HIBP caused by it changed to the opposite. This required, in turn, a redesign on secondary ion beam guide connecting the secondary ion energy analyzer with the tokamak vessel. To this end, a custom connecting module was designed, manufactured and installed between the tokamak vessel and the analyzer, equipped with an interchangeable duct which allows for a relatively quick and simple switching the diagnostics to work with a different direction of the plasma current. Actually, the co-NBI scenario has recently become the standard mode of operation of the TUMAN-3M tokamak in both NBI and ohmic heating modes. Figure 5 presents the results of the first HIBP measurements of the dynamics of the electric potential in the regime with an L–H transition in this experimental set up. This figure shows potential evolution measured in to radial positions r = 9 cm and r = 13 cm in two similar shots. It is seen that in the both shots L-H transition is accompanied by a noticeable drop in plasma potential ΔΦpl ~ 150 V manifesting a formation of average negative radial electric field Er ~ −700 V/m in the region between the sample volume locations and plasma edge at a = 22 cm. A difference between these two shots, however, is that the plasma potential measured 4 cm deeper into the plasma (shot 22072109) reacts on the L-H transition slightly slower, with characteristic time ~5 ms, whereas the potential measured closer to the plasma edge (in the shot 22072207) first drops by ~100 V in ~1 ms and then slowly continues to decrease. Although this observation is only qualitative and preliminary and, as such, requires further examination, it reflects the dynamics of radial electric field in the peripheral transport barrier region near the LCFS. Additionally, it is seen that before the transition, plasma potential measured at r = 13 cm is more negative than at r = 9 cm, which may be interpreted as existence of positive radial electric field in in this region. Formation of positive radial electric field and potential is typical in the low density tokamak discharge [25]. Also, a time trace of the BT is shown in Figure 5, bottom graph. After first ~10 ms of the shot, during ~50 ms of the steady state, the toroidal filed coil current is kept constant within the accuracy of 10%, resulting in the voltage induced on the vacuum vessel of the order of 10–20 V or even less. This value is to be accounted for if one claim to measure and discuss the absolute value of the potential with a high accuracy, but not important for the measurements of Er and fluctuations of the potential and Er.
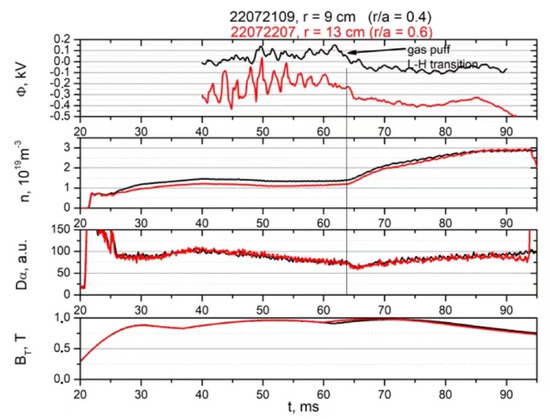
Figure 5.
From top to bottom: Plasma potential evolution measured with HIBP in two similar shots but at different locations, electron number density evolution, Dα emission., and toroidal magnetic field. L-H transition occurs at t = 64 ms after the co-NBI (21.keV @ 16 A) pulse start.
Results of the HIBP measurements of plasma potential evolution in a series of the TUMAN-3M discharges with ohmic and co-NBI heating is shown in Figure 6. This experimental run was aimed to comparative study of L-H transition in NBI scenario. As a routine, ohmic L-H transition in the TUMAN-3M is triggered by a short (~3 ms) pulse of gas puffing increase. This pulsed puffing provides additional particle sources, which helps in obtaining the transition into self-sustained H-mode [26]. From the experimentalist’s point of view, this technique helps to repeatedly get the transition at the selected time instance, thus facilitating shot-to-shot measurements. In the shot 22072207, this pulsed gas puffing was applied at the start of the NBI; see the red curve in Figure 6. The L-H transition is clearly indicated by a sharp drop of Dα emission and simultaneous increase in plasma density. The plasma potential measured by the HIBP at r/a = 0.6 exhibited a sharp drop by approx. 100 V, indicating an increase in the negative radial electric field at the plasma periphery peculiar to the H-mode. Estimation of the radial electric field averaged over the distance between the HBP sample volume location and plasma edge gives Er ~ 1.1 kV/m. In a similar shot (22072212) with the same NBI power but without a gas puffing pulse, the L-H transition was not initiated: Dα and plasma potential did not show any perturbation that might have been interpreted as the L-H transition. In fact, these signals in this shot are similar to ones measured in purely ohmic discharge 22072108. From the comparison of these three shots, one may conclude that the co-NBI alone in the TUMAN-3M (with the power of ~300 kW available now) could not provide conditions necessary for the L-H transition.
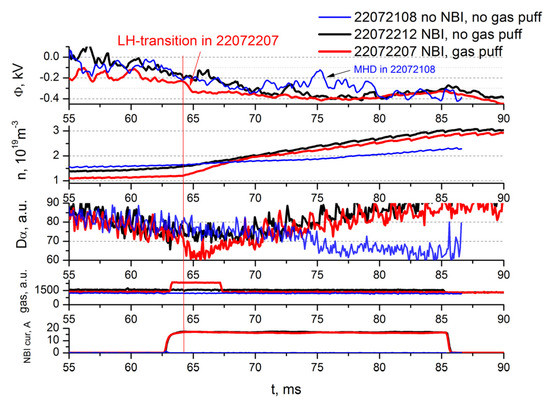
Figure 6.
From top to bottom: Plasma potential evolution measured with HIBP in three shots with or without co-NBI (see legend), electron number density evolution, Dα emission, gas puffing, and co-NBI beam current. In shots 22072212 and 22072207, co-NBI with energy 21.5 keV and beam current 17 A were applied.
7. Discussion
As a result of the modernizations and improvements made to the HIBP diagnostic of the TUMAN-3M tokamak, it is now possible to perform routinely the measurements of the plasma potential and radial electric field evolution in the plasma scenarios with a reversed plasma current direction, in which neutral heating beam is injected along the plasma current. First, measurements performed in the discharges with L-H transition revealed some similarities with observations made earlier in the ohmic H-mode regime and in the discharges with L-H transition triggered by counter-NBI. Namely, in all the scenarios the plasma potential becomes more negative after the transition, indicating the negative radial electric field build up at the plasma periphery, where an H-mode transport barrier is being formed. The absolute value of the potential perturbation registered in the present experiments ΔΦ ~ 150 V is close to the one observed in ohmic L-H transition scenario and is much smaller than the one observed in counter-NBI triggered L-H transition [16]. It may be a result of different mechanisms involved in radial electric field formation. In the counter-NBI scenario, the negative radial electric field is generated by two mechanisms: in the core region, a negative Er is a result of mechanical torque transfer from confined fast ions to plasma, whereas, at the edge, negative Er is mainly due to the radial current of fast ion loss, IFIL. As a result, in this scenario, the negative Er is strong enough, and the L-H transition was initiated at lower NBI power without additional triggering from the gas puffing. Estimations of the IFIL × Bθ torque due to this fast ion loss current gave the toroidal rotation velocity ~30 km/s, which was close to the experimentally measured using optical Doppler spectroscopy of the BIV line. In the present experiments with co-NBI, we do not see the L-H transition if only the co-NBI pulse is not accompanied by a short pulse of gas puffing. The measurements of the BIV line also show no toroidal rotation [27]. It may be explained by a better confinement of fast ions in the co-NBI scenario, hence a lower fast ion loss current and toroidal torque. In addition, in the co-NBI scenario, the mechanical torque transfer from confined fast ions to plasma generate co-current toroidal rotation, hence positive Er, in the core region. The viscous momentum transfer from the core to the edge acts to decrease the negative peripheral Er. Only application of the gas puffing pulse in this scenario can trigger the L-H transition.
This observation is in a qualitative agreement with experiments on the DIII-D tokamak where the effect of the total NBI torque on the possibility of the L-H transition was studied in 2010 [28]. In particular, it was found that the increase in positive torque (i.e., predominance of co-NBI fraction over counter-NBI) led to an increase in the L-H power threshold and was accompanied by a lower Er at the peripheral transport barrier location. In case of balanced NBI, the radial electric field reached the value of Er = −15 kV/m in a narrow (~2 cm) well just inside the LCFS. If one calculates the plasma potential perturbation as a result of L-H transition as ΔΦ = ∫Er(r)dr, where Er(r) is the radial electric field profile is measured on DIII-D, the value ΔΦ ~ 150 eV is found to be surprisingly close to the potential perturbation measured with the HIBP on the TUMAN-3M, despite the large difference in size, plasma parameters, and NBI power between the two tokamaks.
On the other hand, while the physics of radial electric field formation in the peripheral region of the tokamak plasma may be quite complex, the value of the Er and its functional dependence on the plasma parameters are found to be quite close to the neoclassical ones [29]. In this paper, the radial electric field was modeled for the ASDEX Upgrade shots with or without counter-NBI and was found to be close qualitatively to the one measured on DIII-D tokamak. In order to compare our HIBP measurements with the neoclassical predictions, we will need to perform accurate measurements of local plasma parameters such as the electron density and ion temperature.
Author Contributions
Conceptualization, L.A. and A.B.; methodology, S.L.; software, N.Z.; validation, L.A., A.B. and A.S.; formal analysis, D.S.; investigation, A.T., V.K. and D.R.; resources, S.L.; data curation, A.B.; writing—original draft preparation, L.A.; writing—review and editing, G.A.; supervision, L.A.; project administration, L.A.; and funding acquisition, L.A. All authors have read and agreed to the published version of the manuscript.
Funding
Operation and standard diagnostics on TUMAN-3M tokamak are supported by Ioffe Institute State contract 0040-2019-0023. Optical measurements during NBI heating experiments on TUMAN-3M tokamak are supported by Ioffe Institute State contract 0034-2021-0001. HIBP measurements on TUMAN-3M tokamak are supported by Russian Scientific Foundation project 22-12-00062.
Data Availability Statement
Not applicable.
Conflicts of Interest
The authors declare no conflict of interest.
References
- Jobes, F.; Hickok, R. A direct measurement of plasma space potential. Nucl. Fusion 1970, 10, 195. [Google Scholar] [CrossRef]
- Melnikov, A. Evolution of Heavy Ion Beam Probing from the Origins to Study of Symmetric Structures in Fusion Plasmas. Symmetry 2021, 13, 1367. [Google Scholar] [CrossRef]
- Askinazi, L.G.; Chmyga, A.A.; Dreval, N.B.; Golant, V.E.; Khrebtov, S.M.; Komarov, A.S.; Kornev, V.A.; Krupnik, L.I.; Lebedev, S.; Van Oost, G.; et al. First HIBP Measurement of Plasma Potential During the H-Mode Transition on the TUMAN-3M Tokamak. In Proceedings of the ICPP 2002 11th International Congress on Plasma Physics, AIP Conference Proceedings, Sidney, Australia, 15–19 July 2002; Volume 669, pp. 171–178. [Google Scholar]
- Melnikov, A.; Krupnik, L.; Eliseev, L.; Barcala, J.; Bravo, A.; Chmyga, A.; Deshko, G.; Drabinskij, M.; Hidalgo, C.; Khabanov, P.; et al. Heavy ion beam probing—Diagnostics to study potential and turbulence in toroidal plasmas. Nucl. Fusion 2017, 57, 072004. [Google Scholar] [CrossRef]
- Fujisawa, A.; Iguchi, H.; Idei, H.; Kubo, S.; Matsuoka, K.; Okamura, S.; Tanaka, K.; Minami, T.; Ohdachi, S.; Morita, S.; et al. Discovery of Electric Pulsation in a Toroidal Helical Plasma. Phys. Rev. Lett. 1998, 81, 2256–2259. [Google Scholar] [CrossRef]
- Ido, T.; Shimizu, A.; Nishiura, M.; Nakamura, S.; Kato, S.; Nakano, H.; Yoshimura, Y.; Toi, K.; Ida, K.; Yoshinuma, M.; et al. Potential fluctuation associated with the energetic-particle-induced geodesic acoustic mode in the Large Helical Device. Nucl. Fusion 2011, 51, 073046. [Google Scholar] [CrossRef]
- Ido, T.; Osakabe, M.; Shimizu, A.; Watari, T.; Nishiura, M.; Toi, K.; Ogawa, K.; Itoh, K.; Yamada, I.; Yasuhara, R.; et al. Identification of the energetic-particle driven GAM in the LHD. Nucl. Fusion 2015, 55, 83024. [Google Scholar] [CrossRef]
- Kobayashi, T.; Sasaki, M.; Ido, T.; Kamiya, K.; Miura, Y.; Nagashima, Y.; Ida, K.; Inagaki, S.; Fujisawa, A.; Itoh, S.-I.; et al. Quantification of Turbulent Driving Forces for the Geodesic Acoustic Mode in the JFT-2M Tokamak. Phys. Rev. Lett. 2018, 120, 045002. [Google Scholar] [CrossRef]
- Demers, D.R.; Fimognari, P.J. Heavy ion beam probe advances from the first installation of the diagnostic on an RFP. Rev. Sci. Instrum. 2012, 83, 10D711. [Google Scholar] [CrossRef]
- Malaquias, A.; Nedzelskiy, I.S.; Henriques, R.; Sharma, R. The Heavy-Ion Beam Diagnostic of the ISTTOK Tokamak—Highlights and Recent Developments. Sensors 2022, 22, 4038. [Google Scholar] [CrossRef]
- Drabinskiy, M.A.; Melnikov, A.V.; Khabanov, P.O.; Eliseev, L.G.; Kharchev, N.K.; Ilin, A.M.; Vadimov, N.A. Conceptual design of the heavy ion beam probe diagnostic for the T-15MD tokamak. J. Instrum. 2019, 14, C11027. [Google Scholar] [CrossRef]
- Ido, T.; Hasegawa, M.; Ikezoe, R.; Onchi, T.; Hanada, K.; Idei, H.; Kuroda, K.; Nagashima, Y. Conceptual design of a heavy ion beam probe for the QUEST spherical tokamak. Rev. Sci. Instrum. 2022, 93, 113516. [Google Scholar] [CrossRef] [PubMed]
- Vorobiev, G.M.; Golant, V.E.; Gornostaev, S.V.; Grigoriev, A.V.; Gryaznevich, M.P.; Evtushenko, T.P.; Ipatov, V.A.; Kislyakov, A.I.; Lebedev, S.V.; Lipin, B.M.; et al. Ohmic-heating and plasma-compression experiments in the Tuman-3 tokamak. Sov. J. Plasma Phys. (Fiz. Plasmy) 1983, 9, 65. [Google Scholar]
- Askinazi, L.G.; Kornev, V.A.; Lebedev, S.V.; Tukachinsky, A.S.; Zhubr, N.A.; Dreval, N.B.; Krupnik, L.I. Heavy ion beam probe development for the plasma potential measurement on the TUMAN-3M tokamak. Rev. Sci. Instrum. 2004, 75, 3517–3519. [Google Scholar] [CrossRef]
- Askinazi, L.G.; Vildjunas, M.I.; Zhubr, N.A.; Komarov, A.D.; Kornev, V.A.; Krikunov, S.V.; Krupnik, L.I.; Lebedev, S.V.; Rozhdestvensky, V.V.; Tendler, M.; et al. Evolution of geodesic acoustic mode in ohmic H-mode in TUMAN-3M tokamak. Tech. Phys. Lett. 2012, 38, 268–271. [Google Scholar] [CrossRef]
- Lebedev, S.; Askinazi, L.; Chernyshev, F.; Irzak, M.; Kornev, V.; Krikunov, S.; Melnik, A.; Razumenko, D.; Rozhdestvensky, V.; Smirnov, A.; et al. Counter-NBI assisted LH transition in low density plasmas in the TUMAN-3M. Nucl. Fusion 2009, 49, 085029. [Google Scholar] [CrossRef]
- Andreev, V.F.; Dnestrovskij, Y.N.; Kostomarov, D.P.; Popov, A.M.; Tsaun, S.V. Mathematical models of plasma equilibrium in a tokamak with iron core. Sov. J. Plasma Phys. 1986, 12, 387. [Google Scholar]
- Melnikov, A.V. Electric Potential in Toroidal Plasmas; Springer Series in Plasma Science and Technology; Springer: Cham, Switzerland, 2019; 240p, ISBN 978-3-030-03480-1. [Google Scholar] [CrossRef]
- Dnestrovskij, Y.N.; Melnikov, A.V. Determination of the current profile in a plasma by probing with heavy ion beams. Sov. J. Plasma Phys. 1986, 12, 393. [Google Scholar]
- Schwelberger, J.; Connor, K. Atomic collision processes relevant for heavy ion beam probes. IEEE Trans. Plasma Sci. 1994, 22, 418–423. [Google Scholar] [CrossRef]
- Dnestrovskij, Y.N.; Melnikov, A.V.; Krupnik, L.I.; Nedzelskij, I.S. Development of Heavy Ion Beam Probe Diagnostics. IEEE Trans. Plasma Sci. 1994, 22, 310–331. [Google Scholar] [CrossRef]
- Tawara, H.; Kato, T. Total and partial ionization cross sections of atoms and ions by electron impact. At. Data Nucl. Data Tables 1987, 36, 167–353. [Google Scholar] [CrossRef]
- QuickField Student Edition Free Software. Available online: https://quickfield.com/free_soft.htm (accessed on 13 December 2022).
- Yashin, A.; Belokurov, A.; Askinazi, L.; Petrov, A.; Ponomarenko, A.; the TUMAN-3M Team. The Influenc e of Fast Particles on Plasma Rotation in the TUMAN-3M Tokamak. Atoms 2022, 10, 106. [Google Scholar] [CrossRef]
- Bugarya, V.I.; Gorshkov, A.V.; Grashin, S.A.; Ivanov, I.V.; Krupin, A.A.; Krupnik, L.I.; Sokolov, Y.A. Electric potential and toroidal and poloidal rotation velocities of a tokamak plasma. JETP Lett. 1983, 38, 404–408. [Google Scholar]
- Belokurov, A.A.; Askinazi, L.G.; Chôné, L.; Gusakov, E.Z.; Kiviniemi, T.P.; Kornev, V.A.; Zhubr, N.A. Dynamics of the LH-transition in TUMAN-3M tokamak in the scenarios with cryogenic pellet injection. Nucl. Fusion 2018, 58, 112007. [Google Scholar] [CrossRef]
- Belokurov, A.A.; Abdullina, G.I.; Askinazi, L.G.; Kornev, V.A.; Lebedev, S.V.; Razumenko, D.V.; Shergin, D.A.; Smirnov, A.I.; Tukachinskiy, A.S.; Zhubr, N.A. The first application of HIBP for co-NBI plasma potential measurement in TUMAN-3M tokamak. Tech. Phys. Lett. 2022; accepted. [Google Scholar]
- Gohil, P.; Jernigan, T.; Osborne, T.; Scoville, J.; Strait, E. The torque dependence of the H-mode power threshold in hydrogen, deuterium and helium plasmas in DIII-D. Nucl. Fusion 2010, 50, 064011. [Google Scholar] [CrossRef]
- Rozhansky, V.; Kaveeva, E.; Voskoboynikov, S.; Coster, D.; Bonnin, X.; Schneider, R. Modelling of electric fields in tokamak edge plasma and L–H transition. Nucl. Fusion 2002, 42, 1110–1115. [Google Scholar] [CrossRef]


Publisher’s Note: MDPI stays neutral with regard to jurisdictional claims in published maps and institutional affiliations. |
© 2022 by the authors. Licensee MDPI, Basel, Switzerland. This article is an open access article distributed under the terms and conditions of the Creative Commons Attribution (CC BY) license (https://creativecommons.org/licenses/by/4.0/).