Article

The 3D Direct Simulation Monte Carlo Study of Europa’s Gas Plume

1
Department of Earth Sciences, National Taiwan Normal University, Taipei 116, Taiwan
2
Physikalisches Institut, University of Bern, 3012 Bern, Switzerland
3
Institute of Astronomy, National Central University, Taoyuan 320, Taiwan
4
Space Science Institute, Macau University of Science and Technology, Macau, China
5
Laboratory for Atmospheric and Space Physics, University of Colorado Boulder, Boulder, CO 80303, USA
6
Department of Mechanical Engineering, National Yang Ming Chiao Tung University, Hsinchu 300, Taiwan
*
Author to whom correspondence should be addressed.
Universe 2022, 8(5), 261; https://doi.org/10.3390/universe8050261
Submission received: 18 February 2022 / Revised: 1 April 2022 / Accepted: 19 April 2022 / Published: 24 April 2022
(This article belongs to the Section Planetary Sciences)

Abstract

:
Europa has been spotted as having water outgassing activities by space- and ground-based telescopes as well as reanalysis of the Galileo data. We adopt a 3D Direct Simulation Monte Carlo (DSMC) model to investigate the observed plume characteristics of Europa assuming that supersonic expansion originated from the subsurface vent. With a parametric study of the total gas production rate and initial gas bulk velocity, the gas number density, temperature and velocity information of the outgassing plumes from various case studies were derived. Our results show that the plume gases experience acceleration through mutual collisions and adiabatic cooling when exiting from the surface. The central part of the plume with relatively large gas production rates (1029 and 1030 H2O s−1) was found to sustain thermal equilibrium and near continuum condition. Column density maps integrated along two different viewing angles are presented to demonstrate the importance of the projection effect on remote sensing diagnostics. Finally, the density profiles at different altitudes are provided to prepare for observations of Europa’s plumes including upcoming spacecraft missions such as JUICE and Europa Clipper.
Keywords:
icy moon; Europa; plume

1. Introduction

Europa is an icy moon of Jupiter, and it likely hosts a subsurface ocean, as derived from the diversity of the surface geological features and the magnetic field measurements made by the Voyager and Galileo missions (e.g., [1,2,3,4]). Recently, outgassing plumes have been inferred to occur on Europa. These observations include (1) the local density inhomogeneity of the atomic O and H aurora emissions observed by the Hubble Space Telescope (HST), the emission intensities of which are consistent with electron-impact dissociation of water molecules [5]; (2) the HST observation of absorption features shown in the UV continuum of Jupiter during Europa’s transits [6,7,8]; (3) the water molecules observed in the infrared wavelength by the Keck Observatory [9]. In addition, reanalysis of the Galileo data, including the magnetic field and plasma measurements, also inferred that Europa had eruptions [10,11,12].
All of the above reports suggested that the plumes originated from various latitudinal regions in the southern hemisphere, except for no latitudinal information of the Keck result due to the fact of its observational configuration. Neither the exact source location nor the venting mechanism (i.e., plume dynamics) are explicitly disclosed. The gas thermal velocities were required to be at least 0.5 and 0.7 km s−1 to arrive at the altitude of the observed peaks of ~100 km [8] and ~200 km [5], respectively, assuming that the plume material follows a ballistic motion. The transverse water column densities of ~1020 m−2 and 1.8 × 10²¹ m−2 were derived by [5] and [8], respectively, while the disk-averaged column density derived from Keck measurements by [9] suggested 1.4 × 10¹⁹ H2O m−2. Although the possible projection effect on plume morphology is discussed later, it could suggest that a mixture of various outgassing activities occurred in random places on Europa. The durations of Europa’s plume eruptions are not known either, which are only provided with the integrated observation time of several hours (e.g., ~2.5 h [9]; ~1 h [8]; ~7 h [5]). The signatures of Europa’s plumes inferred by the Galileo data (i.e., the E12 flyby at the closest-approach altitude of ~200 km [12] and the E26 flyby at the closest-approach altitude of ~350 km [10]) were roughly consistent with the small-scale plume characteristics suggested by [5]. The in situ measurements of Galileo could give better constraints on the source regions, which were both in the Southern Hemisphere and trailing side. However, existing observations also indicated that the Europa’s outgassing activity may not be similar to Enceladus’ persistent plumes but were sporadic and/or intermittent events [9,13,14].
In addition to recent observations, modeling efforts have been made to investigate Europa’s plume morphology and its consequences. For example, some surface features on Europa could be associated with its plume emplacements via cryovolcanism [15,16]. Using a ballistic trajectory model, [16] found that the small-scale plumes with a low eruption velocity (<0.3 km s−1) could account for the dark material deposited around the ridges, lenticulae and lineae shown in the Galileo images. [17] examined the morphological and spectral signatures of the possible plume deposits and used the latest HST observations to constrain the eruption velocity to be 0.03–1.0 km s−1. [18] modeled Europa’s dust plume morphology and studied its surface deposition effect assuming that the driving mechanism is similar to that of Enceladus [19]. When investigating Europa’s global exosphere mainly generated from sputtering and thermal adsorption, [20] also added an assumed plume source with a production rate of 1028 H2O s−1 in the south polar region. Their modeling results showed that a significant gas density enhancement could exist near the plume source region (i.e., lifetime on the order of magnitude of 105 s). [21] used a Monte-Carlo model with a ballistic approach to simulate the plume profiles from three different source mechanisms and found out that the source cannot be determined by comparing the simulated atomic H and O emissions with the existing HST observations [5,22].
In this work, a DSMC model was developed to investigate the plume characteristics of Europa. The direct simulation Monte Carlo (DSMC) method proposed by [23] is suitable for studying the rarefied gas flow by solving the Boltzmann equation. For example, the physical processes and structures of the planetary jets and plumes can be adequately described by the DSMC model with a broad flow regime ranging from close to semi-continuum near surface to a collisionless condition at high altitudes (e.g., [24,25,26,27,28,29,30]). Recently, [31] used a DSMC model to examine Europa plumes with a primary variable of the Mach number which dominates the plume expansion. Their Mach number is determined by the throat-to-vent area ratio assuming that the supersonic expansion originated from a subsurface vent similar to Enceladus’ condition [19]. Understanding the plume dynamics above surface, therefore, can be used to probe its subsurface vent properties. In addition, a canopy shock layer can be formed in the top of plume with a high flow mass rate of ~1000 kg s−1, which would limit the overall plume height [31].
We conducted a systematic study on the effects of the total gas production rate and initial gas bulk velocity with an assumption of supersonic eruption from subsurface. The details of our DSMC model and justifications of the model inputs are presented in Section 2 and Section 3, and they show the simulated plume results for the Knudsen number, gas temperature, number density and velocity distributions. The projection effect on the plume morphology integrated along two different viewing angles is also discussed. The density vs. horizontal distance profiles of the simulated plumes at different altitudes are provided for comparisons with any possible future observation. Comparisons with existing plume observations and the important consequences of Europa’s outgassing activity are discussed at the end of Section 4. Finally, a summary of our work is given in Section 5. The modeling results of both assumed that the gas production rate and gas bulk velocity (such as plume height, gas temperature, velocity and density distribution) can be used to improve scientific interpretations of space- and ground-based telescope observations of Europa’s plumes. It is also helpful for the designs of the in situ measurements of future spacecraft missions, such as the JUpiter Icy moons Explorer (JUICE; [32]), which will explore Jupiter and its three large icy moons in depth, and the Europa Clipper [33], to characterize further information about the plume source region on Europa.

2. Materials and Methods

2.1. General Description

The DSMC method is a particle-based method to simulate gas flow with a large number of particles. This method was proposed by [23], and it solves the Boltzmann equation for all regions of rarefaction. The Knudsen number (Kn) indicates the rarefaction of gas flow and is defined as Kn = λ/L, where L is the characteristic length and λ is the local mean free path. In this work, Europa’s radius (1560 km) was used as a characteristic length, L, to investigate the global structure of Europa’s plumes. If Kn > 0.001, the continuum assumption with a conventional no-slip boundary condition breaks down [34]. The PDSC++ code used in the present study is a 3D parallelized DSMC code including several features: unstructured mesh, variable time-step scheme, domain re-decomposition and automatic steady-state detection scheme [35,36,37,38,39]. It has also been successfully applied to the modeling of cometary outgassing [40,41,42,43].
To calculate the plume of Europa, we built an unstructured grid with 3,987,633 tetrahedron cells. The cell size was set to be smaller than the local mean free path of the molecules. The size of the simulation box was approximately 12 Europa’s radii. The initial gas temperature was assumed to be in thermodynamic equilibrium (i.e., kinetic temperature equal to rotational temperature) when exiting from the surface boundary condition. The low temperature (<120 K) [36] on the surface of Europa suggests that the water molecules will mostly re-condense when they collide with the boundary of Europa’s surface. Therefore, the simulation particles in the model will be removed when they collide with the surface. A general DSMC calculation can be described as following:
1. Set initial state and read system data: Before calculation, the DSMC program must set-up a grid for the calculation and then input the initial condition and boundary condition;
2. Move all particles: In the calculation of each time step, the simulation gas particles travel a distance with their velocities. The particles that leave the simulation domain are removed;
3. Introduce new particles: After moving all of the particles, new particles are added into the simulation domain from the boundary of the source region;
4. Sort particles and calculate collisions: In this phase, all particles are indexed in the simulation domain and the collision pairs identified, which depends on the local number density, and the new velocities after collision are calculated. In this work, we used the variable soft sphere (VSS) model for the collision. In addition, collisions also allow for energy transfers between the translational and internal (i.e., rotational) mode;
5. Sample the flow and check the steady-state flow: In each cell, the macroscopic properties of flow are sampled from the microscopic properties of each particle. When the flow reaches the steady state, by checking the convergence of the total particle number, velocity and temperature, the flow field will be stored. The final result of the gas flow will be calculated by taking the average of the sufficient sampling.

2.2. A Parametric Study of the Gas Production Rate and Gas Bulk Velocity

In this work, we examined the physical processes and structures of supersonic gas plumes of Europa. Neither grain formation due to the fact of condensation nor collision with grains were taken into account. The effects of grains on the planetary plume morphology were found to be negligible (e.g., [44]). The only loss process of the water molecule considered here was to re-impact the surface, meaning that the modeled plume reached a steady state not much longer than the particle flight time (i.e., on the order of several thousand seconds). By the same token, the water loss to photolytic, electron-impact and ion-neutral reactions affected by Jupiter’s magnetospheric plasma was not included because of the much longer reaction timescales (i.e., >~105 s; [45]) compared to the particle flight time. Coriolis force and centrifugal force were found to be negligible when the particle flight time was much shorter than Europa’s rotation period. A circular source area was assumed with a radius of 20 km near a pole on Europa. Note that this is not a representative size of a realistic vent on Europa, because there is no actual measurement and/or solid evidence of the subsurface vent size on Europa. Regardless of the meter-sized vent on Enceladus, suggested by [19], the vent size on Europa can be expected to be broader due to the fact of its larger mass (e.g., [46]). A large modeled vent size can be seen as a collective effect of many small vents located in a limited region, and we focused only on the macroscopic phenomenon assuming that these smaller plumes do not have strong interactions to significantly modify the overall plume morphology. A similar approach has also been used by [30] to study Io’s volcanic plumes with a “virtual” vent radius of 16 km in a DSMC model. In addition, the observable outgassing properties, such as plume height and width, were found to change only in a range of 10–20% when modifying the modeled parameters such as the vent size. In addition, the spatial resolution (~200 km) and sensitivity in the HST images (e.g., [5]) are insufficient to distinguish the collisional part and non-collisional part of observed plumes. Our approach is thus adequate for use in observing plume morphology (i.e., plume height and width) to investigate the gas eruption properties near the surface. Although it is a compromising strategy between the computational time and spatial resolution, the modeling results is a useful first step for comparing with remote sensing observations.
As discussed above, existing observations do not give a clear and consistent picture of Europa’s plume eruption. In addition, it has also been observed that Enceladus’ outgassing activities could be a mixture of various gas emission rates from different source locations, narrow and high-altitude jets as well as diffusive and low-altitude plumes (e.g., [47,48]). Therefore, we studied Europa’s plume activity with a large parametric space mainly relying on what we learned from Enceladus. In the simulations, the initial gas thermal temperature of Europa’s plume was assumed to be 180 K based on the source temperature of Enceladus’ plume gas [49], considering the lack of direct constraints of Europa’s plumes. The previously published temperatures of Europa’s gas plumes were indirectly derived from the altitudes of the observed signals, assuming plume material following ballistic trajectories with their gas thermal velocities being able to reach (e.g., >230 K [5]). Note that the plume peak altitudes derived from observations may not represent the actual plume top due to the projection effect (i.e., the line-of-sight effect and the unknown source region) as is discussed in Section 3.3. The supersonic and high-altitude jets (i.e., high Mach number) and the diffusive and low-altitude plumes (i.e., low Mach number) observed in Enceladus, on the other hand, suggested both medium- and high-velocity ejections (e.g., [47,48,50,51,52]). Along this line, a systematic study of the gas bulk velocities, from subsonic (0.35 km s−1) to supersonic conditions at 0.5 km s−1, 0.75 km s−1 and 1.0 km s−1 with averaged Mach numbers between 1 and 2, was carried out in this work.
Finally, three water gas production rates of 1028 s−1, 1029 s−1, 1030 s−1 were considered in the simulations. These values appear to be much higher than the Enceladus plume source rates (i.e., in the order of 1028 s−1), with the middle case being comparable to the values derived by [5] (~2.3 × 1029 H2O s−1) and [9] (~8 × 1028 H2O s−1). It was also found that the Europa plume mass was ~100 times that of Enceladus when [53] compared the Enceladus plume material measured by Cassini UVIS (Ultraviolet Imaging Spectrograph Subsystem) with the absorption features of Europa’s plumes seen in the HST images [2]. The initial model inputs for the six case studies are summarized in Table 1. While cases 1–3 were simulated with the same gas bulk velocity of 0.5 km s−1 to study the effect of varying gas production rate on the plume morphology, the influence of initial gas bulk velocity was examined in cases 4–6 with the same Q = 1029 H2O s−1. A special case 7 was included to investigate the possible stealth plume activity under the current detection limits (i.e., a very low gas production rate of 1026 H2O s−1) which could be discovered by the upcoming space missions (discussed in Section 4).

3. Results

Here we show the simulation results of six case studies to investigate the physical structure of Europa’s outgassing plume expanding from surface to high altitude. Both effects of the total gas production rate and gas bulk velocity on the plume morphology and dynamical process are discussed.

3.1. Knudsen Number, Gas Temperature and Thermal Equilibrium

Figure 1 (column a) shows the modeled local Knudsen number, Kn, along the plume symmetric plane. It can be seen that the Kn varied by several orders of magnitudes across the plume. The gas flow in the low-altitude and central region of the plume shows a near continuum condition (Kn ≤ 0.01) where frequent gas collisions occur. Then, it expands to the collisionless condition (Kn ≥ 1) at a high altitude (i.e., transition region). The transition altitude where the flow starts to deviate from continuum was highest (~0.5 Europa radius above surface) with the highest gas bulk velocity of 1.0 km s−1 (Figure 1, case 6(a)). In addition to the effect of initial gas bulk velocity, the transition height slightly decreased with the decreasing gas production rate, particularly for 1028 s−1 due to the fact of insufficient gas collisions (see Figure 1, case 3(a)).
The degree of local thermal equilibrium, represented by γ, is shown in Figure 1 (column b). γ is defined to be “the absolute value of (Ttrans/Trot − 1)”, where Ttrans and Trot are the gas translational temperature and rotational temperature, respectively. When γ is close to zero, the gas flow approaches thermal equilibrium (i.e., the translational temperature equal to the rotational temperature), which mostly occurs in the dense part of the plume along its central line and its upper layer. At a very top of the plume, γ becomes larger and Ttrans deviates from Trot. The energy in each mode (i.e., translational and rotational temperature) may remain “locked” without sufficient gas collisions allowing for energy transfer in different modes. By the same token, the translational and rotational temperatures differ from one another along the lateral edges of the plumes (i.e., red color in the bowtie-shaped region as discussed below) where the gas collision frequency is too low to maintain thermal equilibrium. Similar features are also reflected in the Kn plots. The chaotic regions outside of the major plume tops (i.e., the red colored regions) were the result of a very few particles scattered by gas collisions. As expected, the degree of thermal equilibrium depends on the collision frequency, which is also controlled by the gas production rate (see cases 1–3 in Figure 1b for comparisons). The distribution of the degree of thermal equilibrium is generally consistent with the one of Kn, where a smaller Kn indicates a condition closer to thermal equilibrium (i.e., smaller γ). Figure 1 (column c) presents the gas translational temperature distributions. The gas translational temperature along the center line of the plume rapidly dropped from the initial 180 K to below 100 K within an altitude of ~100 km. This was due to plume expansion that causes adiabatic cooling primarily in the low altitude region. The statistical noise above the plume tops (Figure 1 case 6(c)) were the result of low counting statistics in this region, which is also seen in the lateral sides of the plume bottom (i.e., the high temperature region) where too few particles were recorded.

3.2. Gas Number Density and Velocity Distributions

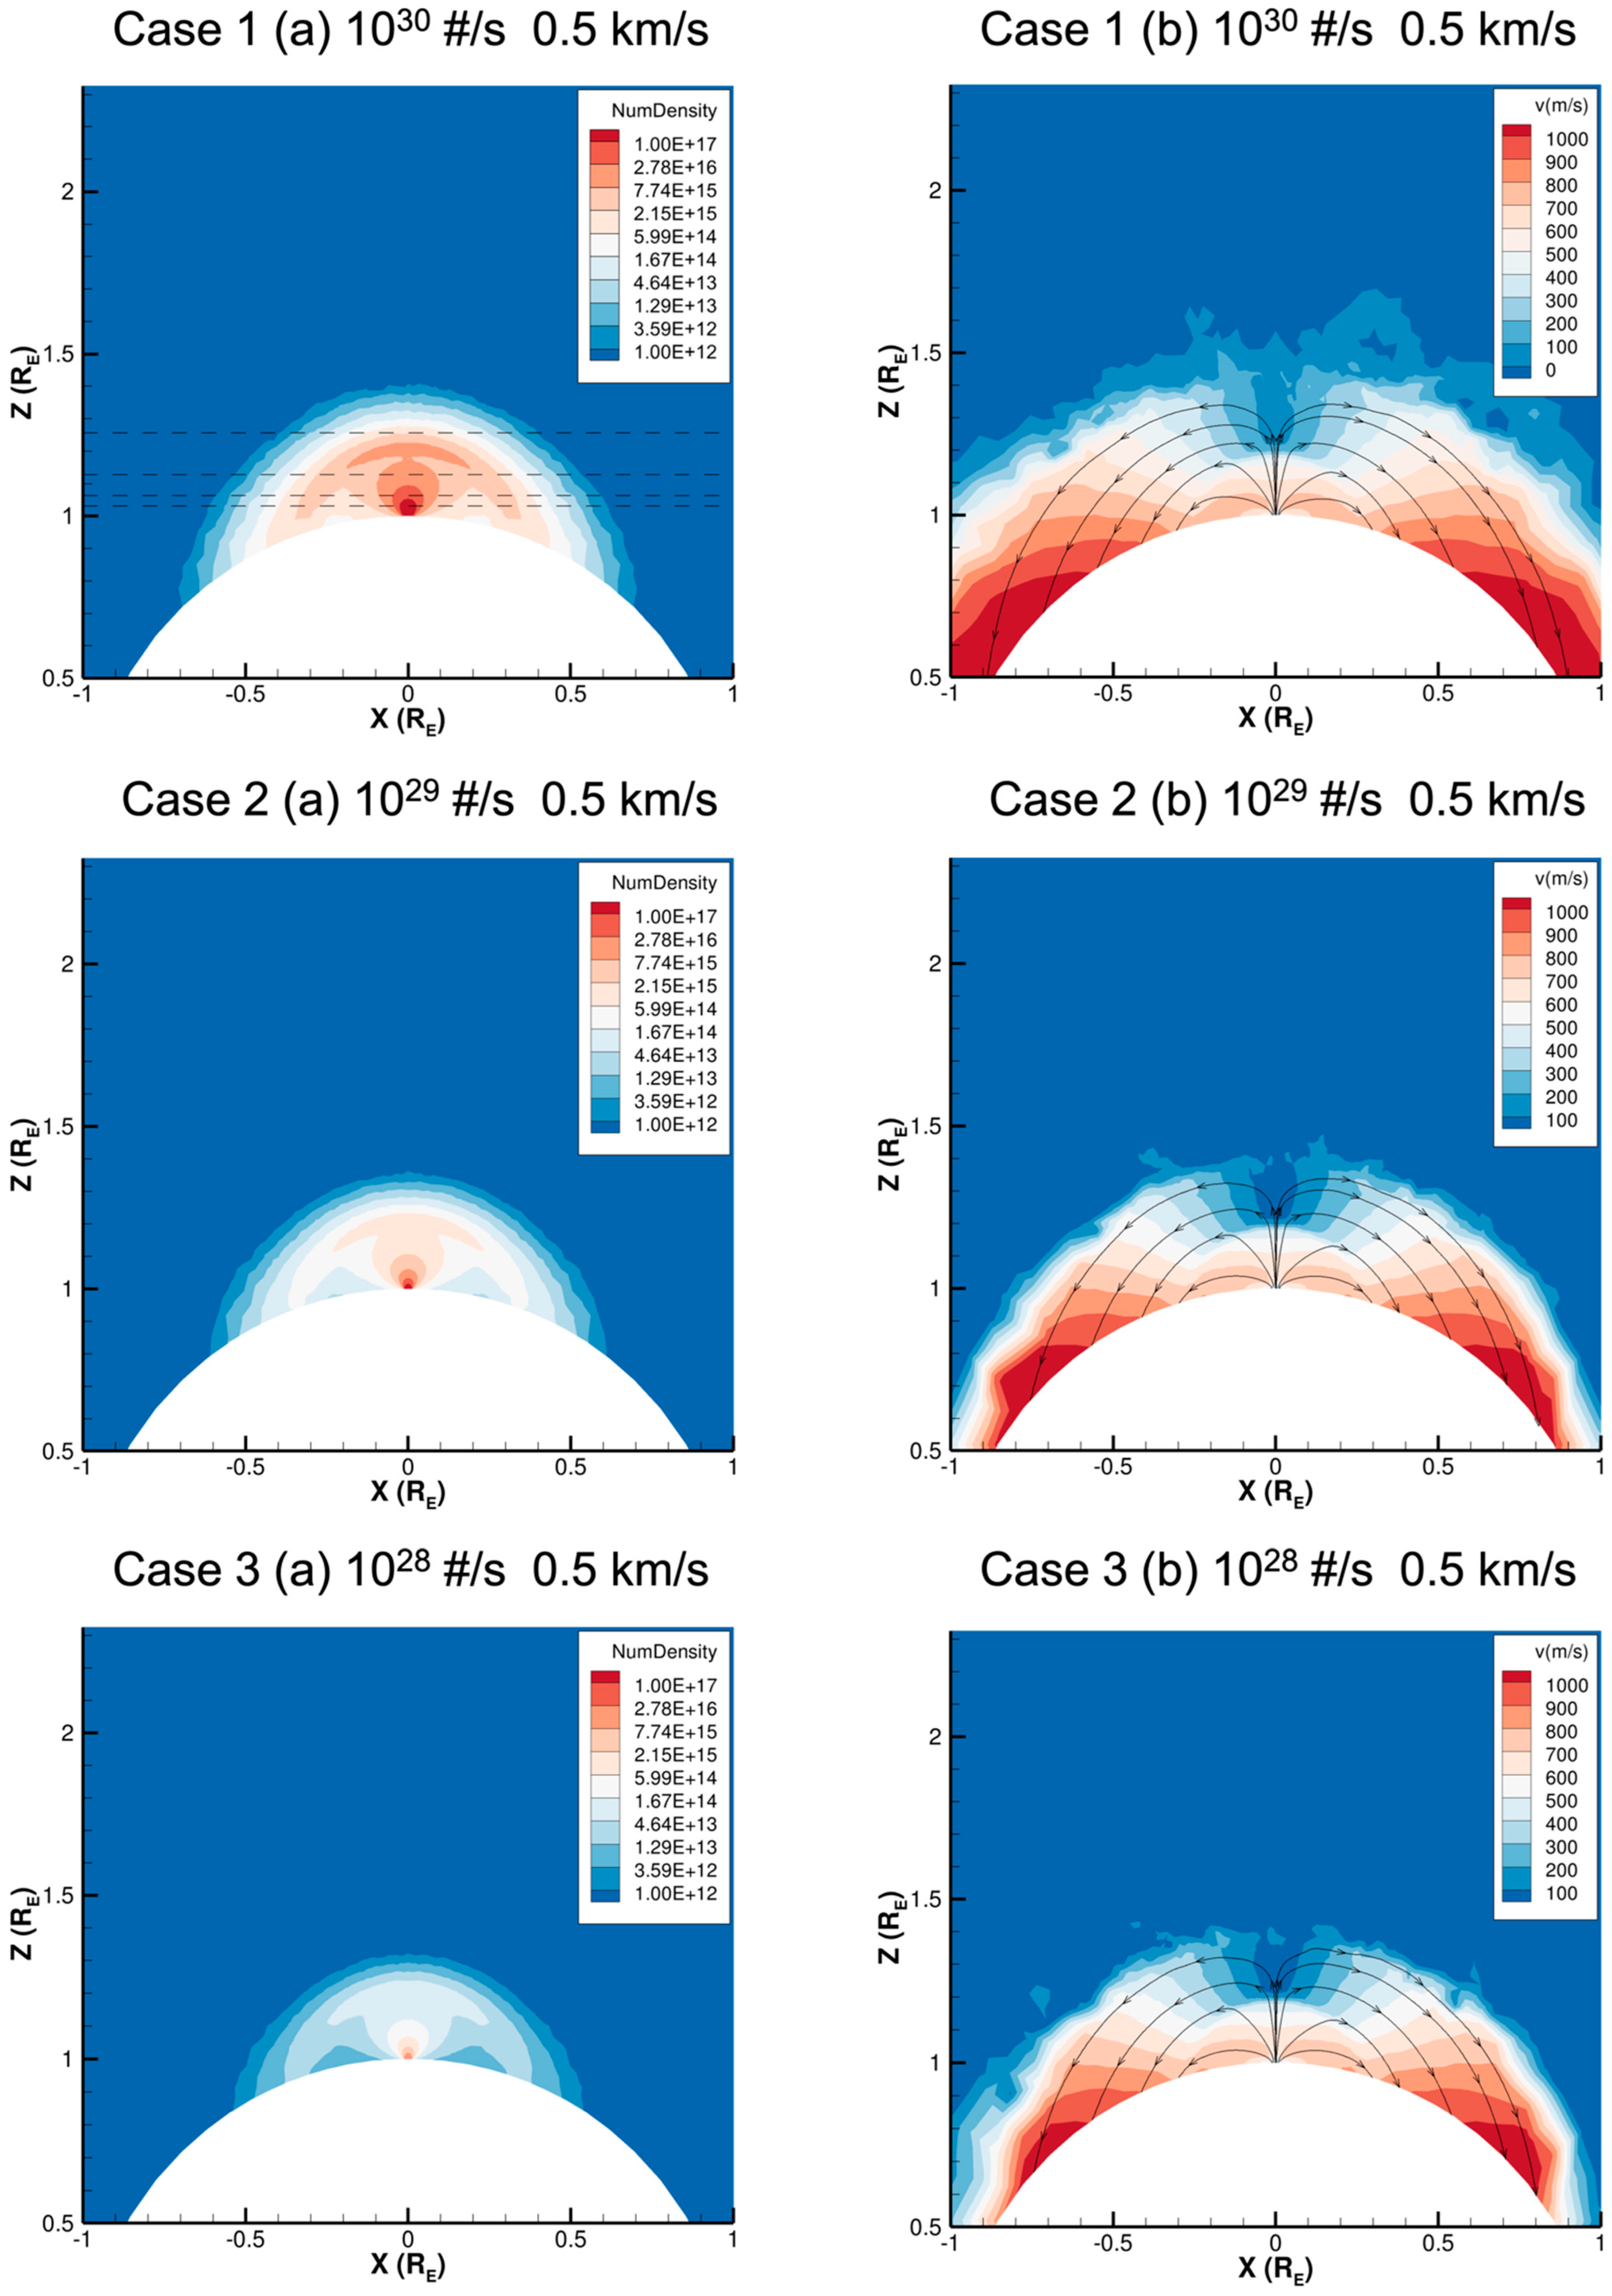
The number density distributions of the simulated plumes are shown in Figure 2 (column a). Because of expansion, the gas number density dropped rapidly with the increasing altitude. With the same initial velocity, the gas number density generally increased with the larger gas production rate (cases 1–3(a) in Figure 2). There were also some distinct features such as the bow-shape structure (i.e., canopy) at the plume top and the “bowtie” pattern in the lateral sides of the plume in the low-altitude region. Both features are seen in Figure 1 as well. The enhanced density shown in the “bow” shape at the plume top was due to the sum of two particle populations (i.e., upward flow and downward flow) that approached zero velocities. This feature was mostly obvious in the plumes produced with a high gas production rates of 1030 s−1 and 1029 s−1. The importance of the canopy shock layer on plume morphology has also been discussed by [31]. The “bowtie” pattern represents the voids in the lateral sides of the plume where very few particles travel through. With the same gas production rate, the effect of initial gas ejection velocity on the plume morphology is presented in Figure 2 for cases 2 and 4–6 for Q = 1029 s−1, which clearly shows that the reducing gas ejection velocity led to a smaller and much denser plume.
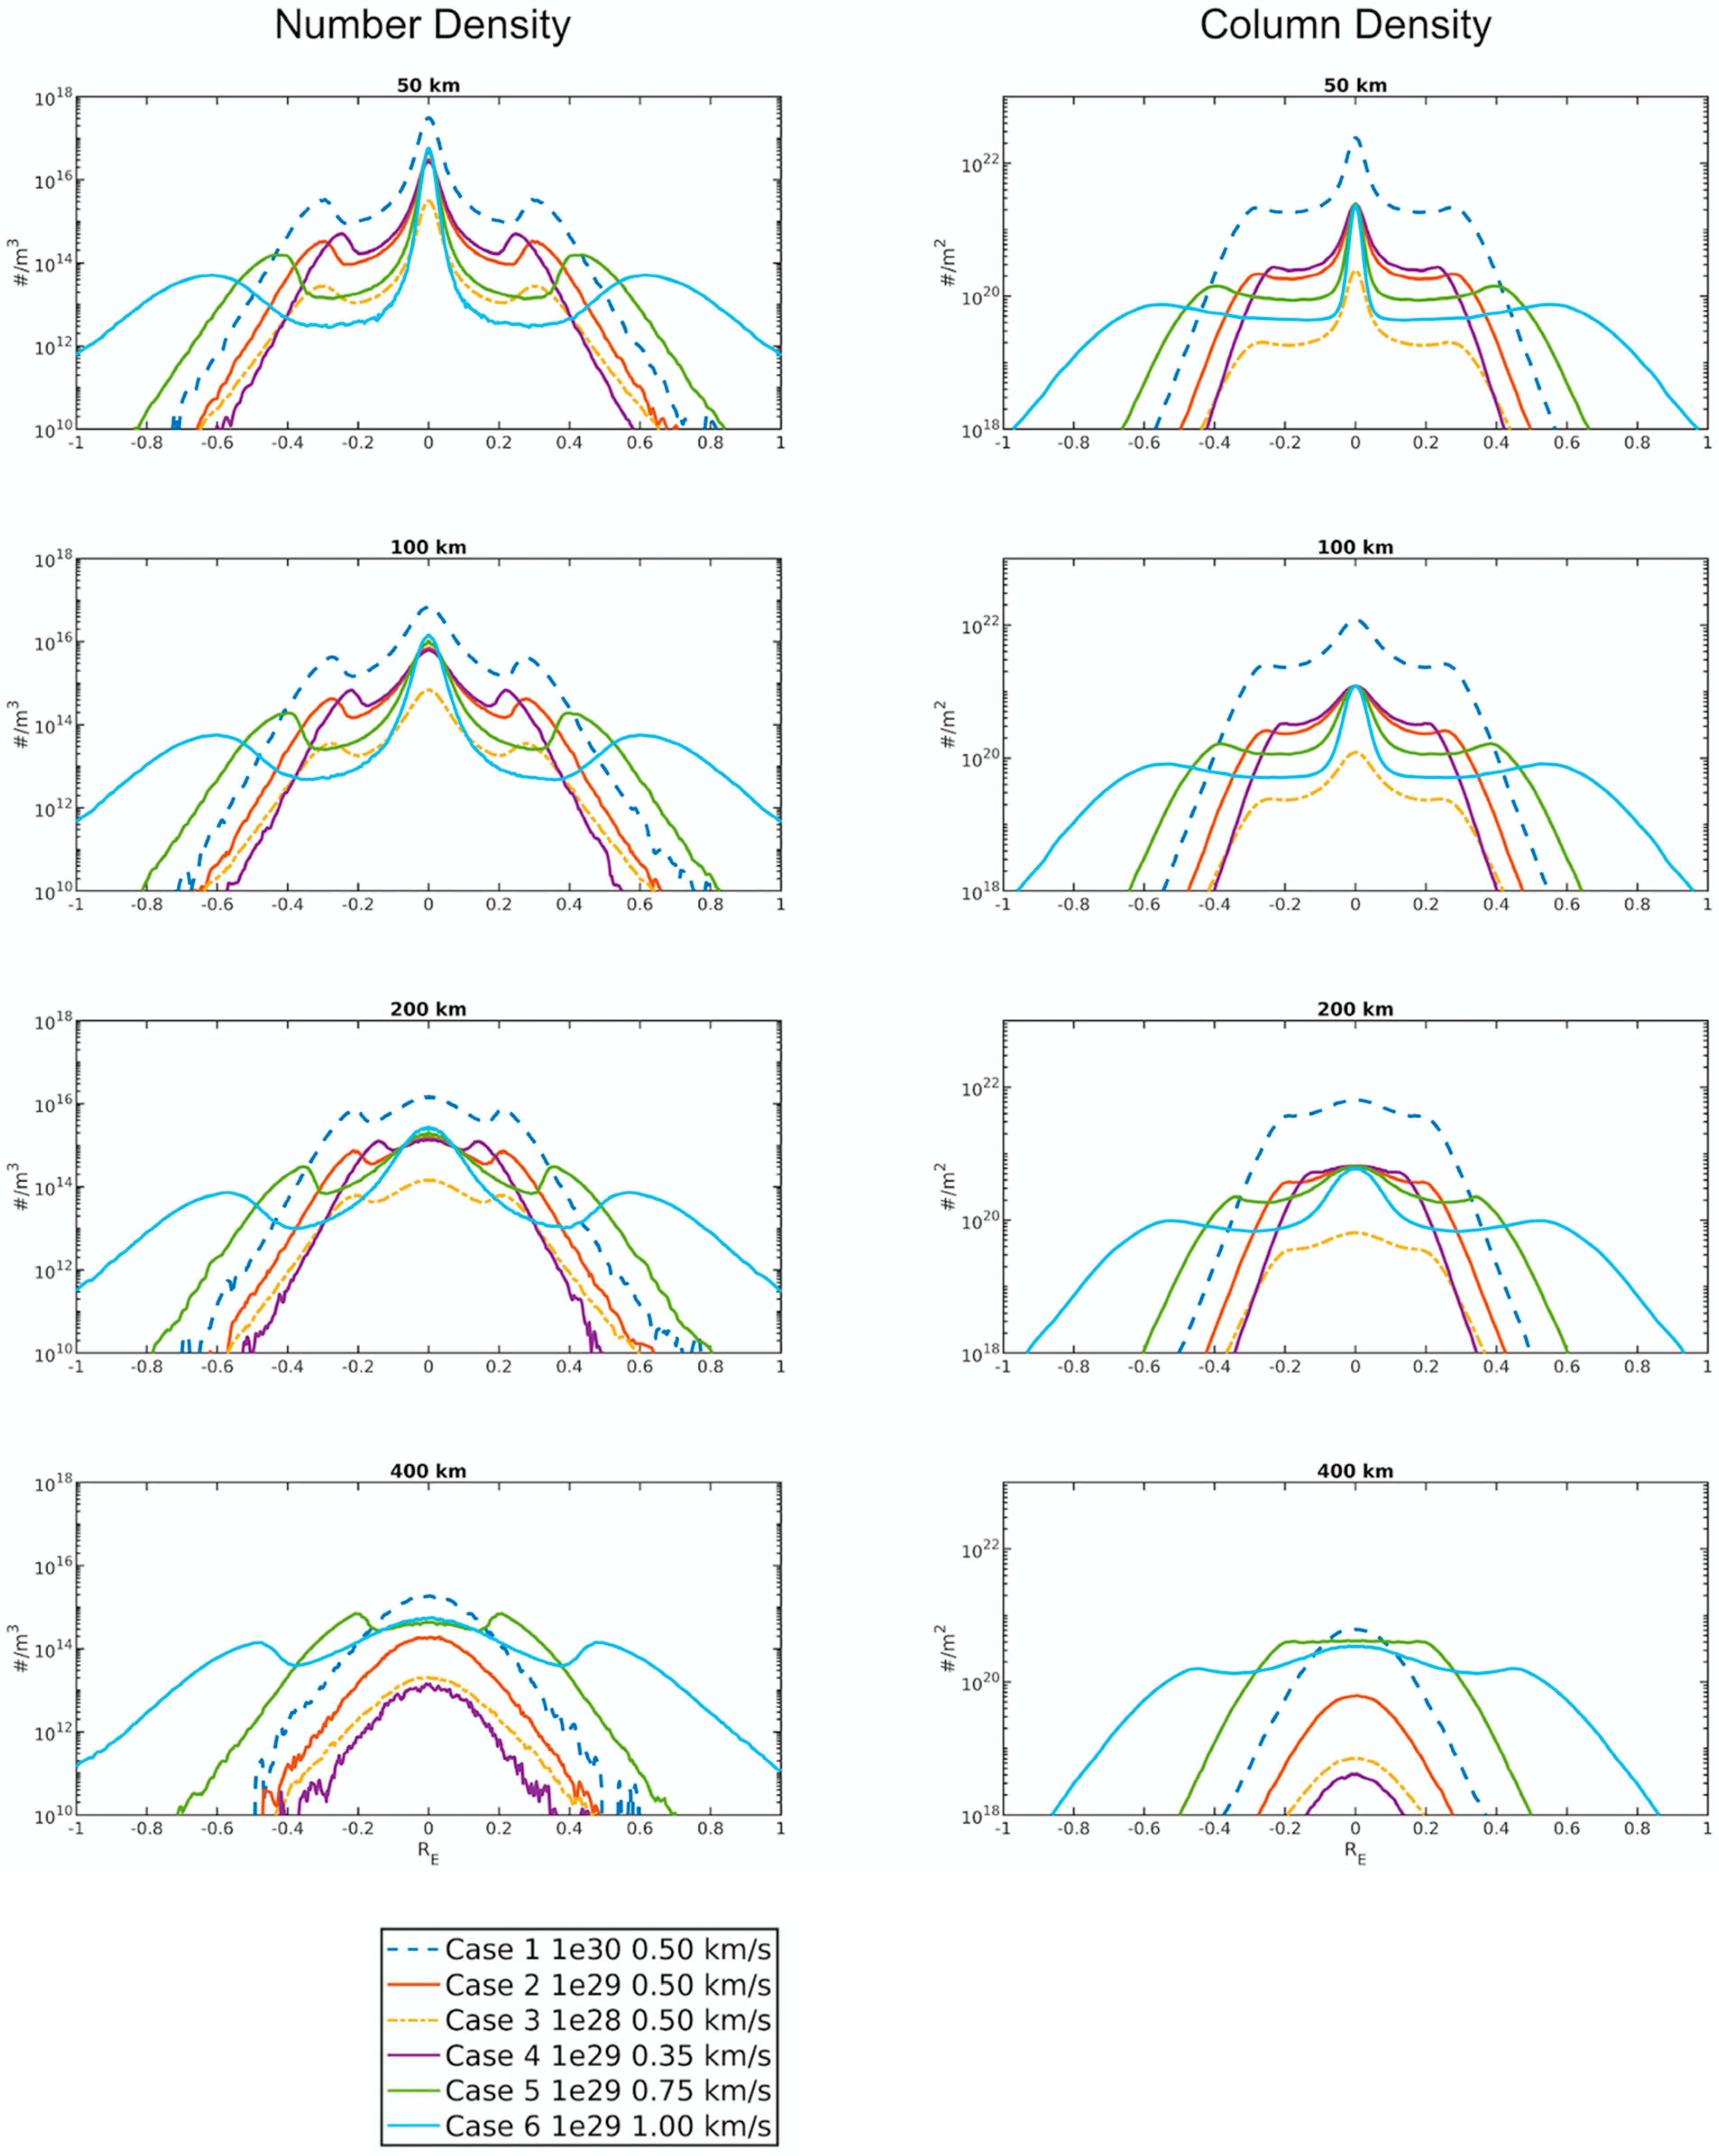
The gas velocity distribution of the plume is shown in Figure 2 (column b). Overall, the gas velocity decreased with increasing altitude because of Europa’s large gravity. However, when examining the velocity evolution below the altitude of ~100 km, it was found that the gas velocity appeared to be slightly larger than the initial gas bulk velocity (i.e., see the obvious depictions in cases 5 and 6; other cases do not clearly show this due to the color scale). This can be attributed to the acceleration due to the fact of gas collision and adiabatic cooling during expansion. The averaged gas flow velocity along the central line of plume can be accelerated to ~0.6, 0.65, 0.85 and 1.05 km s−1 from its initial gas bulk velocity of 0.35, 0.5, 0.75 and 1.0 km s−1, respectively. Because of this acceleration effect, therefore, the plume top from the DSMC modeling would be much higher than the one with purely ballistic motion (discussed in Section 4). The degrees of lateral expansion resulting from gas collisions of various gas production rates are also shown in cases 1–3 in Figure 2. Following the streamlines, the plume particle speed also increased when returning to the surface. The plume gas molecules mostly fall back to Europa’s surface, since the initial ejection velocity is lower than Europa’s escape velocity of ~2.0 km s−1. Figure 3 (Left) shows the plume profiles of number density as a function of distance at four altitudes of 50, 100, 200 and 400 km (i.e., a horizontal cut through the plume). It is clearly shown that the plume width (e.g., the FWHM (full width half maximum) of the 50 km profile) was mainly controlled by the Mach number, while the gas collision (determined by the gas production rate) played a minor role (please also see the summary in Table 1). The distinct density profiles presented in Figure 3 (Left) can be used to compare with future in situ neutral particle detection to examine the plume properties of Europa outgassing activities.
Both axes are arbitrary and presented in units of Europa radius. Poor statistics are shown above the major plume tops (i.e., red color). This is also shown in the lateral sides of the plume bottoms where too few particles were counted.
Both axes are arbitrary and presented in units of Europa radius.
The profiles are given in a mocked spacecraft trajectory flying across the plume horizontally (i.e., parallel to the x-axis in Figure 2a and Figure 4a) at different altitudes. The x-axis is presented in units of Europa radius.

3.3. Column Density

The simulated plume morphologies with the integrated column densities along two different viewing angles of 90° (i.e., perpendicular to the plume symmetric axis) and 45° are presented in Figure 4. Figure 4 (column a) (along a line of sight of 90°) shows that the height of the dense plume (i.e., red/pink color) was mainly determined by the initial gas ejection speed, and the plume heights were ~250, ~350, ~500 and ~800 km for 0.35, 0.5, 0.75 and 1.0 km s−1, respectively (see the summary in Table 1). As discussed above, the plume height appears to be much higher than the one computed with purely ballistic motion as a result of acceleration due to the gas collisions in the low-altitude region. For example, a ballistic particle with an initial ejection speed of 0.75 km s−1 could reach a maximum height of only ~210 km, less than half of the modeled height. On the other hand, when viewing from 45°, as shown in Figure 4 (column b), the plume extended down to the surface and covered a part of Europa’s disk. It is evident that the observed plume morphology strongly depended on the viewing geometry. This also shows that it is not an easy task, without any other supplementary information, to trace back a plume seen in one 2D projected image to its exact source region. The column density profiles (integrated along a line of sight of 90°), as a function of horizontal distance to the plume symmetric axis at four altitudes of 50, 100, 200 and 400 km, are shown in Figure 3 (Right) The maximum column densities at an altitude of 50 km simulated with the water production rates of 1028, 1029 and 1030 s−1 were in the order of 1020, 1021 and 1022 m−2, respectively.
The contour is shown in a color scale in units of # m−2. Both axes are arbitrary and presented in units of Europa radius.

4. Discussion

Although the observed plume parameters (such as source location, outgassing rate and gas ejection velocity) derived from the existing observations did not give a consistent picture, it could suggest a mixture of various outgassing mechanisms as discussed above. Compared with the HST atomic emission data [5] and the Galileo E12 measurements [12] obtained at an altitude of ~200 km, our simulation cases with a gas production rate of Q = 1.0 × 1029 s−1 (i.e., see cases 2, 4, 5 and 6 in Figure 3b) produced averaged column densities in the order of 1020 m−2, which is consistent with the derived column densities of the HST and Galileo observations when taking into account the spatial resolution limited by the observations (i.e., ~100 km [5]). In addition, the peaked column densities measured by [8] (~1.8 × 10²¹ m−2) and by [9] (~1.8 × 10¹⁹ m−2) are closer to the simulated cases with production rates of 1030 s−1 (case 1) and 1028 s−1 (case 3), respectively. The simulated plume tops of the initial gas bulk velocity of 0.35 and 0.5 km s−1 reached an altitude of ~250 and ~350 km, which are also in agreement with the HST and Galileo measurements [9,10,12]. These initial gas velocities were smaller than the ones derived by the HST observations in which the authors assumed a ballistic particle motion [5,8]. Moreover, the plume morphologies (i.e., the height and width) simulated from the DSMC modeling were much different from the purely ballistic motion due to the gas collisions that occurred in the low-altitude region. Moreover, it was difficult to interpret the observed 2D projection images, because the combined effect of the viewing angle and the gas velocity degenerated, meaning that the solution may not be unique if the plume source region is not known. The in situ measurements of the upcoming ESA JUICE and NASA Europa Clipper missions with finer spatial resolution are expected to reveal the exact source regions and the detailed plume structures such as the gas density, velocity and temperature distributions. These parameters are important tools to probe its subsurface vent properties and investigate its surface deposition effect as discussed below. Finally, the special case 7 (with an initial Vbulk = 0.35 km s−1 and Q = 1 × 1026 H2O s−1) was simulated for a possible stealth plume under the current detection limits; however, this kind of small-scale plume could be visible to the upcoming space missions. Figure 5 shows the distributions of number density, velocity and column density of this modeled stealth plume. Obviously, it lacked the most distinct features, such as the bow-shape in the upper layer and the bowtie region in the lateral sides, as seen in cases 1–6, with the relatively larger gas production rates due to the insufficient gas collisions. This can be attributed to the cap effect of the canopy shock layer on the plume structure as discussed in [31].
Both axes are arbitrary and presented in units of Europa radius.
The observed plume characteristics, such as the gas temperature, gas and dust velocity, dust-to-gas ratio and particulate size distribution, are, in fact, closely related to the subsurface vent conditions [19]. To account for the observed dust size and speed distribution of Enceladus’ plumes, [19] proposed that dust grains are produced from nucleation inside the subsurface vent with water vapor sourced from the interface of liquid water, and wall collisions in the channel determine the grain ejection velocity. In this way, the smaller dust (sub-micron sized) would have an initial velocity exiting from the vent closer to the plume gas velocity. In addition, the width and length of the subsurface channel can control the initial Mach number of the gas plumes and the critical grain size, and the measured gas flux and its dust-to-gas ratio can tell the gas temperature in the subsurface liquid water reservoir. Therefore, our DSMC model simulations, in contrast to the purely ballistic motion consideration, will serve as a useful tool to derive plume properties near surface and the subsurface vent condition.
The plume emplacements can alter surface characteristics such as albedo, color pattern, ice structure and crystallinity (e.g., [54,55,56,57,58,59]). For example, eruptive emplacements accompanied by cryovolcansim could explain the dark feature material around the linea, lenticulae and ridges [15,16,46]. Ref. [57] also found that irradiated NaCl existed in surface ice of Europa’s leading hemisphere, and its distribution correlated with the disrupted chaos region, consistent with an interior source from subsurface ocean. In addition, some bright areas in the leading hemisphere showing a narrow forward scattering behavior could be indicative of fresh frost deposit due to the plume activity [59]. Moreover, while some regions with relatively higher abundance of crystalline water ice on Europa’s surface could be attributed to a warmer formation environment, such as thermal convection in the ice shell, water outgassing emplacements could account for more amorphous ice found in the polar region [55,60]. Ref. [56] examined Europa surface images collected by the Voyager, Galileo and New Horizons missions, and found no obvious surface pattern change during ~30 years. One of the possibilities, though relatively slim, is that the plume activity and deposit process have reached a steady state. Our simulations show near semi-hemisphere depositions from the large-scale plumes (i.e., with the initial gas bulk velocity in the order of 1.0 km s−1) and, therefore, the persistence of large outgassing activities may also account for Europa’s young surface and hemispheric color dichotomy. In brief, the plume source region, plume dynamics and emplacements leading to the surface features are closely interlinked. Once information of one or another is brought to light by future observations, it can provide the constraints to the others. For example, knowing the exact source region coupled with the fresh deposit pattern can help constrain the gas emission velocity.

5. Conclusions

In this work, we developed a 3D DSMC model to examine the physical processes and structures of Europa’s hypothetic water plumes with a parametric study regarding the total gas production rate and initial gas bulk velocity. Plume eruption is assumed with expansion from a source region 20 km in radius, which is a reasonable approach to study the large-scale structure of outgassing plumes on Europa using DSMC, though the subsurface vent condition was not well taken care of in our model. The plume characteristics (i.e., the gas number density, gas velocity and temperature distribution) derived from our model can be coupled with the radiative transfer process for multiple-wavelength remote sensing to improve scientific interpretations of the observed spectra and images. The density profiles of the simulated plumes at different altitudes are also provided for comparisons with future measurements.
Our major findings are:
  • The gas kinetic temperature rapidly dropped to below 100 K during initial expansion in the low-altitude region (i.e., <100 km) due to the fact of adiabatic cooling;
  • Mostly, the central parts of the plumes with large production rates of 1029 s−1 and 1030 s−1 were in thermal equilibrium and near continuum conditions;
  • The gas acceleration near the surface (within an altitude of ~100 km) was a combined effect of gas collision and adiabatic cooling. At a higher altitude, the plume velocity distribution was governed by Europa’s large gravity. The plume simulated from the DSMC modeling (i.e., gas collision considered) was, therefore, generally much larger than the one computed from purely ballistic motion. For example, while the purely ballistic motion of the initial velocity of 0.75 km s−1 could arrive at a maximum altitude of only ~210 km, a similar altitude could be reached by the DSMC modeled plume with the initial velocity of 0.35 km s−1;
  • The projection effect could be significant; therefore, it would be not an easy task to trace back a plume to its exact source region on Europa’s surface from the observed 2D images/maps without further supporting information.
Our model inputs of a high gas production rate and large gas bulk velocity producing a large-scale plume, which may be detectable by space- and ground-based telescopes, will cause semi-global deposition of Europa. While the modeling of plume dust deposition was beyond the scope of this paper, it will be studied to investigate the possible surface changes accordingly. The DSMC modeling results will be served as the background gas collision for the dust trajectory integration with a set of dust size and speed distributions. Knowledge of the magnitude, occurrence frequency and source location of the outgassing activity through the follow-up monitoring programs will advance our understanding of Europa’s surface history shaped by plume deposition and erosion due to the fact of space weathering. Finally, the measurements of chemical composition of Europa’s plume material can shed light on its subsurface ocean environment if the outgassing activity can be confirmed to be originated from a subsurface ocean. The yields from the upcoming JUICE and Europa Clipper space missions are highly anticipated to explore this icy ocean word with high potential habitability.

Author Contributions

Conceptualization, W.-L.T., I.-L.L., W.-H.I. and H.-W.H.; Methodology, I.-L.L. and J.-S.W.; Software, I.-L.L. and J.-S.W.; Writing—original draft, W.-L.T.; Writing—review and editing, W.-L.T., I.-L.L., W.-H.I. and H.-W.H. All authors have read and agreed to the published version of the manuscript.

Funding

This work was partially supported by MOST 108-2112-M-003-002 (Physics) and MOST 110-2112-M-008-003. It was also partially funded by the Einstein Young Scholar Fellowship program (MOST 109-2636-M-003-001) and the MOE Yushan Young Scholar program.

Institutional Review Board Statement

Not applicable.

Data Availability Statement

Not applicable.

Conflicts of Interest

The authors declare no conflict of interest.

References

  1. Anderson, J.D.; Schubert, G.; Jacobson, R.A.; Lau, E.L.; Moore, W.B.; Sjogren, W.L. Europa’s Differentiated Internal Structure: Inferences from Four Galileo Encounters. Science 1998, 281, 2019–2022. [Google Scholar] [CrossRef]
  2. Carr, M.H.; Belton, M.J.; Chapman, C.R.; Davies, M.E.; Geissler, P.; Greenberg, R.; McEwen, A.S.; Tufts, B.R.; Greeley, R.; Sullian, R.; et al. Evidence for a subsurface ocean on Europa. Nature 1998, 391, 363. [Google Scholar] [CrossRef] [PubMed]
  3. Greenberg, R.; Geissler, P.; Hoppa, G.; Tufts, B.R. Tidal-tectonic processes and their implications for the character of Europa’s icy crust. Rev. Geophys. 2002, 40, 1004. [Google Scholar] [CrossRef]
  4. Kivelson, M.G.; Khurana, K.K.; Russell, C.T.; Volwerk, M.; Walker, R.J.; Zimmer, C. Galileo magnetometer measurements: A stronger case for a subsurface ocean at Europa. Science 2000, 289, 1340–1343. [Google Scholar] [CrossRef] [PubMed] [Green Version]
  5. Roth, L.J.; Saur, J.; Retherford, K.D.; Strobel, D.F.; Feldman, P.D.; McGrath, M.A.; Nimmo, F. Transient Water Vapor at Europa’s South Pole. Science 2014, 343, 171–174. [Google Scholar] [CrossRef] [PubMed]
  6. Giono, G.; Roth, L.; Ivchenko, N.; Saur, J.; Retherford, K.; Schlegel, S.; Ackland, M.; Strobel, D. An Analysis of the Statistics and Systematics of Limb Anomaly Detections in HST/STIS Transit Images of Europa. Astron. J. 2020, 159, 155. [Google Scholar] [CrossRef]
  7. Sparks, W.B.; Hand, K.P.; McGrath, M.A.; Bergeron, E.; Cracraft, M.; Deustua, S.E. Probing for Evidence of Plumes on Europa with HST/STIS. Astrophys. J. 2016, 829, 121. [Google Scholar] [CrossRef] [Green Version]
  8. Sparks, W.B.; Schmidt, B.E.; McGrath, M.; Hand, K.P.; Spencer, J.R.; Cracraft, M.; E Deustua, S. Active Cryovolcanism on Europa? Astrophys. J. Lett. 2017, 839, L18. [Google Scholar] [CrossRef]
  9. Paganini, L.; Villanueva, G.L.; Roth, L.; Mandell, A.M.; Hurford, T.A.; Retherford, K.D.; Mumma, M.J. A measurement of water vapour amid a largely quiescent environment on Europa. Nat. Astron. 2020, 4, 266–272. [Google Scholar] [CrossRef]
  10. Arnold, H.; Liuzzo, L.; Simon, S. Plasma Interaction Signatures of Plumes at Europa. J. Geophys. Res. Space Phys. 2019, 125, e2019JA027346. [Google Scholar] [CrossRef]
  11. Huybrighs, H.L.F.; Roussos, E.; Blöcker, A.; Krupp, N.; Futaana, Y.; Barabash, S.; Hadid, L.Z.; Holmberg, M.K.G.; Lomax, O.; Witasse, O. An active plume eruption on Europa during Galileo Flyby E26 as indicated by energetic proton depletions. Geophys. Res. Lett. 2020, 47, e2020GL087806. [Google Scholar] [CrossRef]
  12. Jia, X.; Kurth, W.; Kivelson, M.; Khurana, K.K.; Kurth, W.S. Evidence of a plume on Europa from Galileo magnetic and plasma wave signatures. Nat. Astron. 2018, 2, 459–464. [Google Scholar] [CrossRef]
  13. Roth, L.J.; Saur, J.; Retherford, K.D.; Strobel, D.F.; Feldman, P.D.; McGrath, M.A.; Spencer, J.R.; Blöcker, A.; Ivchenko, N. Europas far ultraviolet oxygen aurora from a comprehensive set of HST observations. J. Geophys. Res. Space Phys. 2016, 121, 2143–2170. [Google Scholar] [CrossRef] [Green Version]
  14. Sparks, W.B.; Richter, M.; deWitt, C.; Montiel, E.; Dello Russo, N.; Grunsfeld, J.M.; McGrath, M.A.; Weaver, H.; Hand, K.P.; Bergeron, E.; et al. A Search for Water Vapor Plumes on Europa using SOFIA. Astrophys. J. Lett. 2019, 871, L5. [Google Scholar] [CrossRef] [Green Version]
  15. Fagents, S.A.; Greeley, R.; Sullivan, R.J.; Pappalardo, R.T.; Prockter, L.M.; Galileo SSI Team. Cryomagmatic mechanisms for the formation of Rhadamanthys Linea, triple band margins, and other low albedo features on Europa. Icarus 2000, 144, 54–88. [Google Scholar] [CrossRef]
  16. Quick, L.C.; Barnouin, O.S.; Prockter, L.M.; Patterson, G.W. Constraints on the detection of cryovolcanic plumes on Europa. Planet. Space Sci. 2013, 86, 1–9. [Google Scholar] [CrossRef]
  17. Quick, L.; Hedman, M. Characterizing deposits emplaced by cryovolcanic plumes on Europa. Icarus 2020, 343, 113667. [Google Scholar] [CrossRef] [Green Version]
  18. Southworth, B.S.; Kempf, S.; Schmidt, J. Modeling Europa’s dust plumes. Geophys. Res. Lett. 2015, 42, 10541–10548. [Google Scholar] [CrossRef] [Green Version]
  19. Schmidt, J.; Brilliantov, N.; Spahn, F.; Kempf, S. Slow dust in Enceladus’ plume from condensation and wall collisions in Tiger Stripe fractures. Nature 2008, 451, 685–688. [Google Scholar] [CrossRef]
  20. Teolis, B.D.; Wyrick, D.Y.; Bouquet, A.; Magee, B.A.; Waite, J.H. Plume and surface feature structure and compositional effects on Europa’s global exosphere: Preliminary Europa mission predictions. Icarus 2017, 284, 18–29. [Google Scholar] [CrossRef] [Green Version]
  21. Vorburger, A.; Wurz, P. Modeling of possible plume mechanisms on Europa. J. Geophys. Res. Space Phys. 2021, 126, e2021JA029690. [Google Scholar] [CrossRef]
  22. Roth, L.; Retherford, K.D.; Saur, J.; Strobel, D.F.; Feldman, P.D.; McGrath, A.M.; Nimmo, F. Orbital apocenter is not a sufficient condition for HST/STIS detection of Europa’s water vapor aurora. Proc. Natl. Acad. Sci. USA 2014, 111, E5123–E5132. [Google Scholar] [CrossRef] [PubMed] [Green Version]
  23. Bird, G.A. Molecular Gas Dynamics and the Direction Simulation of Gas Flows; Clarendon Press: Oxford, UK, 1994. [Google Scholar]
  24. Goldstein, D.B.; Hedman, M.; Manga, M.; Perry, M.; Spitale, J.; Teolis, B. Enceladus plume dynamics: From surface to space. In Enceladus and the Icy Moons of Saturn; Schenk, P.M., Clark, R.N., Howett, C.J.A., Verbiscer, A.J., Waite, J.H., Eds.; University of Arizona: Tucson, AZ, USA, 2018; pp. 175–194. [Google Scholar]
  25. Lai, I.-L.; Su, C.-C.; Ip, W.-H.; Wei, C.-E.; Wu, J.-S.; Lo, M.-C.; Liao, Y.; Thomas, N. Transport and Distribution of Hydroxyl Radicals and Oxygen Atoms from H2O Photodissociation in the Inner Coma of–Comet 67P/Churyumov-Gerasimenko. Earth Moon Planets 2016, 117, 23–39. [Google Scholar] [CrossRef]
  26. Lai, I.-L.; Rubin, M.; Wu, J.-S.; Ip, W.-H. DSMC Simulation of Europa’s Gas Plume. EPSC 2019, 13, EPSC-DPS2019-575-1. [Google Scholar]
  27. Tenishev, V.; Combi, M.R.; Rubin, M. Numerical simulation of dust in a cometary coma: Application to comet 67p/churyumov-gerasimenko. Astrophys. J. 2011, 732, 2. [Google Scholar] [CrossRef]
  28. Yeoh, S.K.; Li, Z.; Goldstein, D.B.; Varghese, P.L.; Levin, D.A.; Trafton, L.M. Constraining the Enceladus plume using numerical simulation and Cassini data. Icarus 2017, 281, 357–378. [Google Scholar] [CrossRef]
  29. Zakharov, V.V.; Rodionovc, A.V.; Lukianov, G.A.; Crifo, J.F. Monte-Carlo and multifluid modelling of the circumnuclear dust coma II. Aspherical-homogeneous, and spherical-inhomogeneous nuclei. Icarus 2009, 201, 358–380. [Google Scholar] [CrossRef] [Green Version]
  30. Zhang, J.; Goldstein, D.B.; Varghese, P.L.; Trafton, L.; Moore, C.; Miki, K. Numerical modeling of ionian volcanic plumes with entrained particulates. Icarus 2004, 172, 479–502. [Google Scholar] [CrossRef]
  31. Berg, J.J.; Goldstein, D.B.; Vargheseet, P.L.; Traftion, L.M. DSMC simulation of Europa water vapor plumes. Icarus 2016, 277, 370–380. [Google Scholar] [CrossRef]
  32. Grasset, O.; Dougherty, M.K.; Coustenis, A.; Bunce, E.J.; Erd, C.; Titov, D.; Bunce, E.J.; Erd, C.; Titov, D.; Blanc, M.; et al. JUpiter ICy moons Explorer (JUICE): An ESA mission to orbit Ganymede and to characterise the Jupiter system. Planet. Space Sci. 2013, 78, 1–21. [Google Scholar] [CrossRef]
  33. Phillips, C.B.; Pappalardo, R.T. Europa clipper mission concept: Exploring Jupiter’s ocean moon. Eos Trans. Am. Geophys. Union 2014, 95, 165–167. [Google Scholar] [CrossRef]
  34. Cercignani, C. The Boltzmann Equation and Its Application; Springer: New York, NY, USA, 1998. [Google Scholar]
  35. Cave, H.M.; Tseng, K.-C.; Wu, J.-S.; Jermy, M.C.; Huang, J.-C.; Krumdieck, S.P. Implementation of unsteady sampling procedures for the parallel direct simulation Monte Carlo method. J. Comput. Phys. 2008, 227, 6249. [Google Scholar] [CrossRef]
  36. Ashkenazy, Y. The surface temperature of Europa. Helion 2019, 5, e01908. [Google Scholar] [CrossRef] [PubMed] [Green Version]
  37. Lo, M.-C.; Su, C.-C.; Wu, J.-S.; Tseng, K.C. Modelling Rarefied Hypersonic Reactive Flows Using the Direct Simulation Monte Carlo Method. Comput. Phys. Commun. 2015, 18, 1095. [Google Scholar] [CrossRef] [Green Version]
  38. Su, C.-C.; Tseng, K.-C.; Cave, H.M.; Wu, J.-S.; Lian, Y.-Y.; Kuo, T.-C.; Jermy, M.C. Implementation of a Transient Adaptive Sub-Cell Module for the Parallel DSMC Code Using Unstructured Grids. Comput. Fluids 2010, 39, 1136–1145. [Google Scholar] [CrossRef]
  39. Wu, J.-S.; Tseng, K.-C.; Wu, F.-Y. Parallel three-dimensional DSMC method using mesh refinement and variable time-step scheme. Comput. Phys. Commun. 2004, 162, 166–187. [Google Scholar] [CrossRef]
  40. Finklenburg, S.; Thomas, N.; Su, C.-C.; Wu, J.-S. The spatial distribution of water in the inner coma of Comet 9P/Tempel 1: Comparison between models and observations. Icarus 2014, 236, 9–23. [Google Scholar] [CrossRef]
  41. Lai, I.-L.; Ip, W.-H.; Su, C.-C.; Wu, J.-S.; Lee, J.-C.; Lin, Z.-Y.; Liao, Y.; Thomas, N.; Sierks, H.; Barbieri, C.; et al. Gas outflow and dust transport of comet 67P/Churyumov-Gerasimenko. MNRAS 2016, 462, S533–S546. [Google Scholar] [CrossRef] [Green Version]
  42. Liao, Y.; Marschall, R.; Su, C.-C.; Wu, J.-S.; Lai, I.-L.; Pinzon, O.; Thomas, N. Water vapor deposition from the inner gas coma onto the nucleus of Comet 67P/Churyumov-Gerasimenko. Planet. Space Sci. 2018, 157, 1–9. [Google Scholar] [CrossRef] [Green Version]
  43. Marschall, R.; Su, C.-C.; Liao, Y.; Thomas, N.; Altwegg, K.; Sierks, H.; Ip, W.-H.; Keller, H.U.; Knollenberg, J.; Kührt, E. Modelling observations of the inner gas and dust coma of comet 67P/Churyumov-Gerasimenko usingROSINA/COPS and OSIRIS data: First results. Astron. Astrophys. 2016, 589, A90. [Google Scholar] [CrossRef]
  44. Yeoh, S.K.; Chapman, T.A.; Goldstein, D.B.; Varghese, P.L.; Trafton, L.M. On understanding the physics of the Enceladus south polar plume via numerical simulation. Icarus 2015, 253, 205–222. [Google Scholar] [CrossRef]
  45. Lucchetti, A.; Plainaki, C.; Cremonese, G.; Milillo, A.; Cassidy, T.; Jia, X.; Shematovich, V. Loss rates of Europa’s tenuous atmosphere. Planet. Space Sci. 2016, 130, 14. [Google Scholar] [CrossRef]
  46. Fagents, S.A. Considerations for effusive cryovolcanism on Europa: The post-Galileo perspective. J. Geophys. Res. 2003, 108, 5139. [Google Scholar] [CrossRef]
  47. Porco, C.; Helfenstein, P.; Thomas, P.C. How the geysers, tidal stresses, and thermal emission across the south polarterrain of Enceladus are related. Astron. J. 2014, 148, 45. [Google Scholar] [CrossRef] [Green Version]
  48. Spitale, J.N.; Porco, C.C. Association of the jets of Enceladus with the warmest regions on its south-polar fractures. Nature 2007, 449, 695–697. [Google Scholar] [CrossRef] [PubMed]
  49. Spencer, J.R.; Pearl, J.C.; Segura, M.; Mamoutkine, A.; Romani, P.; Buratti, B.J.; Hendrix, A.R.; Spilker, L.J.; Lopes, R.M.C. Cassini encounters Enceladus: Background and the discovery of a south polar hot spot. Science 2006, 311, 1401–1405. [Google Scholar] [CrossRef] [PubMed] [Green Version]
  50. Dong, Y.; Hill, T.W.; Teolis, B.D.; Magee, B.A.; Waite, J.H. The water vapor plumes of Enceladus. J. Geophys. Res. 2011, 116, A10204. [Google Scholar] [CrossRef] [Green Version]
  51. Hansen, C.J.; Esposito, L.W.; Stewart, A.I.F.; Meinke, B.; Wallis, B.; Colwell, J.E.; Hendrix, A.R.; Larsen, K.; Pryor, W.; Tian, F. Water vapour jets inside the plume of gas leaving Enceladus. Nature 2008, 456, 477–479. [Google Scholar] [CrossRef] [PubMed]
  52. Hansen, C.J.; Esposito, L.W.; Hendrix, A.R.; Stewart, A.I.F.; Lewis, B.R.; Colwell, J.E.; Hendrix, A.R.; West, R.A.; Waite, J.H.; Teolis, B.; et al. The composition and structure of the Enceladus plume. Geophys. Res. Lett. 2011, 38, L11202. [Google Scholar] [CrossRef] [Green Version]
  53. Hansen, C.J.; Esposito, L.W.; Hendrix, A.R. Ultraviolet observation of Enceladus’ plume in transit across Saturn, compared to Europa. Icarus 2019, 330, 256–260. [Google Scholar] [CrossRef]
  54. Hand, K.P.; Carlson, R.W. Europa’s surface color suggests an ocean rich with sodium chloride. Geophys. Res. Lett. 2015, 42, 3174. [Google Scholar] [CrossRef]
  55. Ligier, N.; Poulet, F.; Carter, J.; Brunetto, R.; Gourgeot, F. Vlt/sinfoni observations of europa: New insights into the surface composition. Astron. J. 2016, 151, 16. [Google Scholar] [CrossRef] [Green Version]
  56. Schenk, P.M. The Search for Europa’s Plumes: No Surface Patterns or Changes 1979–2007? Astrophys. J. Lett. 2020, 892, 7. [Google Scholar] [CrossRef]
  57. Trumbo, S.K.; Brown, M.E.; Hand, K.P. H2O2 within Chaos Terrain on Europa’s Leading Hemisphere. Astron. J. 2019, 158, 127. [Google Scholar] [CrossRef] [Green Version]
  58. Berdis, J.R.; Gudipati, M.S.; Murphy, J.R.; Chanover, N.J. Europa’s surface water ice crystallinity: Discrepancy between observations and thermophysical and particle flux modeling. Icarus 2020, 341, 113660. [Google Scholar] [CrossRef] [Green Version]
  59. Belgacem, I.; Schmidt, F.; Jonniaux, G. Regional study of Europa’s photometry. Icarus 2020, 338, 113525. [Google Scholar] [CrossRef]
  60. Hansen, G.B.; McCord, T.B. Amorphous and crystalline ice on the Galilean satellites: A balance between thermal and radiolytic processes. J. Geophys. Res. 2004, 109, E01012. [Google Scholar] [CrossRef]
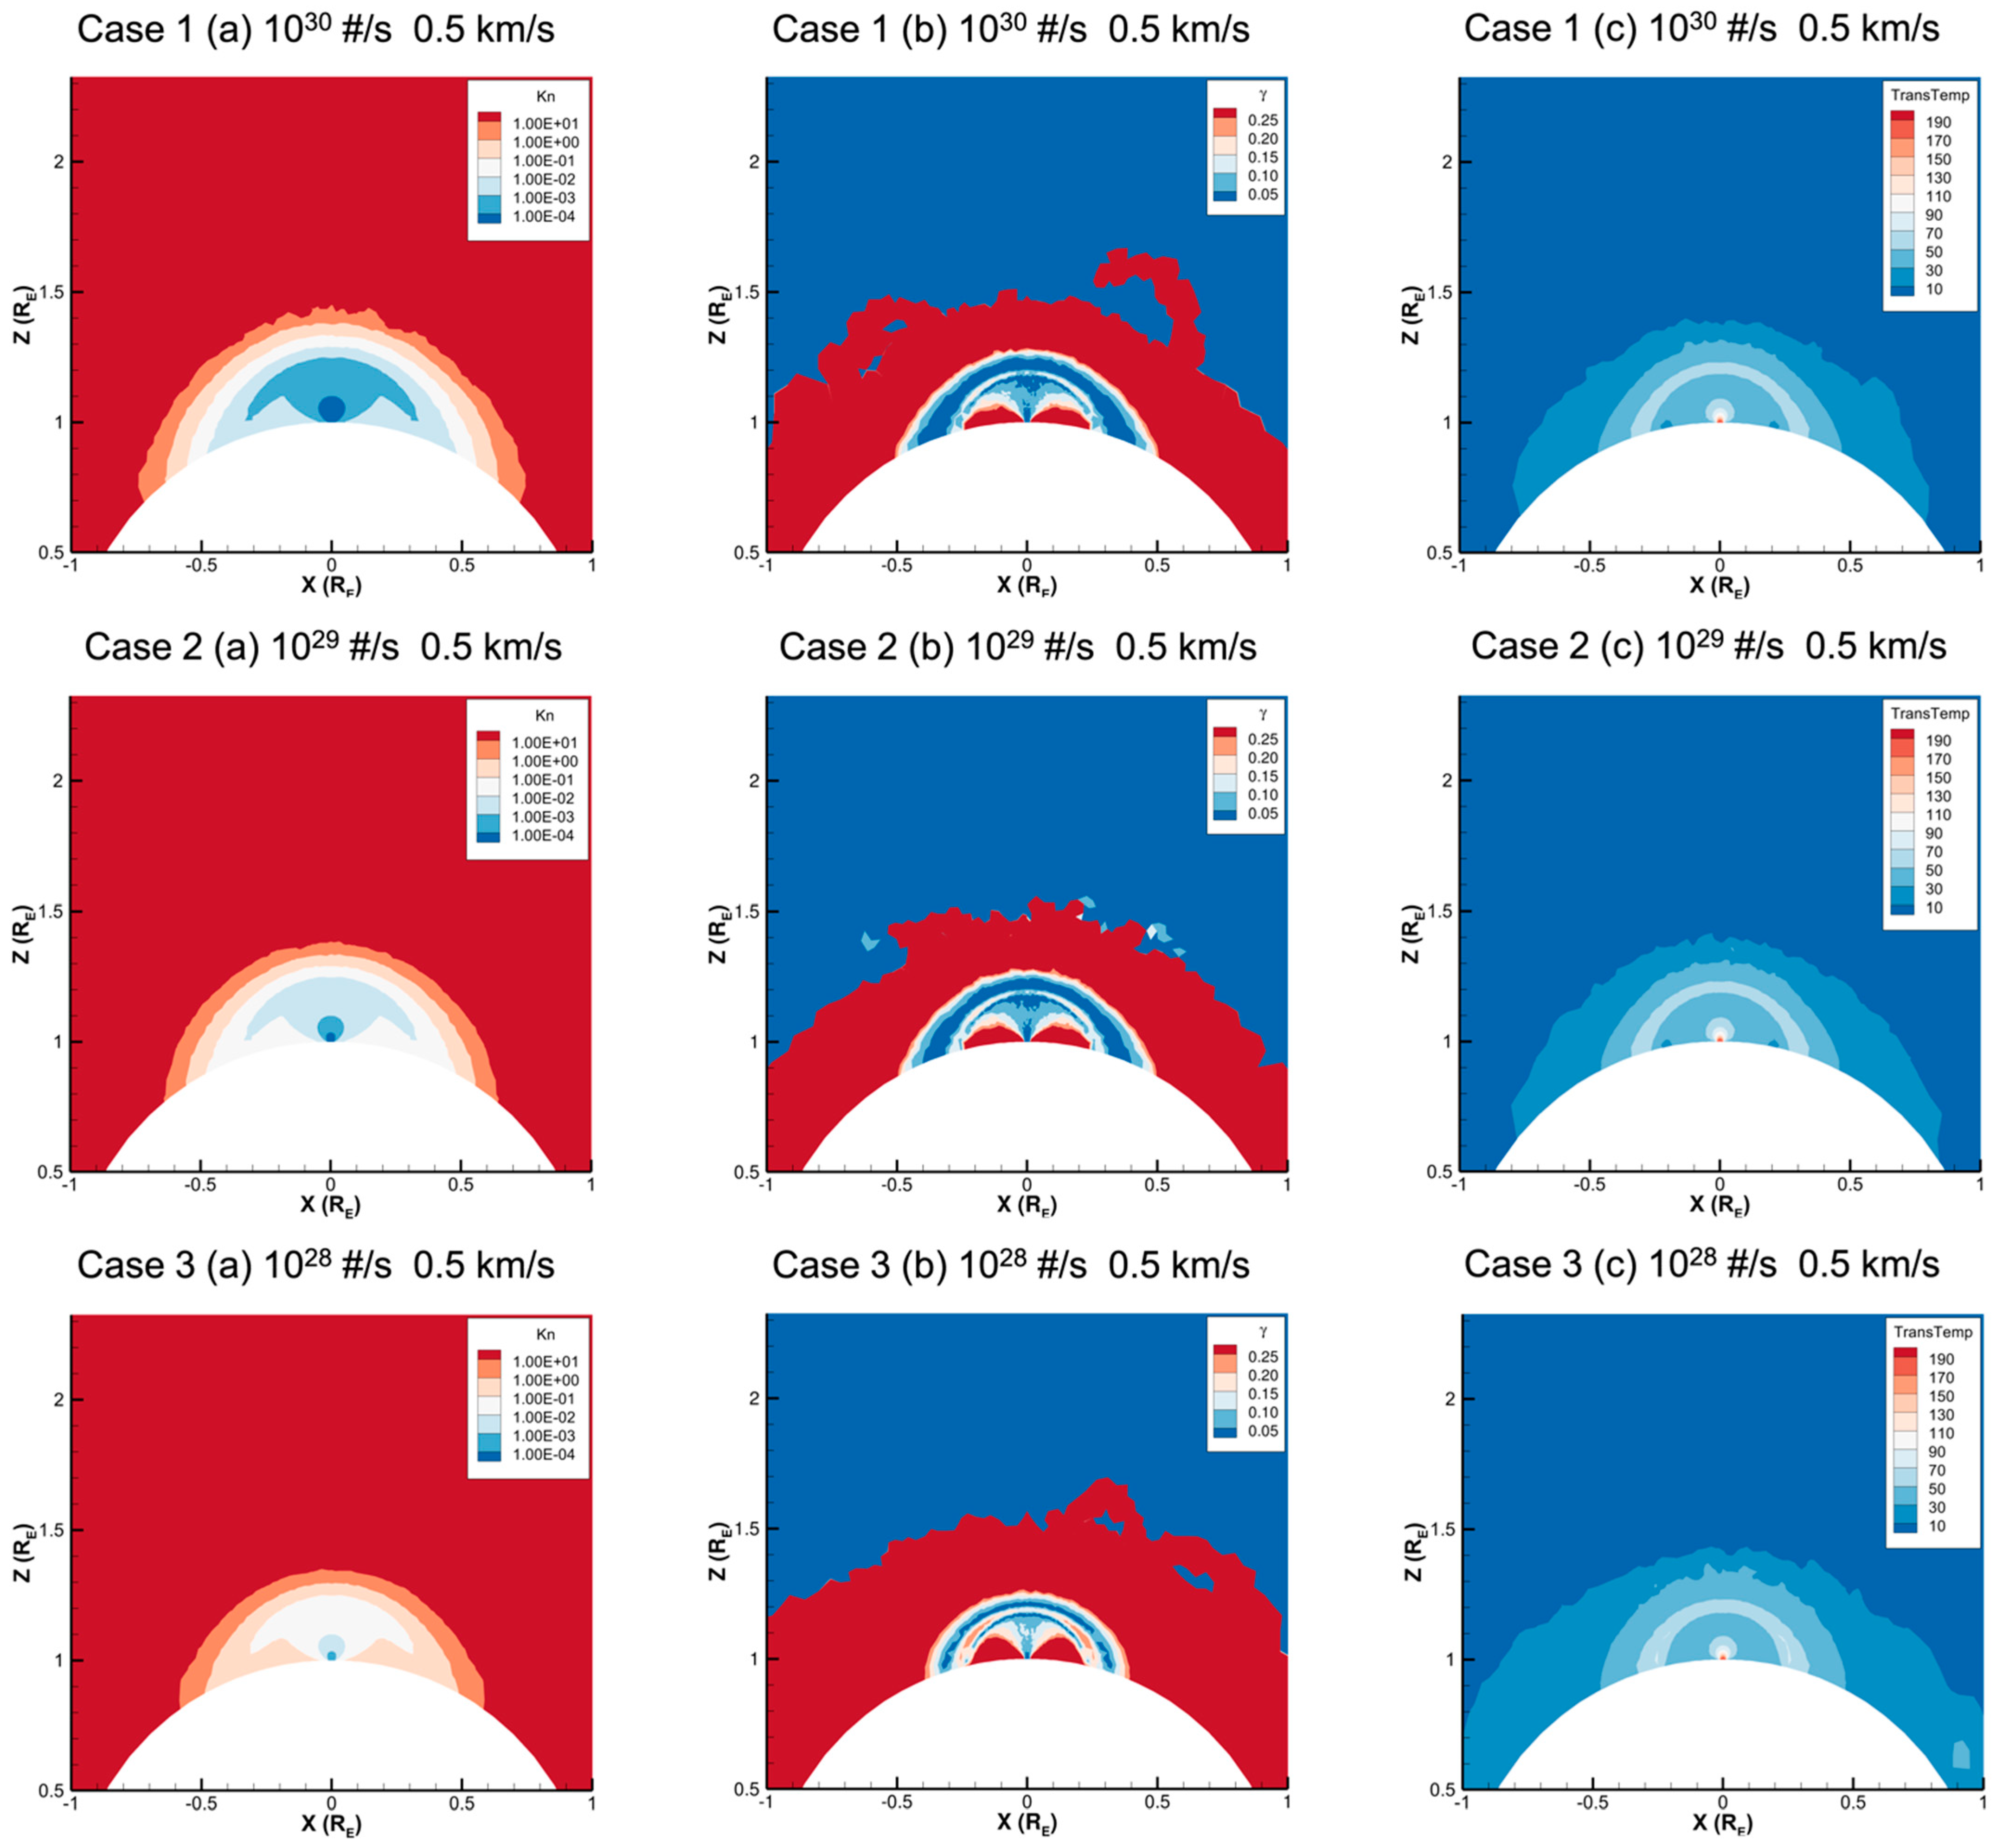
Figure 1. Column a (Left): Results of the local Knudsen number, Kn (shown in contours with a color scale). When Kn > ~0.01, the gas flow started to deviate from continuum. Column b (Middle): Degree of thermal equilibrium represented by γ (shown in contours with a color scale of γ). γ is defined to be “the absolute value of (Ttrans/Trot) minus 1”. A γ closer to 0 indicates that the gas flow is. approaching thermal equilibrium. Column c (Right): Gas translational temperature distribution (shown in contours with a color scale in units of K).
Universe 08 00261 g001aUniverse 08 00261 g001b
Figure 2. Column a (Left): Number density distribution (shown in contours with a color scale in units of # m−3). The dashed, horizontal lines in case 1 represent four heights above the surface at 50, 100, 200 and 400 km. Column b (Right): Gas velocity distribution (shown in contour with a color scale in units of m s−1). Gas flow streamlines are presented too.
Universe 08 00261 g002aUniverse 08 00261 g002b
Figure 3. Left: The plume profiles of number density (#/m3) as a function of horizontal distance at four altitudes of 50, 100, 200 and 400 km. Right: The plume profiles of column density (integrated along a line of sight of 90 degrees) as a function of horizontal distance at four altitudes of 50, 100, 200 and 400 km.
Universe 08 00261 g003
Figure 4. Column a (Left): Column density integrated along a line of sight of 90 degrees from Europa’s pole (i.e., perpendicular to the paper). The dashed, horizontal lines in case 1 represent four heights above the surface at 50, 100, 200 and 400 km. Column b (Right): Column density integrated along a line of sight of 45 degrees from Europa’s pole (i.e., toward the reader).
Universe 08 00261 g004aUniverse 08 00261 g004b
Figure 5. (a) Number density distribution (shown in contours with a color scale in units of # m−3). (b) Gas velocity distribution (shown in contour with a color scale in units of m s−1). Gas flow streamlines are presented too. (c) Column density integrated along a line of sight of 90 degrees from Europa’s pole (i.e., perpendicular to the paper). The contour is shown with a color scale in units of # m−2.
Universe 08 00261 g005
Table 1. The initial conditions in the case studies with a circular source area of a radius of 20 km. * A special case 7 simulated a possible stealth plume with a circular source area with a diameter of 10 km.
Case 1Case 2Case 3Case 4Case 5Case 6Case 7 *
Gas Production Rate (H2O s−1)1 × 10301 × 10291 × 10281 × 10291 × 10291 × 10291 × 1026
Gas Bulk
Velocity
(km s−1)
0.50.50.50.350.751.00.35
Gas Temperature (K)180180180180180180180
Mach Number1.11.11.10.81.62.20.8
Simulated Plume Height (km)~350~350~350~250~500~800- **
Simulated Plume Width (km) ***~80~80~80~90~50~50- **
* A special case 7 simulated a possible stealth plume with a circular source area with a radius of 5 km. ** Hard to define; no obvious canopy layer shown in the plume top due to the very small gas production rate. *** Here, we used the full width half maximum of the 50 km profile shown in the section of Results.
Publisher’s Note: MDPI stays neutral with regard to jurisdictional claims in published maps and institutional affiliations.