Abstract
Monitoring the Earth’s ionosphere is an important, fundamental and applied problem. Global Navigation Satellite Systems (GNSS) provide a way of measuring the ionospheric total electron content (TEC), but real-time single-station absolute TEC measurements are still a problem. This study describes a single-station system to measure the absolute TEC, based on the GNSS–MITIGATOR (MonITorInG the Absolute TOtal electRon content) system. The latter enables real-time measurements for the absolute TEC and its derivatives in time and in space to be obtained. The system is implemented by using JAVAD receivers. The convergence time and the run-mode retention time is ~8 h. We provide potential methods for using the system to estimate the critical frequency of the ionosphere, foF2, at oblique paths in the Siberian region. The developed tool could be useful for supporting real-time multi-instrumental ionosphere monitoring or for compensating for the ionospheric errors of radio equipment.
1. Introduction
Global Navigational Satellite Systems (GNSS) [1] have enabled scientists to obtain regular ionospheric observations on a global scale [2,3,4]. Creating systems for remote sensing of the ionosphere represents an important applied problem. Leaving aside the suites to monitor ionospheric irregularities and scintillations of navigation signals, one may say that there is sufficiently little information in the literature concerning monitoring absolute ionospheric parameters from GNSS data.
As a rule, the systems operating in real time are based on multi-station processing in regions with a dense receiver network. For example, Li et al. [5] presented a system developed at the Chinese Academy of Sciences for real-time monitoring of the TEC driven by the global GNSS receivers network. Titov et al. [6] developed a monitoring system using the network of stations and the assimilation model, where the authors used a spherical harmonics expansion as the initial assumption for TEC distribution for the sake of their calibration [7].
Pathy et al. [8] produced a spherical, harmonics-based approach and system to calculate the absolute TEC distribution and ionospheric disturbances derived from TEC by using a program code from [9]. Mendoza et al. [10] described a system for ionospheric monitoring over South America. One should note that the above papers do not involve information patterns (or source codes) and detailed documentation of the systems. This does not allow for the reproduction of the developed solutions. Magsi et al. [11] described a system based on one receiver, but the data do not involve the absolute TEC, only its relative variations. Zhang et al. [12] investigated different strategies for using single-station TEC data (over a network) to update IRI model.
To support distant scientific clusters (such as [13,14]), scientists and engineers often need single-station systems. Among the existing single-station systems, we should note a suite developed at the Institute of Radio Electronics of the Russian Academy of Sciences. The system estimates the height distribution for the electron concentration from the GNSS data, an operation based on the radio translucence method [15]. The papers describing the suite enable the results to be reproduced. A similar system may also be successfully used for ionospheric sounding over marine water areas [16].
This paper concerns the developed system for distantly monitoring the ionospheric absolute TEC.
2. SibNet—Siberian Network of GNSS Receivers
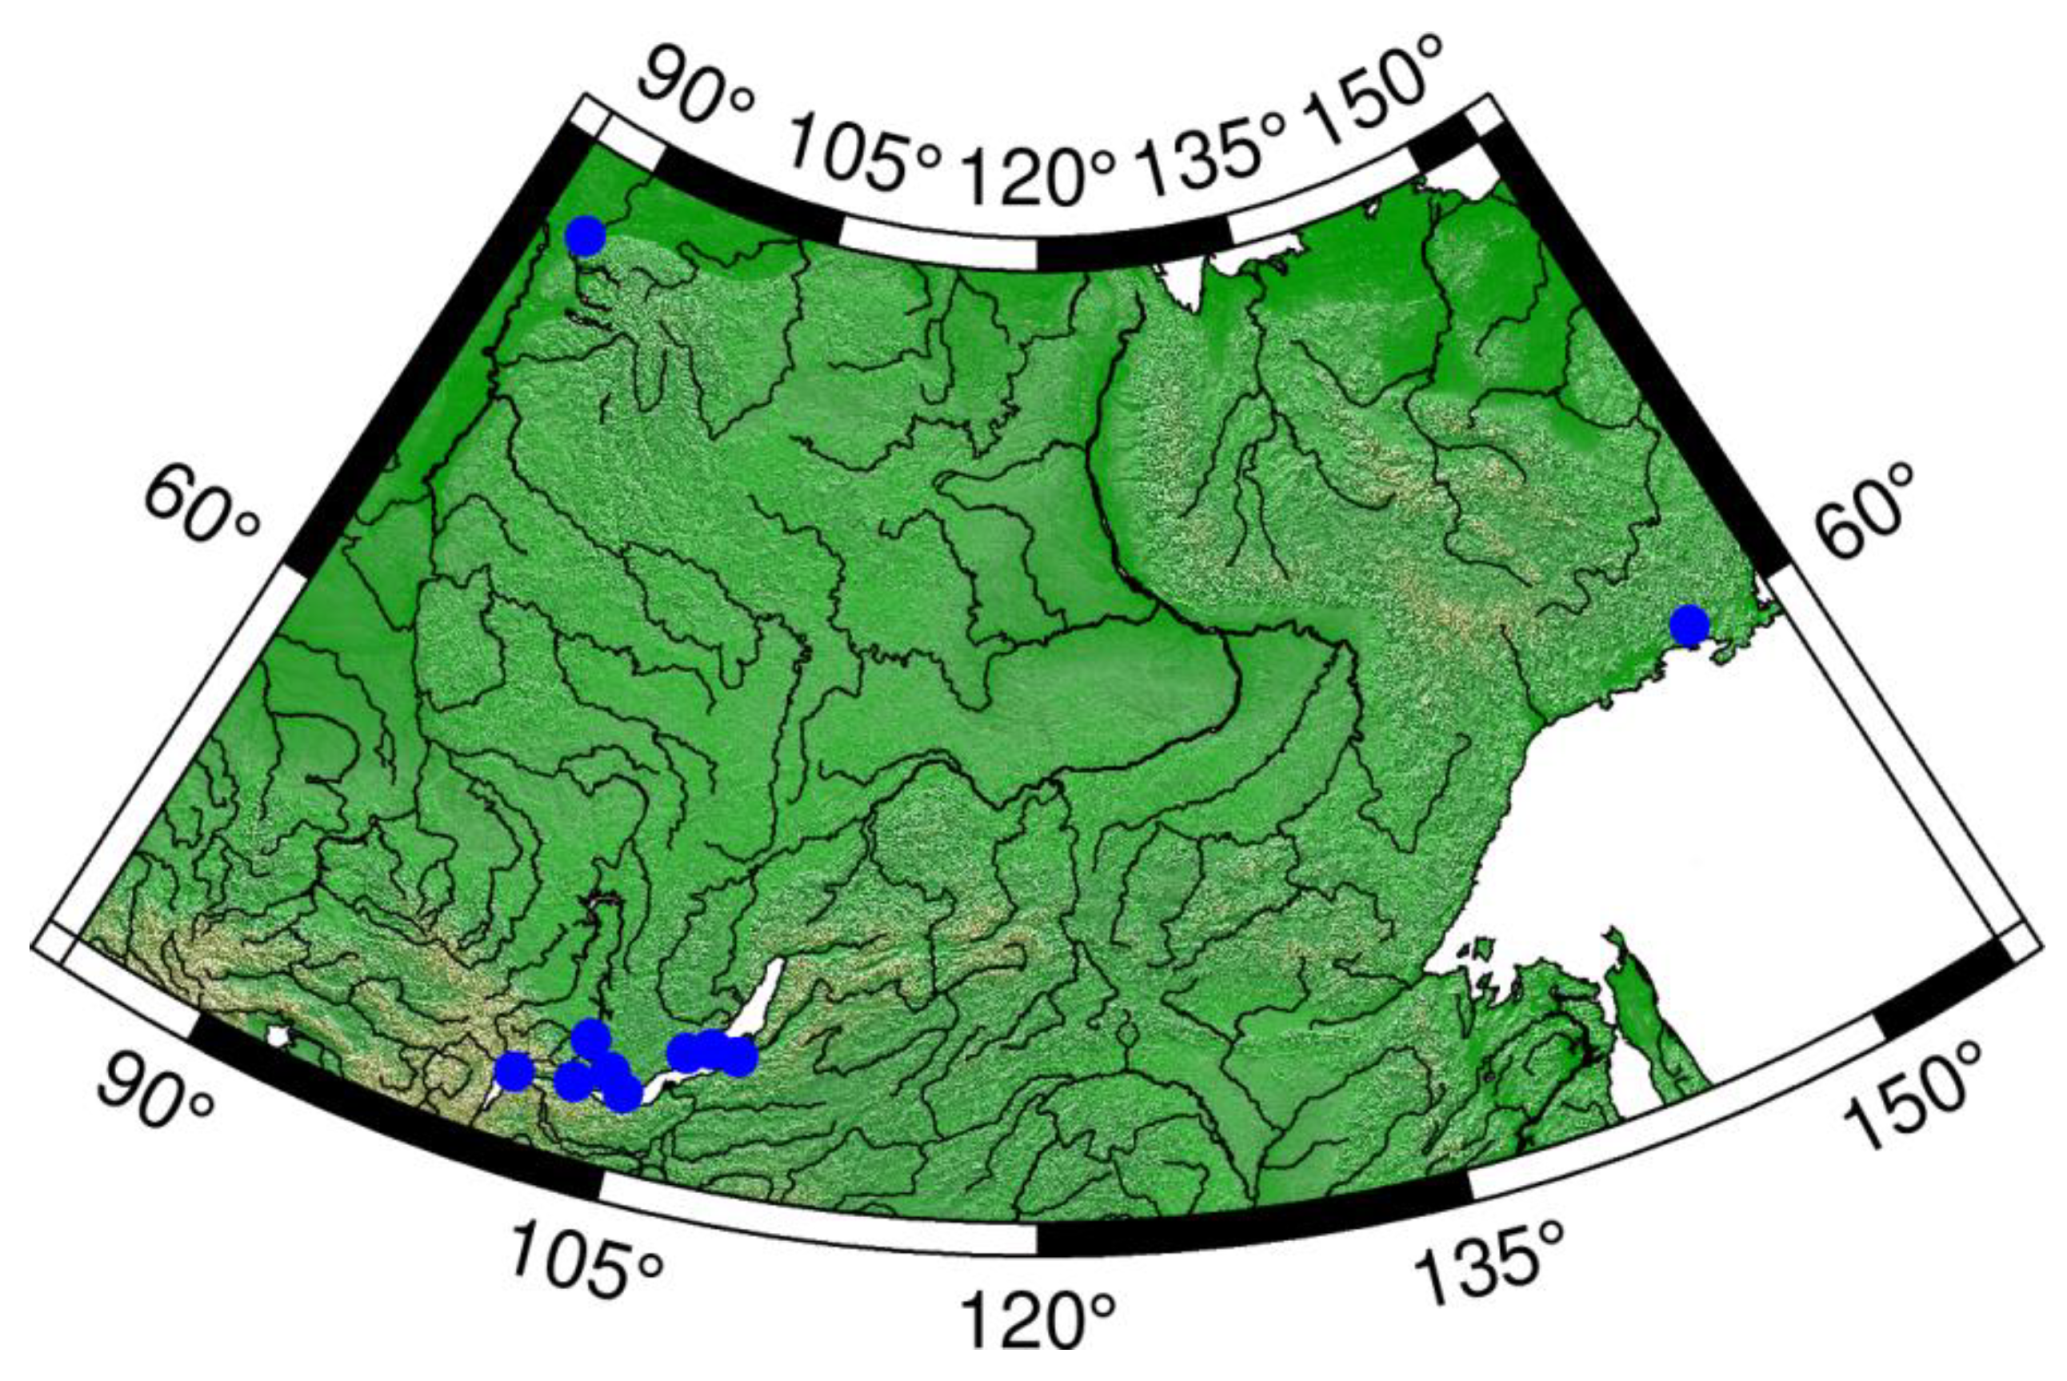
Between 2015 and 2020, a team of researchers at the Institute of Solar-Terrestrial Physics of the Siberian Branch of the Russian Academy of Sciences (ISTP SB RAS) worked to provide functionality and an update to the Siberian network of receivers, or SibNet [17]. Figure 1 presents the map for GNSS receivers of the ISTP SB RAS SibNet. The bulk of the points are located in the Near-Baikal region, one point in the Norilsk region, one point in the Magadan region.
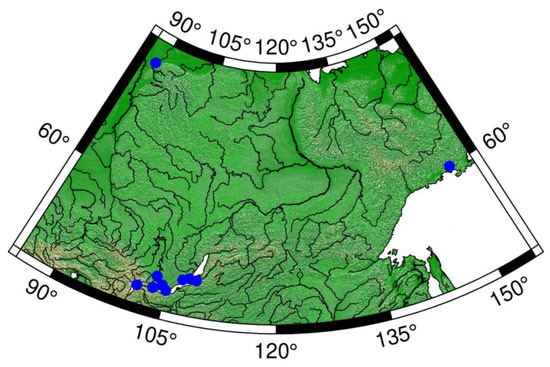
Figure 1.
GNSS receivers within the ISTP SB RAS Siberian network (SibNet).
The monitoring system implementation was based on the SibNet equipment.
Three main types of receivers are used in the network:
- −
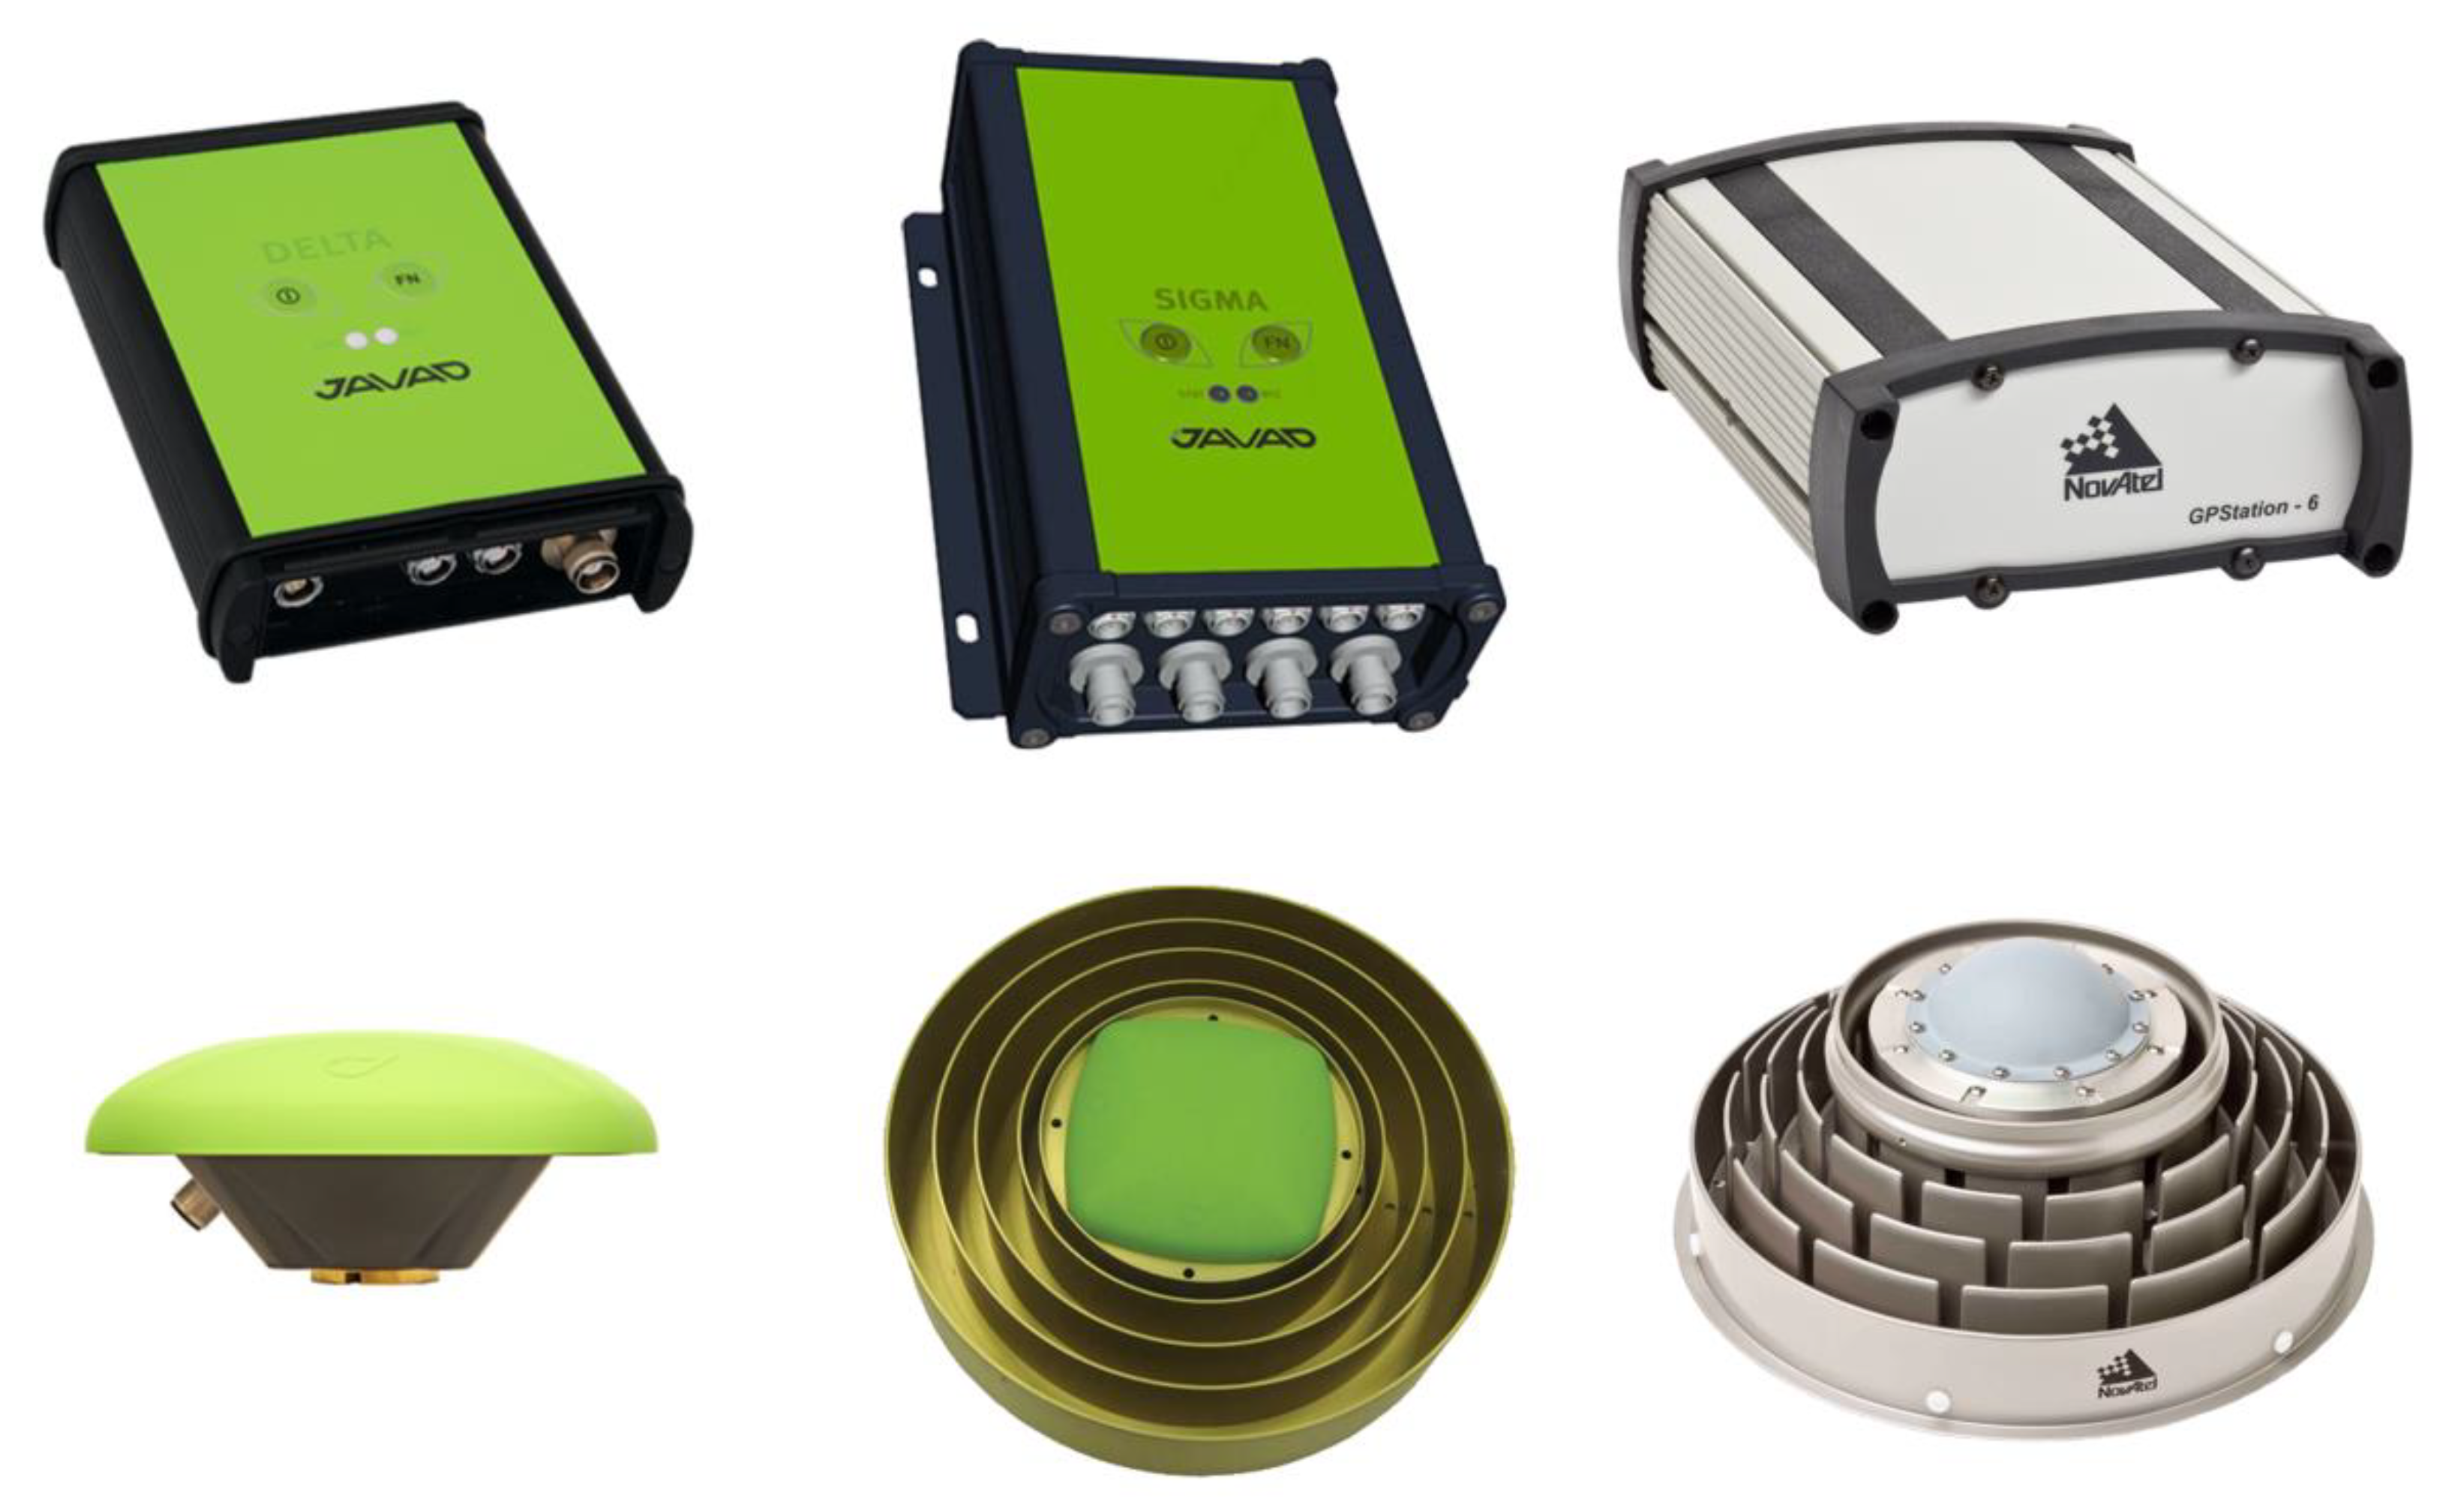
- JAVAD Delta-G3T;
- −
- JAVAD SigmaQ;
- −
- NovAtel GPStation-6.
The main type of receivers is JAVAD-G3T, installed at all of the points except for TORY. The NovAtel receiver, being a specialized receiver used to measure ionospheric scintillations, is also installed at points NORI, TORY and ISTP.
Three main types of antennas are used in the network:
- −
- JAVAD GrAnt-G3T;
- −
- JAVAD RingAnt-G3T;
- −
- NovAtel GNSS-750.
Figure 2 presents the images of the receivers (top row) and antennas (bottom) used in the SibNet.
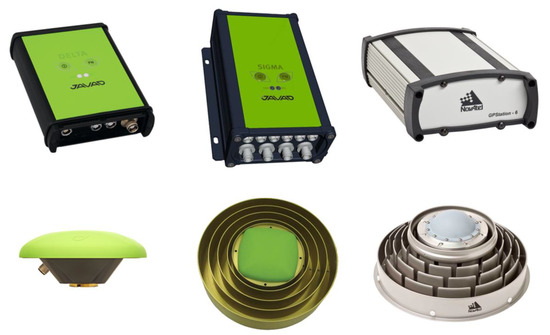
Figure 2.
Equipment used in the SibNet. Top: JAVAD Delta, JAVAD SigmaQ, NovAtel GPStation-6 GNSS receivers. Bottom: GrAnt-G3T, RingAnt-G3T, NovAtel GNSS-750 GNSS antennas.
This paper concerns the developed system of distantly monitoring the ionospheric absolute TEC.
3. Hardware Diagram of the Suite
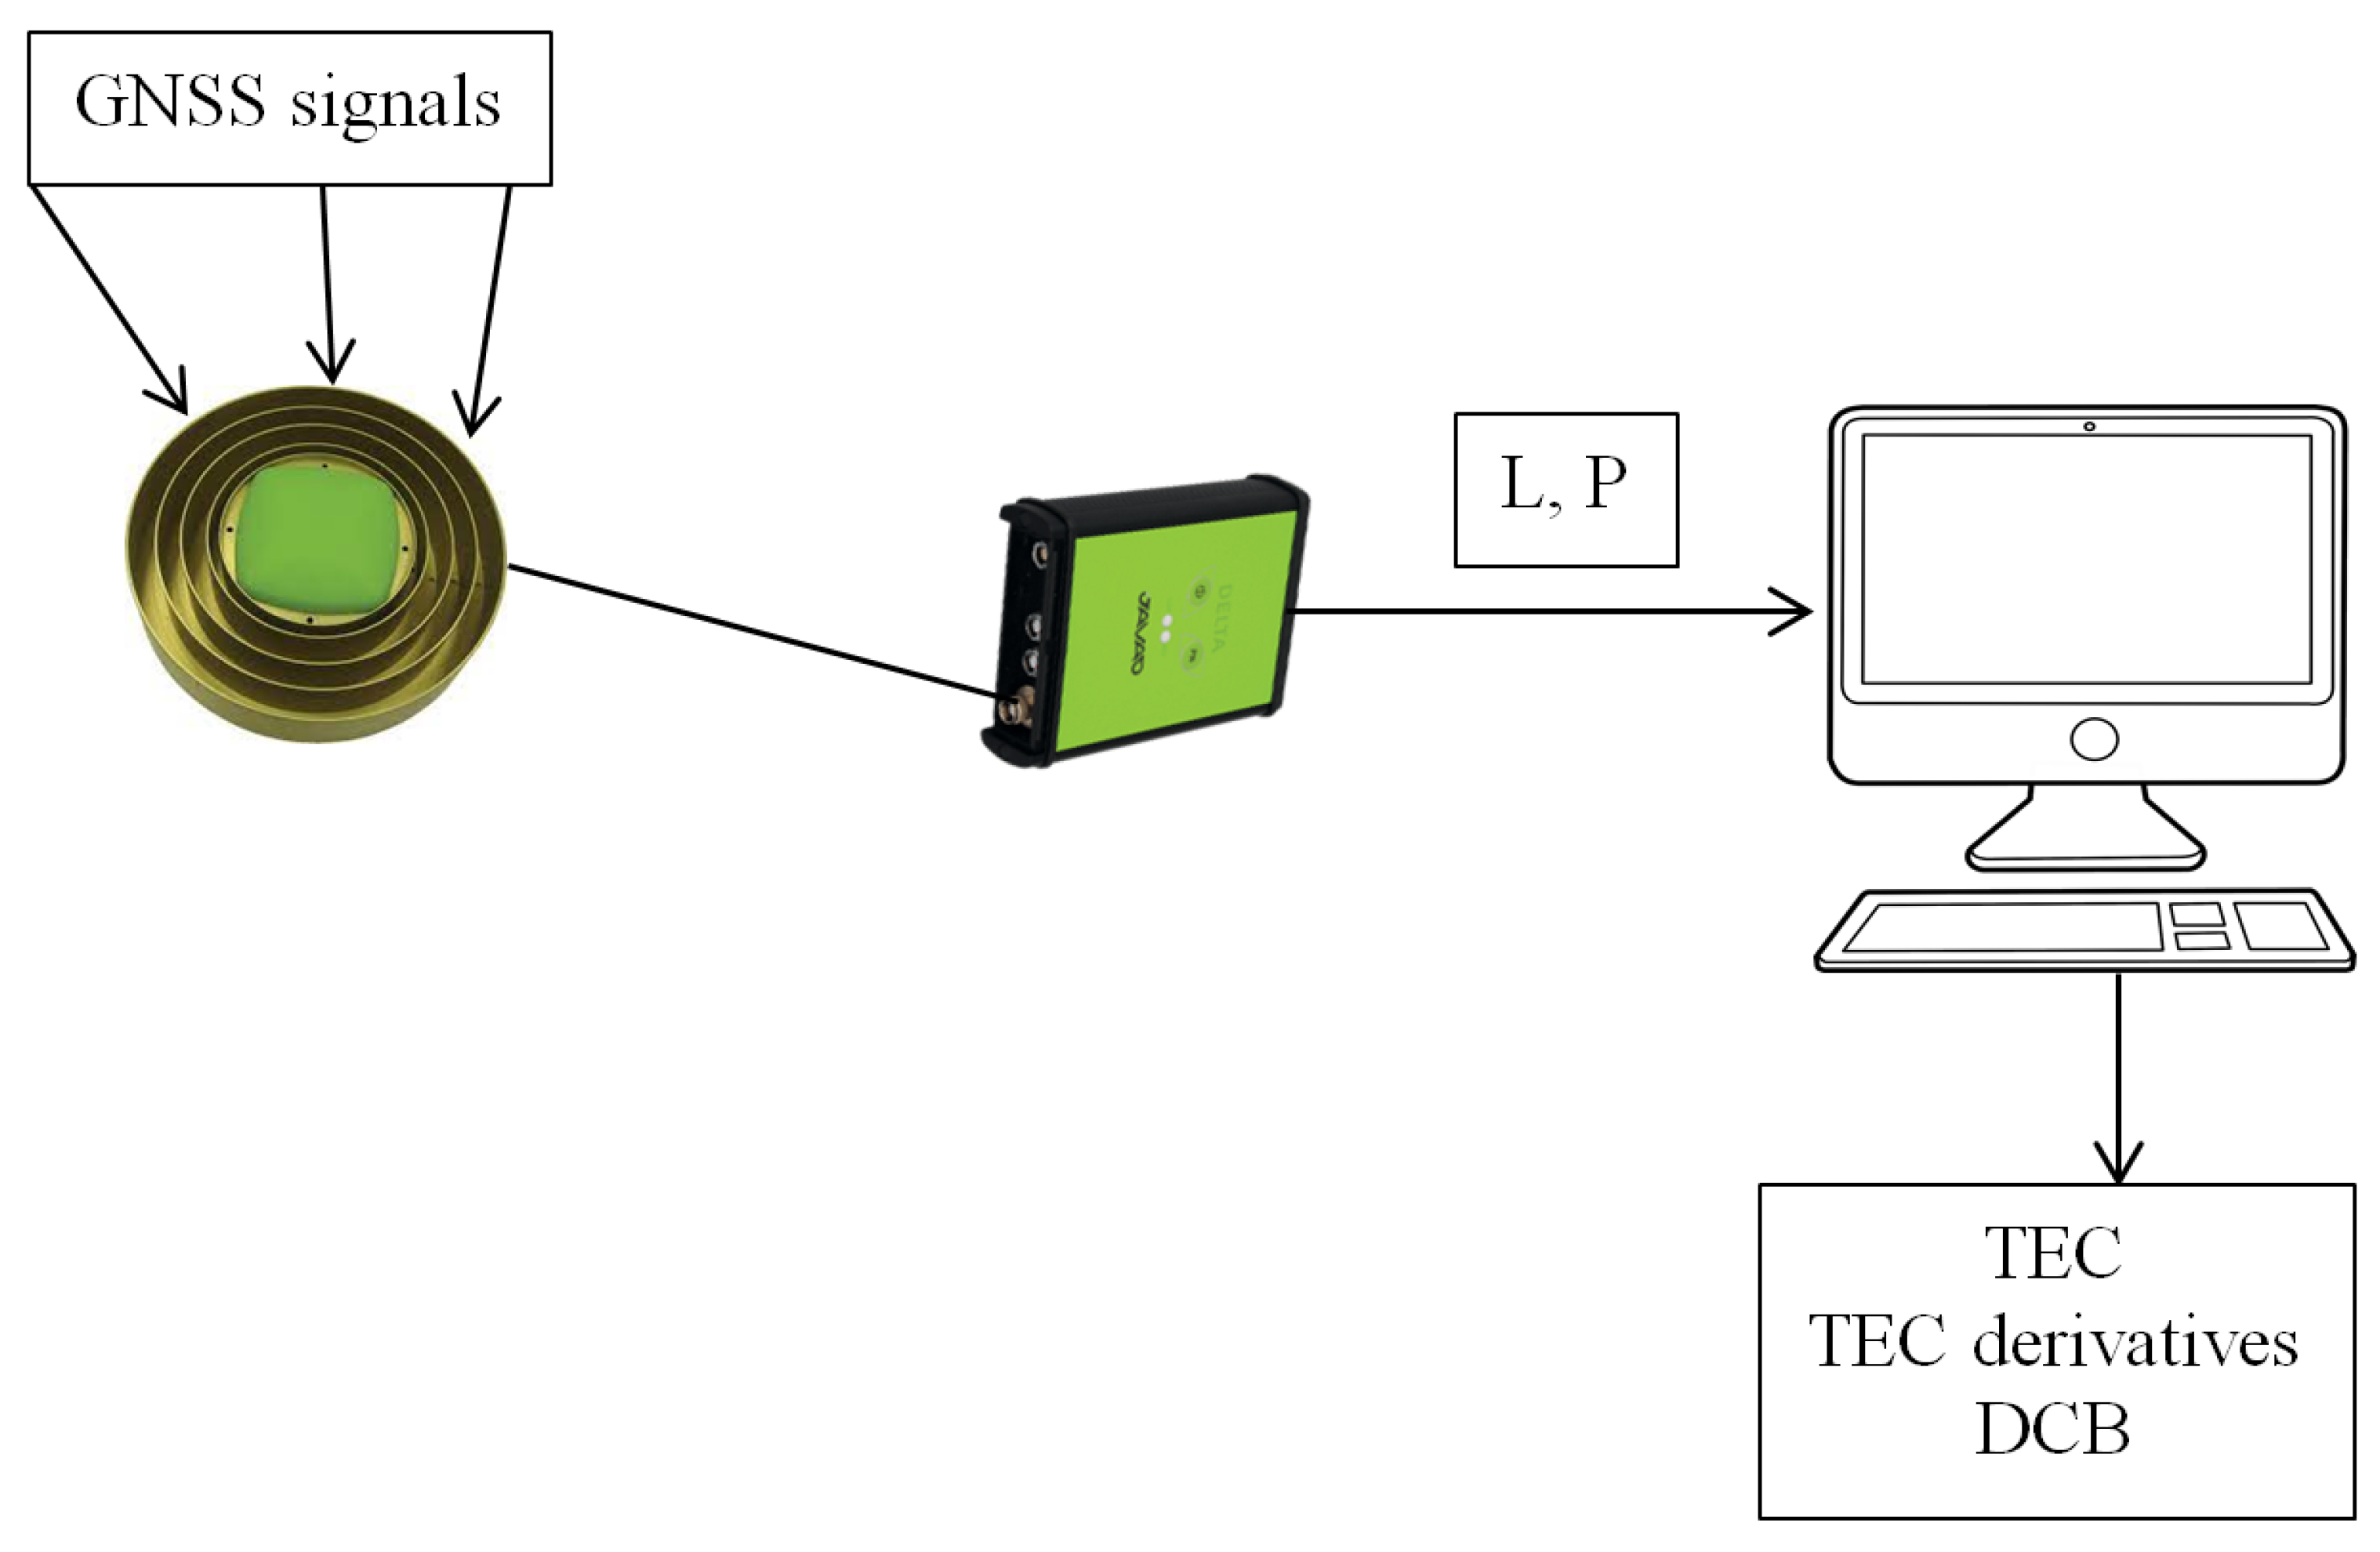
The suite for monitoring the ionospheric absolute TEC comprises three hardware parts: antenna, GNSS receiver, and the control computer to process data (Figure 3).
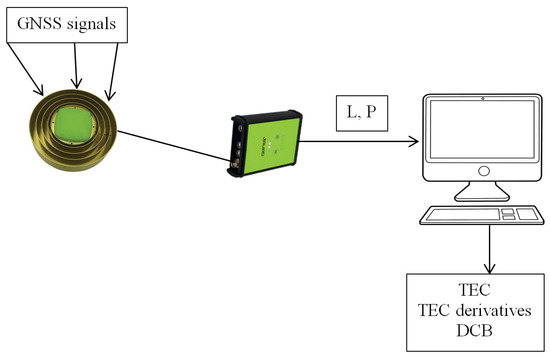
Figure 3.
Hardware diagram for the suite to monitor the ionospheric TEC. L and P are phase and pseudo range data, correspondingly.
The main requirements for the suite are:
- −
- receiving signals from >2 GNSS,
- −
- recording data every 30 sec or faster,
- −
- using low-noise geodesic receivers with high-stability reference generators,
- −
- suppressing the multipath propagation of signals.
The indicated requirements enable JAVAD Delta-G3T receivers to be used with RingAnt-G3T antennas that are SibNet constituents. The antenna and receivers feature:
- −
- receiving signals from GPS/GLONASS/Galileo/SBAS satellite systems,
- −
- receiving signals at L1, L2, L5 frequencies,
- −
- recording data at 1-sec frequency in the standard mode (and up to 50 Hz in special modes),
- −
- suppressing the multipath propagation of signals.
The receiver is connected to the antenna through the low-fading RG-213 cable within the GNSS operation band. The cable is 30 m long. At a longer distance, one needs an alternate power amplifier.
The computer processes raw data from the GNSS receiver and outputs the information on a TEC, TEC derivative, and differential code bias (DCB). We used the Linux operation system to control the computer. As an implementation, a LENOVO ThinkCentre Tiny M630e computer (Intel Core ™ i5 processor and the 8 Gb DDR4 RAM) is used.
4. Data Diagram of the Suite
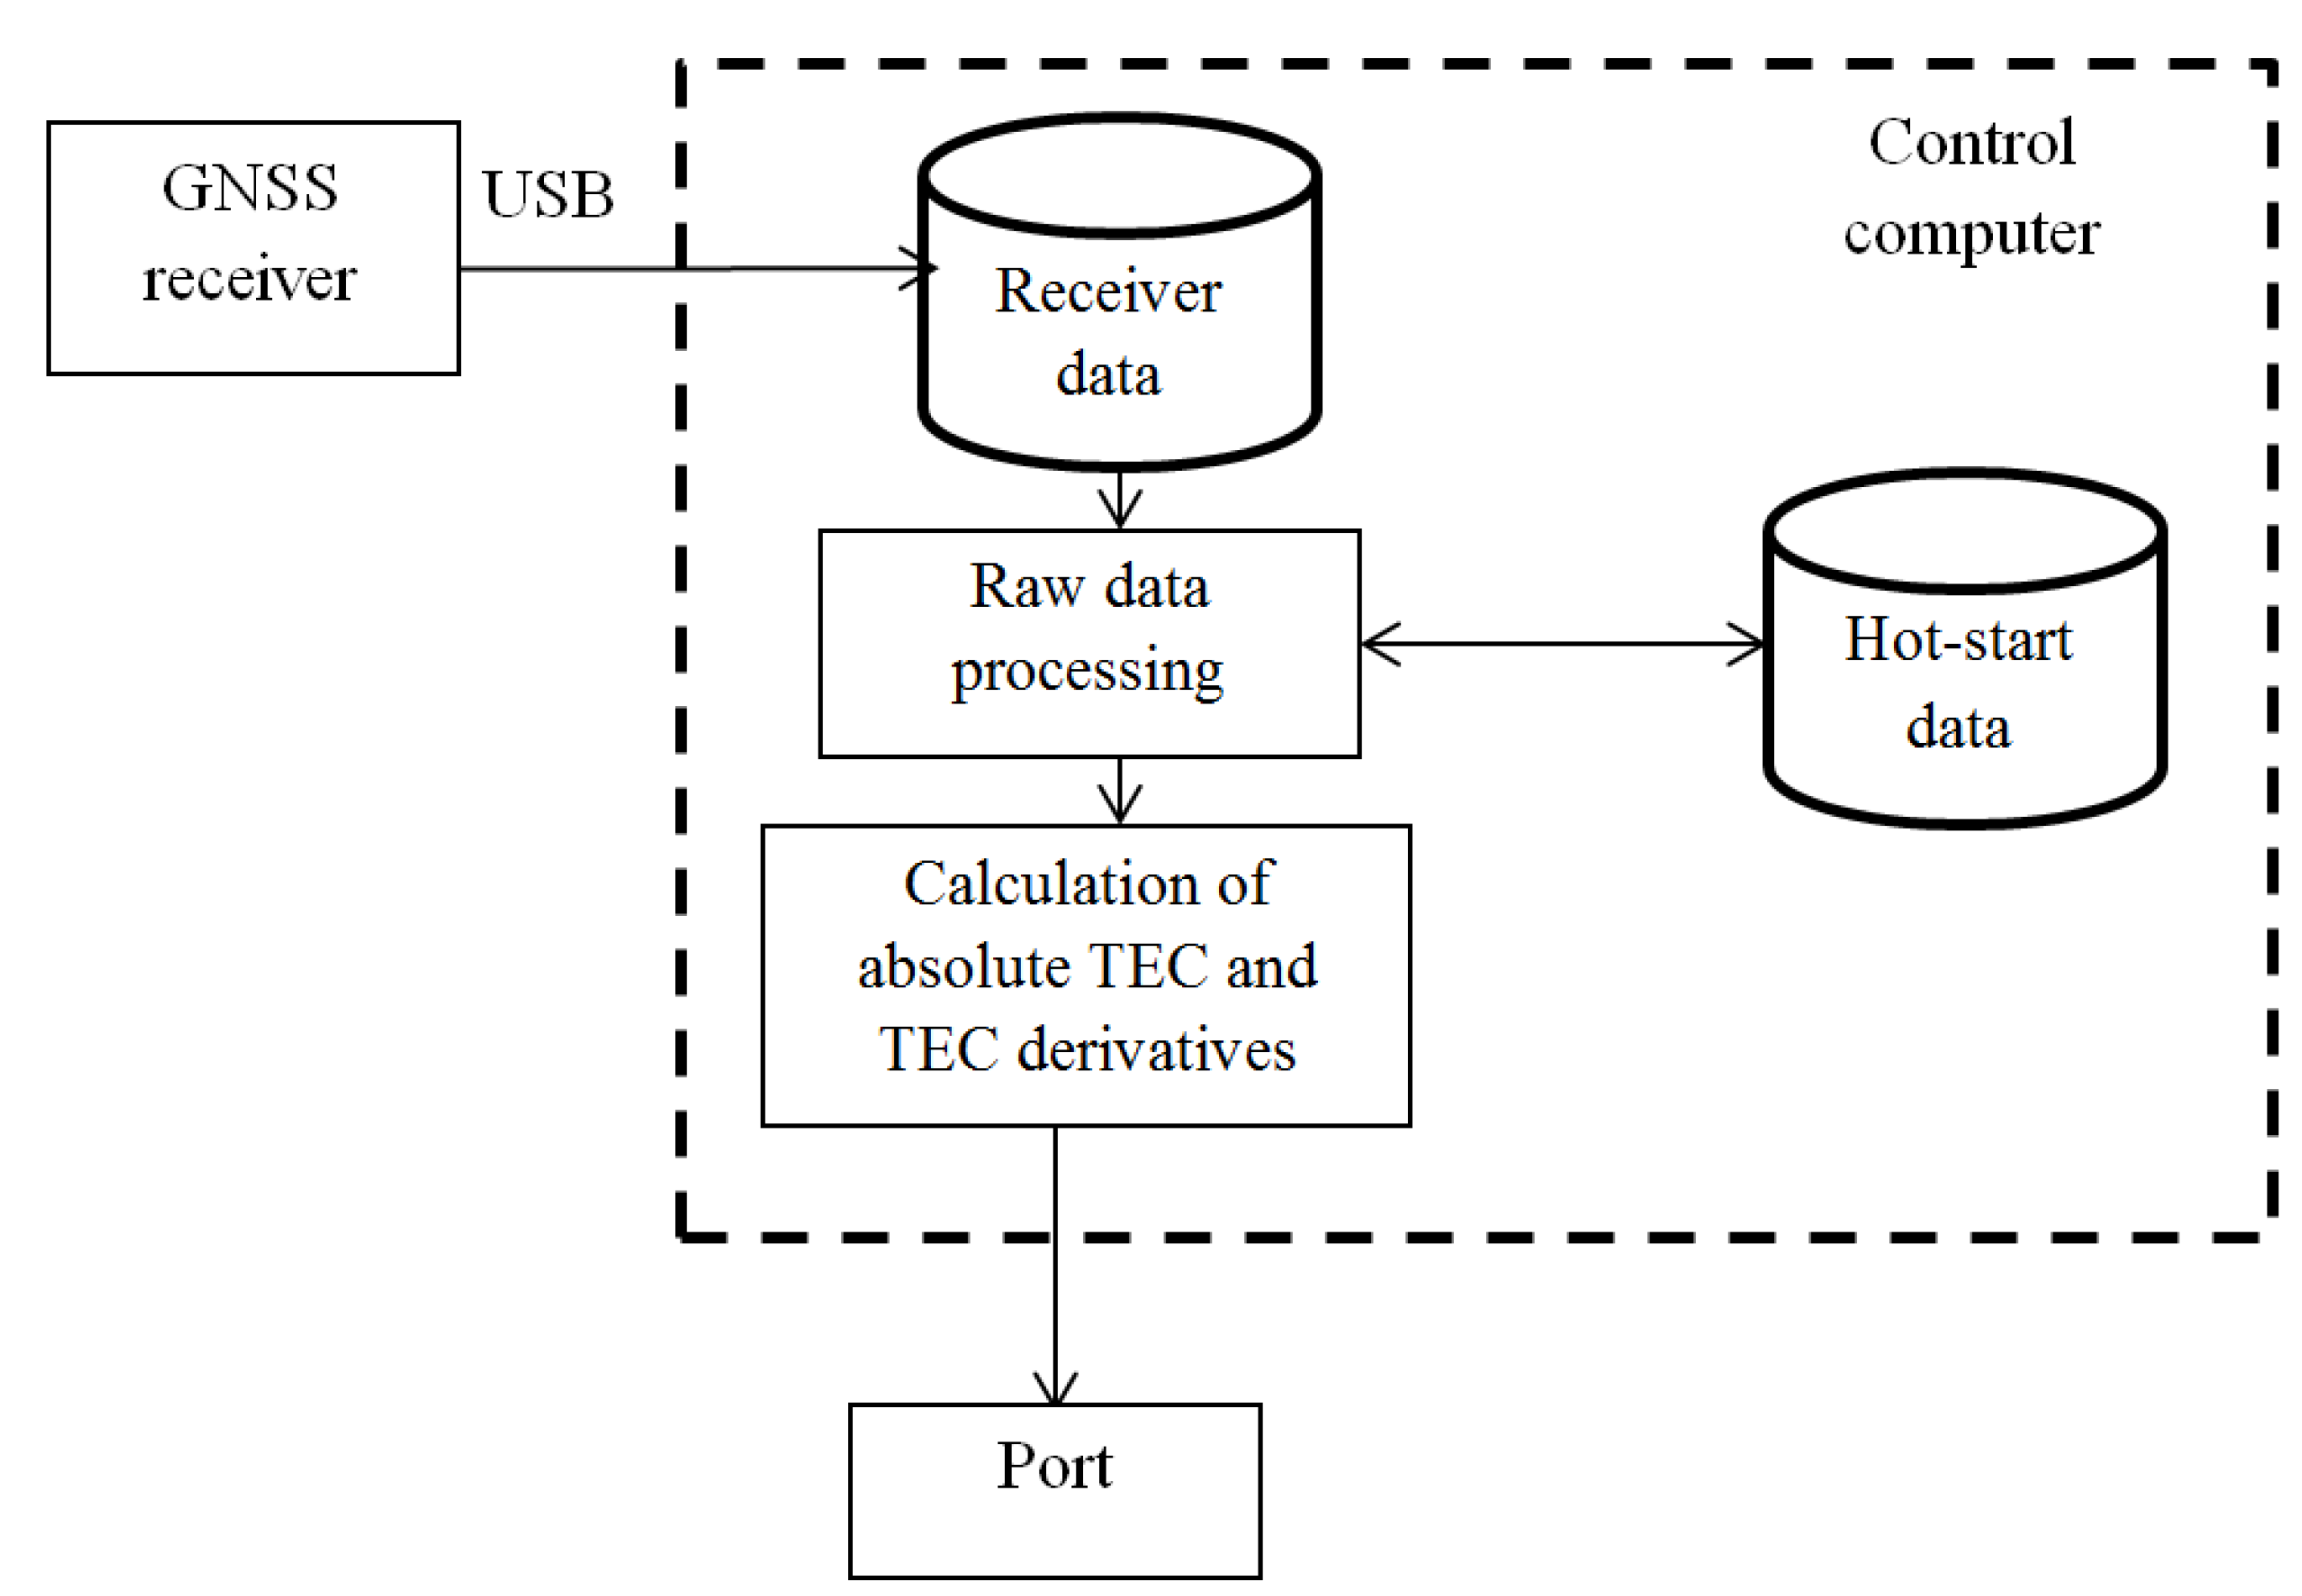
The suite’s software represents a set of moduli operating independently (see Figure 4). The information flow has the following structure:
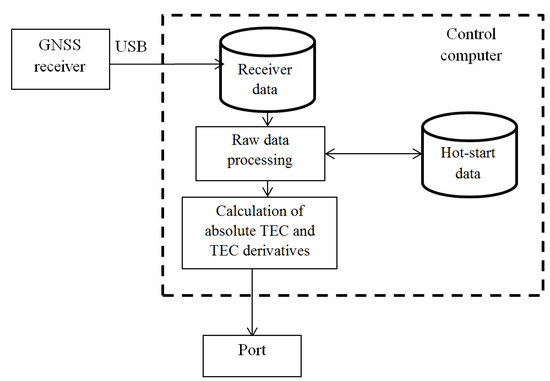
Figure 4.
Data diagram for the suite to monitor the ionospheric TEC.
↓ The receiver produces a set of raw data through the USB interface.
↓ The control computer saves the data in the databank.
↓ The raw data processing module keeps in track the data and obtains GNSS observables to provide initial TEC measurements and supplementary information.
↓ The data are stored on the disk to save time at system startup in case of power loss (hot-start).
↓ * If suitable, the hot-start data are retrieved at system startup/restart.
↓ The calculation of the absolute TEC and its derivatives is performed.
↓ The data are provided to the end user.
To minimize the inter-effect of the moduli, each module represents a separate application. Possible delays and errors in one of them cannot violate another program’s operation. A shut-down of a moduli does not result in a shut-down of the entire system, either. Later, the failed module may be rebooted without information loss in others.
The moduli manager logs system events, which enables the state and integrity of the running operation to be traced. In case of malfunction and unexpected termination of the moduli operation, they are automatically rebooted.
4.1. GNSS Receiver Raw Data
The data arrive from the GNSS receiver through the USB interface in the control computer. The JAVAD uses its own GNSS Receiver External Interface Specification (GREIS) protocol, as described in [18]. The protocol provides access to all of the capabilities and functions of the receiver.
The GREIS describes a common language irrespective of a particular JAVAD receiver, which allows updating and replacing of the suite’s receiver, if necessary.
The data from the receiver flow is similar to a binary stream of various messages: various measurements, calculated values, etc. Different epochs are distinguished by means of special messages. Each message flows according to its schedule. The GREIS determines special methods and types of messages, which enables (in a standard way) the necessary information to be obtained from the flow. The messages flowing from the receiver are split into blocks by means of epoch. In case of noise in the communication link, the lost blocks are resent.
The data flow from the receiver involves the title and an arbitrary number of information blocks. Each block starts with a time marker. The data between two successive markers refer to the first marker.
The information messages used in the system for calculations are [R1], [R2], [P1], [P2], [SI], [EL], [AZ], and [SI]:
[R1] and [R2] are group pseudo-range observables at the first and the second frequencies.
[P1] and [P2] are phase pseudo-range observables at the first and the second frequencies.
[EL] and [AZ] are the elevation and the azimuth.
[SI] are service messages, including the information on satellites order.
The [SI] messages serve to index the data of other messages and to attribute the particular measurement to the particular satellite. [SI] are critical for GLONASS where the frequency is not fixed for the same observable type.
Messages [R1], [R2], [P1], and [P2] comprise a variable number (by the number of the observed satellites) of float fields (8 bytes) and one unsigned integer field (1 byte) for the checksum. The [EL] message comprises a variable number (by the number of the observed satellites) of integer fields (1 byte) and one unsigned integer field (1 byte) for the checksum. The [AZ] messages comprise a variable number (by the number of the observed satellites) of unsigned integer fields (1 byte) and one unsigned integer field (1 byte) for the checksum. The elevation is provided at the 1-deg precision, while the azimuth is provided at the 2-deg precision. To obtain smooth series for the elevation and for the azimuth, interpolation is necessary.
4.2. GNSS Receiver Raw Data Storage
The receiver data are saved on the file system as per the standard JPS structure [18]. The files are stored for half a year. The files are checked on the retention-period excess, and the outdated data are deleted.
The diurnal data scope, when recorded at the 1-sec sample rate, is ~250 Mb. One terabyte of the disk space for the GNSS receiver data is sufficient. Because raw measurements may be used for other goals, the raw data recording frequency may be increased to 50 Hz. In this case, the raw data diurnal scope is ~10 Gb, and the initial files are stored for approximately one month.
4.3. GNSS Receiver Raw Data Processing
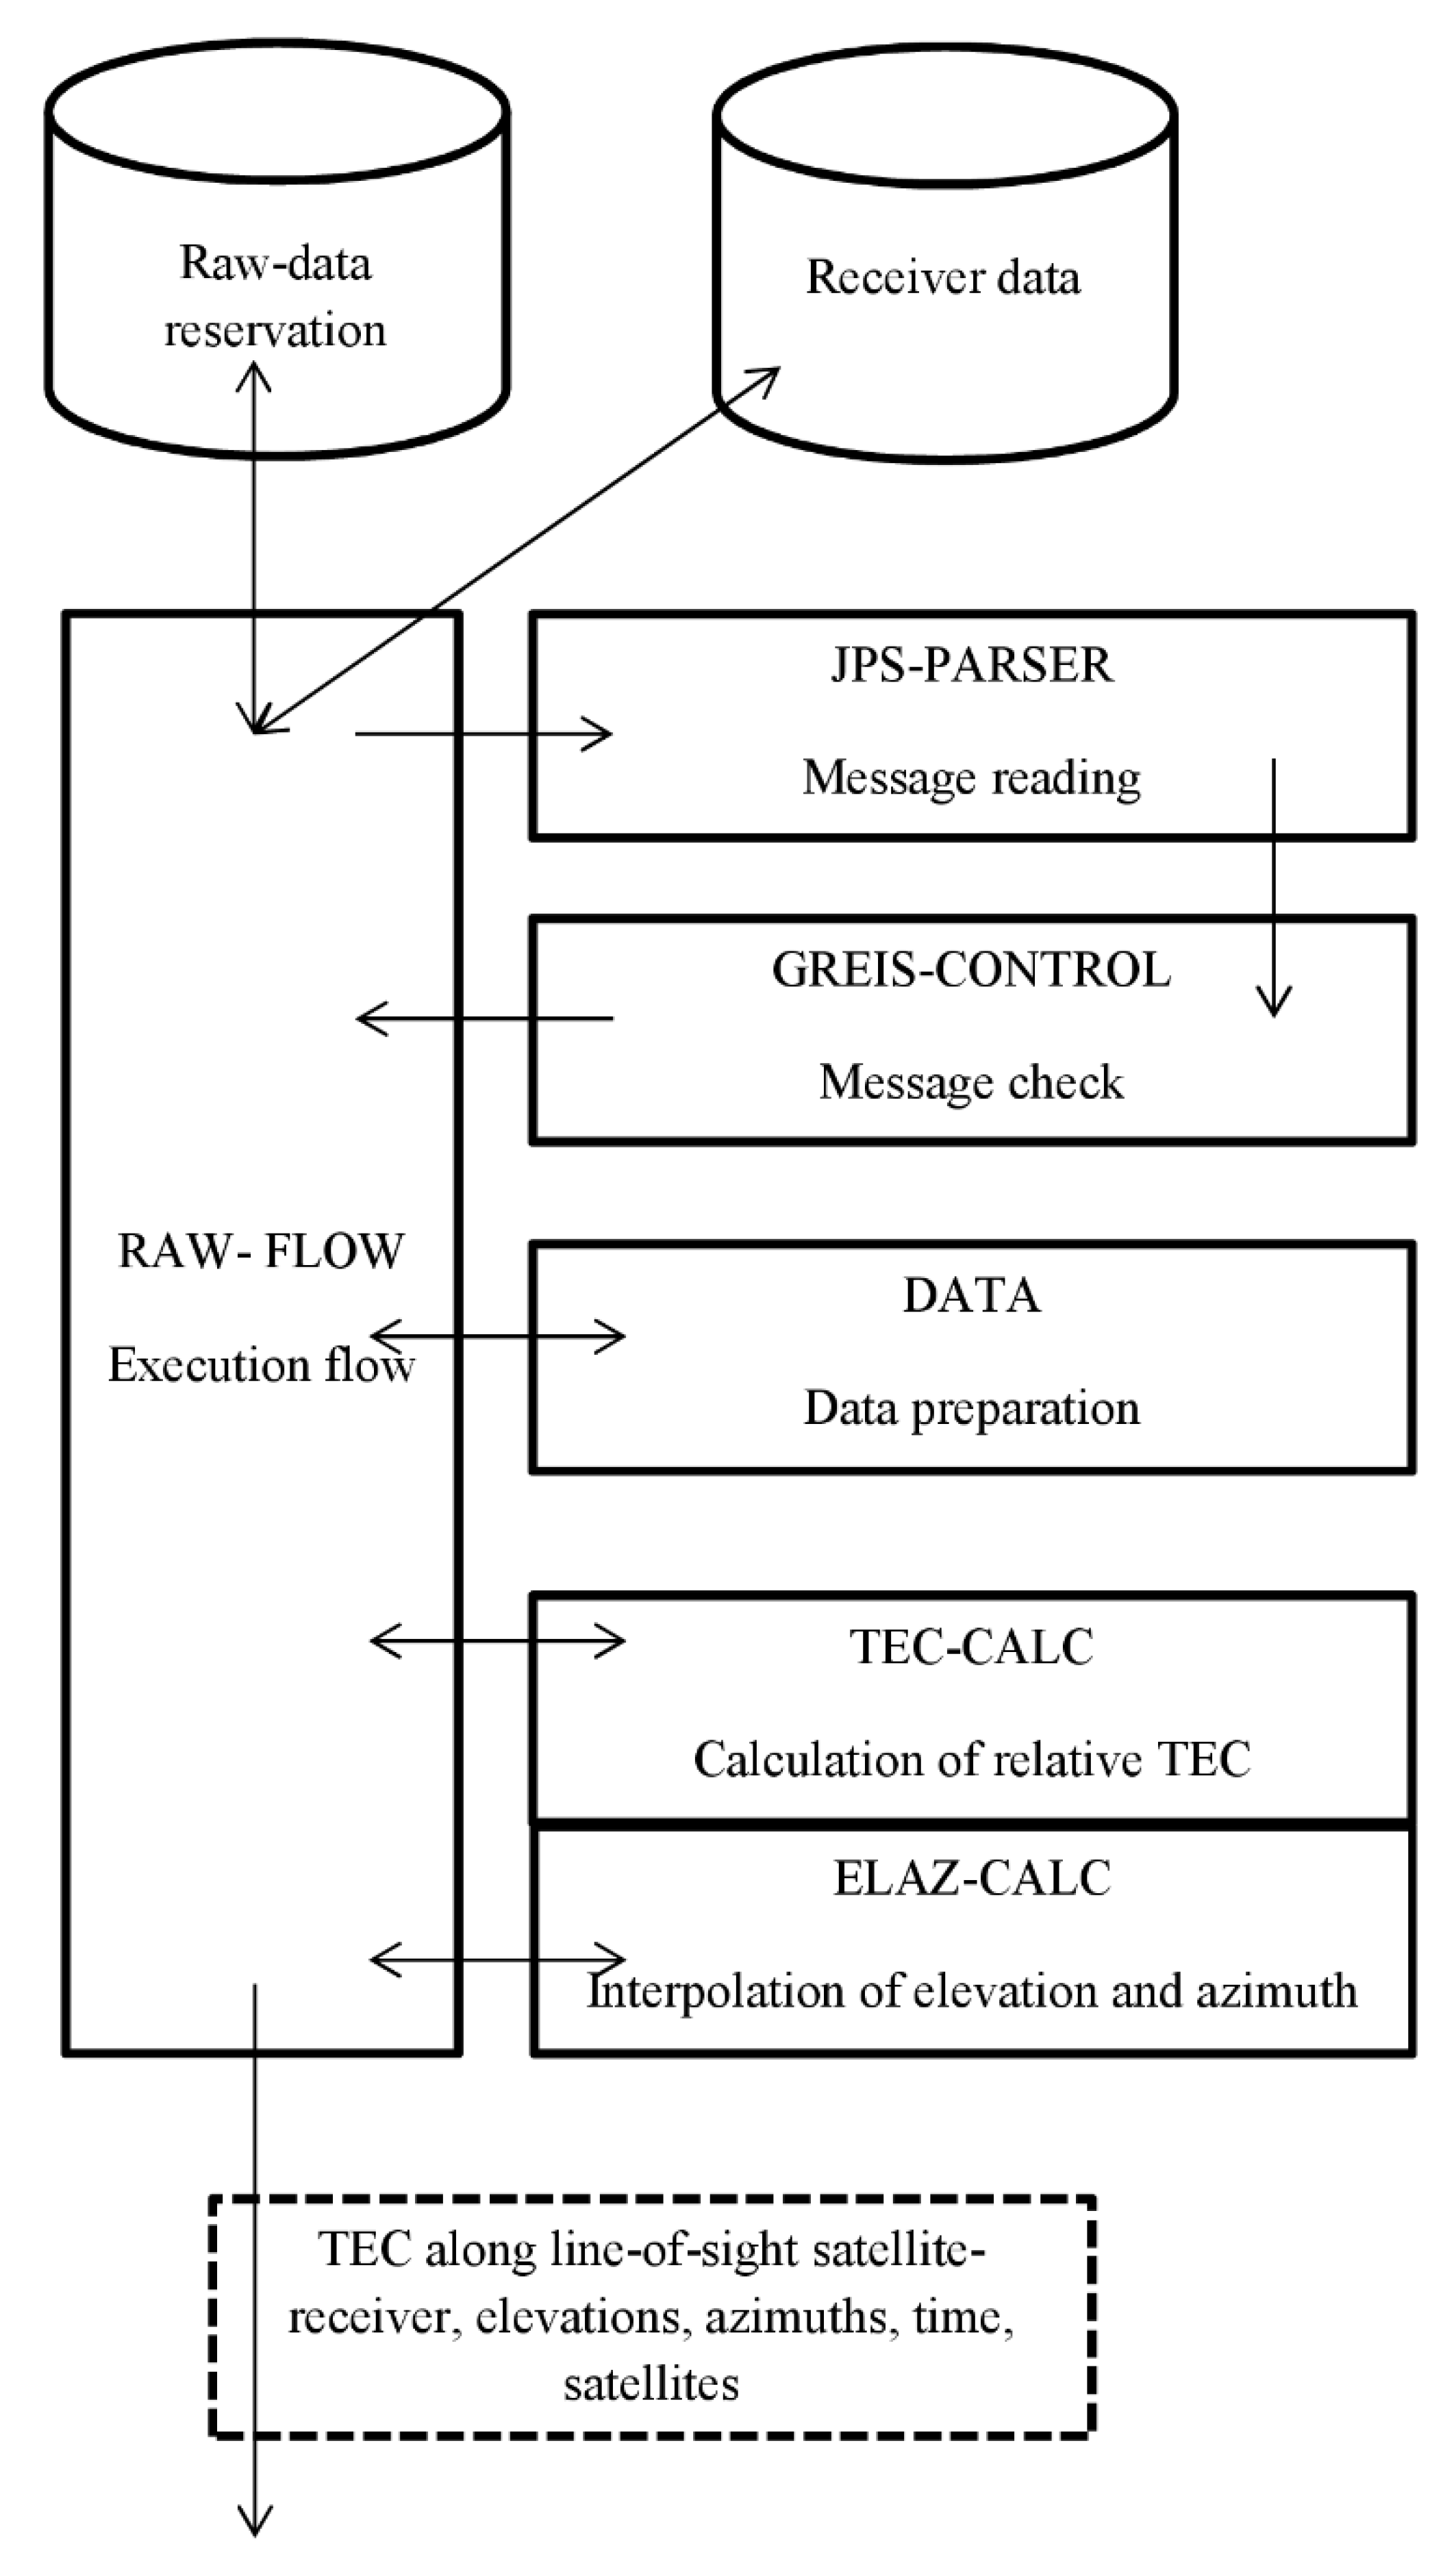
The raw-data processing module obtains initial “raw” TEC measurements from the receiver, as well as the elevations and the azimuths. Figure 5 presents the data diagram.
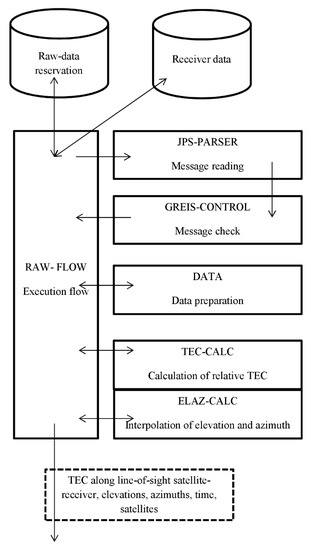
Figure 5.
Data diagram for GNSS receiver raw-data processing module.
The key module is the RAW-FLOW. It arranges the execution flow for the moduli set. The module determines the last accessible file, to which the data flow from the receiver is being written at the moment, and traces the arriving messages. The module continuously acquires the data from the receiver and provides their backup. Moreover, it starts up the other moduli and exchanges the necessary information among the latter.
In case of malfunctions in the system operation, the module obtains the data from the backup storage.
At the system startup after a short break («hot start») owing to various malfunctions, the RAW-FLOW checks the available data history, enters the last state, and continues to function in due order. The output data from the raw data processing module are regarded outdated 48 h after recording. As the data become outdated, the records are rotated, so that the current processing uses only the live data. To decrease the hard disk load and to increase its lifespan, the data are recorded only after a 5-min accumulation.
The JPS-PARSER module reads the JPS files and samples the data, leaving only those fields that are necessary for further calculations. The only data sampled are those that have not arrived in processing yet. For that purpose, the module obtains the information on the last processed data from the RAW-FLOW.
The GREIS-CONTROL module checks the data integrity that is provided by the summation check and calculated through the cyclic redundant code algorithm described in the GREIS.
The DATA module structures the data and prepares the latter in the formats used in the system.
Based on the data concerning group and phase measurements of pseudo-range [R1], [R2], [P1], and [P2], the TEC-CALC module calculates the TEC, based on the known formulas:
where f1 and f2 are a pair of the GNSS operation frequencies, L1λ1 and L1λ1 (P1, P2) are phase pseudo-ranges (group pseudo-ranges) measured at the f1 and f2 frequencies, const is the constant related to the phase measurement ambiguity, DCB is the differential code bias in the hardware of both satellites and receivers, σφ and σP are random noise from phase and group measurements, and c is the speed of light.
To calculate the GLONASS frequencies for particular satellites, the module uses the information on the frequency channel number n from service messages [SI].
where F1 = 1602 MHz, F2 = 1246 MHz, ΔF1 = 0.5625 MHz, and ΔF2 = 0.4375.
f1 = F1 + n*ΔF1,
f2 = F2 + n*ΔF2,
As described above, the JAVAD receiver generates data on the azimuth within precisely 2° (0, 2, 4, …), and on the elevation precise within 1° (1, 2, 3, …). In general, the measurements at close elevations differ insignificantly, but a stepwise change in the elevation may negatively affect the used set of equations.
The ELAZ-CALC module calculates elevations and azimuths. In this case, two options are possible: either to calculate additionally, based on the orbit parameters, or to interpolate the available data. Because the dynamics of the elevation is described (with a high accuracy) by a second-order curve, the local interpolation of the obtained data is sufficient. As a result, the transition points from one value to another fix the new value explicitly, which enables exact values to be interpolated.
The azimuths are not a part of the expressions for TEC calculations but are stored for TEC extrapolation.
TEC, elevations, and azimuths, as well as the corresponding service information, are saved on the disk for backup and are transmitted to other moduli. This minimizes further costs of the operations since the receiver’s raw data are not processed again and enables a fast «hot start» after a system malfunction due to a power cut or other reasons.
4.4. Calculating Absolute TEC and TEC Derivatives
Calculating the absolute TEC and TEC derivatives is performed by the method described in Section 5.
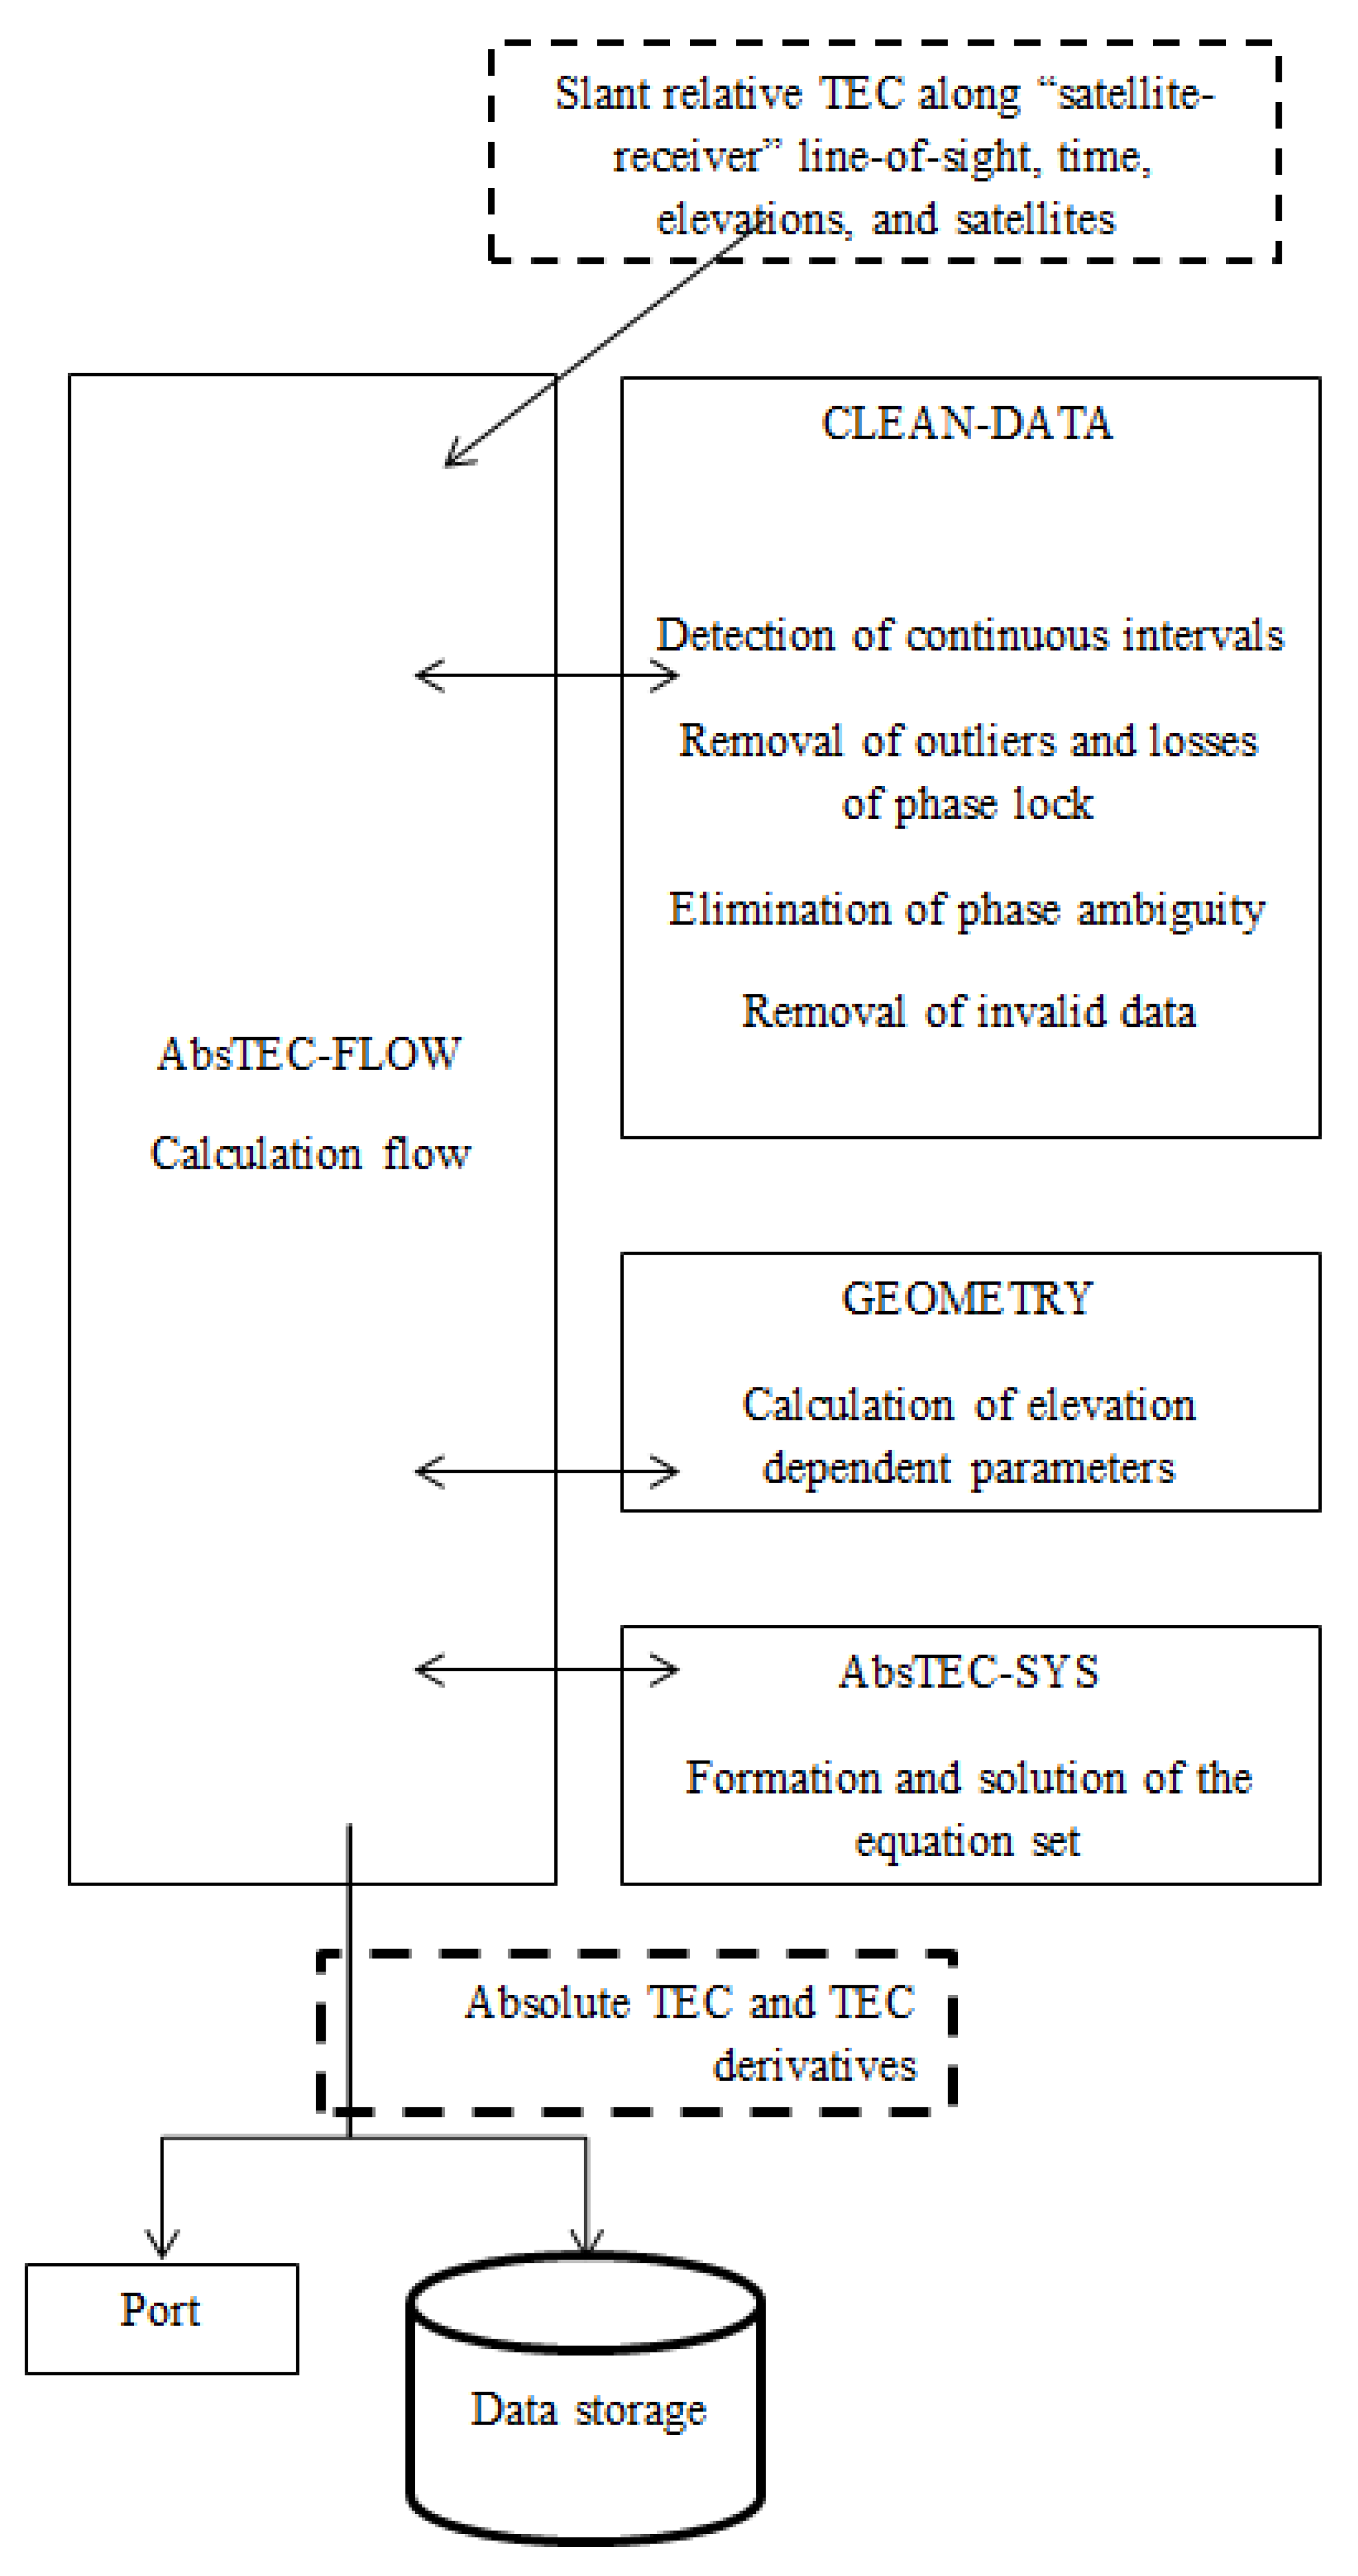
Figure 6 shows the information pattern. The series of data on the group and phase TEC, on the elevation, on time, and the information on the satellite are the module’s input. We use the data for the latest 36 h.
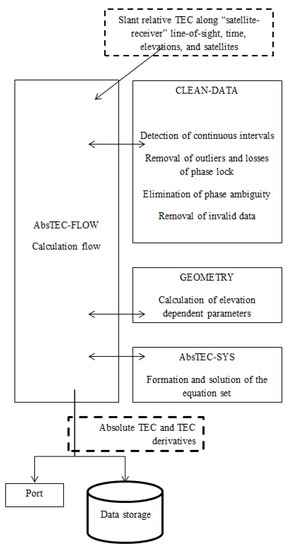
Figure 6.
Information pattern for the absolute TEC obtaining module.
The CLEAN-DATA module determines the continuous intervals, eliminates outliers and losses of phase lock, and removes phase ambiguity. If the continuous series is shorter than 10 min, or in the absence of any parameter, the data are regarded invalid and are not included in processing.
The interval continuity requires that the interruption be no more than 2 min and that the elevation change does not exceed 10 deg.
The GEOMETRY module calculates the function of the oblique TEC transformation into the vertical (mapping function).
The AbsTEC-SYS module forms a set of equations and calculates the statistical scales. The solution matrix involves a series of the absolute TEC, of the time derivative, and of the TEC spatial gradients.
The values for the TEC and for the derivatives (both time and space) for the current instant are transmitted into the port for real-time use and are recorded into the data storage in the standard JSON format.
5. Estimating Absolute TEC and TEC Time and Space Derivatives
Estimating the absolute total electron content and its time and space derivatives (gradients) is done based on the method proposed in [19]. The main feature of this method is providing non-negative values for the vertical and oblique (at all the “satellite-receiver” beams) absolute TEC. The measurement model is set in the form:
where IV is the absolute vertical TEC value, Δϕ (Δl) is the latitude (longitude) difference between the ionospheric point coordinate ϕ(l) and that of the station ϕ0(l0), and Δt is the difference between the measurement time t and the time t0 for which the calculation is performed. Furthermore, Gϕ = ∂IV/∂ϕ, Gl = ∂IV/∂l, Gq_ϕ = ∂2IV/∂ϕ2, and Gq_l = ∂2IV/∂l2 are the linear and quadratic spatial TEC gradients, and Gt = ∂IV/∂t and Gq_t = ∂2IV/∂t2 are the first and second time derivatives.
where RE = 6371 km is the earth radius, hmax = 450 km is the ionospheric point height, is the satellite elevation and α is the correcting coefficient.
To find parameters in (5) we should minimize the functional
where IExp—experimental TEC and ω—statistical weights.
The minimization involves the least square technique. A typical problem for TEC estimation is emerging negative or zero values. For GIM data, this leads to zero values for some GIM cells. We need to restrict the estimated values [20,21]. Zhang et al. [22] checked such a technique for global ionosphere maps. For our task, we need to obtain both non-negative vertical TEC and non-negative slant TEC. The slant TEC after DCB removal should at least exceed some value C. Therefore, we introduce the next boundaries [19]:
where C is a non-negative value of minimal TEC, which can be observed in principle. We chose C = 0.5 TECU.
IV(t0) > C, ∀t0,
(IDCB)j < (IExp)min,j − C, ∀ satellite j,
(IDCB)j < (IExp)min,j − C, ∀ satellite j,
6. System Characteristics
6.1. Resource Consumption
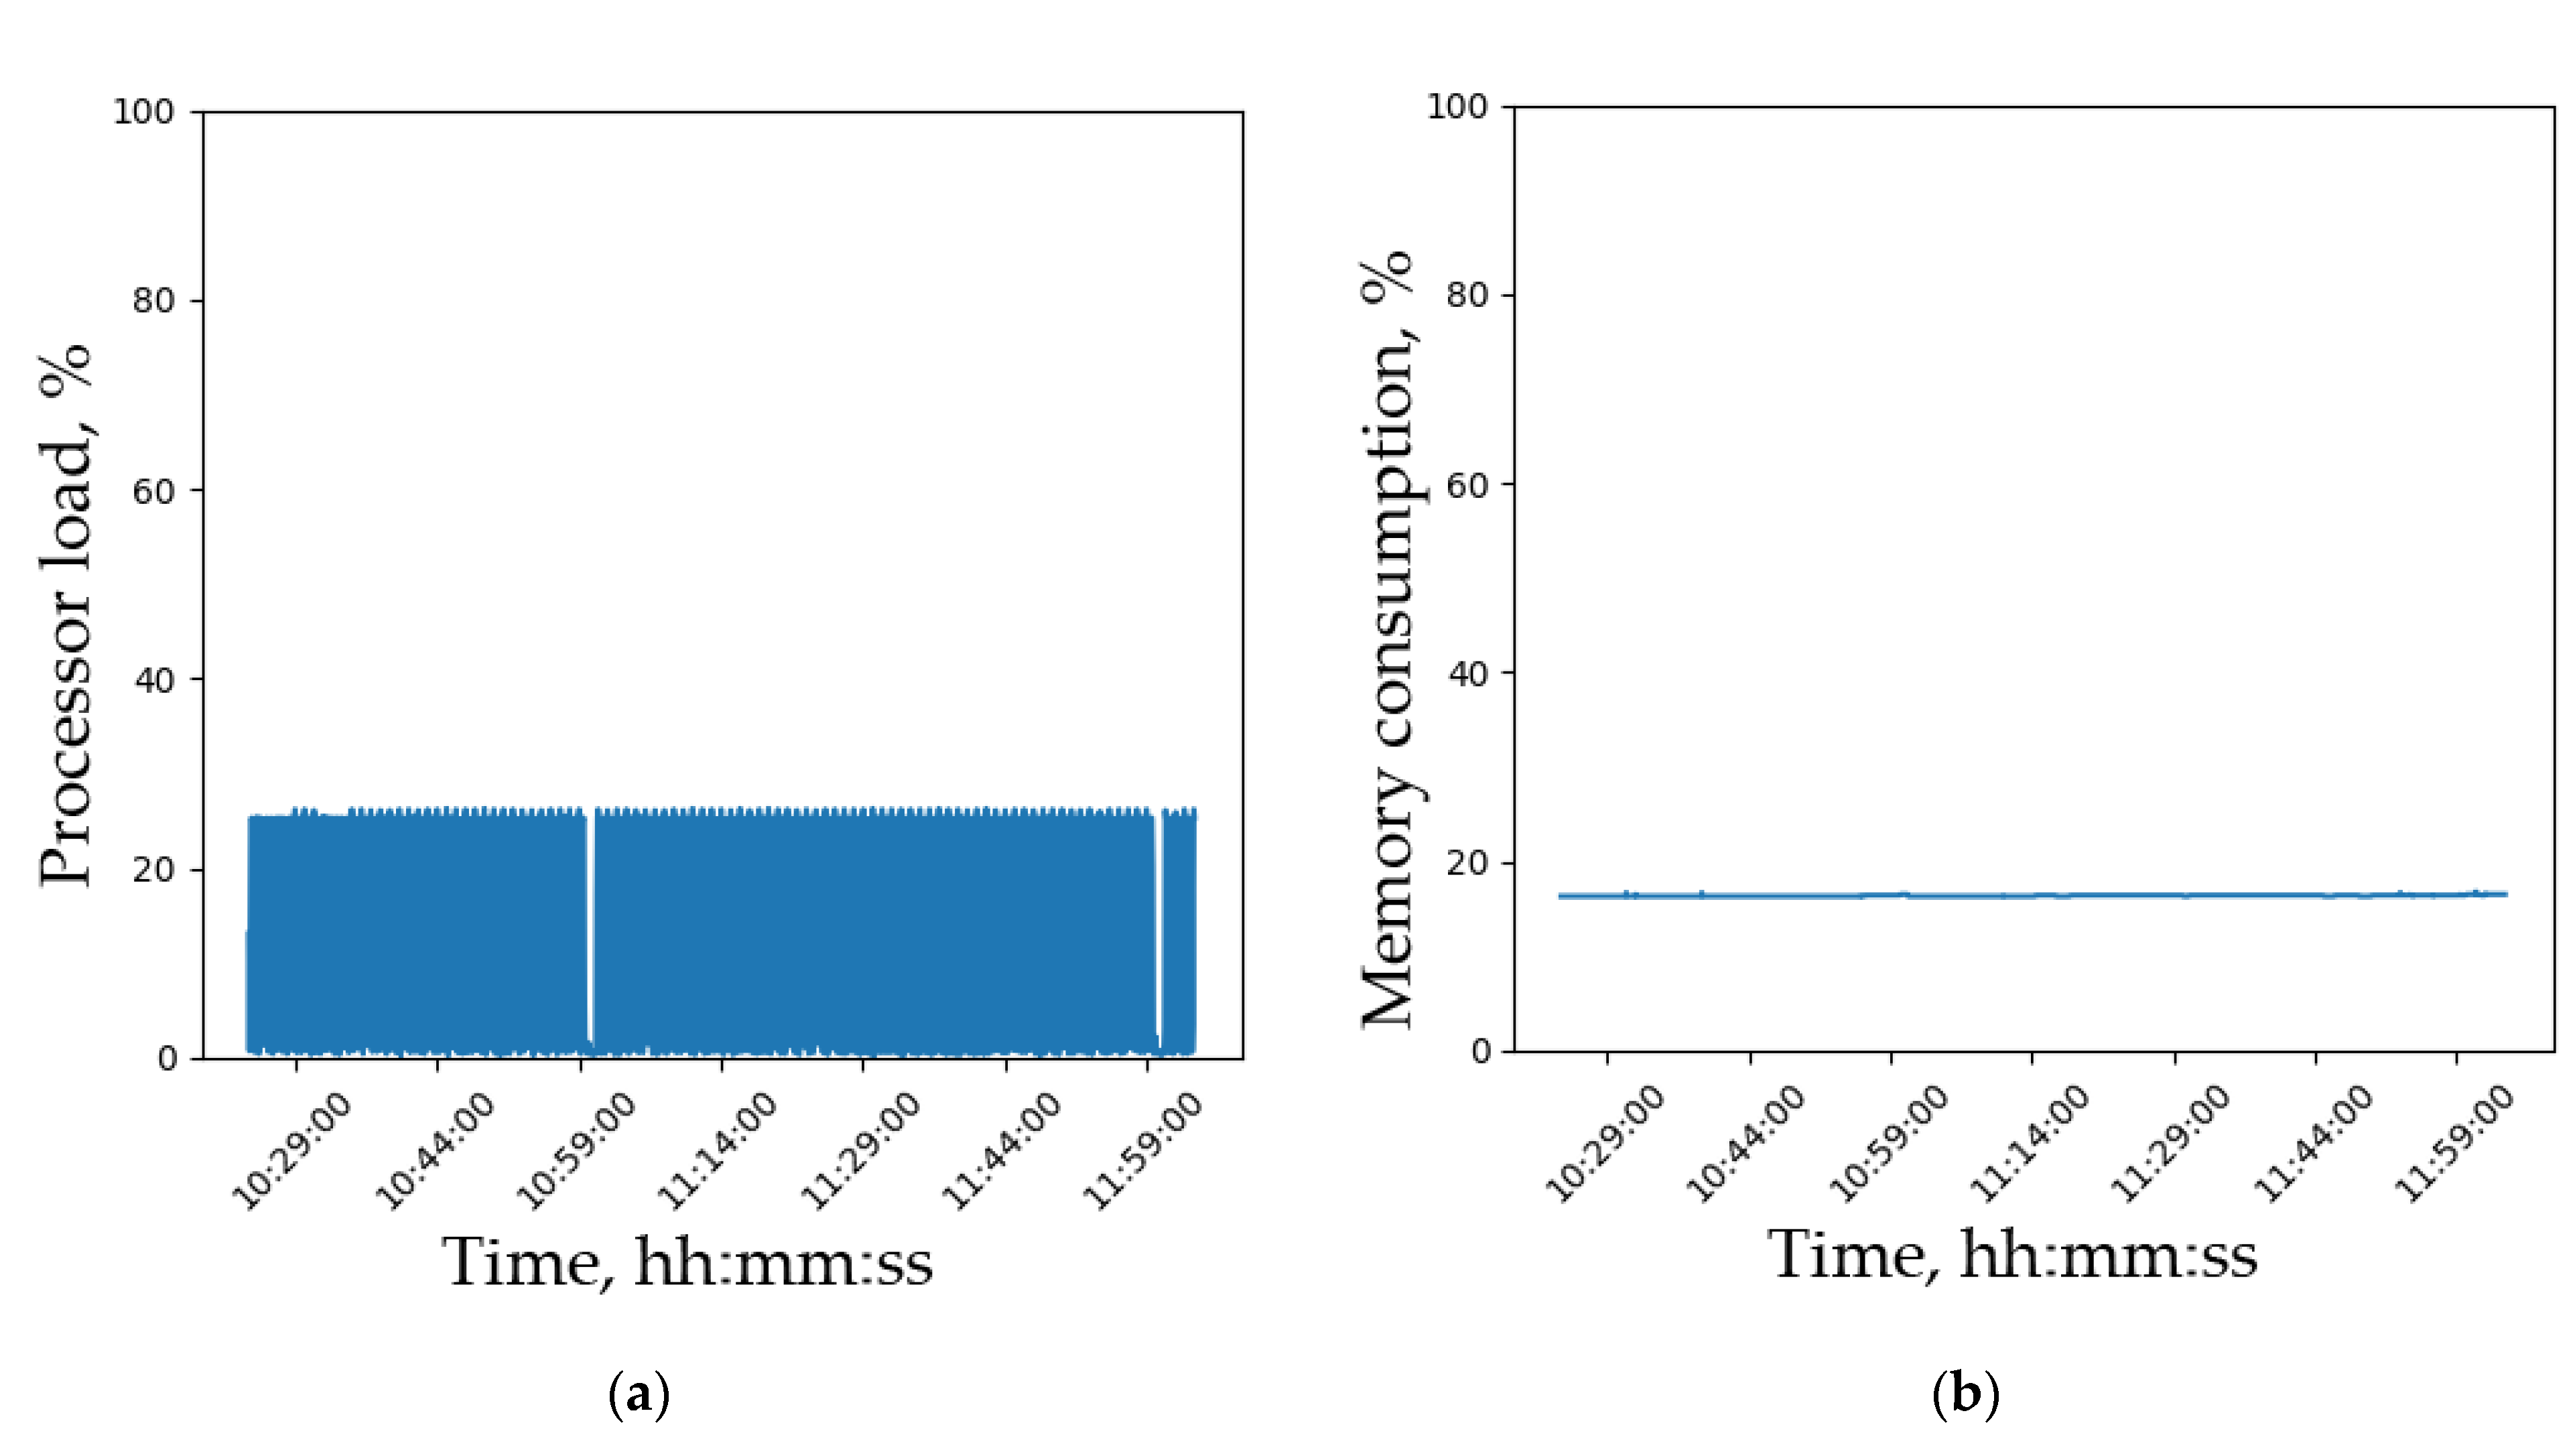
Resource consumption is an index of the suite’s operation stability. Figure 7 demonstrates the resource consumption by the distant monitoring system. The measurements are taken once every 30 s. The processor load (left panel) is ~25%. From the processor load it is clear that one core is enough for real time processing. This means we can fit other calculations, e.g., with extra frequencies, in the same computer.
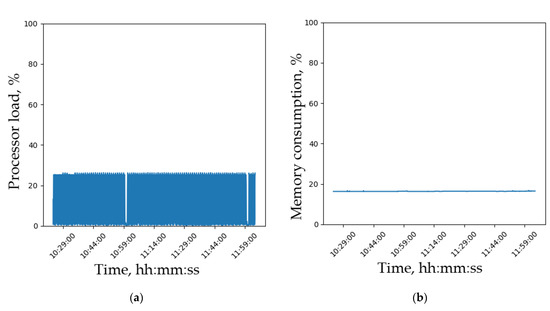
Figure 7.
System resource consumption with run moduli. (a)—processor load; (b)—memory consumption.
The control computer memory consumption (right panel) is also at the constant level. This evidences the absence of memory leaks in the system units and a possibility of long-term continuous operation. The resource consumption means that a weaker PC computer can be used than the one used here. One can try using Raspberry PI computer with external storage to make the system work.
6.2. Sounding Geometry
An important feature of the system is that it could be fed by different system satellite measurements. In this paragraph, we simulate the suite’s ionospheric sounding coverage in different regions.
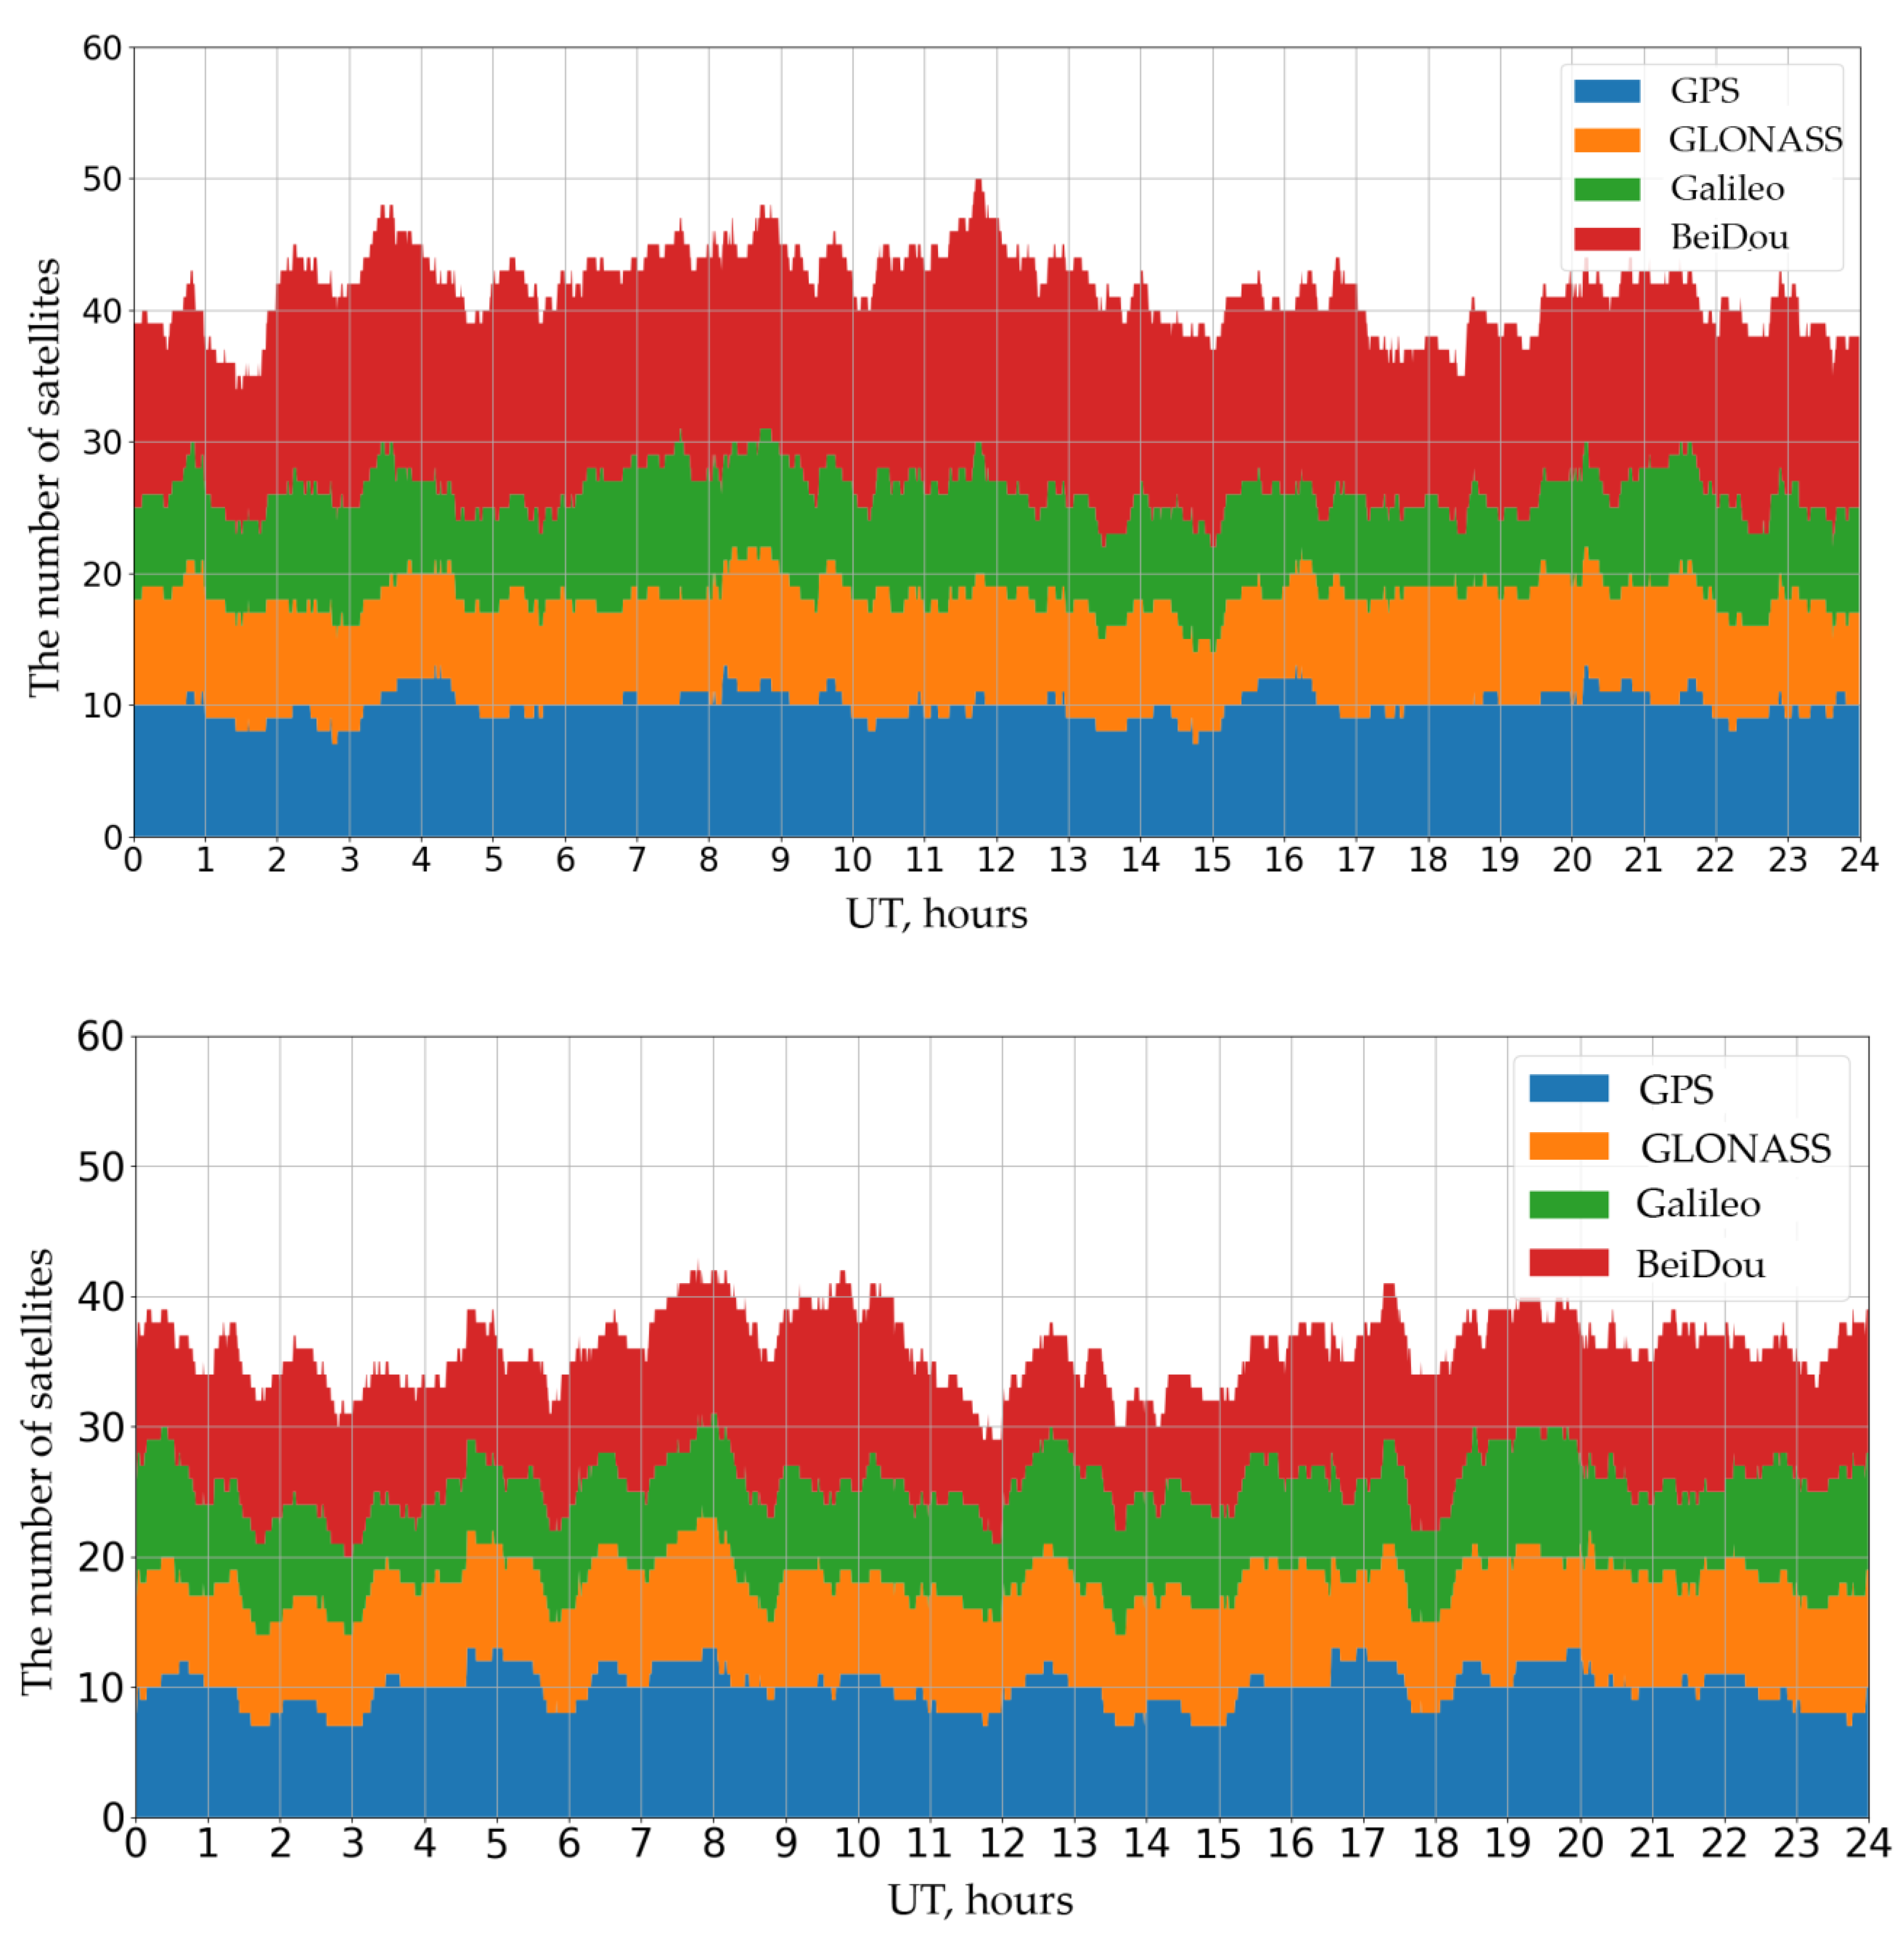
Figure 8 presents the dynamics for the number of the observed different system satellites as of 10 October 2020 in the Asian (52° N, 100° E) and in the American (52° N, −100° E) sectors: GPS (dark blue), GLONASS (orange), Galileo (green), and BeiDou/COMPASS (red). The data were obtained based on of the satellites’ positions derived from the ephemerids. To produce the figure, we superimposed the bars corresponding to the number of different system satellites one on top of the other, so that the maximal value represents the total number of satellites of all GNSS.
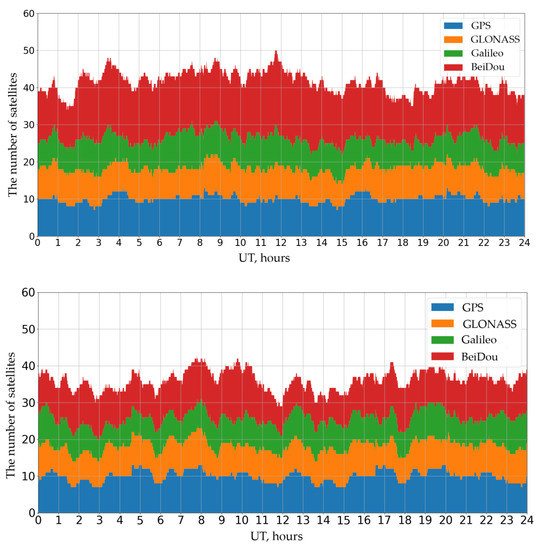
Figure 8.
Integrated number of observed satellites for different systems: GPS—dark blue, GLONASS—orange, Galileo—green, BeiDou—red. Top: data for the Asian sector (52°N, 100°E); bottom: the American sector (52° N, −100° E). By the results of the 10 October 2020 ephemerids.
The GPS, GLONASS, and Galileo constellations are sufficiently even and have a similar (20–30) number of satellites in the American and Asian sectors. The BeiDou constellation differs significantly: there are many more satellites observed in the Asian sector because BeiDou (BDS2 and BDS3) includes 8 GEO and 10 IGSO satellites [23].
In general, in the Asian region, one observes mostly the BeiDou satellites. Unfortunately, there are not many receivers recording the signals from those satellites observed in the world now. Most receivers receive signals only from the GPS and GLONASS. In the American sector (bottom panel), there are fewer BeiDou satellites than those of the GPS.
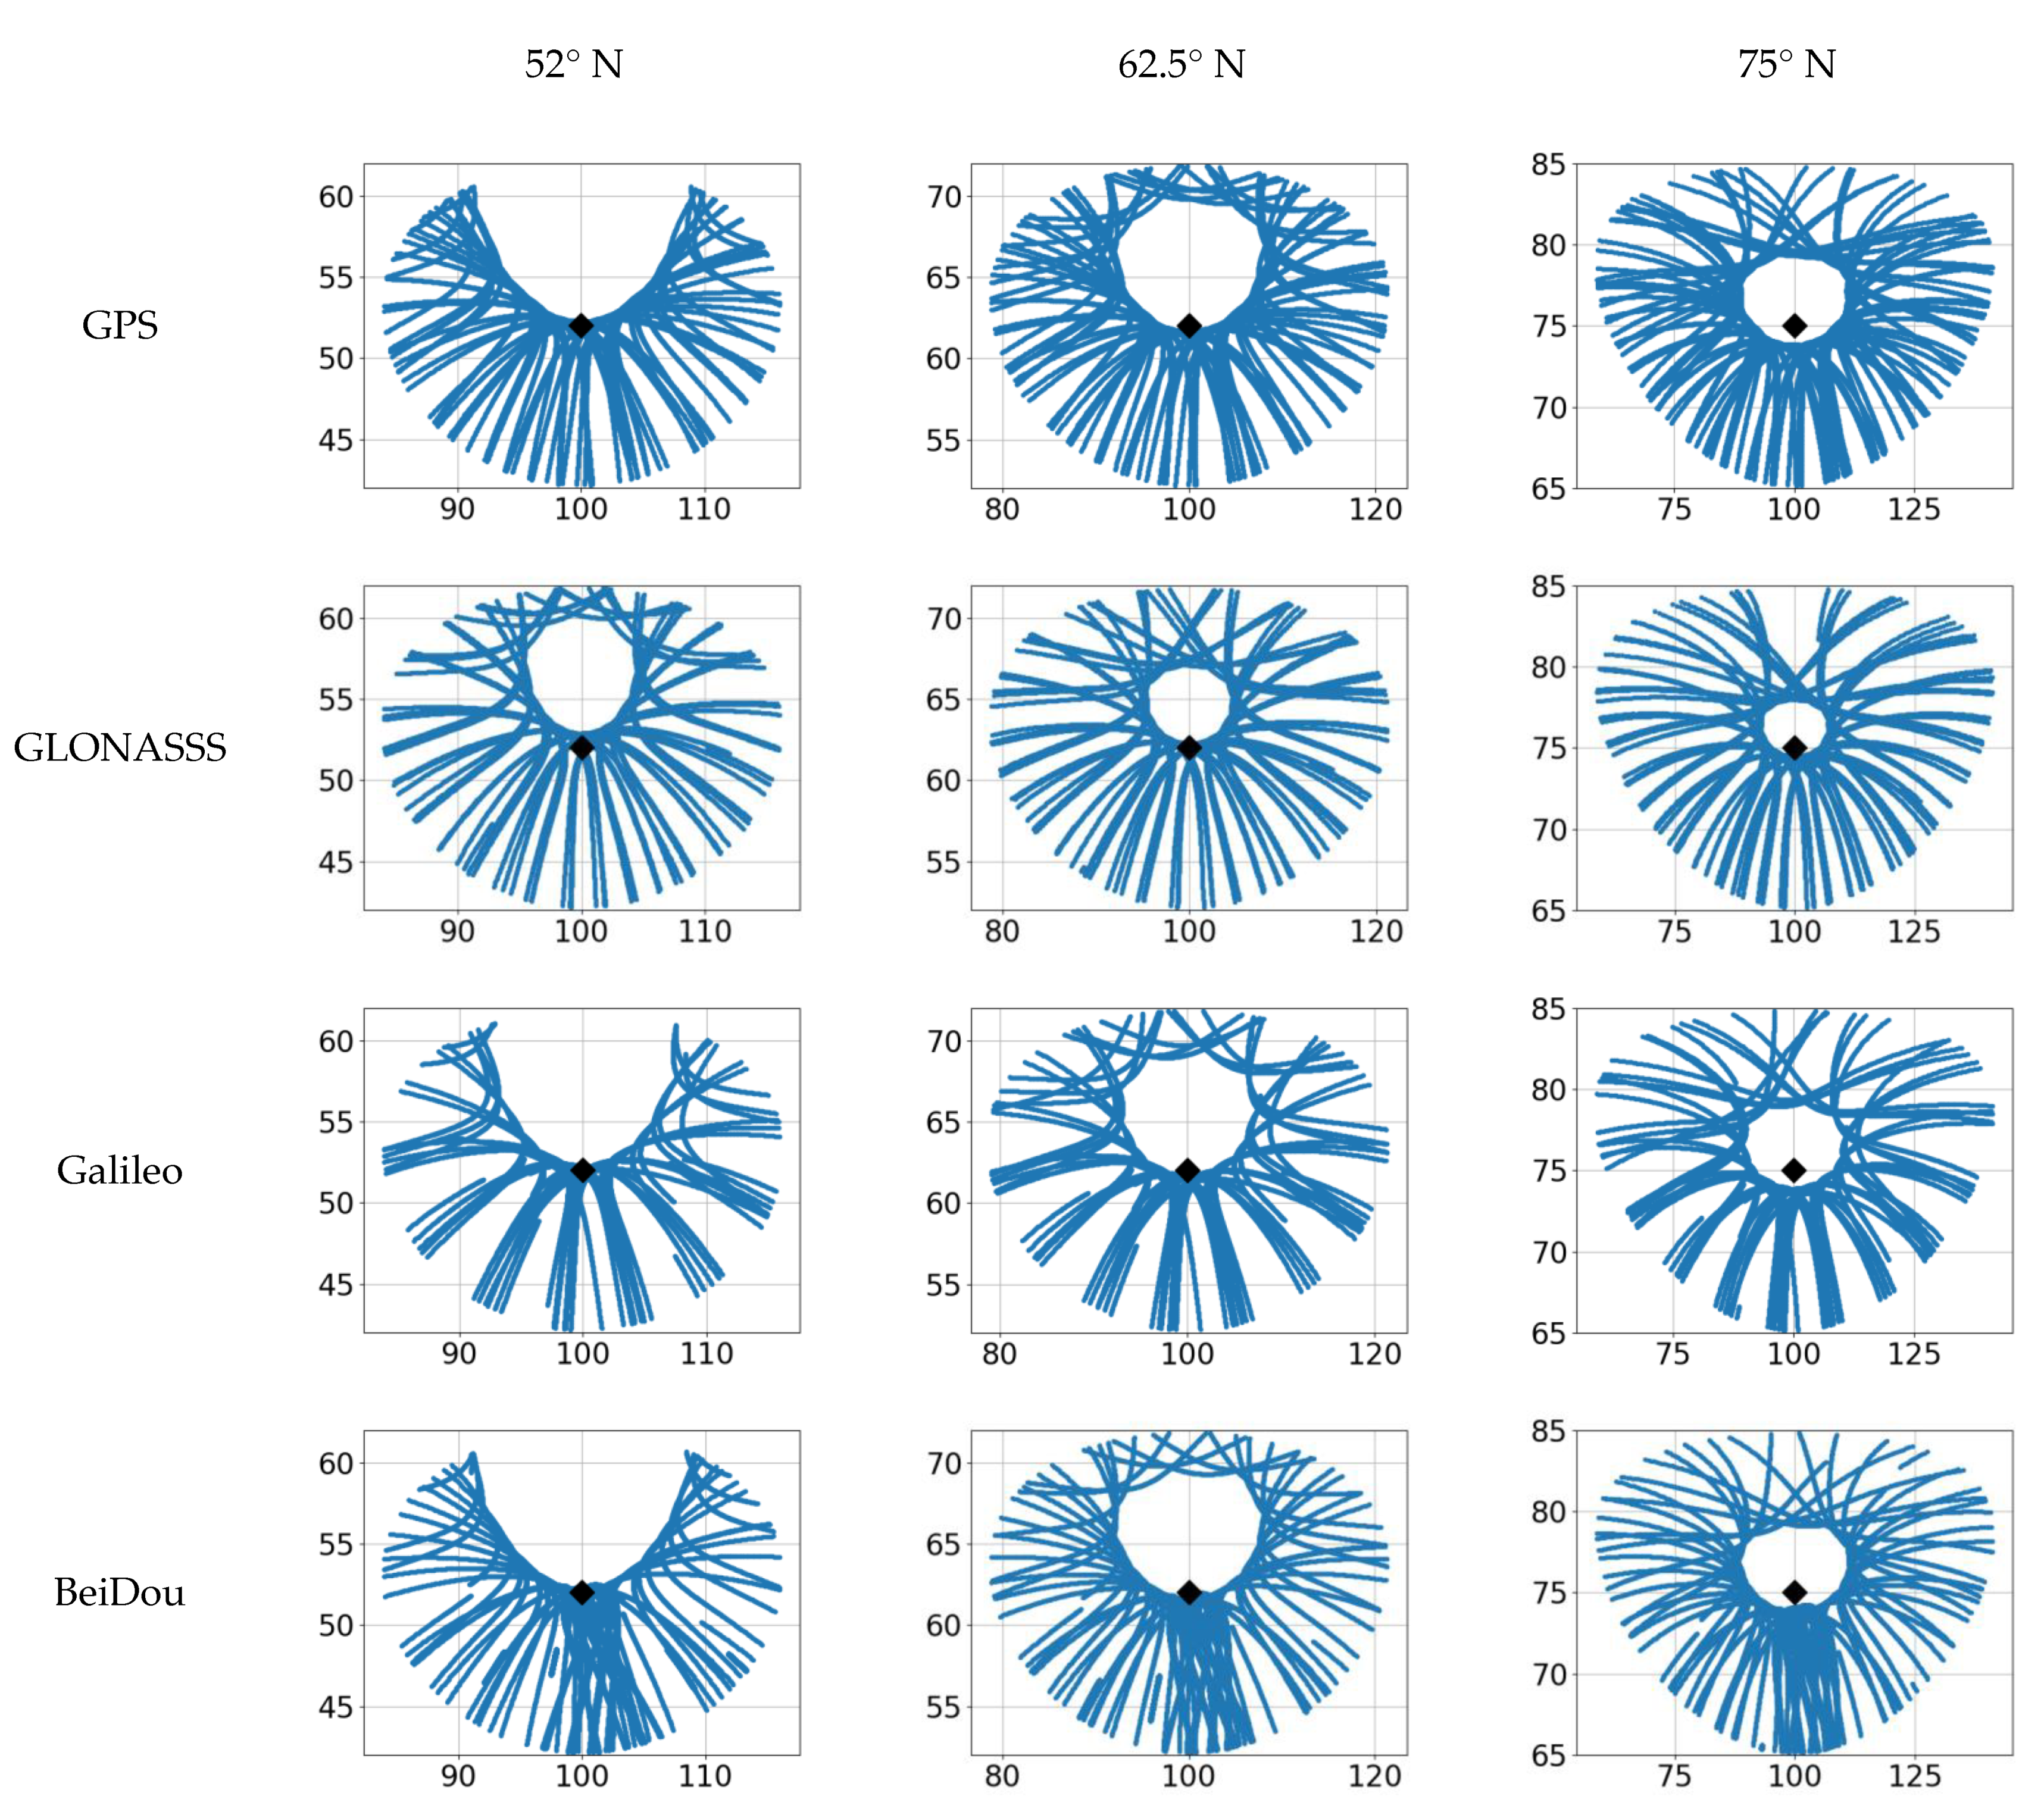
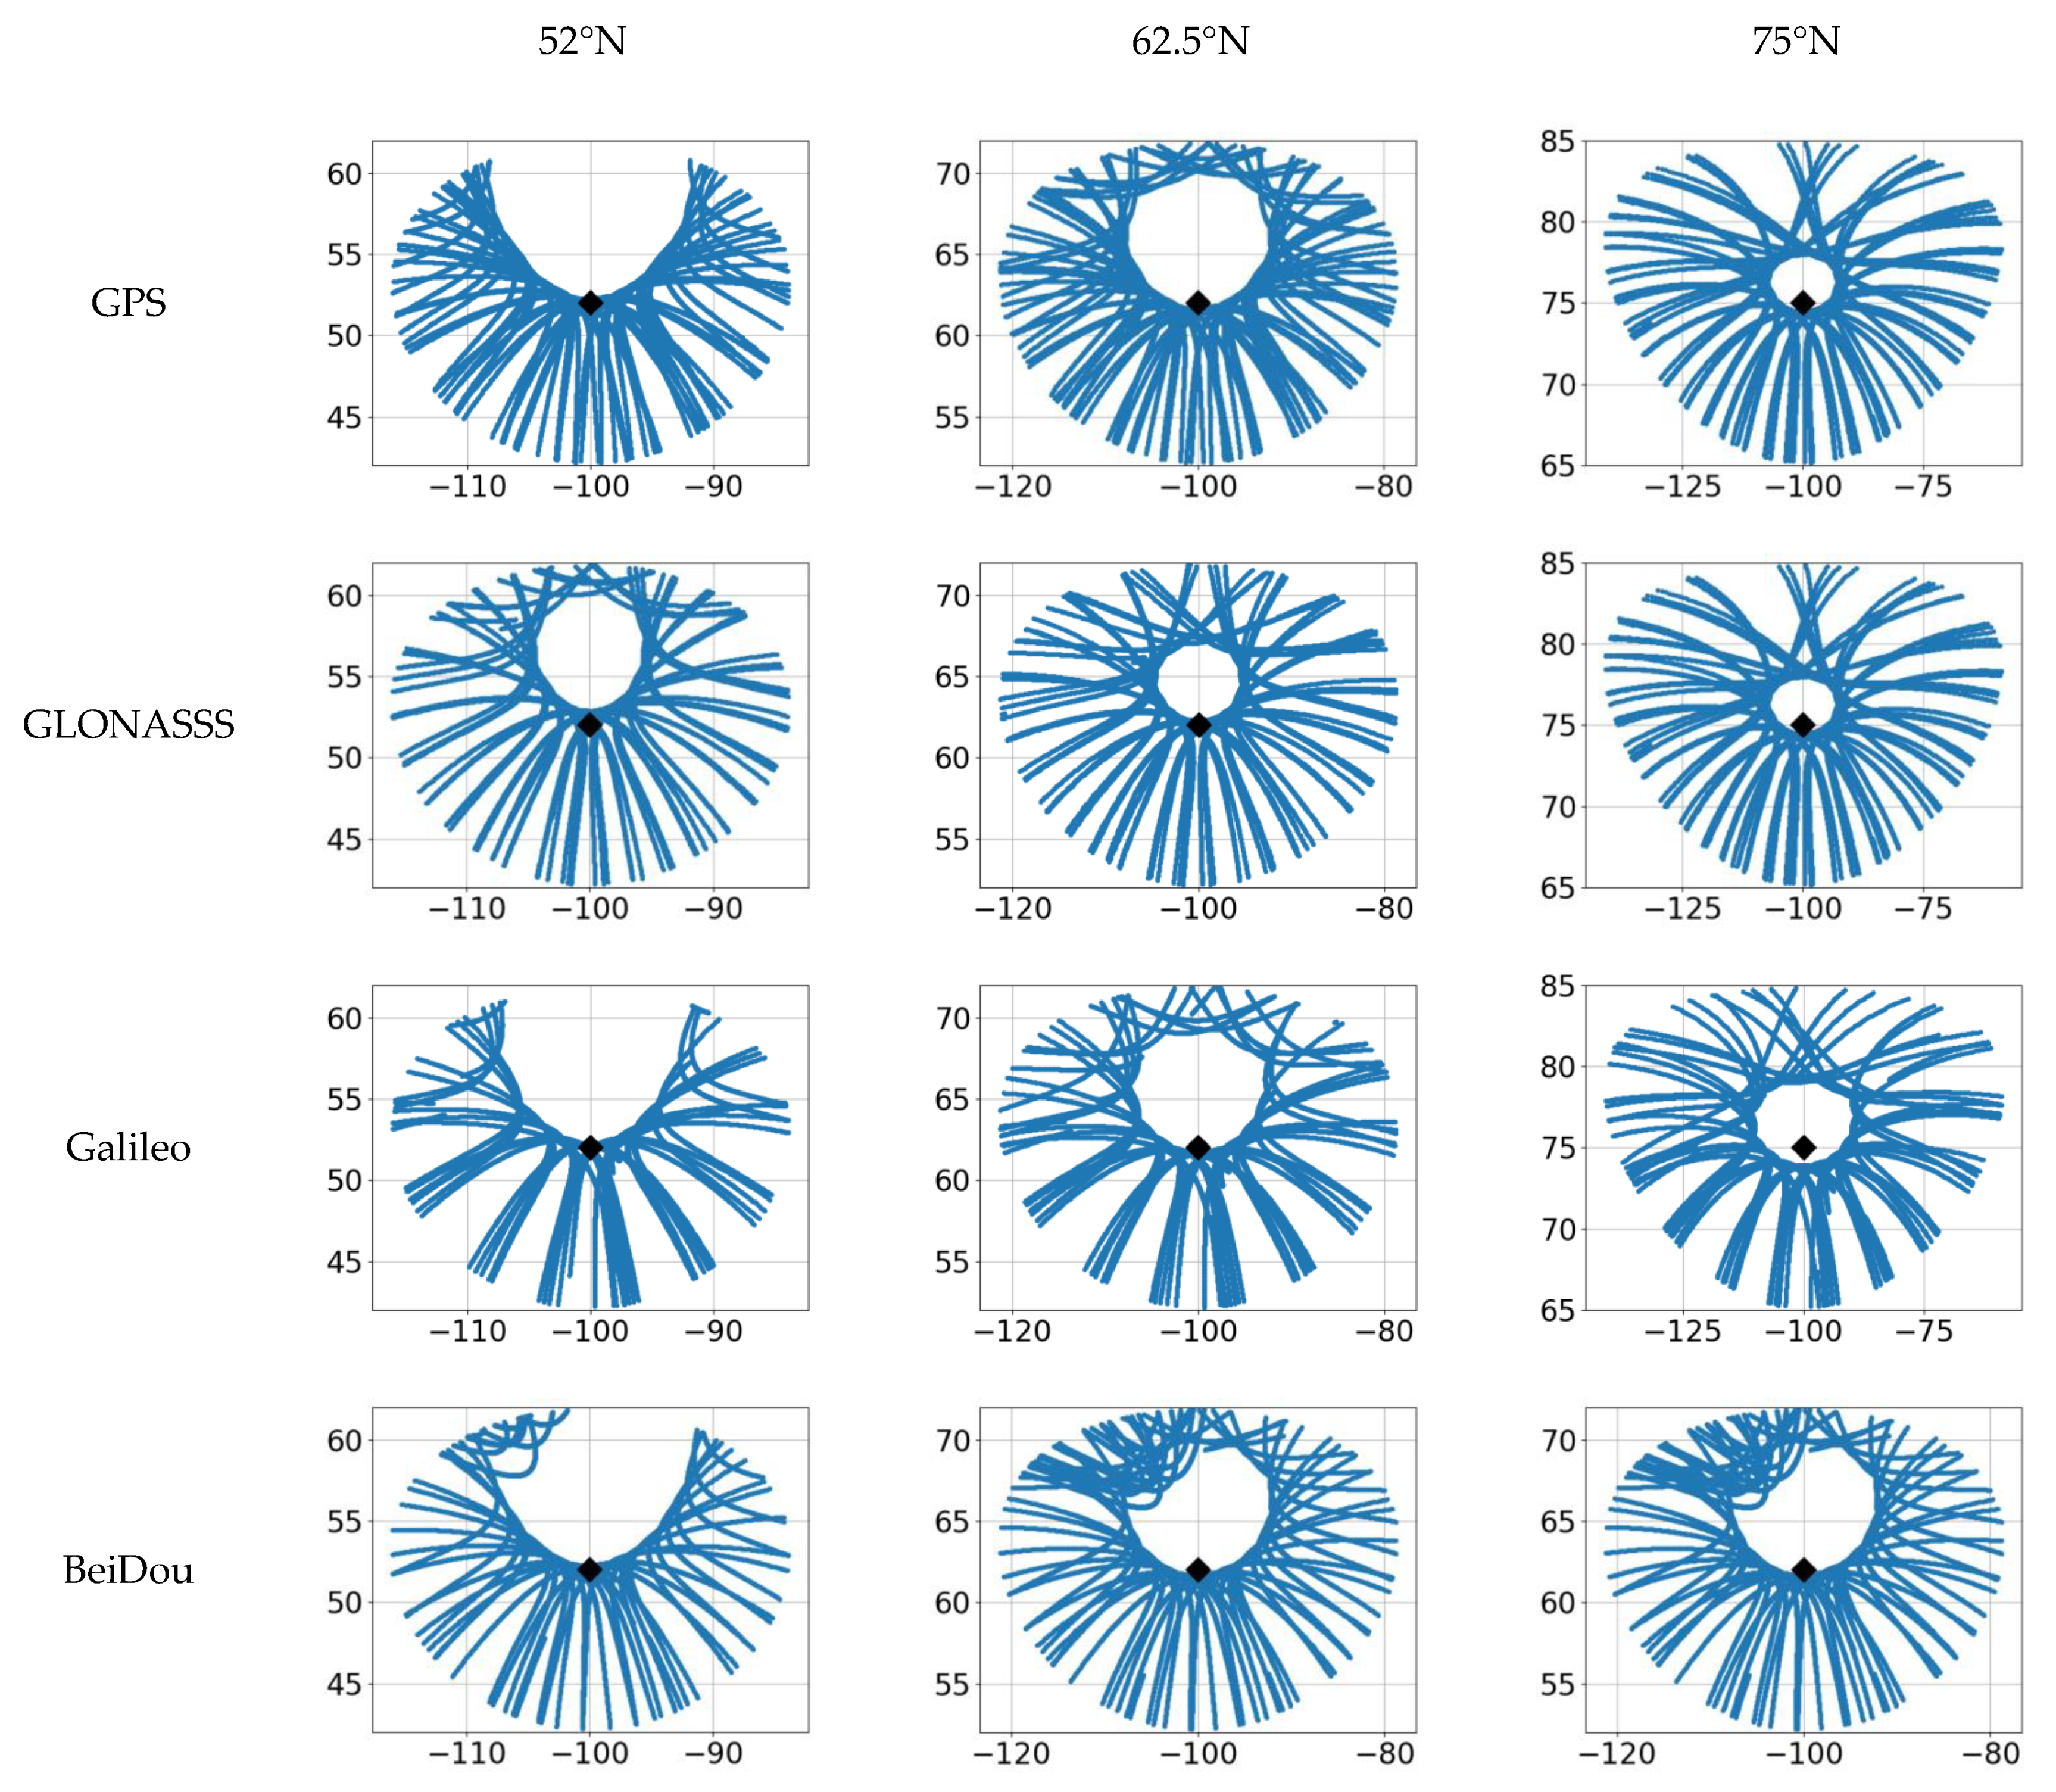
Figure 9 and Figure 10 present a comparison between the coverage areas by ionospheric points (intersection points of “satellite-receiver” beams and the sphere at the set height in the ionosphere) per day for GPS, GLONASS, Galileo, and BeiDou at different latitudes and longitudes. The ionospheric points were calculated for the 300-km height.
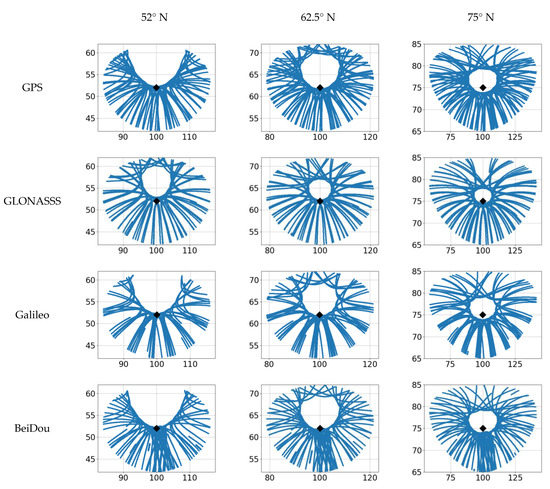
Figure 9.
Diurnal ionospheric points for GPS, GLONASS, Galileo, BeiDou (top to bottom). The rhomb marks the station position. The station longitude is 100° E. Left column: at 52.2° N, mid column: at 62.5° N, right column: at 75° N.
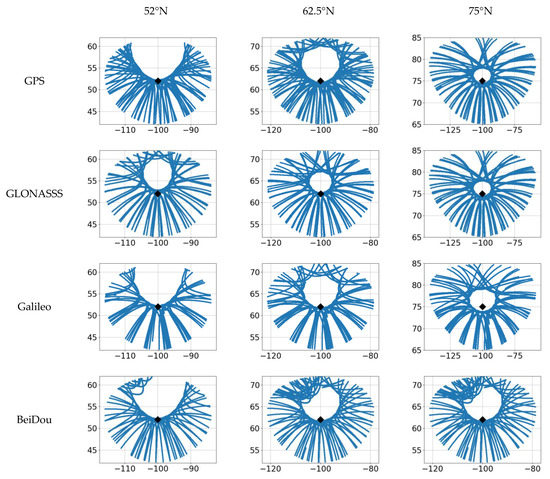
Figure 10.
Diurnal ionospheric points for GPS, GLONASS, Galileo, BeiDou (top to bottom). The rhomb marks the station position. The station longitude is −100° E. Left column: at 52.2° N, mid column: at 62.5° N, right column: at 75° N.
Figure 9 presents the −100° E longitude region (American sector), Figure 10 shows the 100° E longitude region (Asian sector). We used the 10 October 2020 data.
Using the GPS and GLONASS jointly enables all of the directions per day to be encompassed. An exception is the ring region north of the station, where there are no measurements.
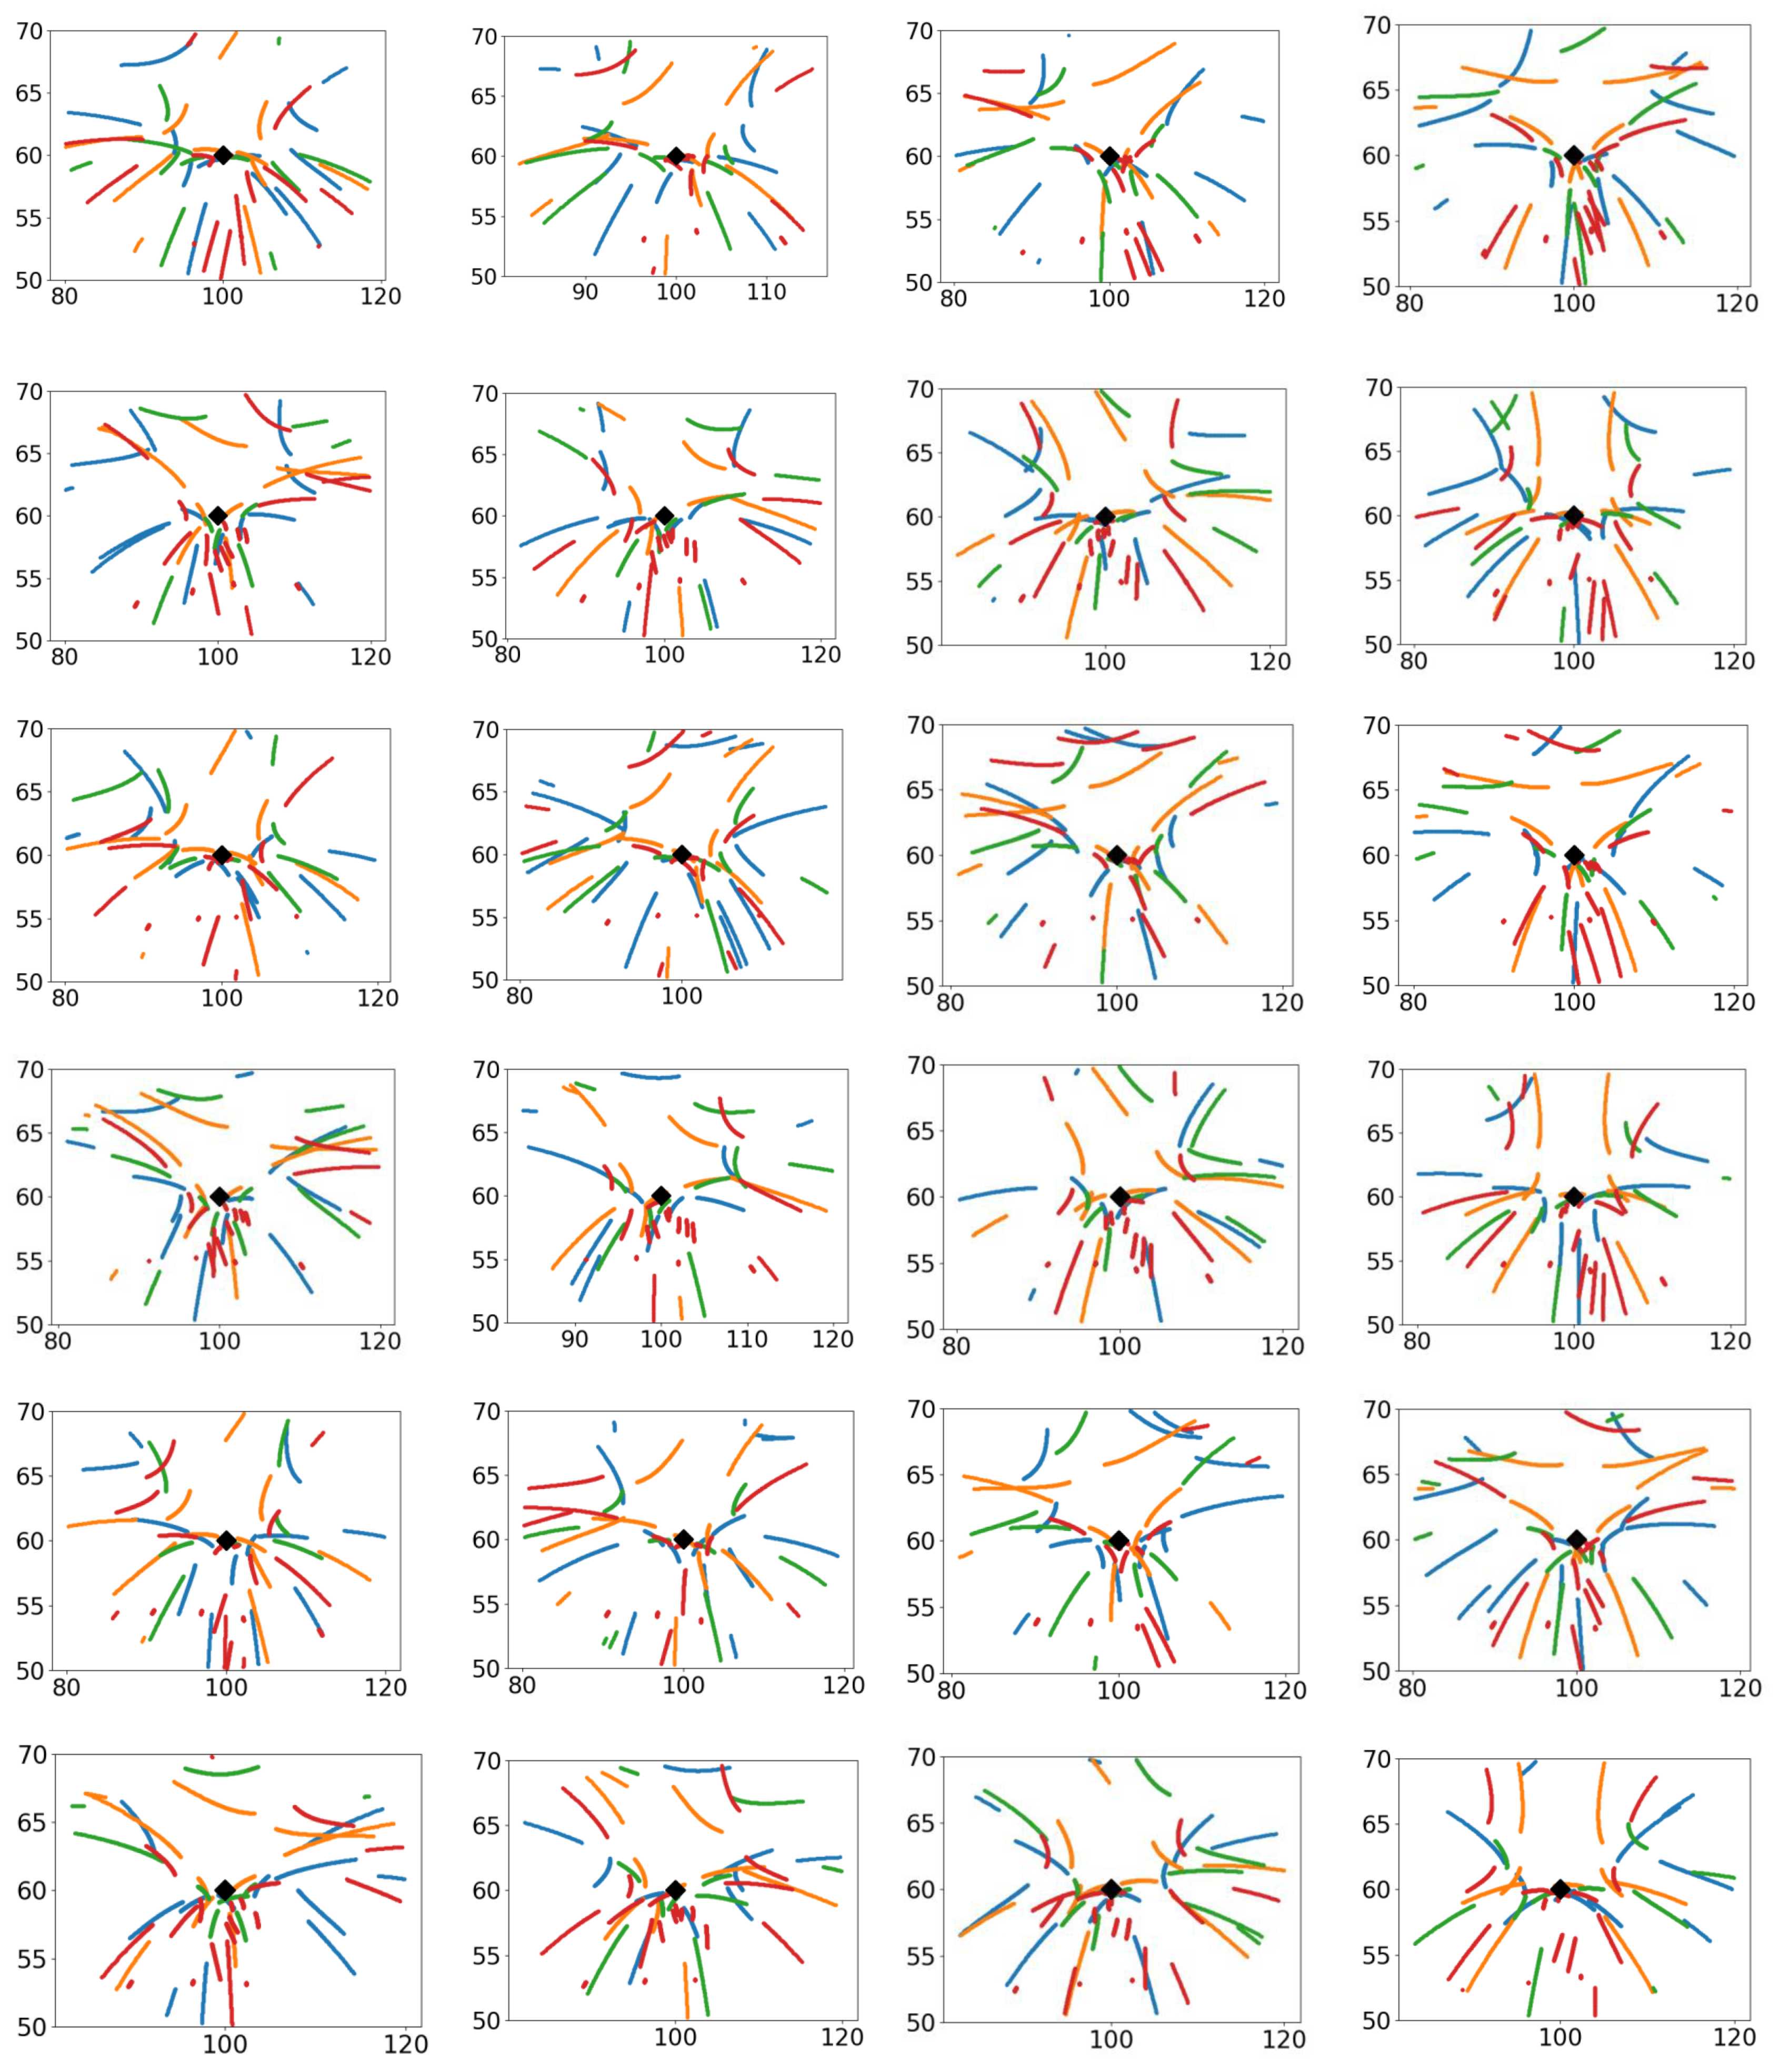
Figure 11 presents the ionospheric points for hour intervals per day: GPS (navy-blue dots), GLONASS (orange), Galileo (green), and BeiDou (red). The rhomb marks the station’s position (60° N, 100° E). The elevation cutoff equals 10°. We used the 10 October 2020 data.
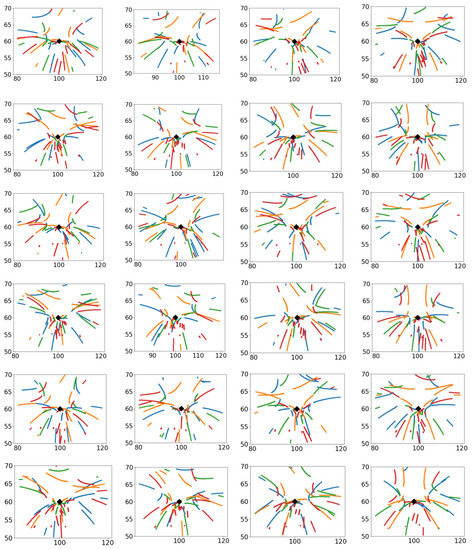
Figure 11.
Hourly ionospheric points per day. Dark blue dots signify GPS, orange—GLONASS, green—Galileo, red –BeiDou. The rhomb marks the station position.
Despite the presence of a blind sector (see Figure 9 and Figure 10), the ionospheric points are distributed sufficiently smoothly, even for hour intervals (Figure 10). Moreover, all of the directions (including the northern) are present in their distribution. Therefore, one may expect that a joint use of the GNSS data enables the measurements of ionospheric parameters both in the northern and in the southern directions to be obtained.
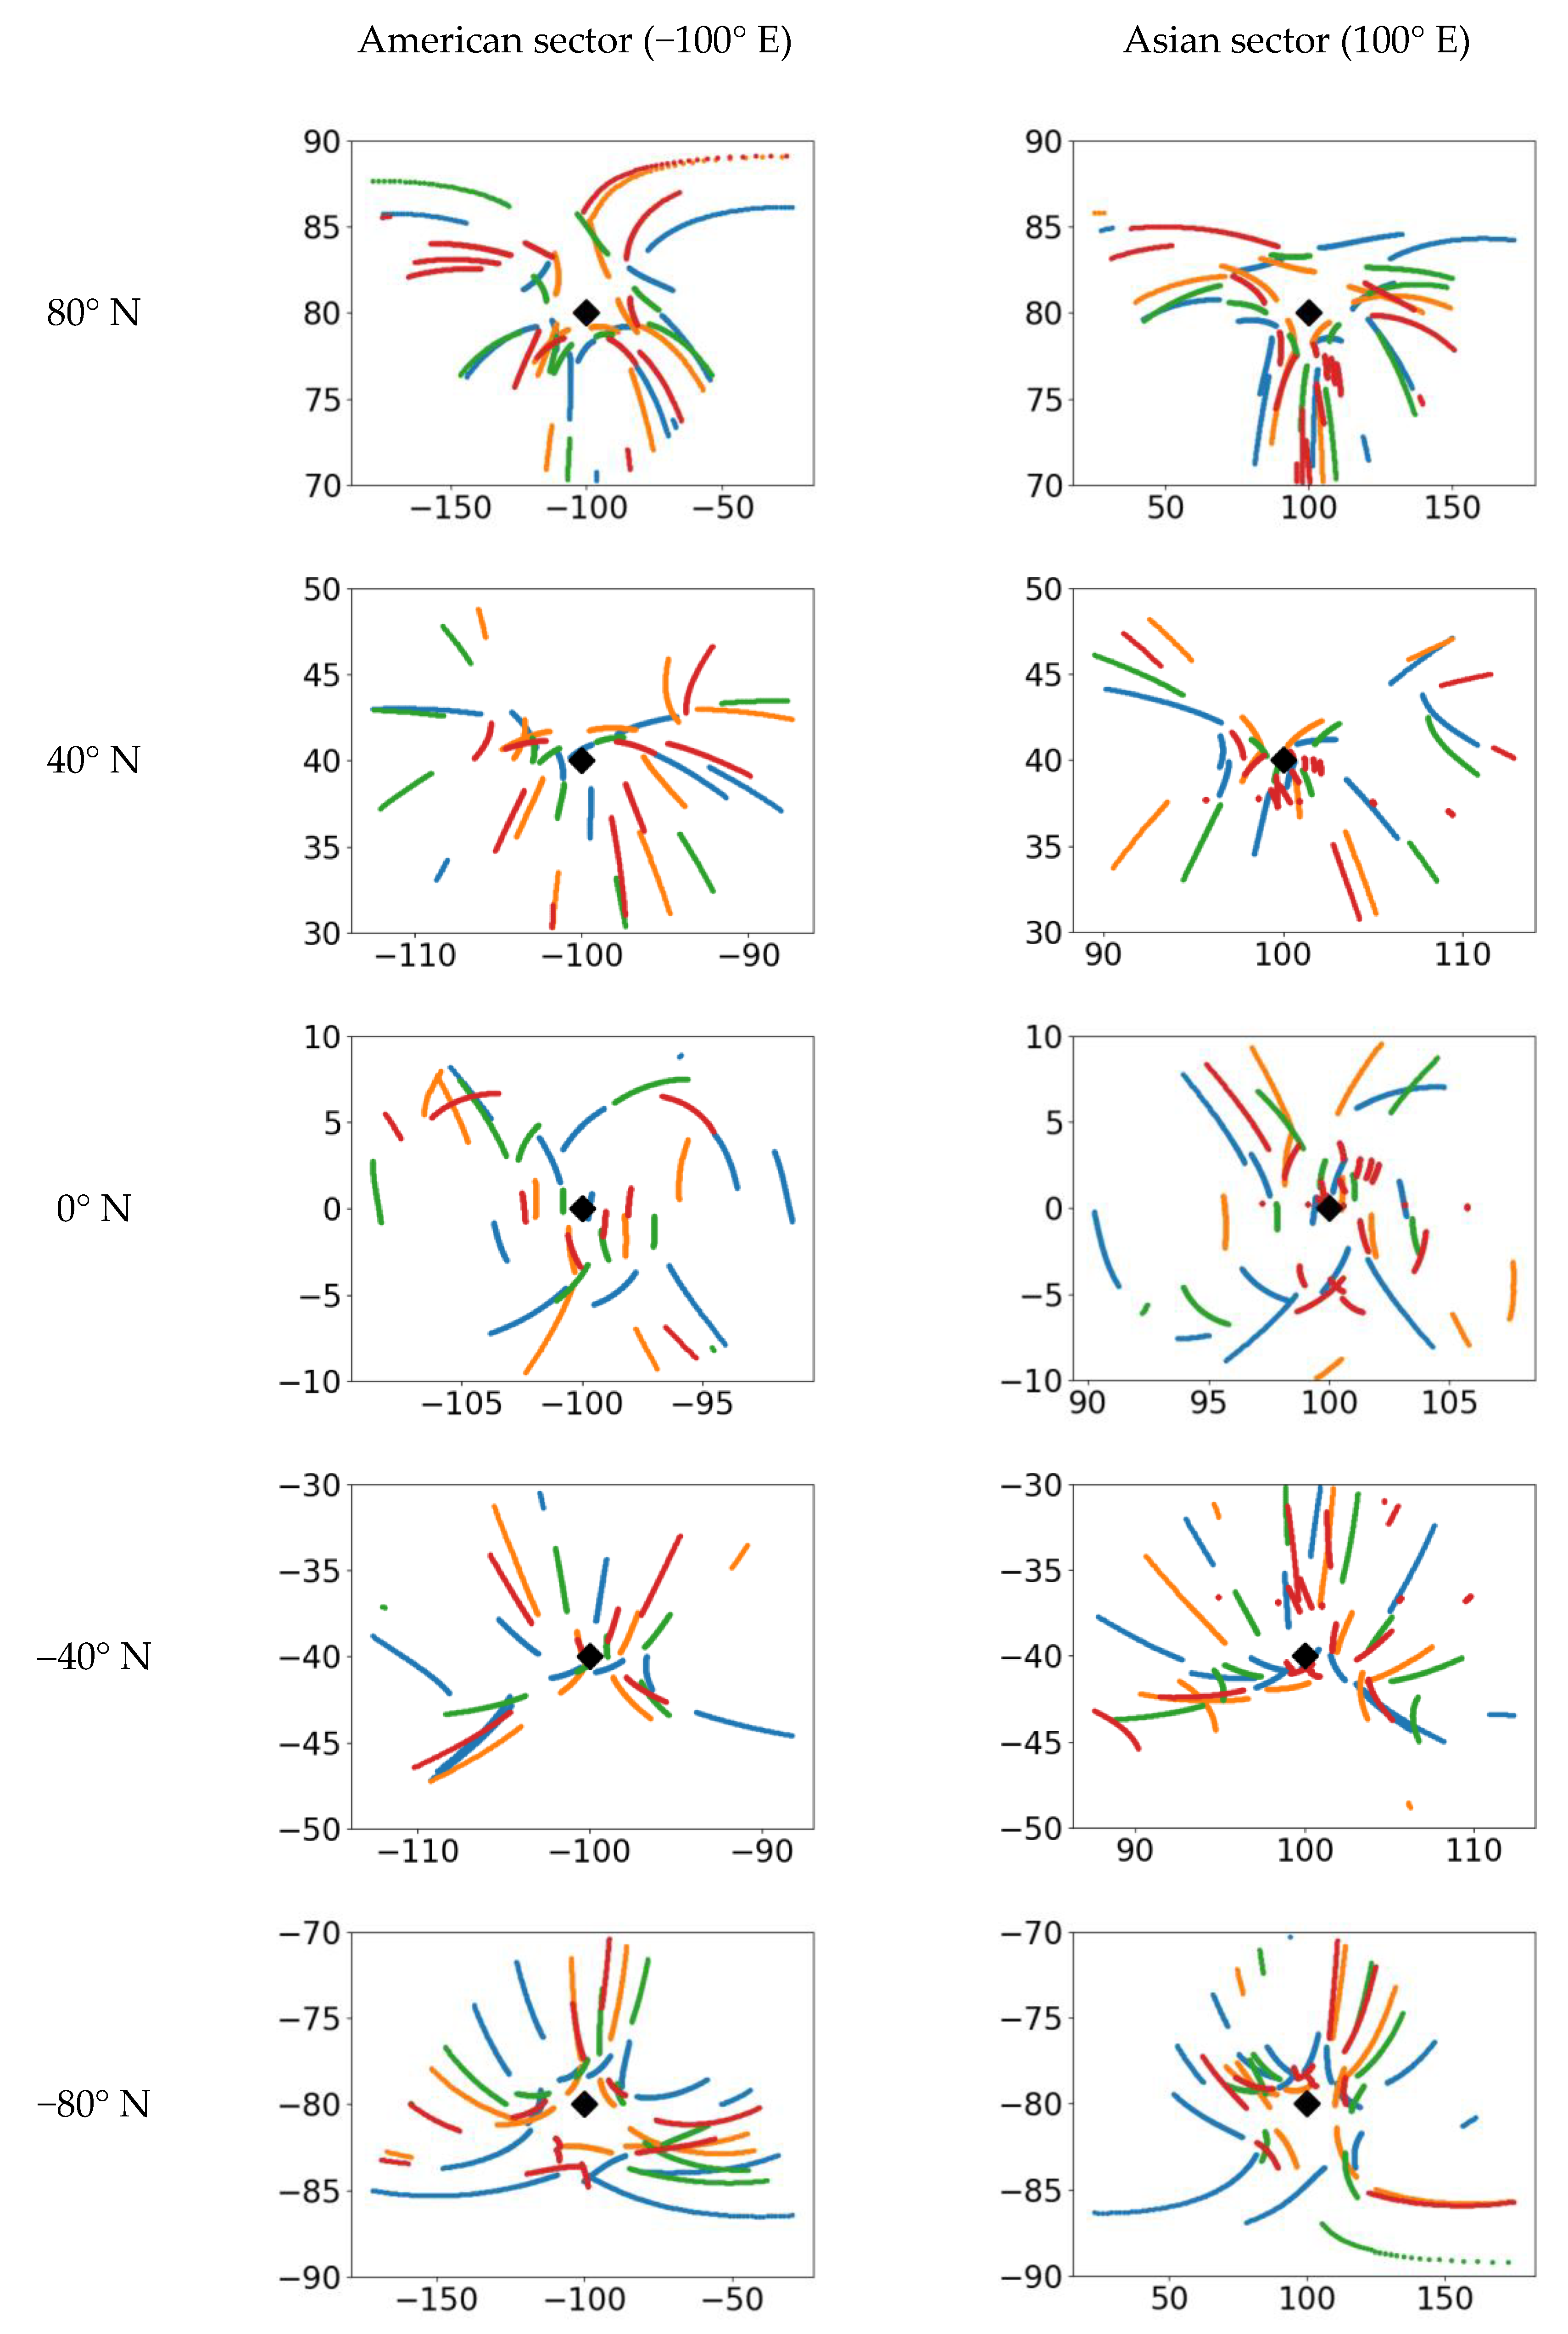
The good geometry enables us to observe in different directions from the station both in the American and in the Asian sectors at different latitudes. Figure 12 shows the ionospheric points within the 12–13 UT interval for the two sectors. We used the 10 October 2020 data. It is thus shown that GNSS provide a good coverage when sounding in different regions of the globe.
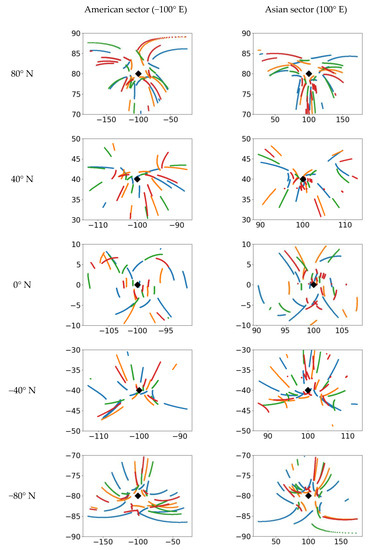
Figure 12.
Ionospheric points within 12–13 UT 10 October 2020 at different latitudes in the American (mid column, −100° E) and in the Asian (right column, 100° E) sectors. Dark blue points signify GPS, orange—GLONASS, green—Galileo, red—BeiDou. The black rhomb marks the station position. The station latitude is indicated on the left.
6.3. Convergence Time
An important parameter is the solution convergence time. This term differs from the well-known «cold mode»—the time which a receiver need to start satellite tracking and provide coordinates. The term «cold mode» is related to a necessity for the receiver to search for navigation satellites after a long-term shutoff. The characteristic time for the “cold mode” is <1 min for modern receivers.
To correctly estimate the receiver’s DCBs takes a considerably longer time. In the literature, as a rule, researchers use diurnal data for analysis [7]. However, no one estimates the convergence time (the term often used in navigation). Here, we can use the term the «convergence mode» to describe the transition period between powering the receiver and retrieving data with necessary accuracy.
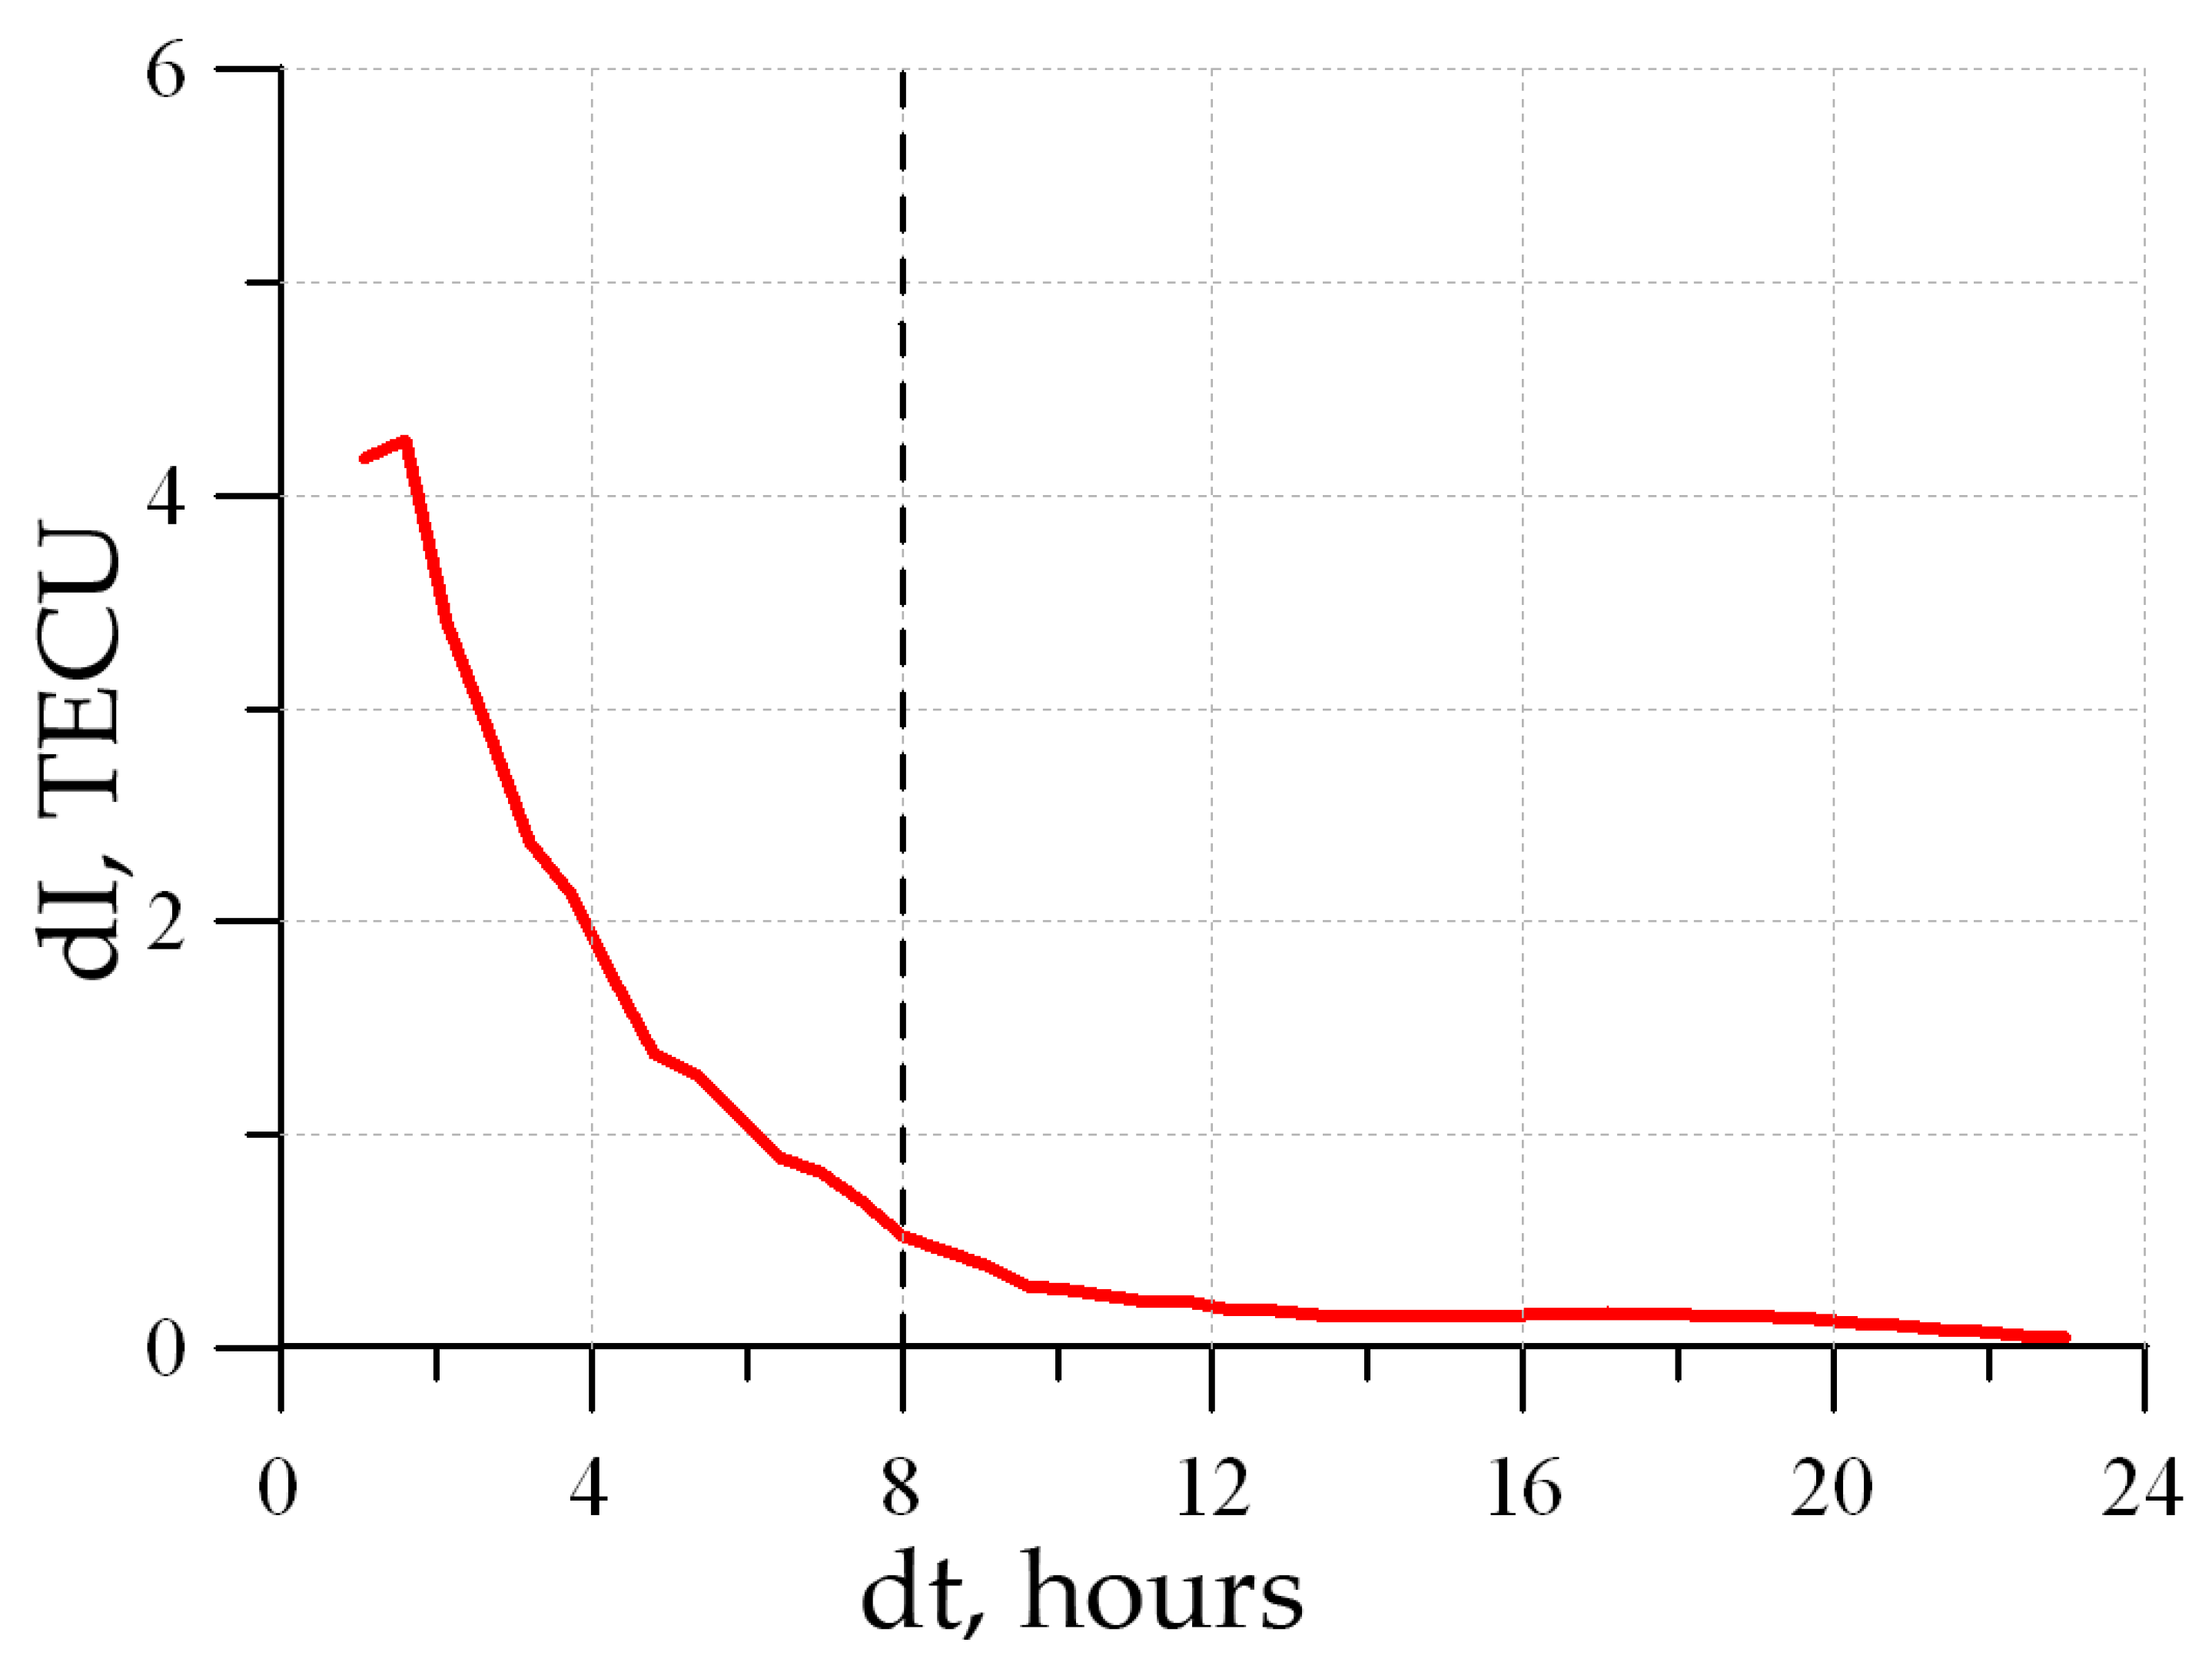
To estimate the convergence mode duration, we simulated a GNSS receiver operation under conditions of powering. We calculated the solution using the full-day data, as well as by using the data accumulated for shorter time intervals dt. Furthermore, we found the difference between the full-day solution taken as reference and the restricted-interval solution. We performed calculations over intervals of different length to obtain solution quality dependence on interval length.
The statistics involves 1 month of observational data. Figure 13 presents the calculation results. We used the GPS/GLONASS data when deploying the suite at TORY (51.8° N, 103.1° E). The sampling rate for group and phase measurements of the oblique TEC was 30 s. The restricted-interval length resolution was 1 h, i.e., we calculated errors after 1 h, 2 h, 3 h, etc. upon “powering” the receiver. Powering is in quotes since this was simulated: the data were continuously collected; however, only part of the data go to absolute TEC calculations.
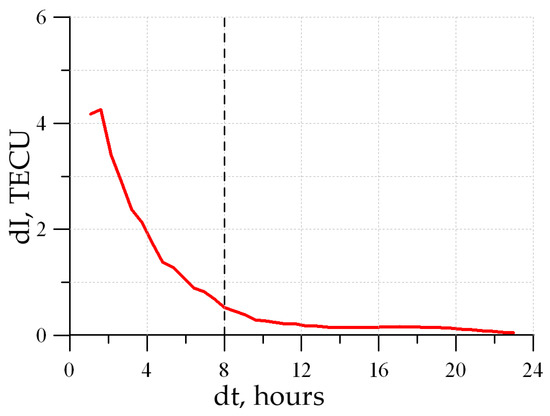
Figure 13.
TEC determination error at different times, relative to the receiver’s first start. The dotted line marks the reasonable time for the operation start after the receiver’s “cold” startup (convergence time).
Figure 13 shows that, directly after powering the receiver, the error was ~4 TECU. This error almost monotonically decreased and, after 8 h upon powering the receiver, it was already ~0.5 TECU (at the measurement error level). After 9 h, the error was <0.25 TECU and asymptotically approached the initial solution. This analysis enables the convergence mode time of 8 h to be estimated.
6.4. GNSS Receiver Interruption Maximal Time
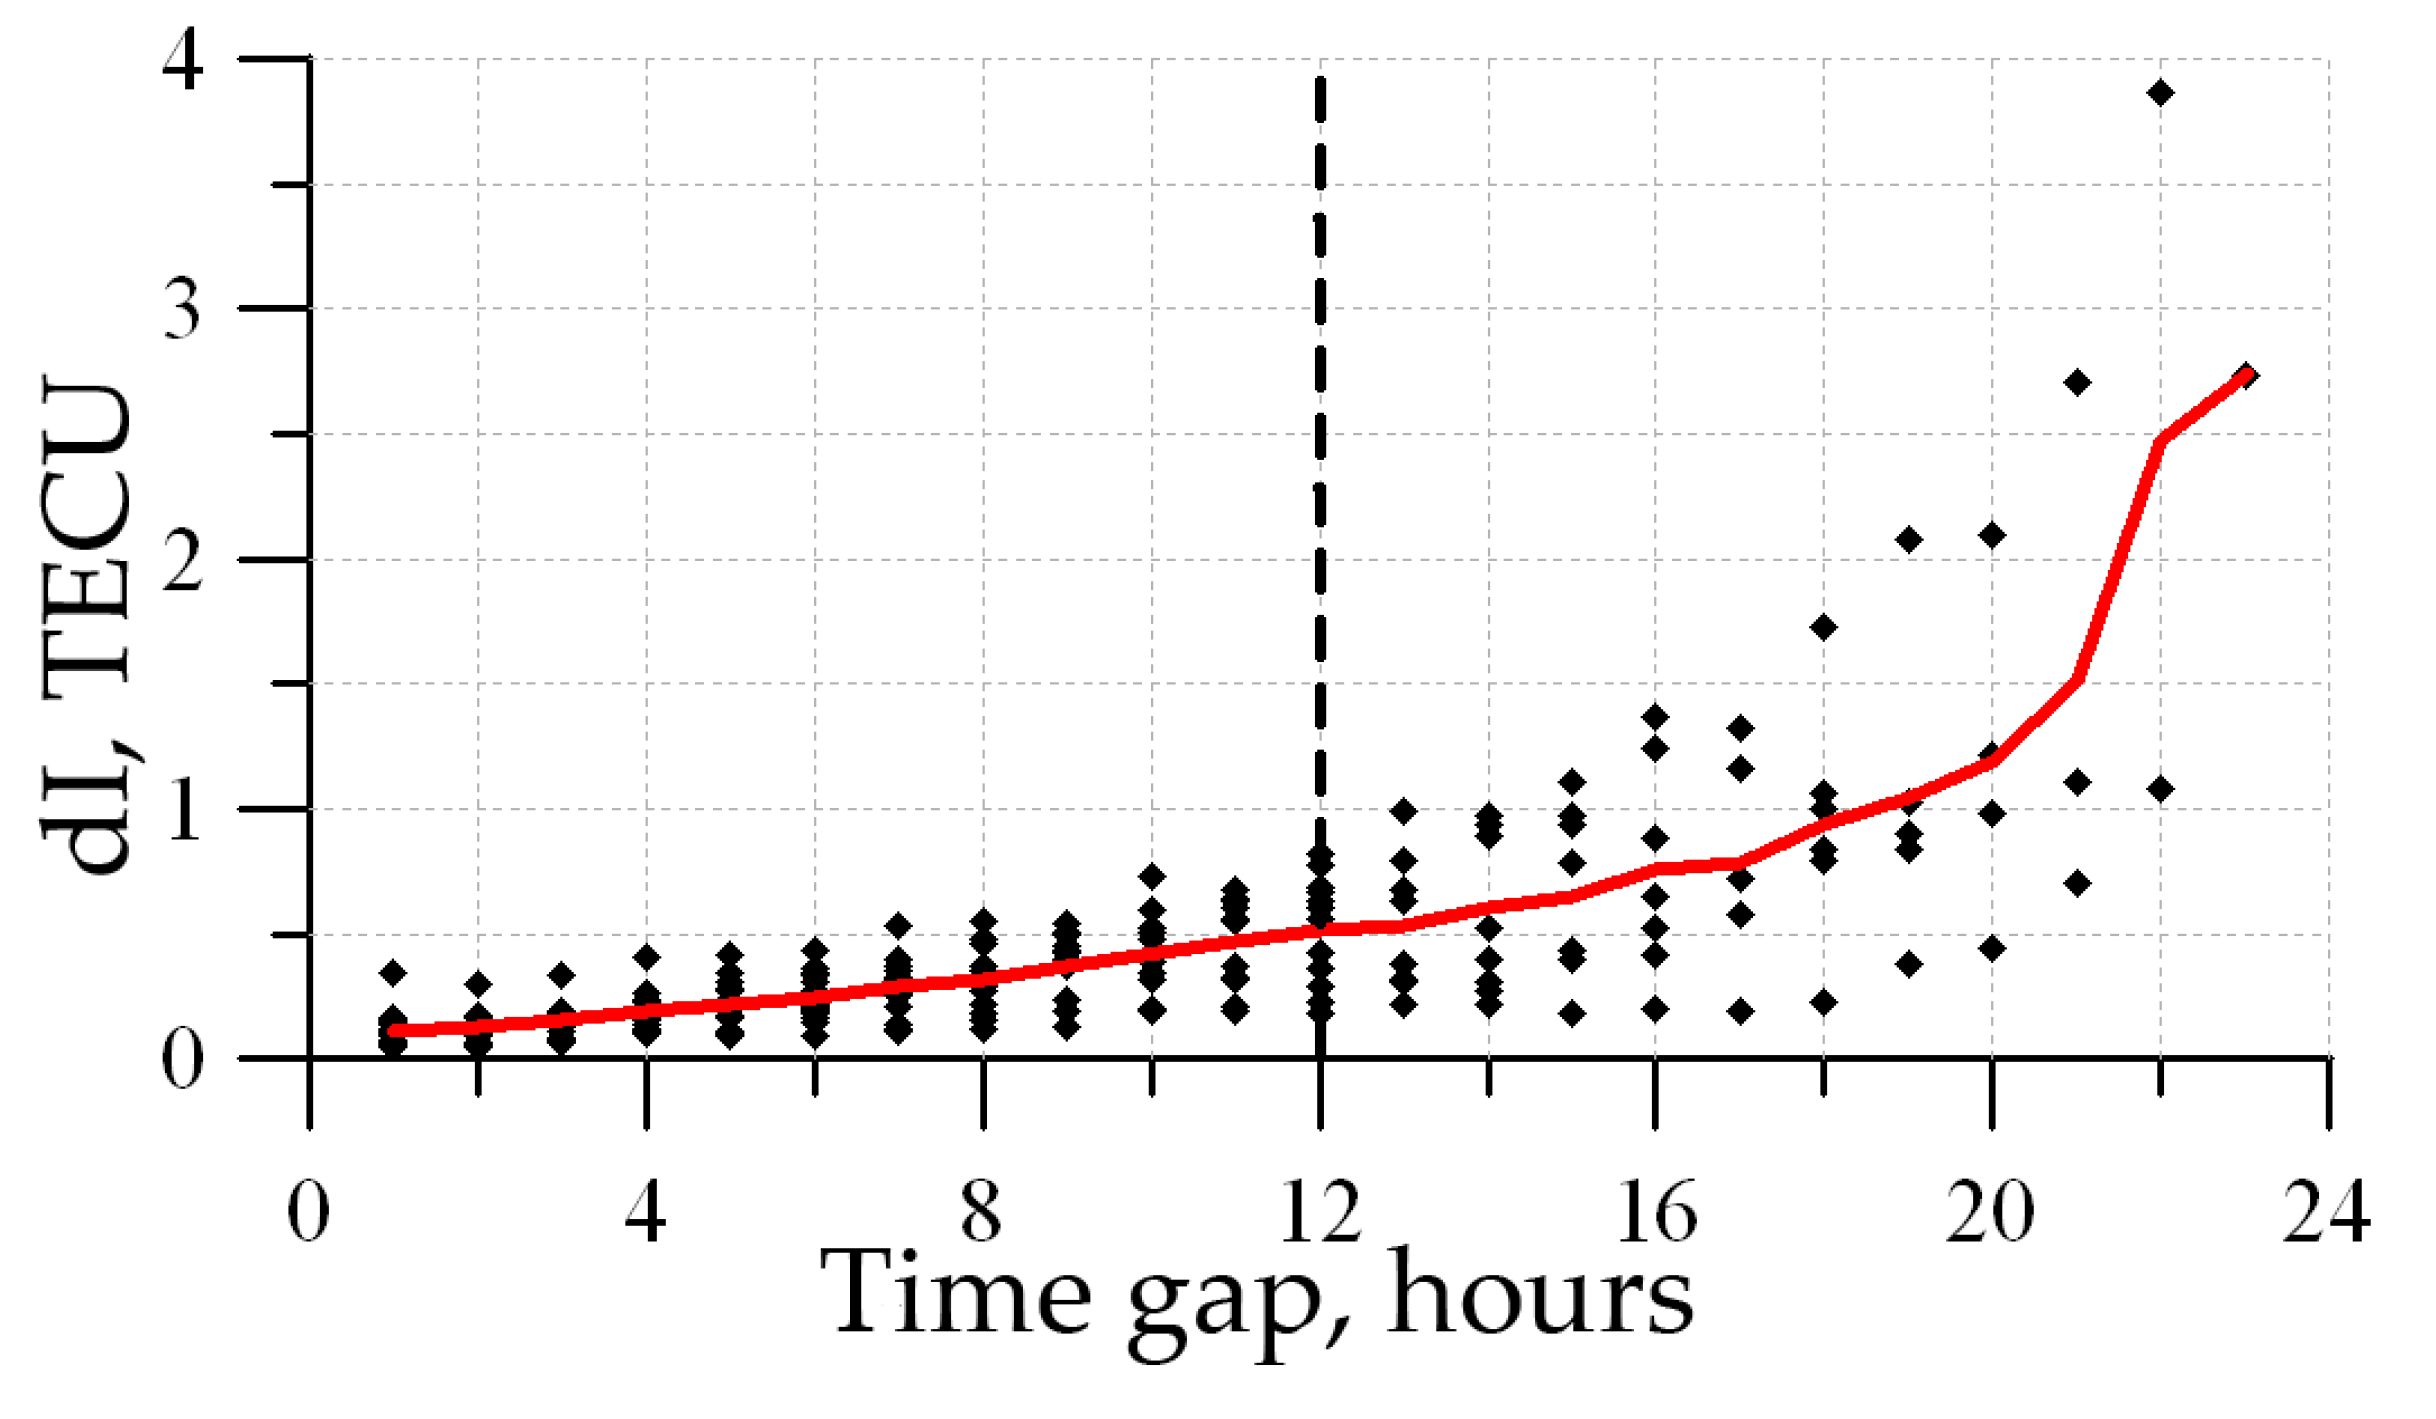
Another relevant value related to the suite’s functionality is the maximal time of the equipment short-term cutoff, or interruption (due to blackout, navigation system, or receiver malfunctions), at which the former solution quality persists, and the receiver does not transfer to the convergence mode (error does not exceed ~0.5 TECU). Furthermore, we use the term «run-mode retention time».
The run-mode retention time is caused by the variation in the ionosphere parameters that are a part of the estimation model by the presence of the experimental data (obtained earlier) necessary for the analysis as well as by changes in the receiver DCBs.
We assume that this time significantly depends on the equipment type and on the features of the receiver installation because DCBs may depend on both [24].
To estimate the run-mode retention time, we simulated the GNSS receiver operation within different cutoff times. We analyzed the suite deployed at TORY (51.8° N, 103.1° E), by using the statistics for 1 month. We imitated the input miss for the time dt. For this purpose, we used full-day data, although we also considered using only a portion of data, admitting that the receiver was out of operation for a long time dt.
The TEC measurement deviation (upon powering) from the complete data features an ability to retain the operation mode. The input resolution for group and phase measurements of the oblique TEC is 30 sec. The calculations were performed at the 1-h resolution. Figure 14 presents the results.
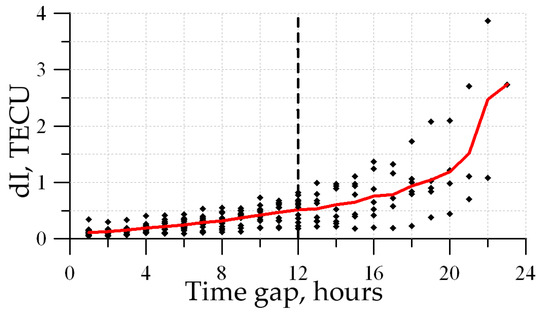
Figure 14.
TEC determination error at different times, relative to the receiver’s first start. The dotted line marks the admissible interval, over which the suite retains the run mode.
The latter shows that, as the interruption time increases, the error starts growing monotonically. At the <8-h interruption, the error value does not exceed (for separate measurements) 0.5 TECU. Within 15 h, its value does not surpass 1 TECU. The error dramatic growth, as the interruption increases, is related to a small number of measurements.
Based on the above, we conclude that the run-mode retention time for the entire system equals 8 h.
7. Recovering TEC and Maximum Usable Frequency for Oblique Paths
The data produced by the suite may be used to correct ionospheric models [25] and to estimate the radio-channel ionospheric parameters [26]. Herewith, one should remember that GNSSs have their own limitations for such goals [27].
We implemented the method for calculating the maximum usable frequency (MUF) for oblique paths. For that purpose, we held the 2018 Feb week campaign. The system was deployed near Irkutsk (ISTP).
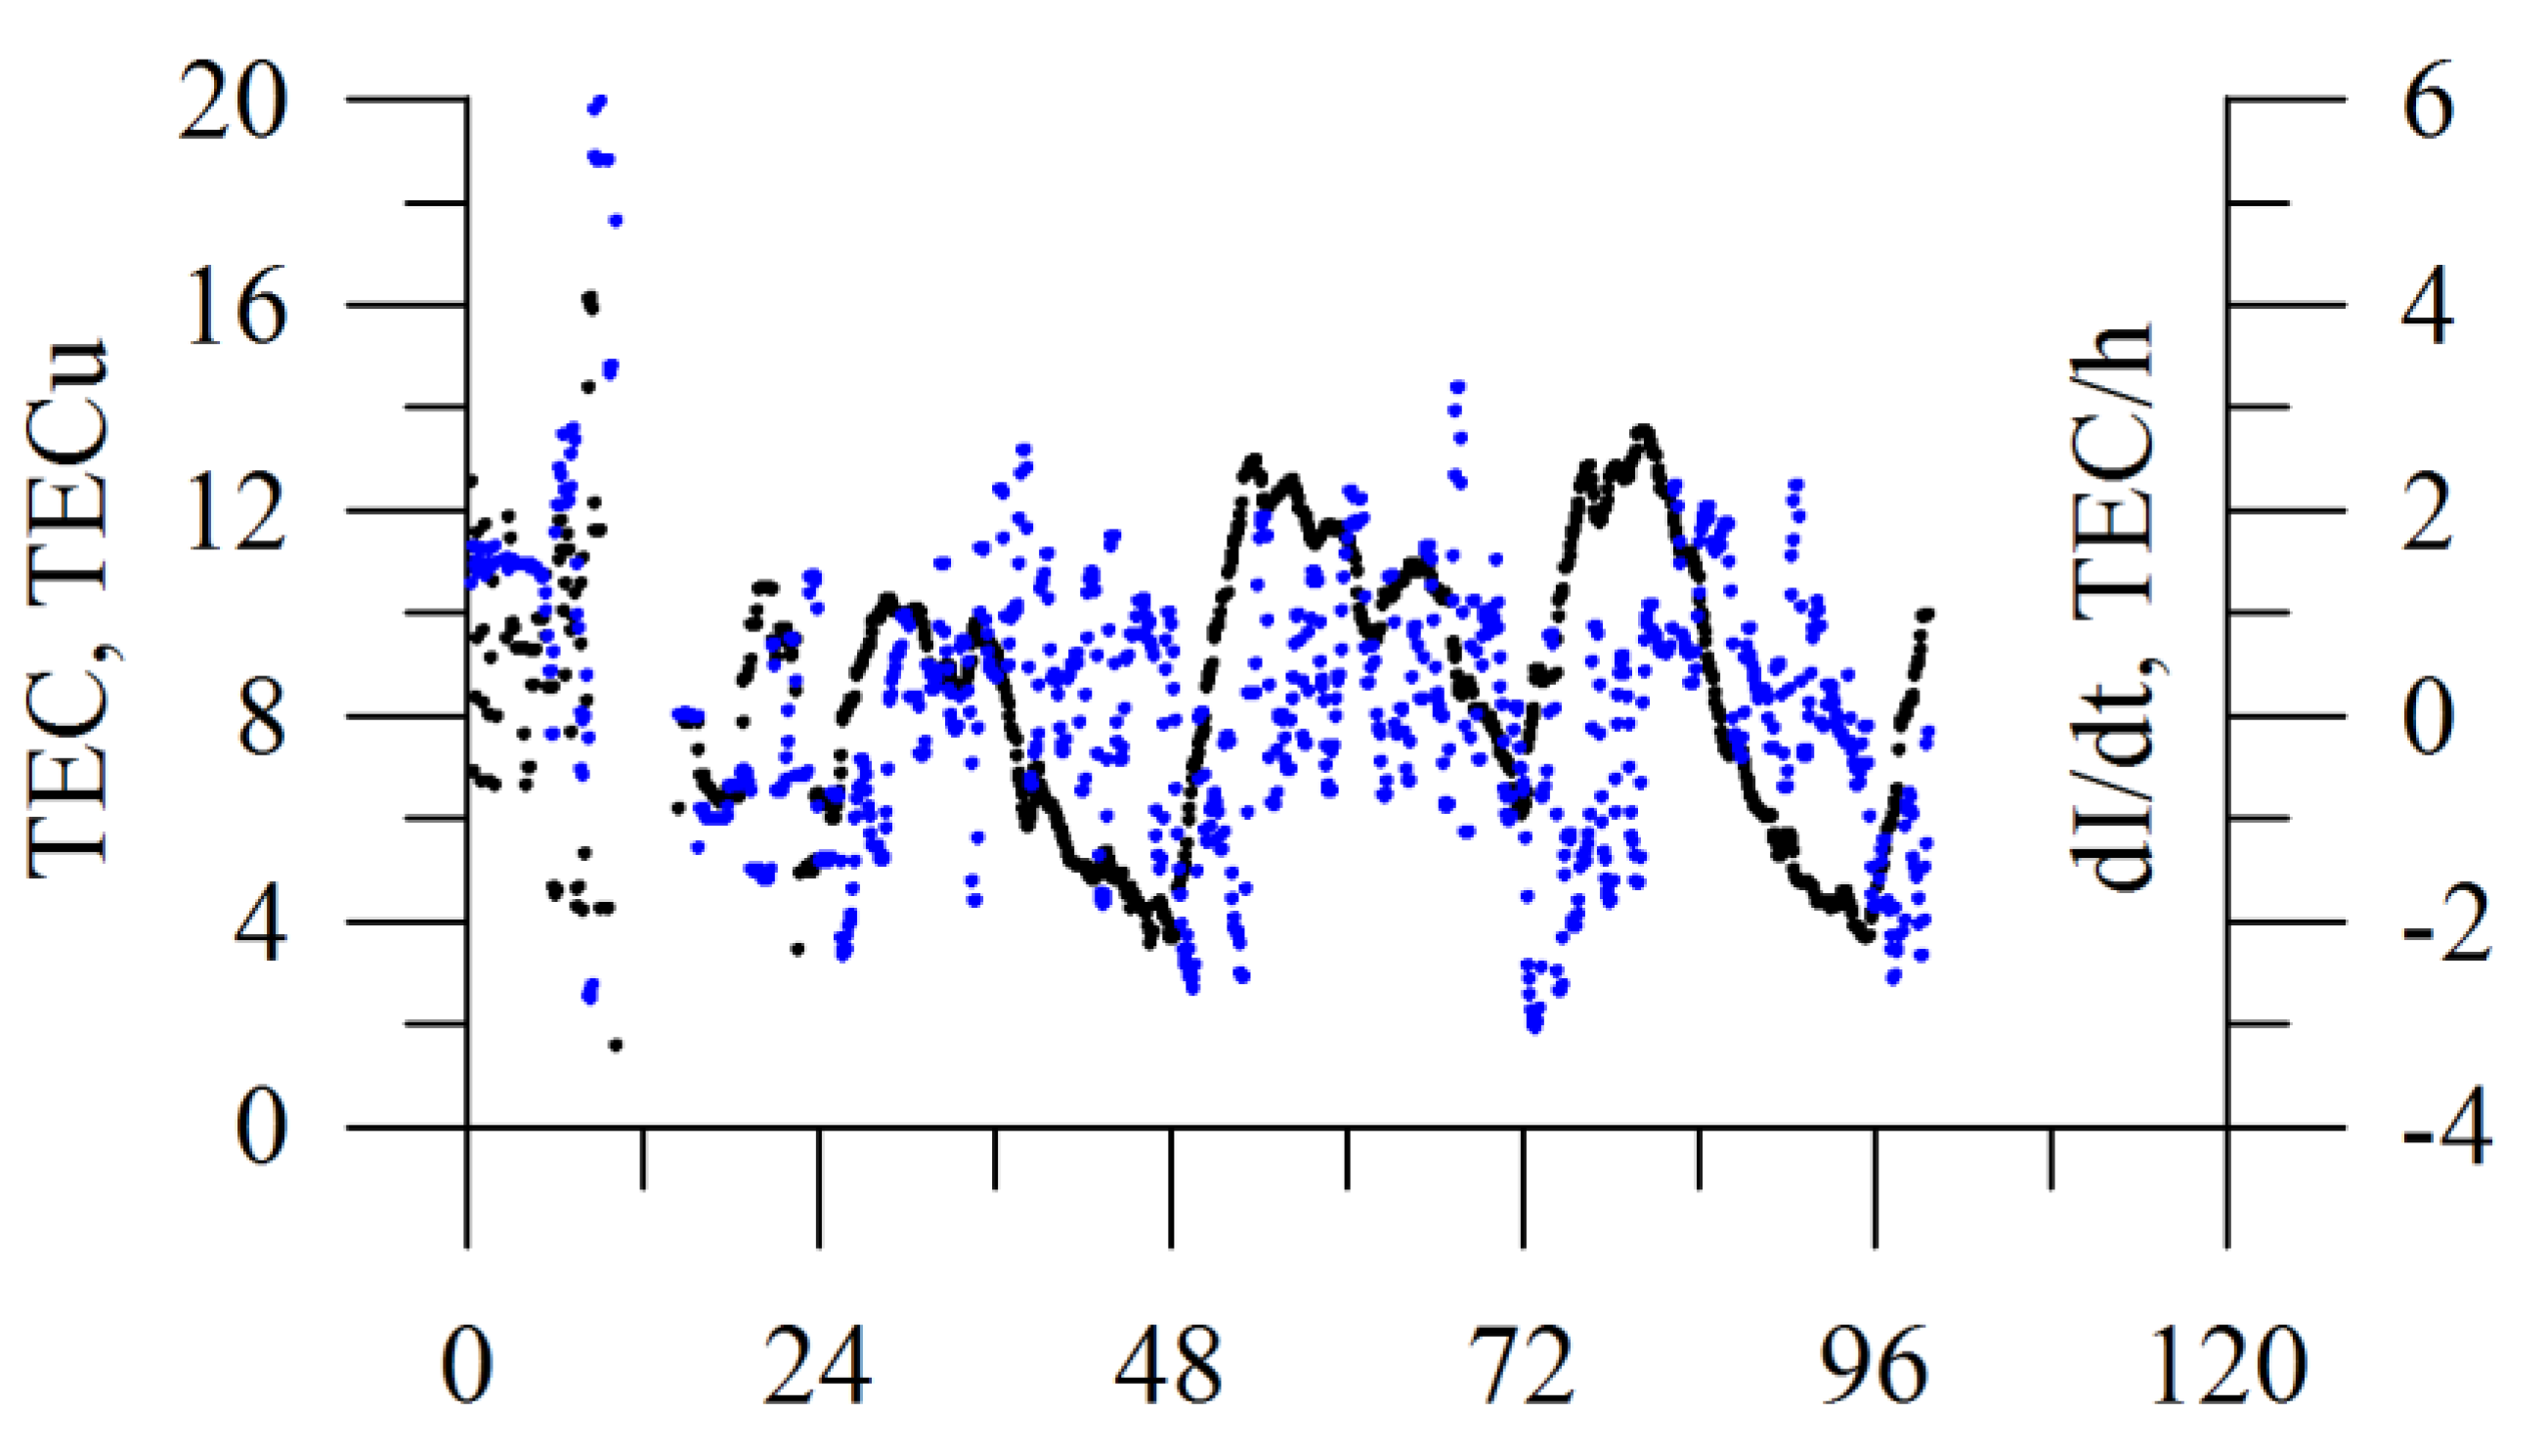
Figure 15 shows the dynamics of the total electron content and TEC time derivative. Bad data in the first day are connected with the equipment. TEC dynamics reflect regular daily variations.
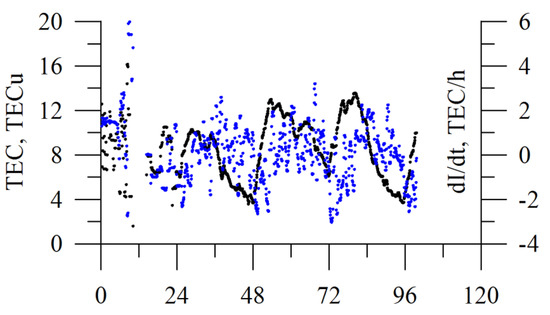
Figure 15.
Dynamics of TEC and TEC time derivative.
For validation, we used the MUF measurements from the results of oblique linear frequency modulation (LFM, or chirp) high frequency sounding at three oblique paths: Khabarovsk–Tory, Magadan–Tory, and Norilsk–Tory (all within the ISTP SB RAS network) [28]. The Khabarovsk–Tory and the Magadan–Tory paths are mid-latitude, while part of Norilsk-Tory path goes through high latitudes. As for the benchmark, we used the MUF data obtained through the human processing of ionograms.
In this approach, we used the correction method modification. First, we corrected the IRI-Plas model by the local parameter (by critical frequency). Then, we spread the correction data τ = foF2GNSS/foF2IRI [26] over the entire model. In general, such an approach is a global parameter correction, and, as a target value, we used only one value for the vertical TEC. The obtained estimate for the critical frequency was used further to calculate the MUF at each of the addressed paths.
In this experiment, we calculated the MUF through the transmission curve method initially developed by Smith [29] and modified by [30]. We used the operational version of the semi-empirical model of the ionosphere [31] developed at the Irkutsk State University and ISTP SB RAS to calculate a normal incidence frequency-virtual-height curve. At this point, we performed a correction of the model critical frequency estimate by the absolute vertical TEC through the technique above. After that, we converted the curve to an oblique incidence case for a given radio path using Smith’s method and found the corresponding MUF value.
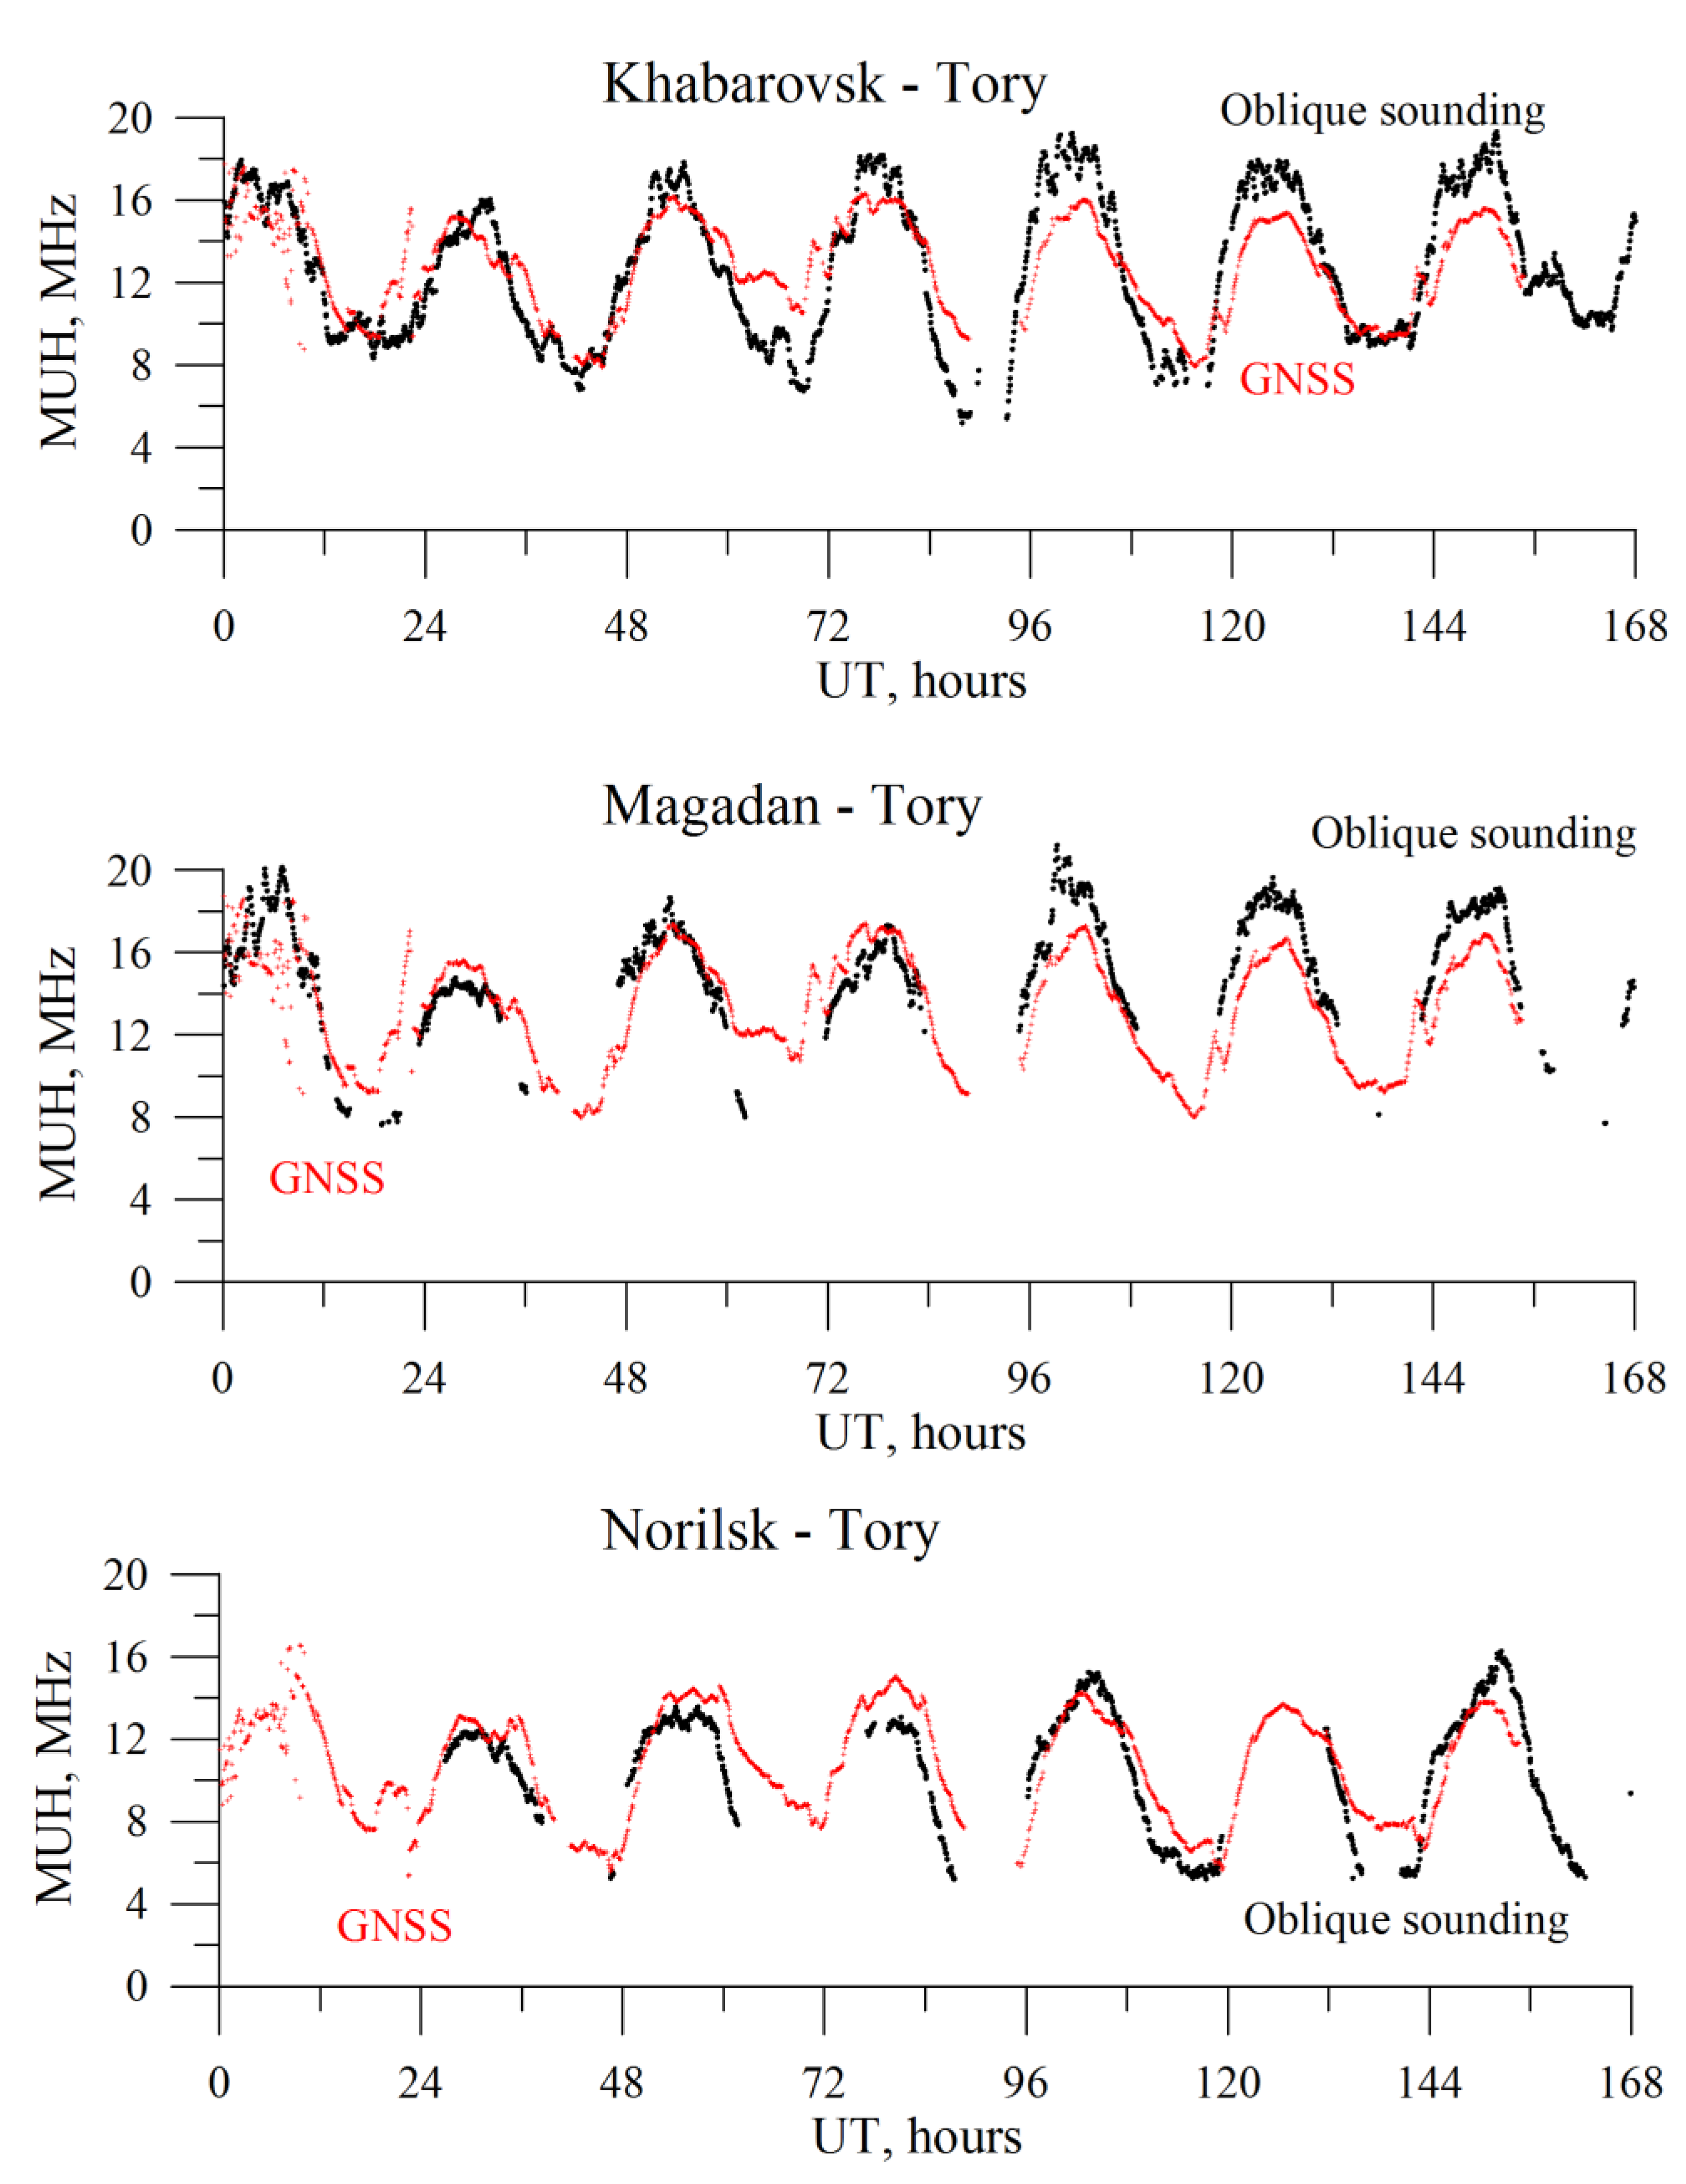
Figure 16 provides the MUF dynamics for the three paths. The black points present the data of the human processing of ionograms, gray—the data obtained from the MUF estimates based on GNSS measurements. Figure 16 shows a high correlation between the results of human processing and the MUF estimate for all three paths. The absence of measurements at the oblique sounding paths is related to the path absorption. Besides, on the first day of the campaign, there were no Norilsk–Tory measurements due to some technical problems. The MUF estimate based on GNSS signals that do not experience absorption may not reproduce the real pattern, because a high frequency signal will be completely absorbed. In general, the results show that the <30% error is typical of ~90%, 95%, and 85% of measurements at the Khabarovsk–Tory, Magadan–Tory, and Norilsk–Tory paths, respectively (Table 1). One should note that we worked under the conditions of low nightside MUF values, which, naturally, increased the relative error. The latter is expected to decrease at higher solar activity.
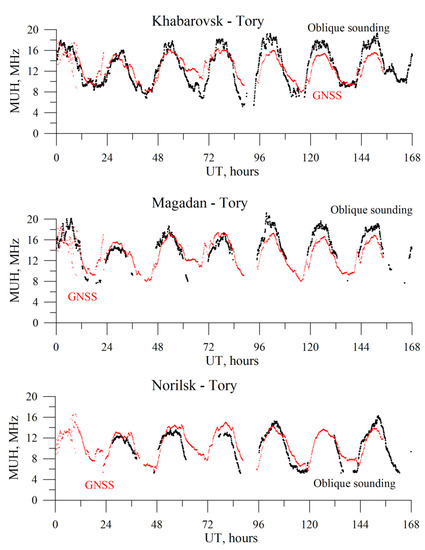
Figure 16.
Maximum usable frequency at the Khabarovsk–Tory, Magadan–Tory, and Norilsk–Tory paths. Black dots refer to the data from the manual scaled ionograms of oblique sounding, gray dots present the estimates obtained based on the TEC from GNSS.

Table 1.
Errors of MUH estimates for different radio paths.
One should note that we did not account for spatial gradients in this paper. Moreover, we did not take into account the effects of traveling ionospheric disturbances. The most challenging measurements for mid-latitudes are those of the Khabarovsk–Tory path. During nighttime, there is an MUF overestimate. Most likely, this overestimate is related to the underestimate of plasmaspheric electron content in the model.
8. Conclusions
In this paper, we presented a system for monitoring the ionosphere. The MITIGATOR (system for MonITorInG the Absolute TOtal electRon content) was implemented based on the equipment within the ISTP SB RAS SibNet. The created system allows for the possibility of working with the GPS/GLONASS/Galileo (and/or BeiDou for the corresponding receiver) data and can be deployed now within the JAVAD equipment using the GREIS protocol. Moreover, upon modifying the information system part related to processing the receiver’s raw data, it can be deployed by using other receivers.
The deployed suite features a good geometry covering almost all of the azimuthal directions and high time resolution. The MITIGATOR could estimate absolute TEC and TEC derivatives (in time and space) and also radio channel parameters. The estimates for the convergence time and for the run-mode retention time equal ~8 h within the equipment used.
A GNSS receiver could augment complicated scientific facilities. The developed tool could support scientific clusters for real-time multi-instrumental ionosphere monitoring. We plan to use it along with the complex of heliogeophysical instruments developing in Siberia. Moreover, MITIGATOR could compensate for the ionospheric error of radio equipment, meaning that engineers could use it for radar and radio communication systems.
Author Contributions
Conceptualization, Y.V.Y.; methodology, Y.V.Y., A.A.M. and A.M.V.; software, A.A.M., A.M.V., A.V.K. and A.V.O.; validation, Y.V.Y., A.M.V. and A.A.M.; formal analysis, A.M.V. and A.V.O.; investigation, Y.V.Y., A.A.M., A.M.V. and A.V.O.; resources, A.V.K. and A.M.V.; data curation, A.M.V., V.A.I. and V.V.D.; writing—original draft preparation, Y.V.Y.; writing—review and editing, Y.V.Y. and A.M.V.; visualization, A.V.K., A.M.V. and Y.V.Y.; supervision, Y.V.Y.; project administration, Y.V.Y.; funding acquisition, Y.V.Y. All authors have read and agreed to the published version of the manuscript.
Funding
The study was financially supported by the Ministry of Science and Higher Education of the Russian Federation as well as a grant from RFBR and the Irkutsk region government No 20-45-383010.
Data Availability Statement
The data can be available through Center for Common Use «Angara» of ISTP (http://ckp-angara.iszf.irk.ru/, accessed on 25 December 2021).
Acknowledgments
The study used equipment from the Center for Common Use «Angara» of ISTP SB RAS (http://ckp-rf.ru/ckp/3056/, accessed on 25 December 2021).
Conflicts of Interest
The authors declare no conflict of interest.
References
- Hofmann-Wellenhof, B.; Lichtenegger, H.; Wasle, E. GNSS-Global Navigation Satellite Systems: GPS, GLONASS, Galileo & More; Springer: Vienna, Austria, 2008. [Google Scholar] [CrossRef] [Green Version]
- Afraimovich, E.L. GPS global detection of the ionospheric response to solar flares. Radio Sci. 2000, 35, 1417–1424. [Google Scholar] [CrossRef]
- Afraimovich, E.L.; Astafyeva, E.I.; Demyanov, V.V.; Edemskiy, I.K.; Gavrilyuk, N.S.; Ishin, A.B.; Kosogorov, E.A.; Leonovich, L.A.; Lesyuta, O.S.; Palamartchouk, K.S.; et al. Review of GPS/GLONASS studies of the ionospheric response to natural and anthropogenic processes and phenomena. J. Space Weather Space Clim. 2013, 3, A27. [Google Scholar] [CrossRef] [Green Version]
- Azpilicueta, F.; Brunini, C.; Radicella, S.M. Global ionospheric maps from GPS observations using modip latitude. Adv. Space Res. 2006, 38, 2324–2331. [Google Scholar] [CrossRef]
- Li, Z.; Wang, N.; Liu, A.; Wang, L.; Hernández-Pajares, M.; Krankowski, A.; Yuan, H. Status of CAS global ionospheric maps after the maximum of solar cycle 24. Satell. Navig. 2021, 2, 19. [Google Scholar] [CrossRef]
- Titov, A.A.; Solomentsev, D.V.; Khattatov, V.U. Real-time monitoring of the ionospheric state with the use of a 3D assimilation model. J. Commun. Technol. Electron. 2013, 58, 509–516. [Google Scholar] [CrossRef]
- Schaer, S. Mapping and Predicting the Earth’s Ionosphere Using the Global Positioning System. Ph.D. Thesis, University of Bern, Bern, Switzerland, 1999. [Google Scholar]
- Patyh, N.B.; Musa, T.A.; Asillam, M.F.; Aris, W.A.W.; Khamdan, S.S. Near real time ionospheric monitoring system over Malaysia using GPS Data: My-Iono Service. J. Phys. Conf. Ser. 2019, 1152, 012016. [Google Scholar] [CrossRef]
- Jin, R.; Jin, S.; Feng, G. M_DCB: Matlab code for estimating GNSS satellite and receiver differential code biases. GPS Solut. 2012, 6, 541–548. [Google Scholar] [CrossRef]
- Mendoza, L.P.O.; Meza, A.M.; Aragón Paz, J.M. A multi-GNSS, multifrequency, and near-real-time ionospheric TEC monitoring system for South America. Space Weather 2019, 17, 654–661. [Google Scholar] [CrossRef]
- Magsi, H.; Ahmed, A.; Hussain, A. Real-Time Monitoring and Logging of Ionospheric Scintillation and Total Electron Content. In Proceedings of the 2019 Sixth International Conference on Aerospace Science and Engineering (ICASE), Islamabad, Pakistan, 12–14 November 2019; p. 19514429. [Google Scholar] [CrossRef]
- Zhang, W.; Huo, X.; Yuan, Y.; Li, Z.; Wang, N. Algorithm Research Using GNSS-TEC Data to Calibrate TEC Calculated by the IRI-2016 Model over China. Remote Sens. 2021, 13, 4002. [Google Scholar] [CrossRef]
- Zherebtsov, G.A. Complex of heliogeophysical instruments of new generation. Sol.-Terr. Phys. 2020, 6, 3–13. [Google Scholar] [CrossRef]
- Vasilyev, R.V.; Setov, A.G.; Frolov, V.L.; Ratovsky, K.G.; Beletsky, A.B.; Oinats, A.V.; Yasyukevich, Y.V.; Medvedev, A.V. Modern heating facility for research into the mid-latitude ionosphere. Sol.-Terr. Phys. 2020, 6, 49–62. [Google Scholar] [CrossRef]
- Smirnova, E.V.; Smirnov, V.M.; Skobelkin, V.N.; Tuynyankin, S.I. The ionosphere state monitoring in real-time mode. Sovr. Probl. DZZ Kosm. 2011, 8, 136–141. [Google Scholar]
- Smirnov, V.M.; Smirnova, E.V. Sounding the Earth’s ionosphere over the sea. Sovrem. Probl. Distantsionnogo Zondirovaniya Zemli Iz Kosm. 2019, 16, 327–335. [Google Scholar] [CrossRef]
- Yasyukevich, Y.V.; Vesnin, A.M.; Perevalova, N.P. SibNet–Siberian Global Navigation Satellite System Network: Current state. Sol.-Terr. Phys. 2018, 4, 63–72. [Google Scholar] [CrossRef]
- GREIS. GNSS Receiver External Interface Specification. Reflects Firmware Version 4.1.00. Available online: https://download.javad.com/manuals/GREIS/GREIS_Reference_Guide.pdf (accessed on 31 March 2021).
- Yasyukevich, Y.; Mylnikova, A.; Vesnin, A. GNSS-Based Non-Negative Absolute Ionosphere Total Electron Content, its Spatial Gradients, Time Derivatives and Differential Code Biases: Bounded-Variable Least-Squares and Taylor Series. Sensors 2020, 20, 5702. [Google Scholar] [CrossRef] [PubMed]
- Start, P.B.; Parker, R.L. Bounded-Variable Least-Squares: An Algorithm and Applications. Comput. Stat. 1995, 10, 129–141. Available online: https://www.stat.berkeley.edu/~stark/Preprints/bvls.pdf (accessed on 1 January 2022).
- Waterman, M.S. A restricted least squares problem. Technometrics 1974, 16, 135–136. [Google Scholar] [CrossRef]
- Zhang, H.; Xu, P.; Han, W.; Ge, M.; Shi, C. Eliminating negative VTEC in global ionosphere maps using inequality-constrained least squares. Adv. Space Res. 2013, 1, 988–1000. [Google Scholar] [CrossRef]
- Wang, P.; Liu, H.; Yang, Z.; Shu, B.; Xu, X.; Nie, G. Evaluation of Network RTK Positioning Performance Based on BDS-3 New Signal System. Remote Sens. 2022, 14, 2. [Google Scholar] [CrossRef]
- Mylnikova, A.A.; Yasyukevich, Y.V.; Kunitsyn, V.E.; Padokhin, A.M. Variability of GPS/GLONASS differential code biases. Results Phys. 2015, 5, 9–10. [Google Scholar] [CrossRef] [Green Version]
- Kotova, D.S.; Ovodenko, V.B.; Yasyukevich, Y.V.; Klimenko, M.V.; Ratovsky, K.G.; Mylnikova, A.A.; Andreeva, E.S.; Kozlovsky, A.E.; Korenkova, N.A.; Nesterov, I.A.; et al. Efficiency of updating the ionospheric models using total electron content at mid- and sub-auroral latitudes. GPS Solut. 2020, 24, 25. [Google Scholar] [CrossRef]
- Maltseva, O. The Influence of Space Weather on the Relationship Between the Parameters TEC and foF2 of the Ionosphere. IEEE J. Radio Freq. Identif. 2021, 5, 261–268. [Google Scholar] [CrossRef]
- Yasyukevich, Y.V.; Vesnin, A.M.; Kurkin, V.I. Global navigation satellite systems for ionospheric error correction in radio-engineering systems: Challenges and prospects. Radiophys. Quantum Electron. 2020, 63, 177–190. [Google Scholar] [CrossRef]
- Ivanov, V.A.; Shumaev, V.V.; Kurkin, V.I.; Nosov, V.E.; Uryadov, V.P. Chirp ionosonde and its application in the ionospheric research. Radiophys. Quantum Electron. 2003, 46, 821–851. [Google Scholar] [CrossRef]
- Smith, N. Extension of Normal Incidence Ionosphere Measurements to Oblique Incidence Radio Transmission. J. Res. Natl. Bur. Stand. 1937, 19, 89–94. [Google Scholar] [CrossRef]
- Kotovich, G.V.; Kim, A.G.; Mikhailov, S.Y.; Grozov, V.P.; Mikhailov, Y.S. Determining the fof2 critical frequency at the path midpoint from oblique sounding data based on the smith method. Geomagn. Aeron. 2006, 46, 517–521. [Google Scholar] [CrossRef]
- Altyntseva, V.I.; Ivelskaya, M.K.; Kotovich, G.V.; Polekh, N.M.; Sutyrina, G.E.; Sukhodolskaya, V.E. Operational Version of the Ionosphere Model; preprint; SibIZMIR: Irkutsk, Russia, 1991; 41p. (In Russian) [Google Scholar]
Publisher’s Note: MDPI stays neutral with regard to jurisdictional claims in published maps and institutional affiliations. |
© 2022 by the authors. Licensee MDPI, Basel, Switzerland. This article is an open access article distributed under the terms and conditions of the Creative Commons Attribution (CC BY) license (https://creativecommons.org/licenses/by/4.0/).

