Article

Excitation Function of Kinetic Freeze-Out Parameters at 6.3, 17.3, 31, 900 and 7000 GeV

by
Muhammad Waqas
1,
Abd Al Karim Haj Ismail
2,3,*,
Muhammad Ajaz
4 and
Atef AbdelKader
2,3
1
School of Nuclear Science and Technology, University of Chinese Academy of Sciences, Beijing 100049, China
2
Department of Mathematics and Science, Ajman University, Ajman P.O. Box 346, United Arab Emirates
3
Nonlinear Dynamics Research Center (NDRC), Ajman University, Ajman P.O. Box 346, United Arab Emirates
4
Department of Physics, Abdul Wali Khan University Mardan, Mardan 23200, Pakistan
*
Author to whom correspondence should be addressed.
Universe 2022, 8(2), 138; https://doi.org/10.3390/universe8020138
Submission received: 19 January 2022 / Revised: 16 February 2022 / Accepted: 18 February 2022 / Published: 21 February 2022
(This article belongs to the Special Issue Hydrodynamics and Thermodynamics in High Energy Physics)

Abstract

:
The transverse momentum spectra of π + ( π )( π + + π ) at 6.3, 17.3, 31, 900 and 7000 GeV are analyzed by the blast-wave model with Tsallis statistics (TBW) in proton-proton collisions. We took the value of flow profile n 0 = 1 and 2 in order to see the difference in the results of the extracted parameters in the two cases. Different rapidity slices at 31 GeV are also analyzed, and the values of the related parameters, such as kinetic freeze-out temperature, transverse flow velocity and kinetic freeze-out volume, are obtained. The above parameters rise with the increase of collision energy, while at 31 GeV, they decrease with increasing rapidity, except for the kinetic freeze-out volume, which increases. We also extracted the parameter q, which is an entropy-based parameter, and its rising trend is noticed with increasing collision energy, while at 31 GeV, no specific dependence of q is observed on rapidity. In addition, the multiplicity parameter N 0 and mean transverse momentum are extracted, which increase with increasing collision energy and decrease with increasing rapidity. We notice that the kinetic freeze-out temperature and mean transverse momentum are slightly larger with n 0 = 2, while the transverse flow velocity is larger in the case of n 0 = 1, but the difference is very small and hence insignificant.

1. Introduction

In high-energy heavy-ion nucleus-nucleus collisions, an extremely hot and dense matter called the quark-gluon plasma (QGP) is formed. As an extremely hot matter, it is obvious that temperature plays an important role in the formation of QGP matter. There are various kinds of temperatures, and they describe the excitation function of the interacting system at different evolution stages [1,2,3,4,5]. In addition, the mean transverse momentum ( < p T > ) spectra of the particles are also used [6,7,8,9,10] for describing the excitation degree of the interacting system. The initial temperature is the earliest temperature displayed in the initial stages (beginning) of collision [11,12,13,14,15,16], and it is followed by the chemical freeze-out temperature ( T c h ) [17,18,19] that occurs at the chemical freeze-out stage where the inelastic interaction among the hadrons stop, and the particle chemistry gets fixed. However, the elastic interaction does not stop until the kinetic freeze-out stage is reached, where the transverse momentum ( p T ) spectra of the particles remain unchanged. The temperature at this stage is said to be the kinetic/thermal freeze-out temperature ( T 0 ). The effective temperature is also a kind of temperature that includes the impact of flow effects.
Different freeze-out stages occur at different stages of system evolution, and the excitation function of the freeze-out parameters (such that their dependence on centrality, energy, etc.) at different stages is very interesting to us. Hence, our aim is to study the final state particles. Therefore, we study the kinetic freeze-out parameters in the present work. The study of the excitation function of the kinetic freeze-out parameter is very complex and exciting. The under-studied kinetic freeze-out parameters in the present work are the kinetic freeze-out temperature ( T 0 ), transverse flow velocity ( β T ), and kinetic freeze-out volume (V). β T and V are studied in the literature with some contradiction in their results; however, the study of T 0 in the literature has a big contradiction. There are several studies on this issue [1,14,20,21,22], but their results are different. For instance, there is a contradiction about the centrality dependence of T 0 . According to some literature [1,8,15,21], there is a higher degree of excitation in the system in central collisions, and as the system moves towards the periphery, the degree of excitation becomes less and, hence, T 0 is less. Contrarily, in refs. [22,23], in central collisions, T 0 is smaller than in the peripheral collisions, which indicates the longer-lived fireball in central collisions. This different trend of T 0 may be model dependent or may depend on the flow profile with different conditions and limitations as well as different methods in the extraction of T 0 [1]. Similarly, the dependence of T 0 on energy is also a complex and contradictory issue. From lower energies up to a few GeV at Beam Energy Scan energies [1,20,22], T 0 increases sharply and then saturates up to 39 GeV. However, after that, it may have an increasing or decreasing trend or remain invariant. In our previous work [1], with the BGBW model, we reported an increasing trend of T 0 with energy. β T and V have the same trend with centrality and energy in the literature [15,21,24,25]. The core idea of the present work is to report the energy-dependent as well as rapidity-dependent kinetic freeze-out parameters. We present the rapidity dependence of the kinetic freeze-out parameters at 31 GeV in order to examine the trend of these parameters with rapidity, but we shall conduct its detailed study in the near future by different models, including various particles at various rapidities and energies. The main motivation of the present work is that we study these dependencies with the TBW model for two flow profiles ( n 0 = 1 and 2) in order to examine whether there is any similarity or difference among the two cases.
The energy dependence of the freeze-out parameters in Appendix A collisions are widely studied; however, there are less studies for pp collisions regarding this issue. We believe that being a basic process in Appendix A collisions, pp collisions are very important in the study of excitation functions of different freeze-out parameters.
Various distributions can be used to study the excitation functions of various freeze-out parameters. These distributions include, but are not limited to, the Erlang distribution [26], Hagedorn function [27], multi-thermal source model [28,29], modified Hagedron model [30,31], blast-wave model with Boltzmann Gibbs distribution (BGBW) [32,33] and blast-wave model with Tsallis statistics (TBW model) [24,34,35].
In the present work, we used the blast-wave model with Tsallis statistics to analyze the transverse momentum spectra of π + ( π )( π + + π ) in pp collisions at 6.3, 17.3, 31, 900 and 7000 GeV to see the excitation function of kinetic freeze-out temperature ( T 0 ), transverse flow velocity ( β T ), kinetic freeze-out volume (V) and mean momentum ( < p T > ). Besides having the advantage of entropy-based parameter q, the TBW model covers the p T range as wide as it can. One can extract the information about the final state particles from the p T spectra of the particles at the kinetic freeze-out stage by the TBW, and the particles at this stage provide useful information about the collision dynamics. This information includes, but is not limited to, the kinetic freeze-out temperature ( T 0 ), transverse flow velocity ( β T ) and kinetic freeze-out volume (V). The transverse momentum distribution of the final state particles may help us to understand the characteristics of transverse excitation and dynamical expansion of the interacting system. The transverse excitation is related to the soft excitation process and can give a good understanding of the excitation degree of the interacting system in high-energy regions.
The description of the particle spectra in various collision systems at various energies at RHIC and LHC have been studied extensively by the BGBW model [36,37,38,39] where the shape of the spectra depends on the kinetic freeze-out temperature ( T 0 ) and transverse flow velocity ( β T ). The BGBW model is based on a strong assumption of local thermal equilibrium at some instant of time and then experiences a hydrodynamic evolution, but the initial condition for the hydrodynamic evolution varies event by event [40], which leaves a footprint (due to its incomplete wash-out by the subsequent interactions at either the quark-gluon plasma phase or the hadronic phase) in the low and intermediate p T region of the particle spectra. The particle emission source distribution from the Boltzmann distribution is changed to the Tsallis distribution [29] in order to take into account the above fluctuation [41]. The p T spectra of the particles are very important observables, which can be used to examine the dynamics of production of particles, and various thermal parameters, including the fireball geometry and the expansion velocity, could be extracted from their fitting by different distributions. Furthermore, we also study the dependence of these parameters on rapidity at 31 GeV.
In the present study, we take pp collisions because they are operated as a baseline and are important for understanding the mechanism of particle production [42]. Furthermore, the study of pp collisions is necessary in order to distinguish the hard hadronic interactions from the soft ones, which can be used for the tuning of phenomenological models in order to describe the final state observables. It is noteworthy that the reason behind the selection of pions is that the spectra of the pion are closest to the source temperature. In fact, the proton-proton collisions are small collision systems, where there is negligible flow as compared to nucleus-nucleus (Appendix A) collisions. Naively, the formation of a system with quark-gluon plasmas (hydrodynamics collective effects) is not anticipated in pp collisions. According to [43], no radial flow effects are reported at s N N = 200 and 540 GeV in pp collisions. However, according to [44,45,46,47], the probability of formation of such a system in pp collisions on a small scale cannot be ignored, and therefore we use different hydrodynamic models for pp collisions. In addition, it is also noteworthy that when we use such models for pp collisions, we take a grand canonical ensemble where there are a large number of particles, a lot of events, and hence, a large flow. Meanwhile, the pp collision with high multiplicity-produced high-energy density at SPS (CERN) [48,49] encouraged scientists for deconfinement in hadronic collisions at SPS-CERN [44] and Fermilab-Tevatran [45,46]. The models based on statistical hadronization successfully describe the pp collisions [50,51].
The remainder of the paper consists of methods and formalisms in Section 2, followed by the results and discussion in Section 3. In Section 4, we summarize our main observations and conclusions.

2. The Methods and Formalisms

In refs. [24,34,35], we express the invariant differential yield of the particles with the blast-wave model with Tsallis statistics (TBW), which can be represented as:
f 1 ( p T ) = 1 N d N d p T = g V ( 2 π ) 2 p T m T π π d ϕ 0 R r d r × { 1 + q 1 T 0 [ m T cosh ( ρ ) p T sinh ( ρ ) × cos ( ϕ ) ] } q ( q 1 )
where m T ( m T = p T 2 + m 0 2 ), is the transverse mass, m 0 and g are the rest mass and degeneracy factor (which is 1 for pion) of the hadron, respectively, ϕ represents the azimuthal angle. R represents the maximum r and the later is a radial coordinate. q is a non-extensive parameter and it measures the degree of equilibrium. The deviation of the parameter q from unity gives the fluctuation of 1 / T [35], ρ is the transverse expansion rapidity and is given as ρ = tanh 1 [ β ( r ) ] , which grows as the n-th power of the emitting source’s radius (r). β ( r ) is the self-similar flow profile and is given as β ( r ) = β S ( r / R ) n 0 and β S is the velocity of the source at the fireball edge. The mean transverse flow velocity is < β T > = 2 / ( n 0 + 2 ) β S . The value of n 0 can be 1 [41], 2 [32,52] or a free parameter [53]. In the present work, we investigate the dependence of the results of the freeze-out parameters on the choice of n 0 = 1 and 2. n 0 = 1 is the closest approximation to hydrodynamic [54] at freeze-out, and n 0 = 2 closely resembles the hydrodynamic profile [32]. The TBW model is generally used to describe the low p T region, and for the high p T region, the Hagedron function (which is an inverse power law) [27,55,56] can be used. A further explanation of the model can be found in our recent work [36,37].

3. Results and Discussion

3.1. Comparison with Data

The data for π + ( π )( π + + π ) was illustrated by the NA61/SHINE [57,58] and ALICE Collaborations [59,60]. We presented the fit to transverse momentum spectra of π + ( π )( π + + π ) in inelastic (INEL) proton-proton collisions by the blast-wave model with Tsallis statistics (TBW) [61,62] in Figure 1. We first perform the fit to the experimental data of NA61/SHINE and ALICE Collaborations by the TBW model with n 0 = 1 and then with n 0 = 2, and extracted the relative parameters by using the least squares method. Figure 1a demonstrates the fit to the experimental data of pions at 6.3, 17.3, 900 and 7000 GeV, while Figure 1b,c presents the fit to the data in different rapidity slices at 31 GeV. The experimental data (symbols) were obtained from ref. [57,58,59,60]. Different symbols in Figure 1a show different energies, while in Figure 1b,c different rapidity slices are represented by different symbols. The solid and dashed lines appear for the fit with TBW model interpreting n 0 = 1 and n 0 = 2, respectively. An approximate description of the TBW model to the experimental data can be seen. Figure 1a shows the pull distribution of Figure 1 by the TBW model with n 0 = 1 and 2, which is more informative to check the quality of the fit.
In order to read the figure clearly, some spectra are scaled by factors. The corresponding data/fit ratios of the fits in the upper panels are followed in their lower panels. The open and filled symbols in the lower panels illustrate the data/fit ratios with n 0 = 1 and n 0 = 2, respectively. To obtain the best parameters, we used the least squares method in the fitting process and extracted the values of the free parameters along with χ 2 /dof, and the p-values of the χ 2 statistics, which are calculated in R-software, and are listed in Table 1 and Table 2. Table 1 presents the values of the parameters with n 0 = 1, while Table 2 shows their values when n 0 = 2 is used.
It is important to indicate that some data/fit ratios of spectra (the confidence level of the fit) deviate from unity. Basically, the deviation of data/fit ratios shows the quality of the fit. The more closely the data/fit ratios are to unity, the better the fit results are. Similarly, the values of χ 2 are also presented in Table 1 and Table 2 to show the goodness of fit. The p-values are listed in Table 1 and Table 2 in order to show the confidence level of the fits. In our work, some results of the data/fit ratios deviated more from unity, and the values of χ 2 were also large. We can see that this large deviation was basically in the range of p T < 0.5 GeV/c ( p T > 2.5 G e V / c ), which is responsible for the large fraction of resonance decay of pions (hard component), and the model does not take into account the resonance decay. Secondly, data/fit ratios (the values of χ 2 ) in a few cases also deviated from unity; this deviation (large values of χ 2 ) was caused by the data itself. The modeling of high-energy collisions in ideal hydrodynamics is usually limited to low p T (≤1 or 1.5 GeV/c) because this is a general belief that at high p T , the equilibrium description fails where the particle productions are dominated by hard processes. Therefore, the selection of the p T range is sensitive. The TBW model covers the data up to p T 2.5–3 GeV/c, or a little more. If the model fitting does not cover the whole data, then we use the two or multi-component TBW model, where p T ≤ 1.5–2 GeV/c is the soft component and p T > 2–3 GeV/c, or a little more, is the hard component. In the present work, we analyzed different spectra, among which, some had p T > 2.5 GeV/c, but it does not mean that the particles were produced in hard components, which means that even if the hard component is included, i.e., the power-law [27,55], the soft component will be responsible for particle production.

3.2. Tendencies of Parameters

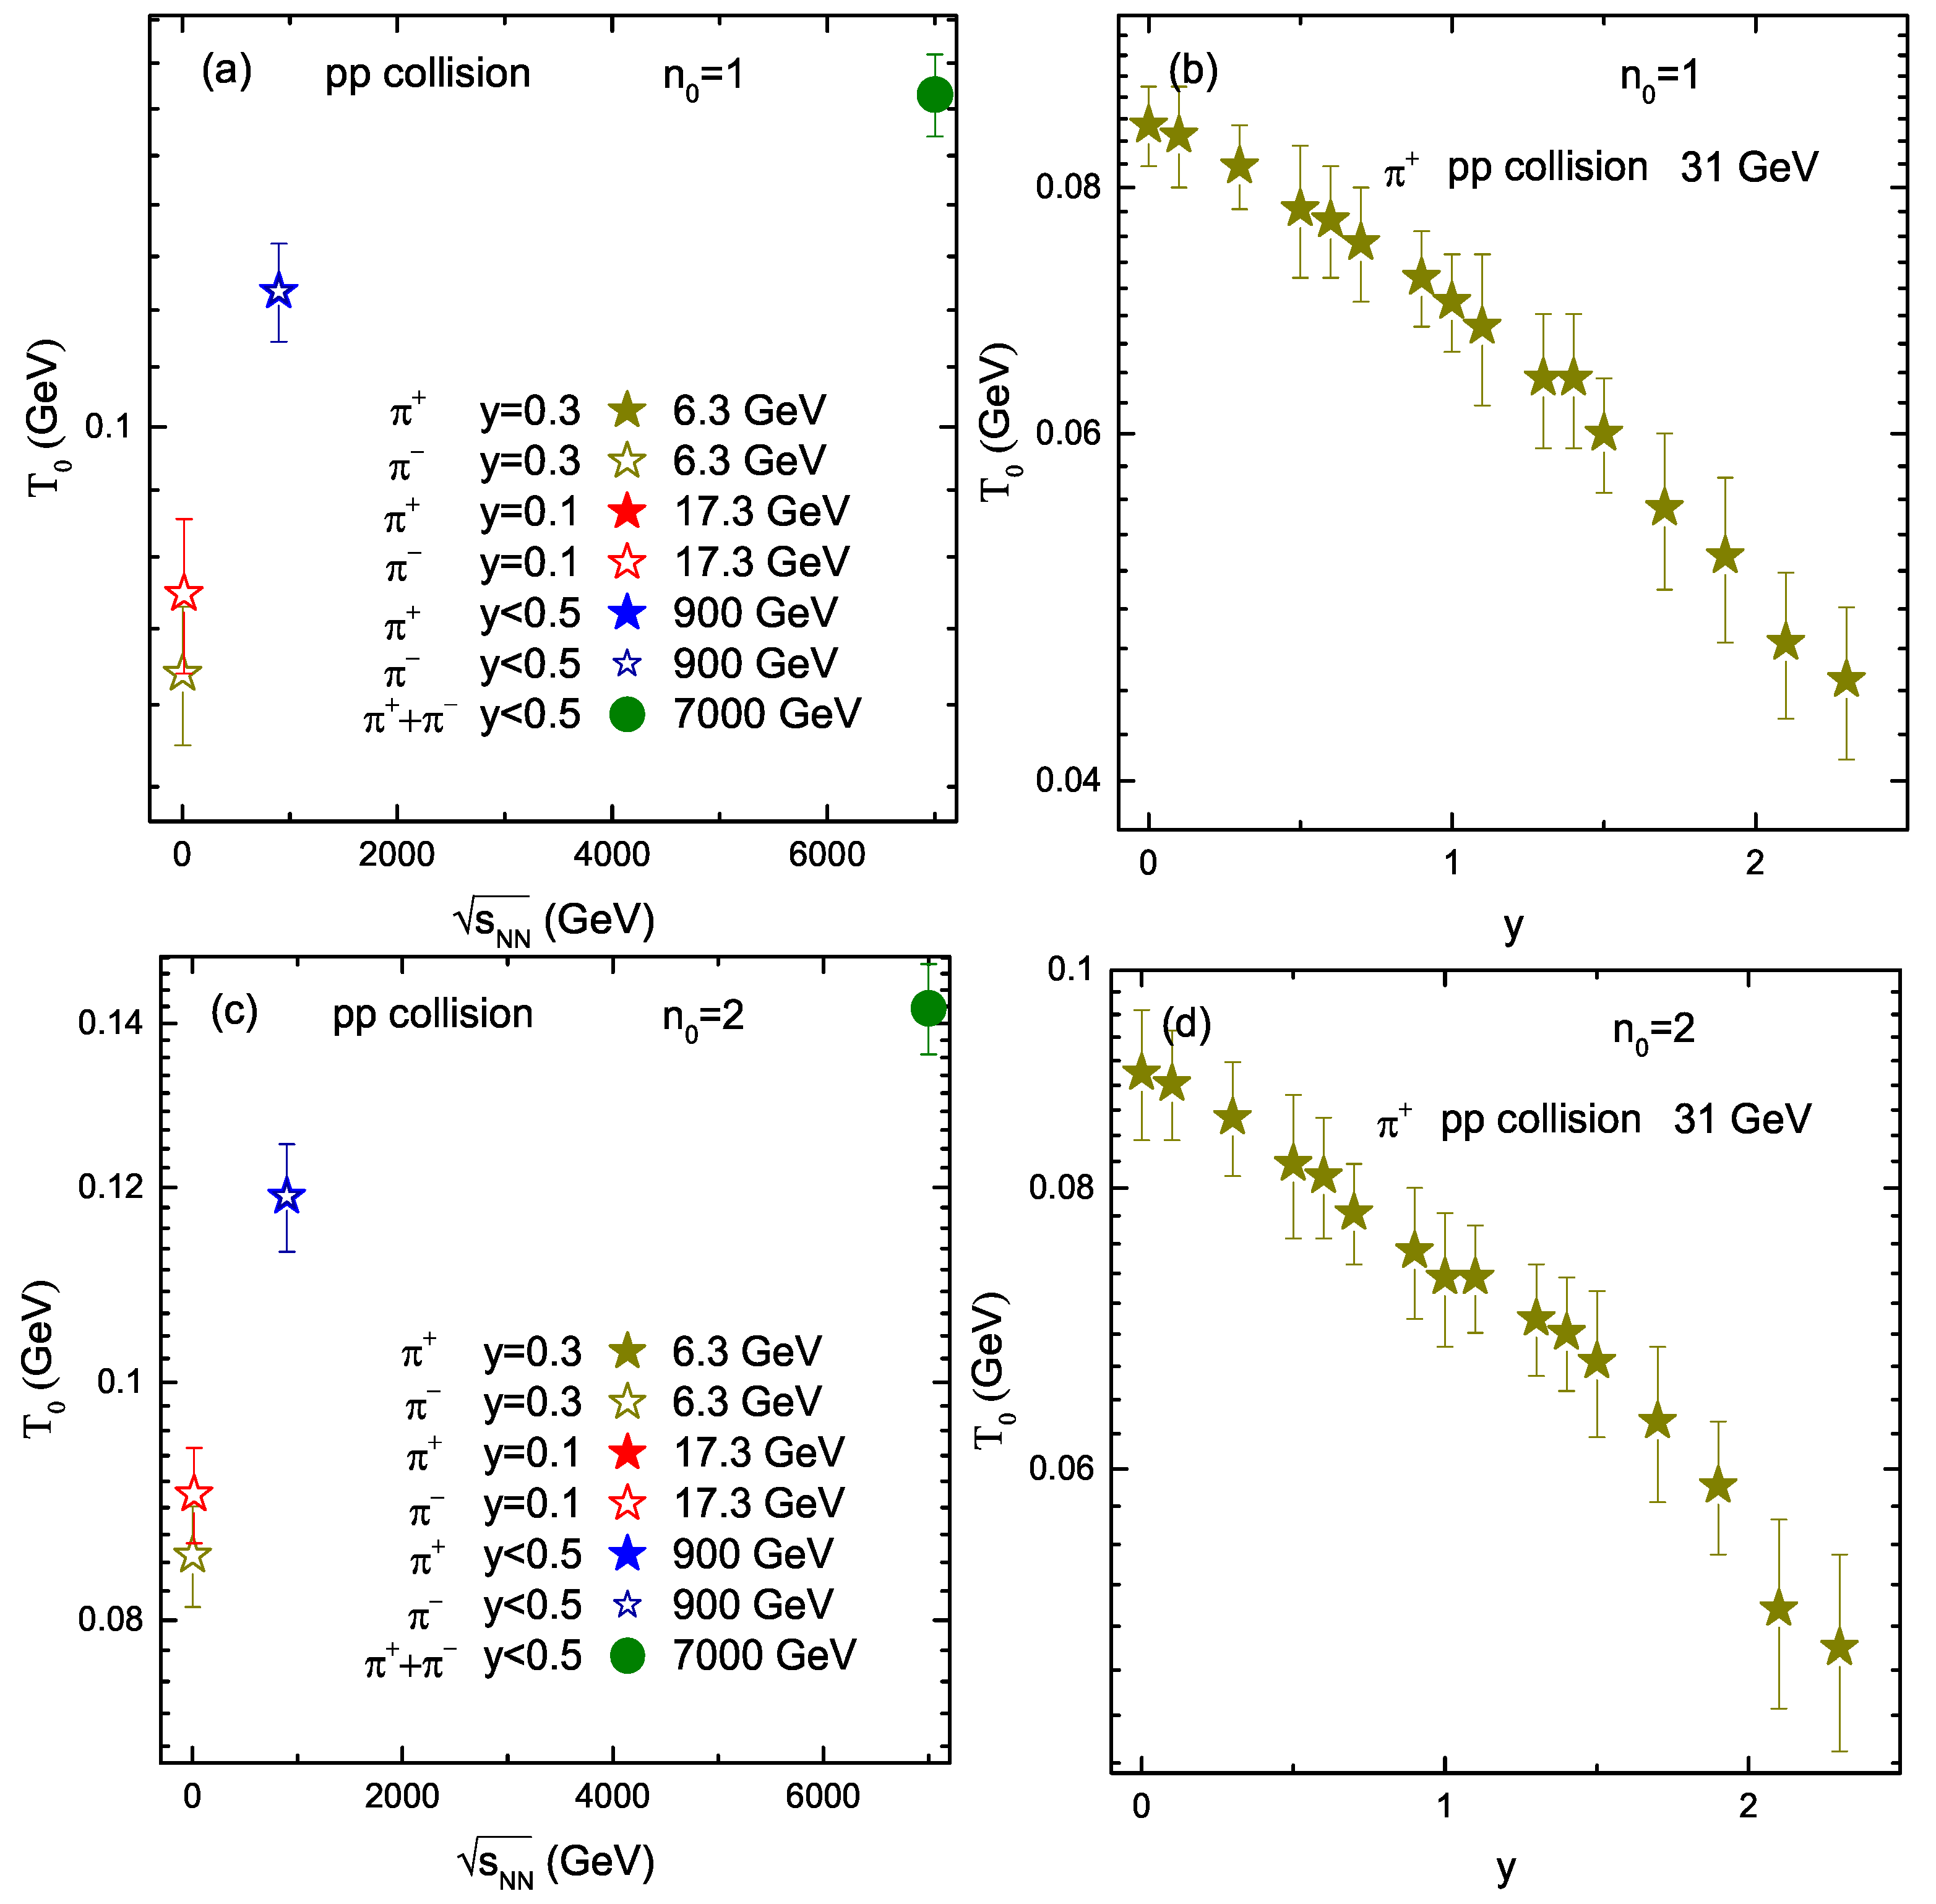
To begin with the changing trend of the related parameters, Figure 2 describes the excitation function that is the dependence of the kinetic freeze-out temperature ( T 0 ) on the collision energy and rapidity. Panels (a–d) present the results obtained from the TBW model with the flow profile n 0 = 1 and n 0 = 2, respectively. Panel (a) shows the trend of T 0 with increasing collision energy, while panel (b) shows its trend with decreasing rapidity at 31 GeV. We noticed that T 0 at 6.3 GeV is 0.080 ± 0.005 for both π + and π , which rise at 17.3 GeV to 0.086 ± 0.004 . Similarly, with rising energy to 900 and 7000 GeV, the value of T 0 becomes 0.113 ± 0.005 and 0.135 ± 0.005 , respectively. In addition, T 0 in the rapidity slice y = 0 was 0.086 ± 0.004 , which continuously decreased with increasing rapidity and became 0.045 ± 0.004 at y = 2.3 . Likewise, in panel (c) the value of T 0 at 6.3 GeV was 0.085 ± 0.004 , then became 0.090 ± 0.004 at 17.3 GeV, and simultaneously jumped to 0.119 ± 0.006 and 0.142 ± 0.006 at 900 and 7000 GeV respectively, and similarly with rapidity, T 0 decreased from 0.085 ± 0.006 at y = 0 to 0.050 ± 0.005 at y = 2.3 . We see that T 0 obtained from the TBW model with n 0 = 2 was slightly larger (or nearly equal) compared to n 0 = 1. We also noticed that the value of T 0 in Table 1 in the y = 0.1 rapidity slice at 31 GeV ( 0.085 ± 0.005 ) and 17.3 GeV ( 0.086 ± 0.006 ), and y = 0.3 rapidity slice at 31 GeV ( 0.080 ± 0.005 ) and 17.3 GeV ( 0.082 ± 0.005 ) were nearly equal. Likewise, in Table 2, we observed similar results of T 0 in the y = 0.1 rapidity slice at 31 and 17.3 GeV to be 0.089 ± 0.005 and 0.090 ± 0.004 , respectively, and the y = 0.3 rapidity slice at 31 GeV T 0 is 0.086 ± 0.005 and 6.3 GeV was 0.085 ± 0.004 .
The above observation of growing T 0 with rising collision energy is due to the fact that, as the energy increases, the collision becomes more and more intense, the degree of excitation of the system increases and, correspondingly, the transfer of energy per nucleon in the system becomes larger, which naturally corresponds to larger T 0 . Furthermore, T 0 decreased with the increase of rapidity and the reason behind this is that the energy transfer in the system decreases with increasing rapidity because of large penetration between participant nucleons. In other words, we can say that the present work gives larger T 0 at higher energies and smaller rapidity intervals. Therefore, the particles at higher energies and in smaller rapidity slices freeze-out early. The nearly equal values of T 0 at 31 and 17.3 GeV in rapidity slice y = 0.1, as well as at 31 and 6.3 GeV in rapidity slice y = 0.3, may indicate the similar thermodynamic behavior of the system at 31 and 17.3 GeV in rapidity slice y = 0.1, as well as at 31 and 6.3 GeV in rapidity slice y = 0.3, but a lot of data analyses are needed to confirm this.
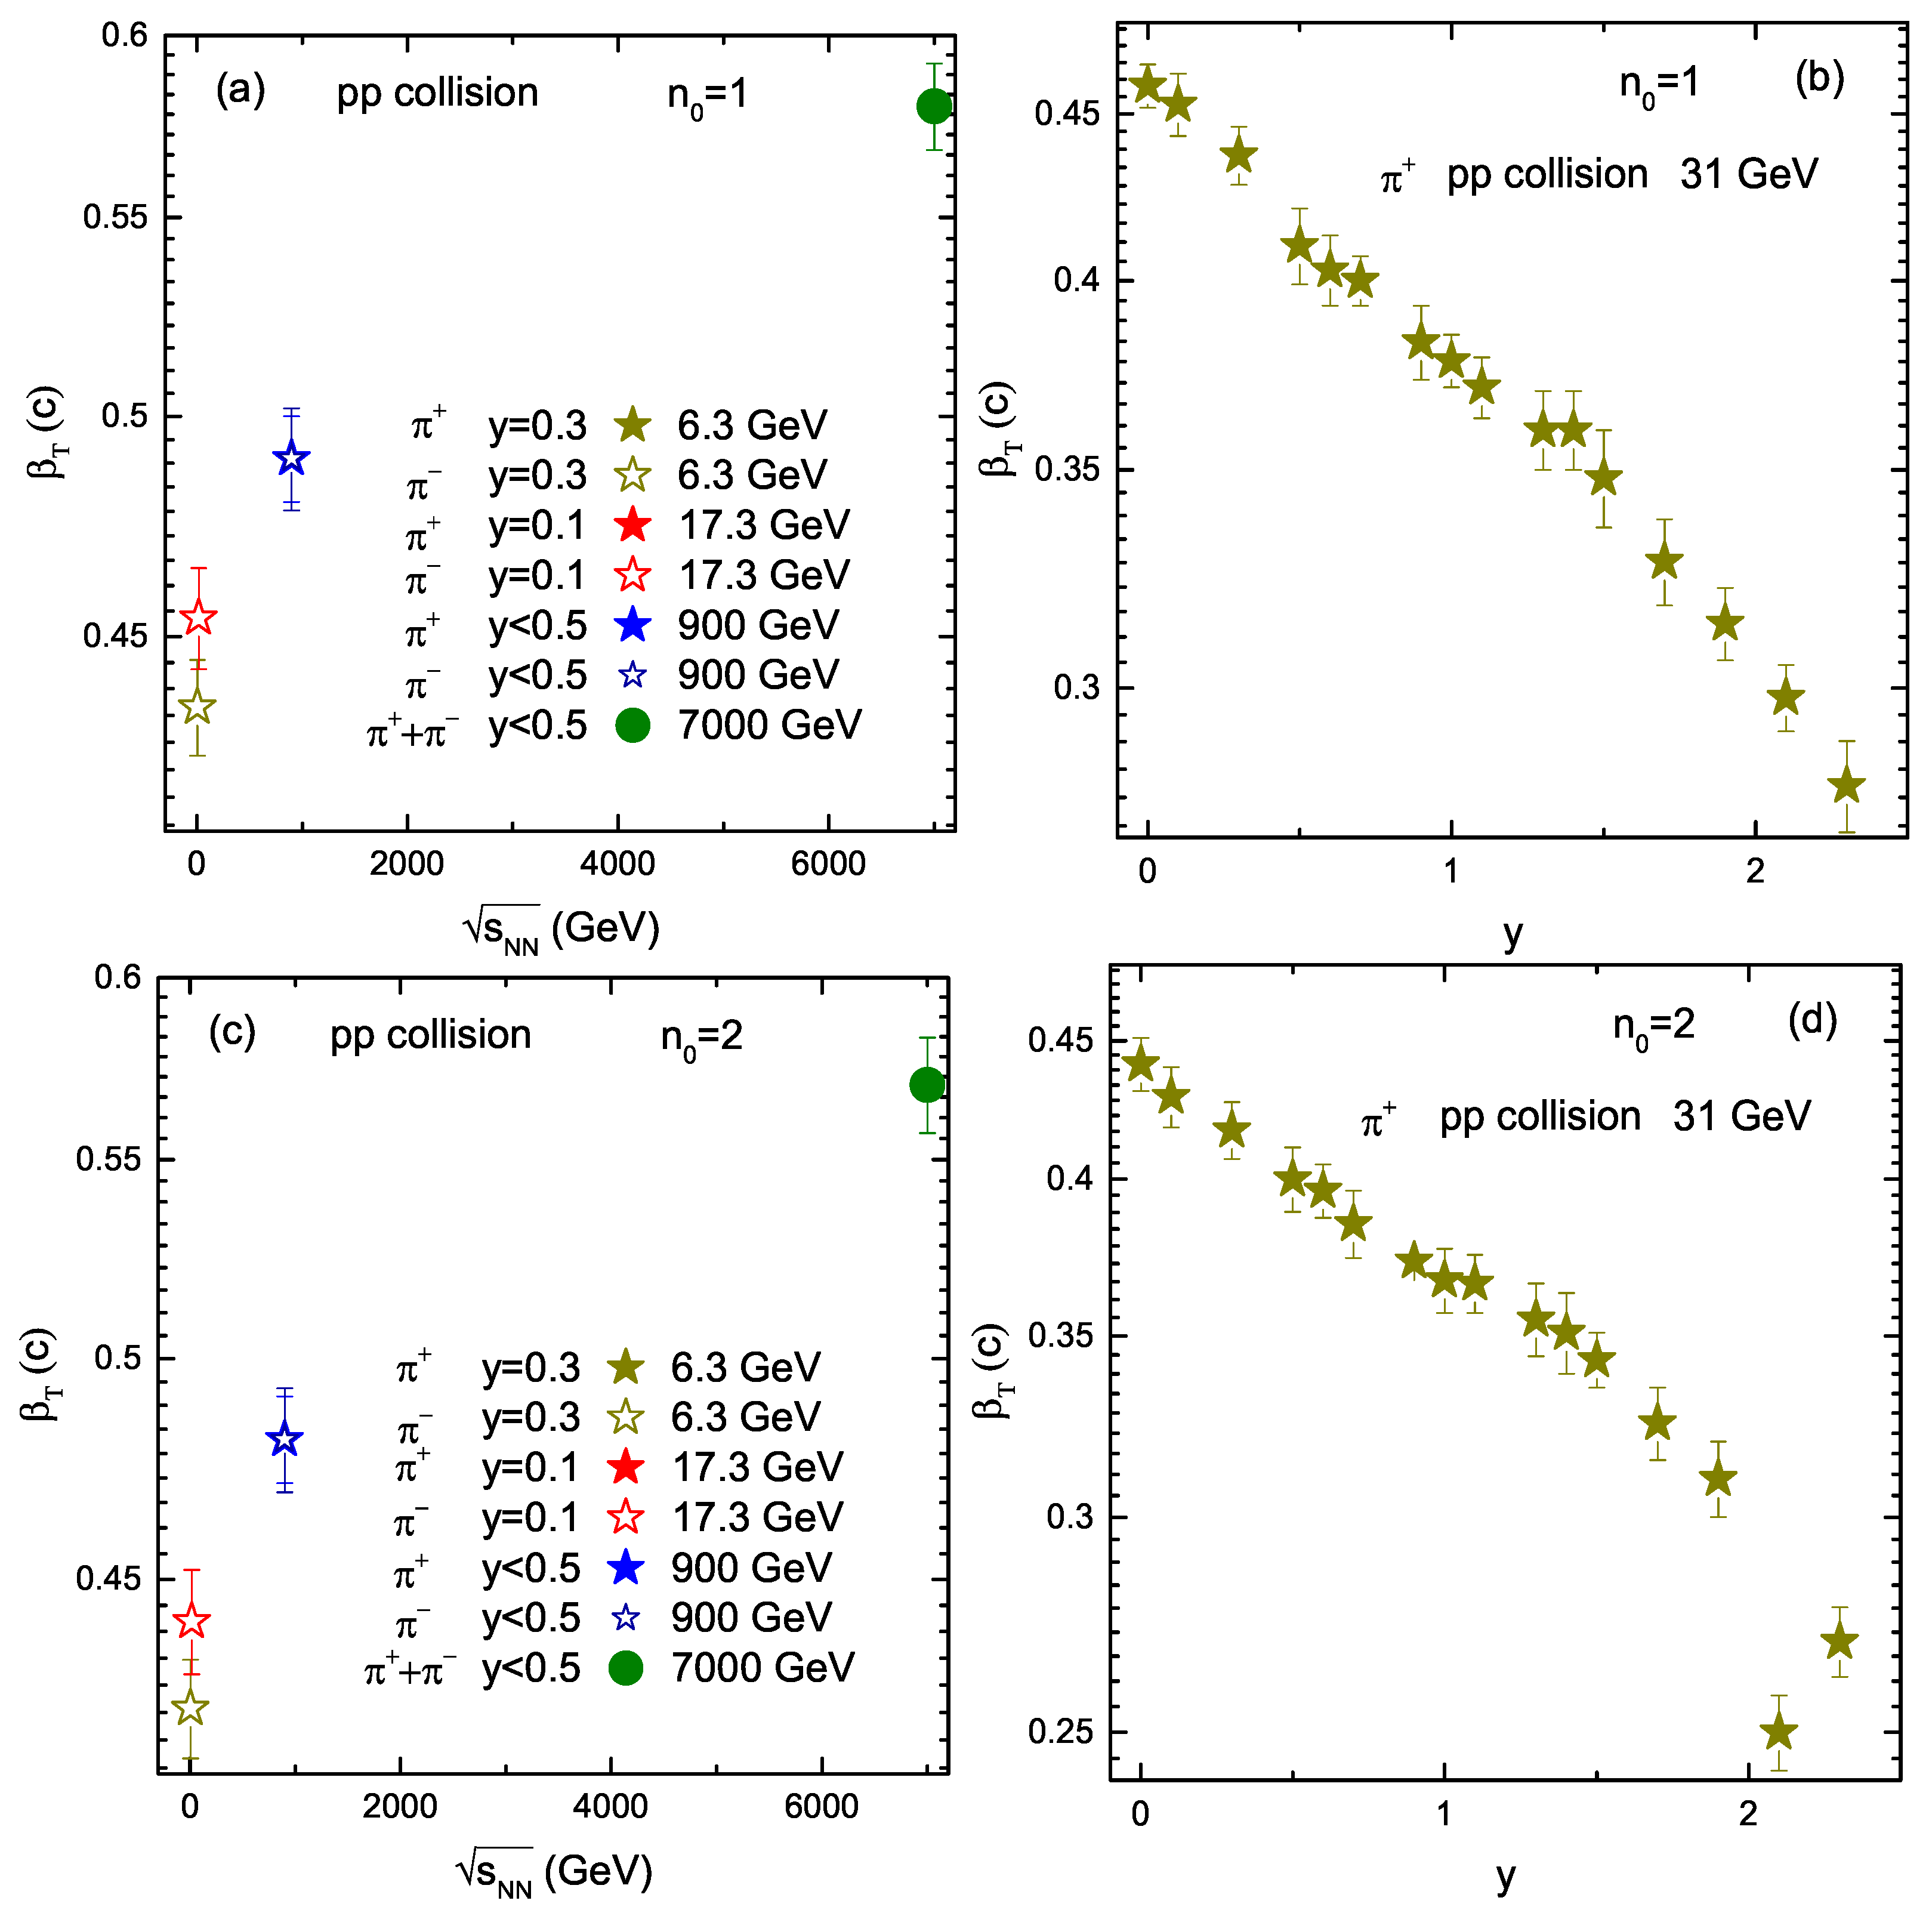
Figure 3 is similar to Figure 2, but it reports the dependence of the transverse flow velocity ( β T ) on energy in panel (a) and (c), and in panel (b) and (d) it shows the dependence of β T on rapidity. We can see that β T continuously rose with increasing energy in panel (a) and (c), (especially at 900 and 7000 GeV it increases more) because the collision energy increased more, a large amount of energy was transferred per nucleon in the system and the system expanded quickly. There is a positive correlation among T 0 and β T . The higher the energy, the higher excitation degree the system gets, and the fireball expands more rapidly. In addition, β T at 17.3 and 31 GeV in rapidity slice y = 0.1 , and at 6.3 and 31 GeV in rapidity slice y = 0.1 , are respectively equal (nearly equal). In panel (b) and (d), the declining trend of β T can be seen with increasing rapidity. The reason behind this is the lower amount of energy transfer in the forward rapidity regions due to a large penetration between the participant nucleons, and the system expands comparatively slowly. The above observation physically signifies that at large collision energy and at backward rapidity regions, the particles coming out of the system quickly compared to that in lower energies and forward rapidity regions. We noticed that the results for β T obtained from TBW model with n 0 = 2 is slightly larger than n 0 = 1.
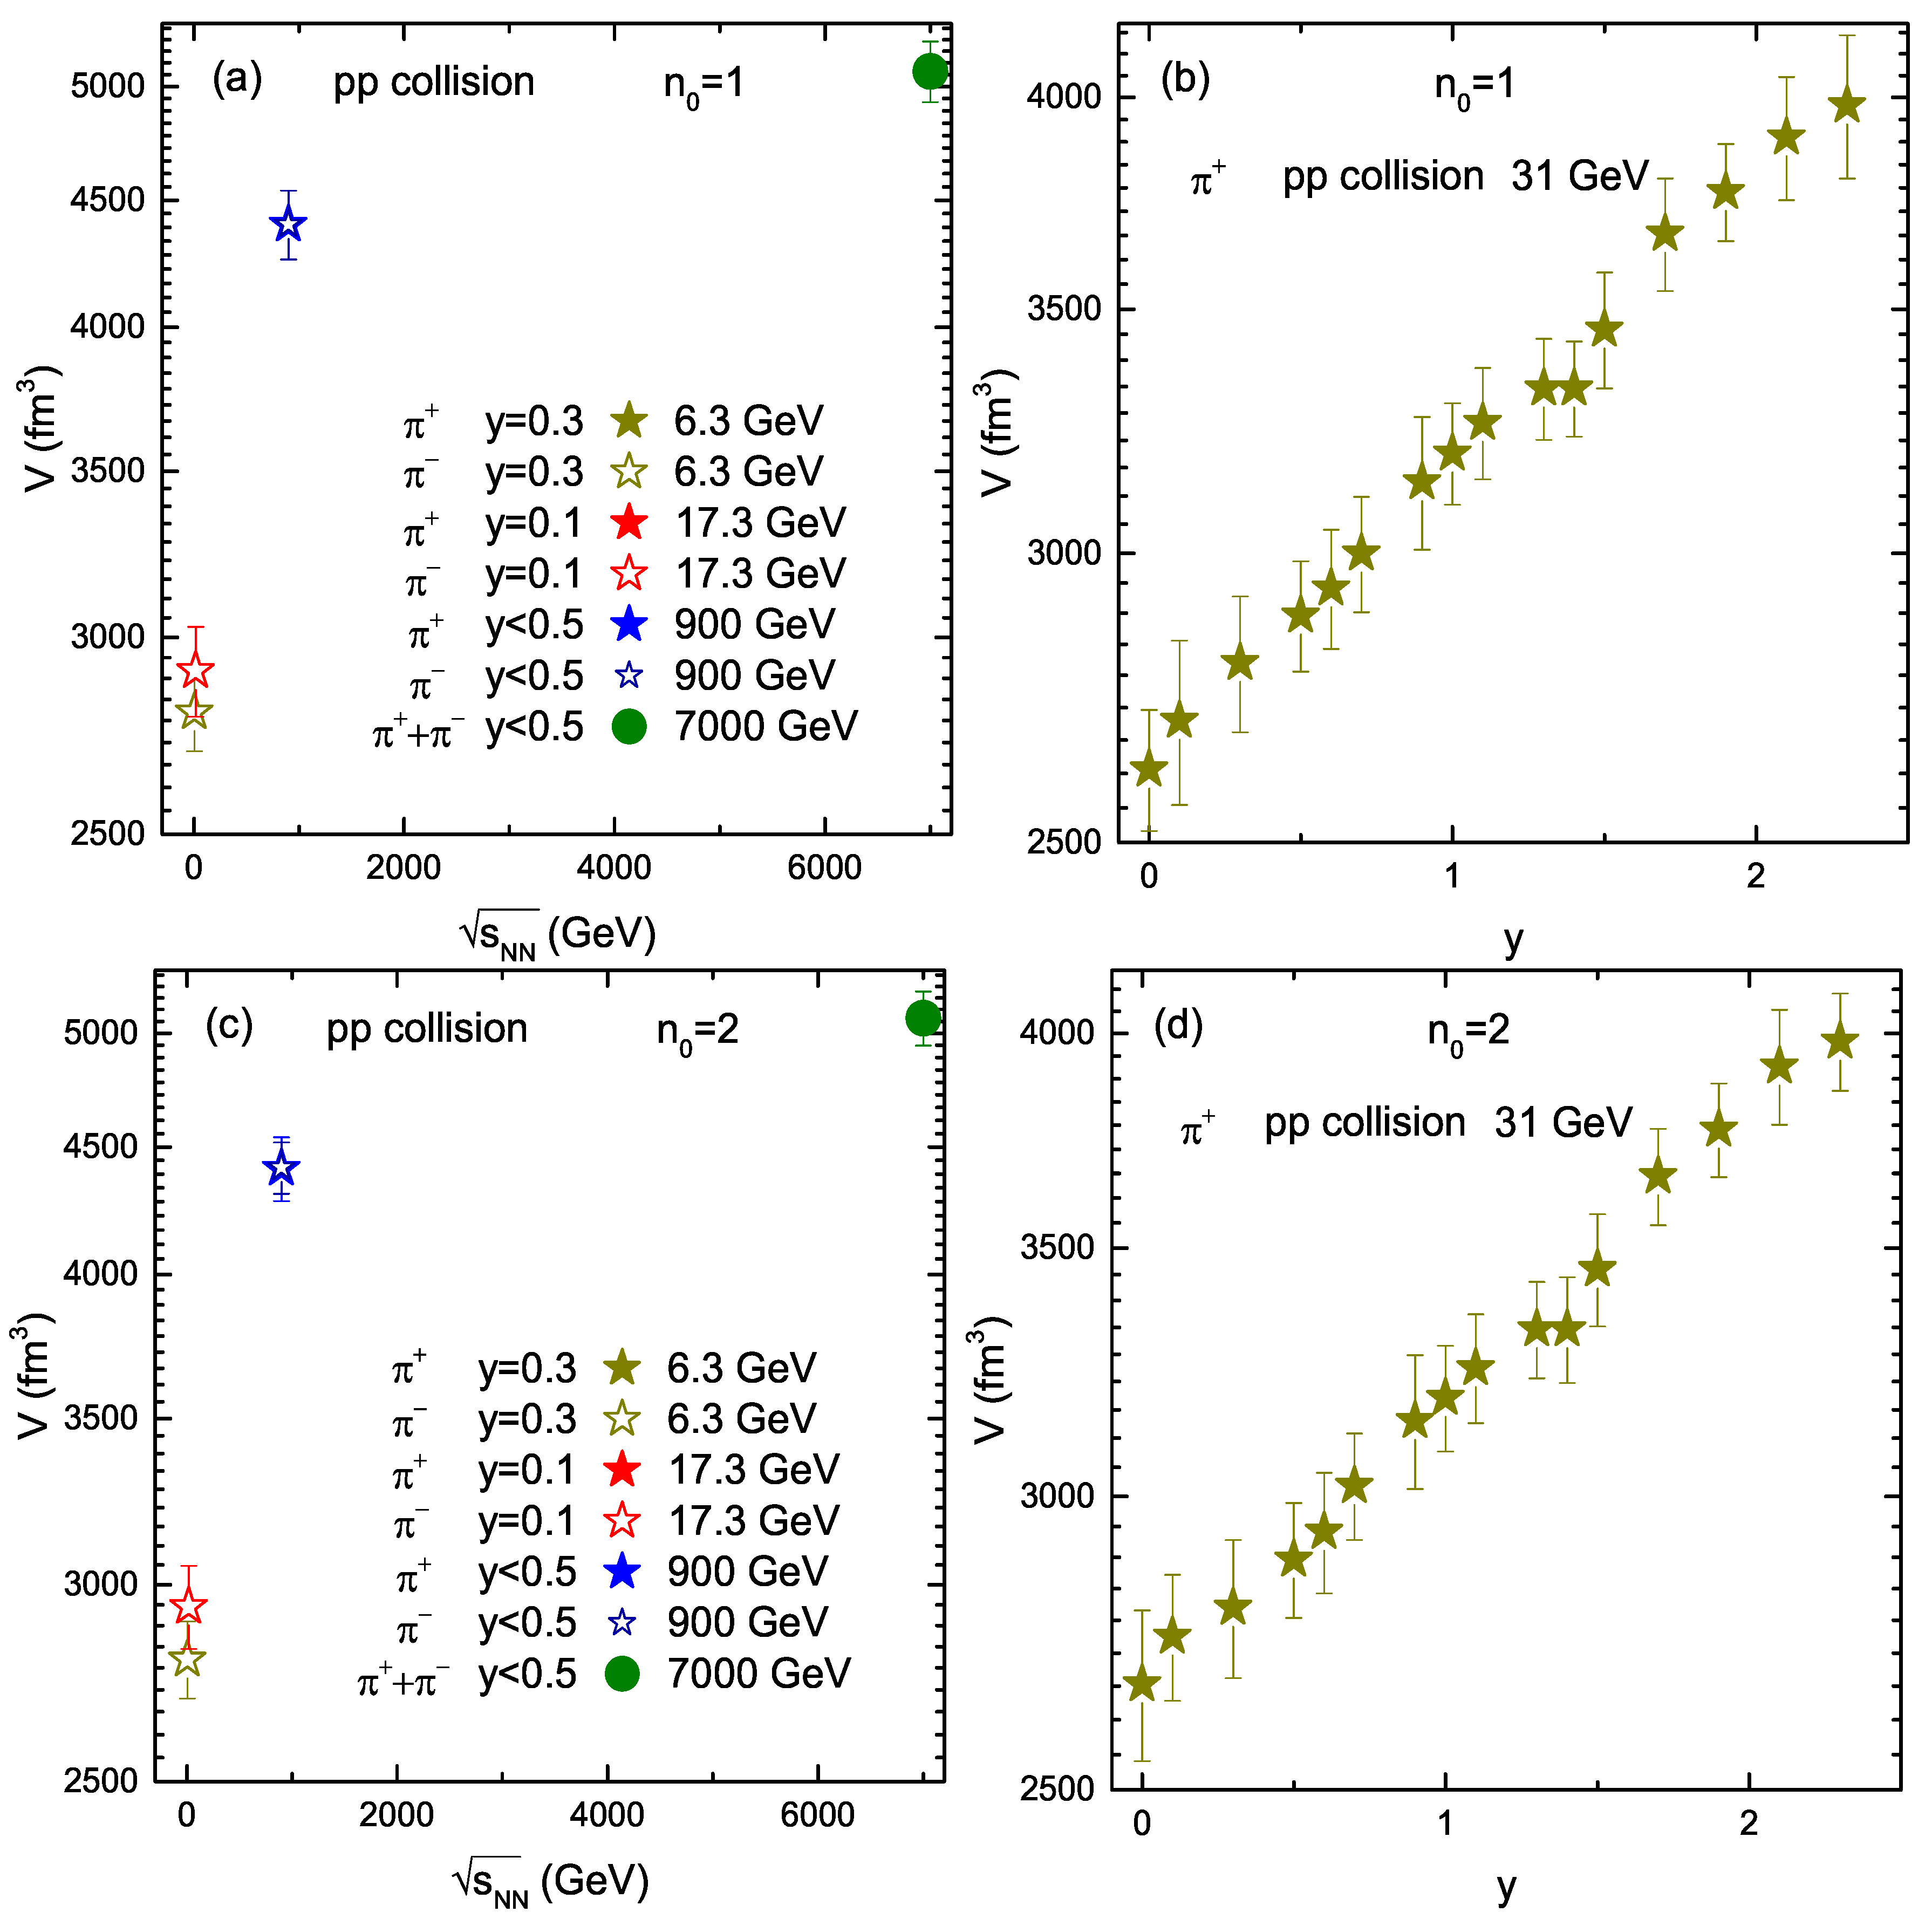
Likewise, Figure 3 and Figure 4 demonstrated the dependence of kinetic freeze-out volume (V) on energies in panels (a) and (c), and on rapidity in panels (b) and (d), respectively. In panels (a) and (c), V can be seen to rise with collision energy due to the fact that when the collision energy rises, the partonic system becomes larger due to the longer evolution time of the system. T 0 and β T , V at 17.3 and 31 GeV in rapidity slice y = 0.1 , and at 6.3 and 31 GeV in rapidity slice y = 0.1 are respectively equal (nearly equal). V in both cases of n 0 = 1 and n 0 = 2 were observed to be the same. Unlike T 0 and β T , V in Figure 2 and Figure 3 increased with increasing rapidity. Basically, the parameter V is located at N 0 , which is the normalization constant, and, due to the constraint of normalization, both V and N 0 are related to the data.
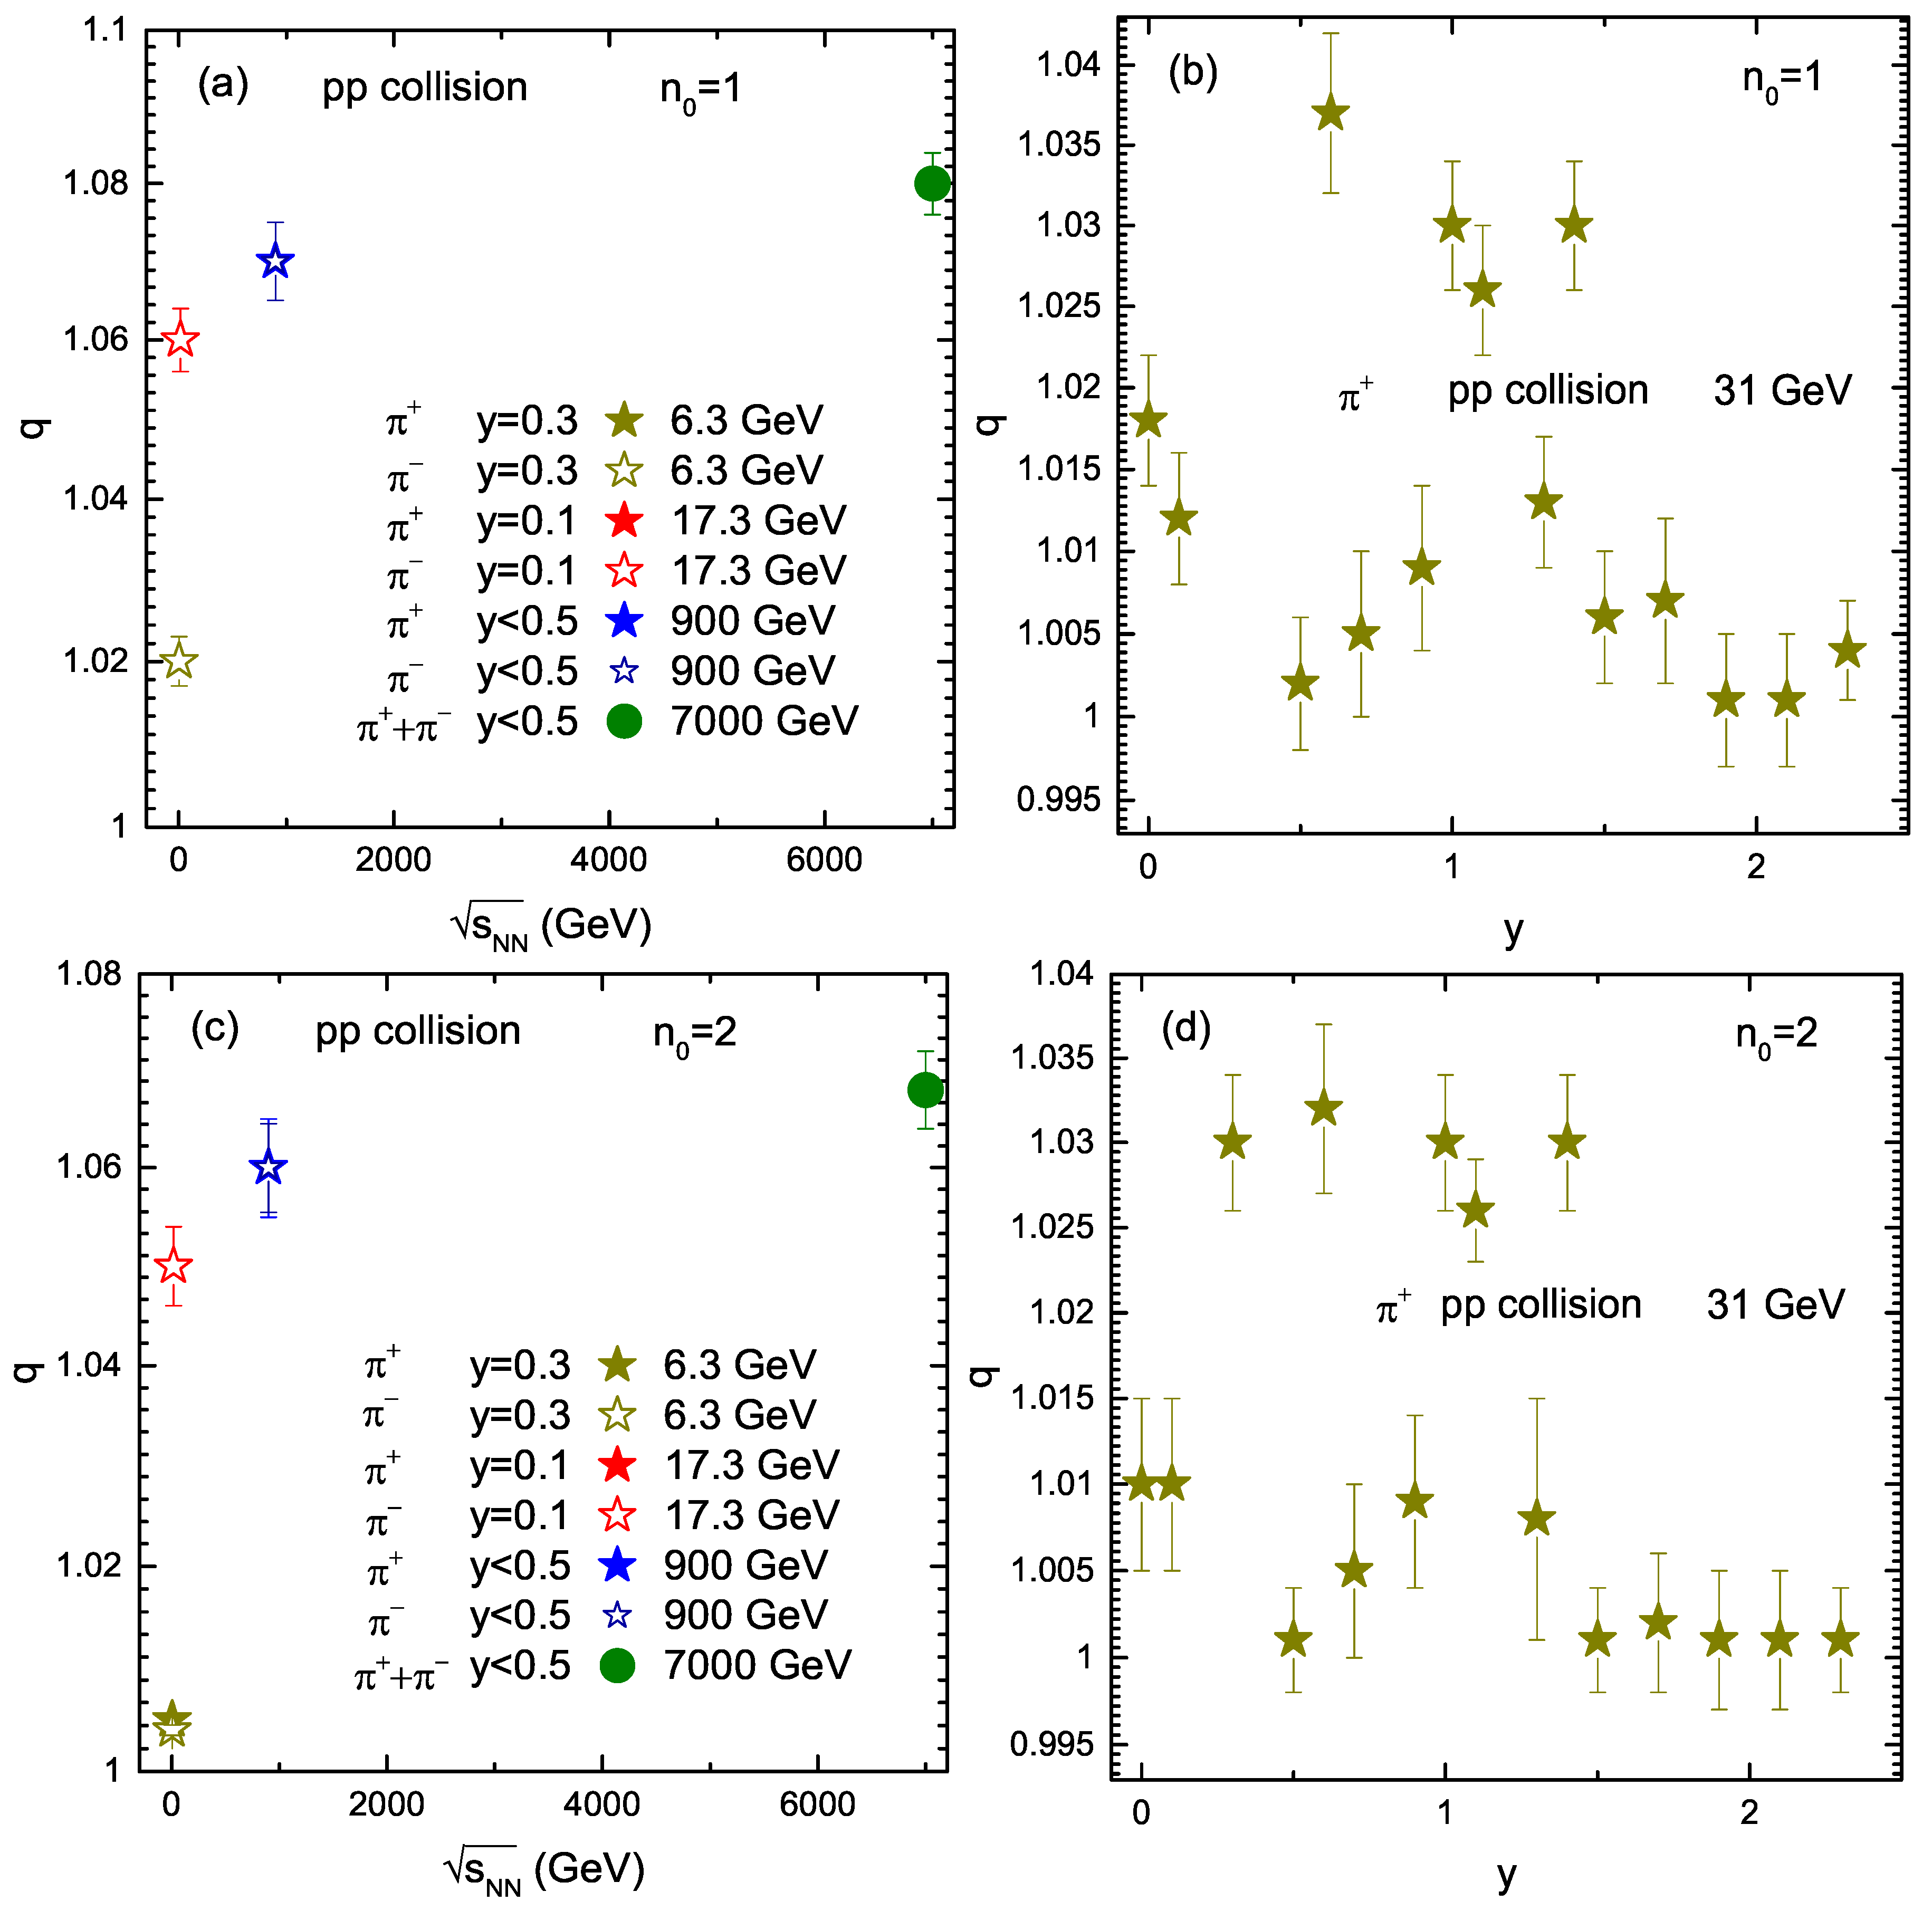
Figure 5 demonstrates the parameter q dependence on energy in panels (a) and (c), and its dependence on rapidity is presented in panels (b) and (d). The parameter q exhibits the degree of equilibrium or non-equilibrium of the system. Generally, if q = 1, the system is in an equilibrium state. However, if q >> 2, then the system is not in an equilibrium state. In the present work, q is close to 1, which demonstrates that the system is basically maintained. The equilibrium is usually relative. For an approximate equilibrium situation, one may also use the concept of local equilibrium for various local parts. If q is not too large, for instance, q ≤ 1.25, the collision system is considered to be in approximate equilibrium or local equilibrium [63,64]. We reported that q slightly increased with energy, but did not have a specific trend with rapidity. q was comparatively lower at lower energies, which means that the system was closer to an equilibrium state due to the fact that the evolution process was slower at lower energies and the system took more time to reach the equilibrium state. q was also observed to be slightly larger at n 0 = 1.
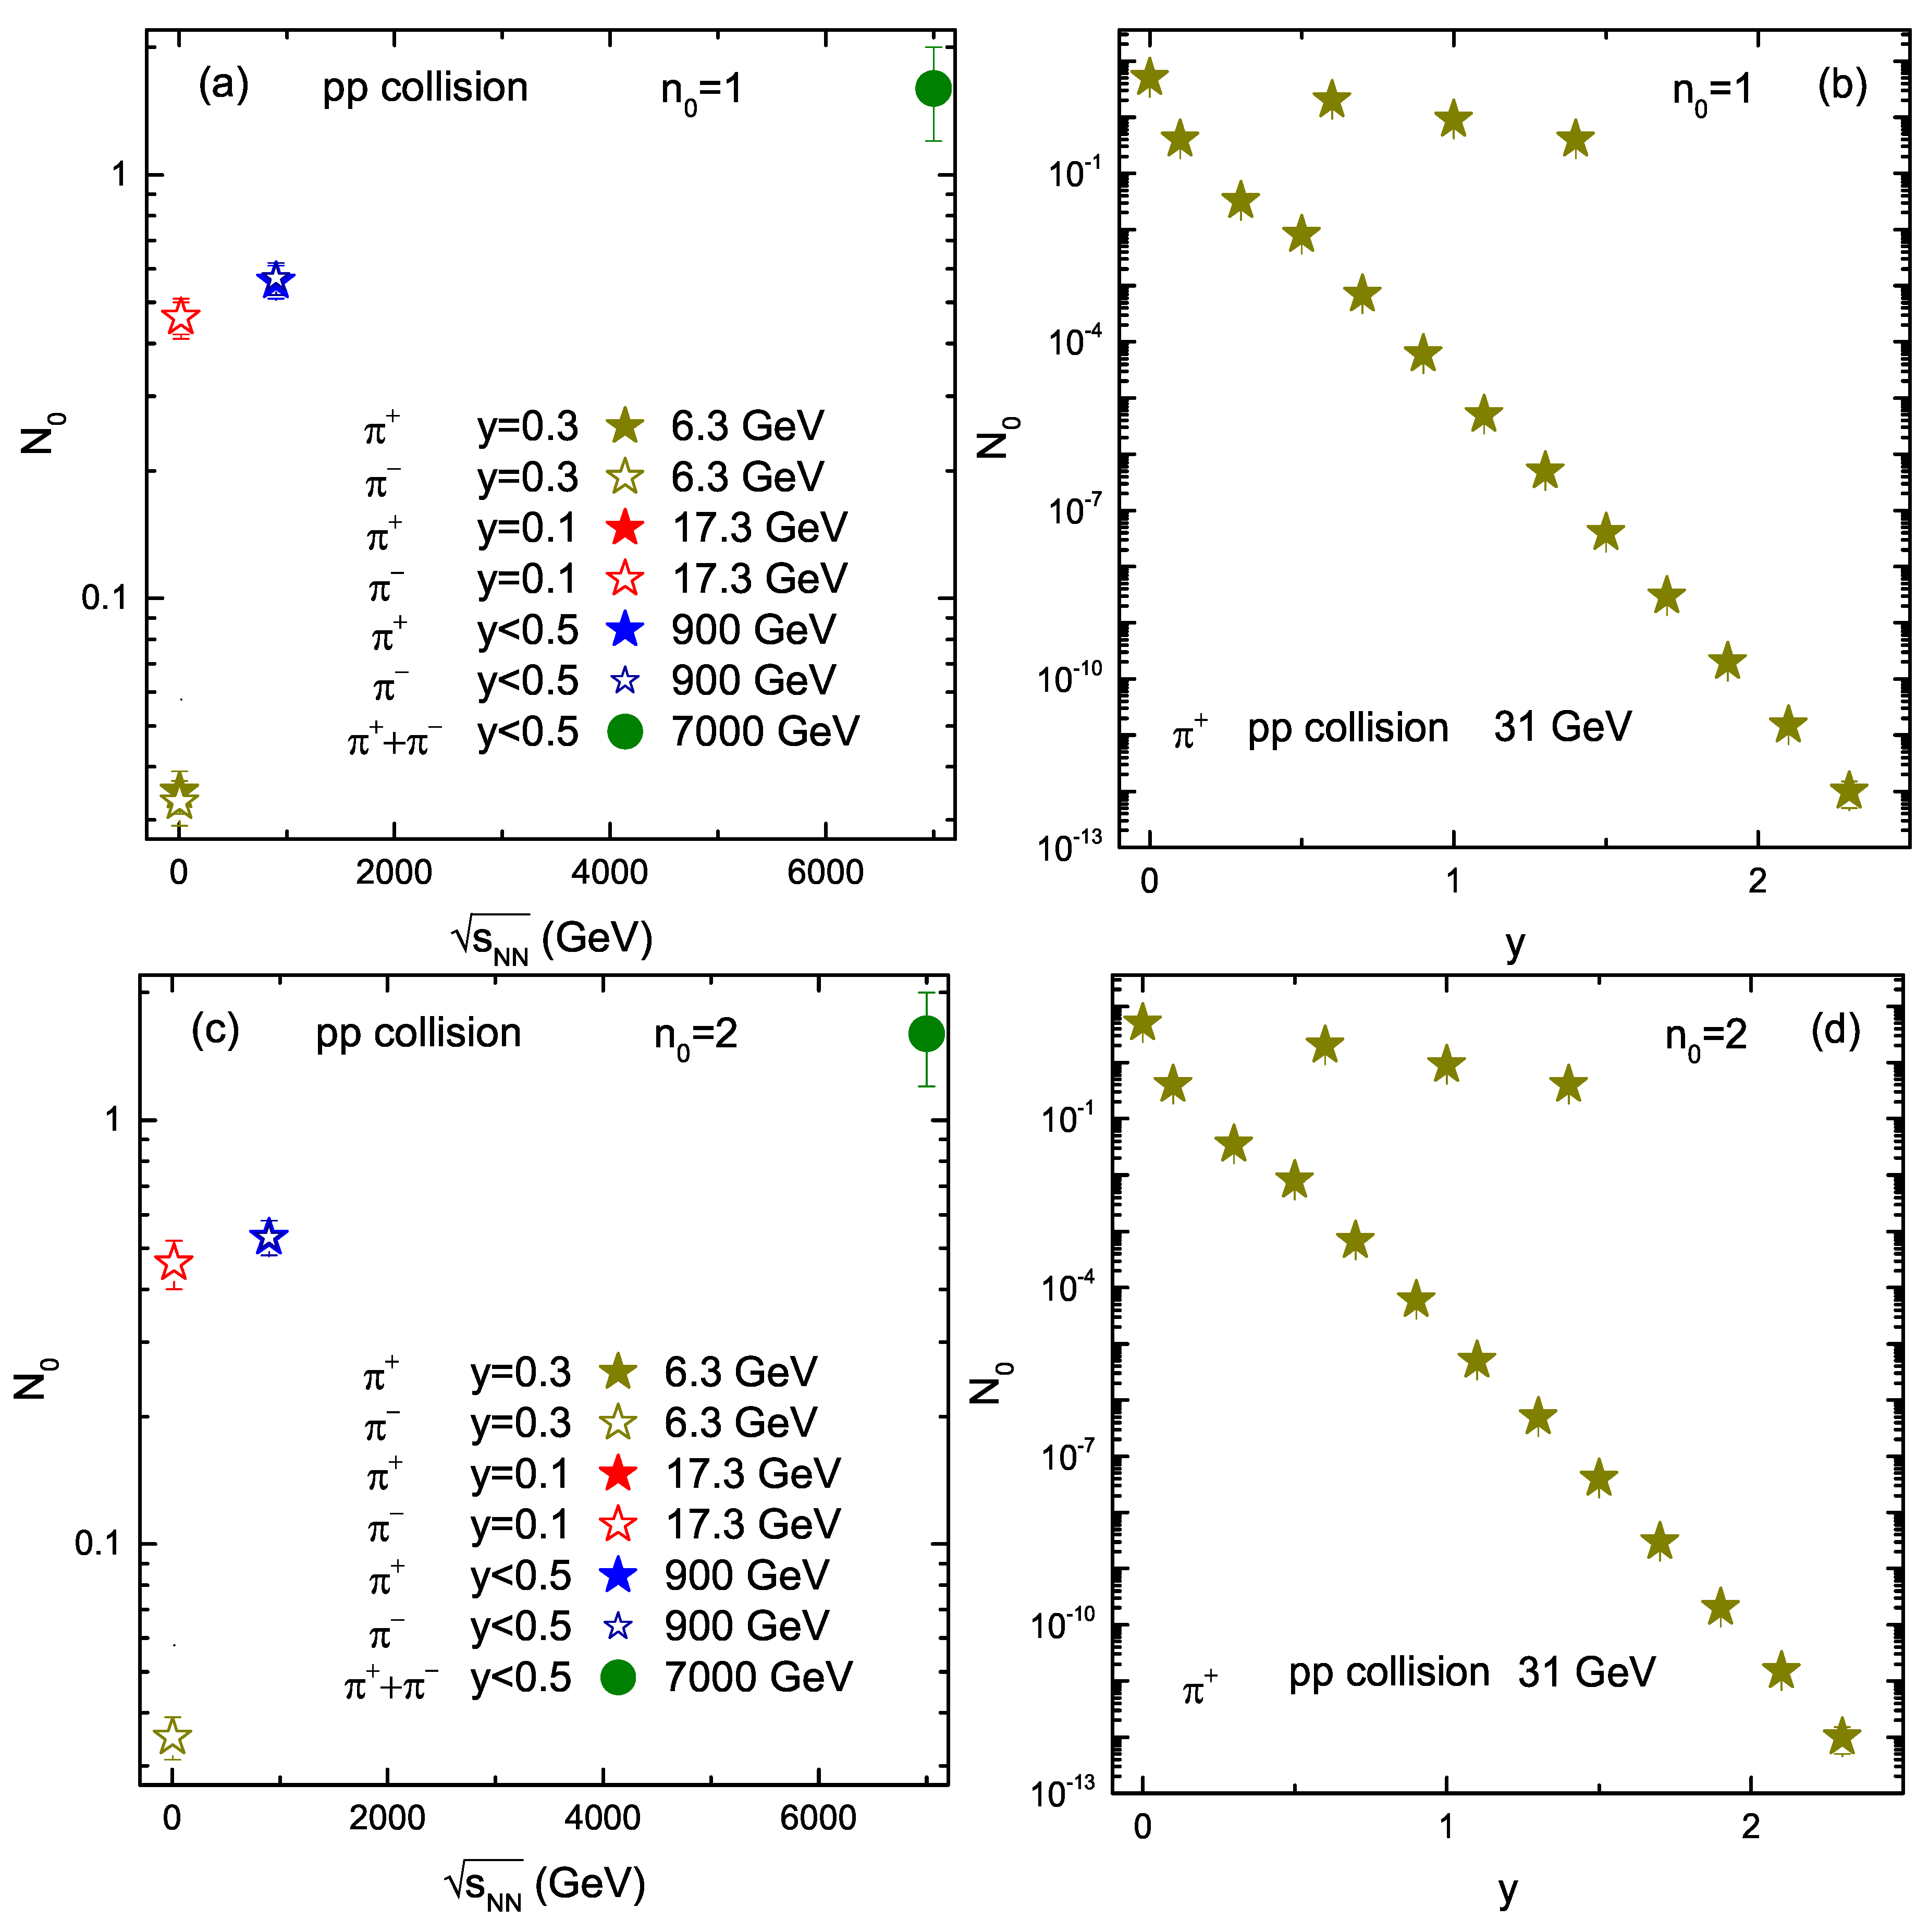
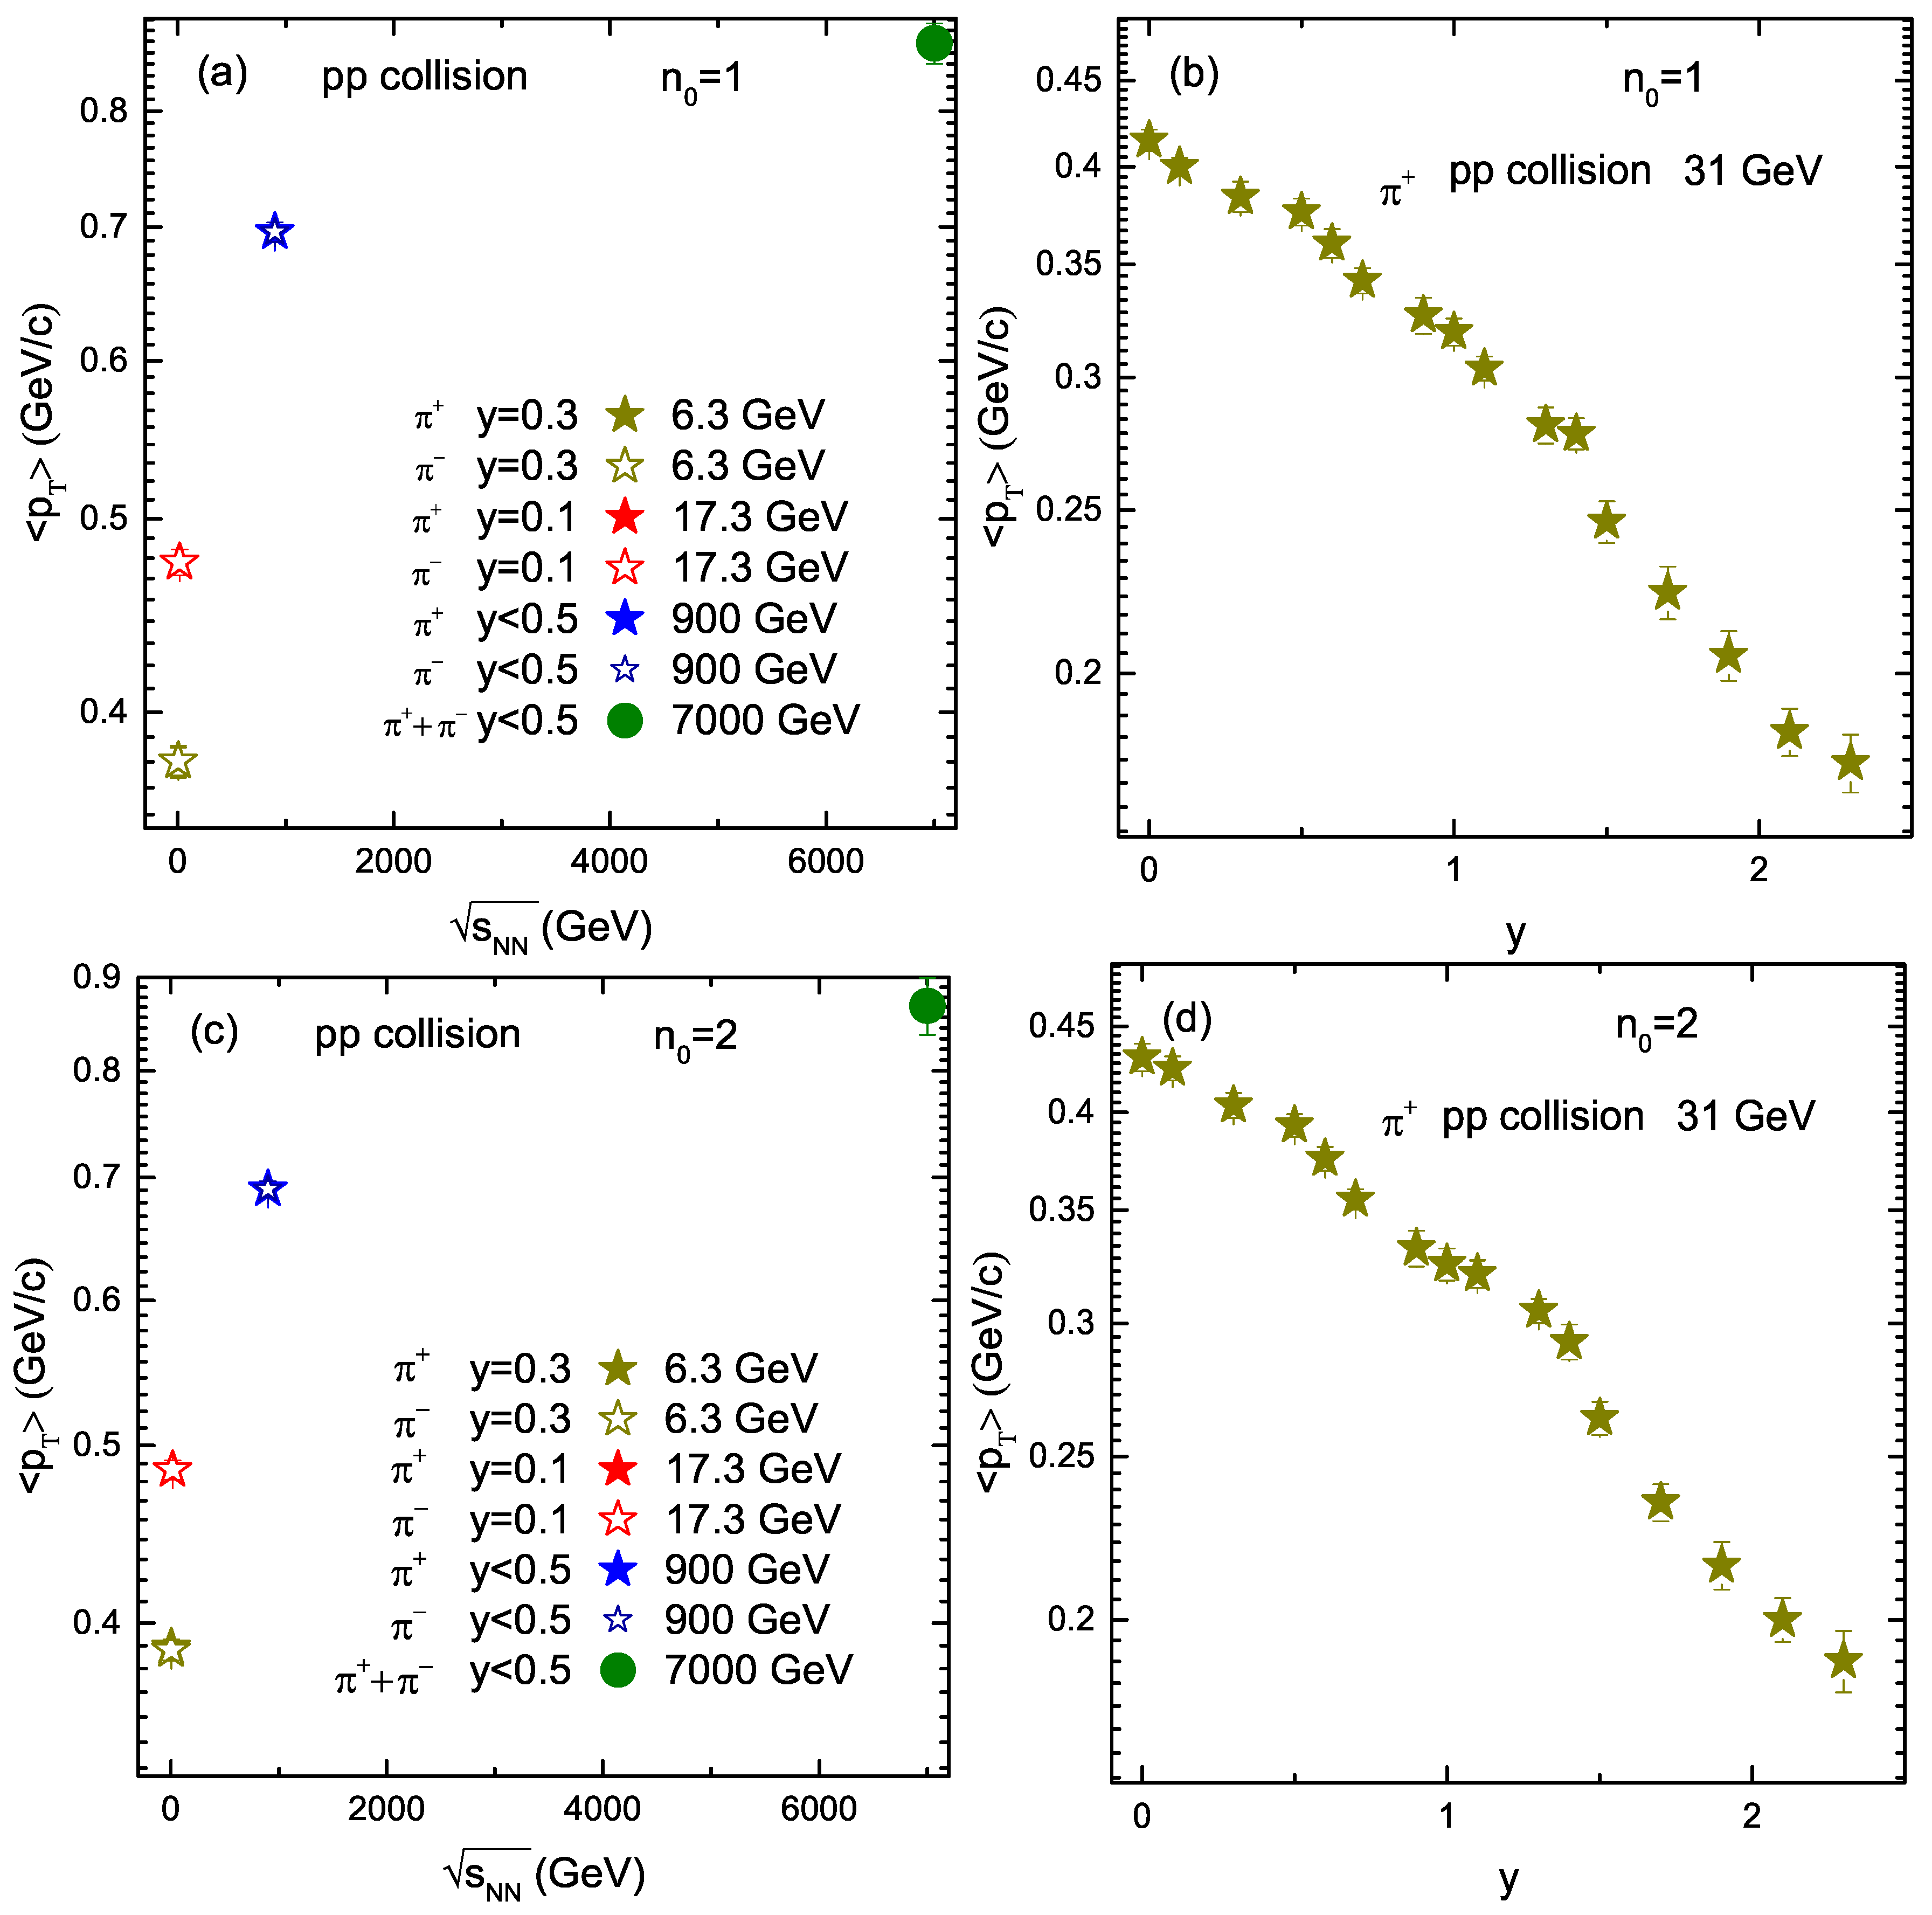
The multiplicity parameter N 0 is presented in Figure 6. Panels (a) and (c) show its increasing trend with increasing energy. When the energy increases, more energy is deposited in the collided system, which corresponds to the production of a large number of particles due to the deposited energy being transformed to mass, due to the conservation of energy. Similarly, the case in panels (b) and (d), N 0 decreased with increasing rapidity, as the energy deposition in forward rapidity regions was small, due to large penetration among nucleons. We see that N 0 in the rapidity slices 0.4, 1 and 1.4 are not consistent, i.e., N 0 was larger in these rapidity regions than some of the lower rapidity regions, but as a whole, the results show a decreasing trend of N 0 with increasing rapidity. Likewise, the mean transverse momentum ( < p T > ) in Figure 7 increased with energy and decreased in forward rapidity regions due to the transfer of large momentum (energy) in the system at higher energies and backward rapidities. Likewise, in T 0 , β T , V and N 0 , there was a sharp maximum at higher energies, i.e., at 900 and 7000 GeV. This is due to the transfer of a very large amount of momentum per nucleon in the system and the system reaching a higher degree of excitation.
We noticed that the difference in the extracted parameters from the TBW model with n 0 = 1 and 2 were close to each other and approximately within the error because when n 0 = 2, it closely resembled the hydrodynamical profile. Furthermore, n 0 = 1 was the closest approach to hydrodynamic at freeze-out. Therefore, there was no obvious difference among the two flow profiles for the extracted parameters. However, we believe that if n 0 is set as a free parameter, then it will be too mutable, and of course debatable [53], and will have an obvious effect on the extracted parameters.

4. Conclusions

We summarize here our main observations and conclusions.
(1) We analyzed the transverse momentum spectra of π + ( π )( π + + π ) at 6.3, 17.3, 900 and 7000 GeV as well as at 31 GeV in different rapidity slices by the blast-wave model with Tsallis statistics (TBW) by fixing n 0 = 1 and n 0 = 2 in proton-proton collisions and extracted the bulk properties in terms of the kinetic freeze-out temperature ( T 0 ), transverse flow velocity ( β T ) and kinetic freeze-out volume. We also extracted the mean transverse momentum from the fit function.
(2) We reported that T 0 increases with the rise of collision energy due to the higher degree of excitation of the system at higher energies, and decreases with increasing the rapidity due to decreasing the transfer of energy towards forward rapidities. In addition, we also observed that T 0 in y = 0.1 at 31 and 17.3 GeV, and y = 0.3 at 31 and 6.3 GeV are, respectively, the same in both cases of n 0 = 1 and 2, which shows their similar thermodynamic behavior. Similarly, the transverse flow velocity increases with energy and decreases from backward rapidity regions to forward rapidity regions, which reveals that the system expands quickly at larger energies and backward rapidity regions.
(3) The kinetic freeze-out volume increases with energy due to large initial bulk system at higher energies, and it also increases with increasing rapidity. In addition, the mean transverse momentum increases with increasing energy and decrease with increasing rapidity because the momentum transfer at higher energies and lower rapidity regions is larger.
(4) The entropy parameter q increases with increasing energy due to faster evolution process at higher energies. No specific dependence of q on rapidity was reported.
(5) The multiplicity parameter N 0 increases with increasing collision energy while it decreases with increasing rapidity because of the large amount of energy deposited in the system at higher energies and in low rapidity slices, which correspond to the production of a large number of particles.
(6) The kinetic freeze-out volume in n 0 = 1 and n 0 = 2 are equal; however, the kinetic freeze-out temperature and mean transverse momentum are slightly larger in n 0 = 1, and on the other hand, the transverse flow velocity is slightly larger in n 0 = 2. The difference in the parameters extracted in n 0 = 1 and 2 is not obvious.

Author Contributions

Formal analysis, M.W.; funding acquisition, A.A.K.H.I.; investigation, M.W., M.A. and A.A.K.H.I.; project administration, A.A.K.H.I.; resources, A.A.K.H.I.; software, M.W.; supervision, M.A.; validation, A.A. and A.A.K.H.I.; writing—original draft, M.W; writing—review and editing, M.W. and M.A. All authors have read and agreed to the published version of the manuscript.

Funding

This research was funded by Ajman University, Internal Research grant number DGSR Ref. 2021-IRG-HBS-12.

Institutional Review Board Statement

Not applicable.

Informed Consent Statement

Not applicable.

Data Availability Statement

The data used to support the findings of this study are included within the article and are cited at relevant places within the text as references.

Acknowledgments

The authors would like to thank the support from the Ajman University Internal Research grant number DGSR Ref. 2021-IRG-HBS-12.

Conflicts of Interest

The authors declare that they are in compliance with ethical standards regarding the content of this paper.

Appendix A

The transverse momentum spectra of the particles produced in high-energy nucleus-nucleus and proton-proton collisions have a tangled structure and a single probability density function is not sufficient for the description of p T , especially when p T 100 GeV/c [65]. For such cases, the model analyses give several p T regions [66], which consist of p T < 4–6 GeV/c as a first region, 4–6 GeV/c < p T < 17–20 GeV/c as a second region and the third region with p T > 17–20 GeV/c. Different regions are supposed to be correspondent to different interaction mechanisms. Even for the same p T region, different models give different explanations due to their different methods and microscopic pictures. Through string dynamics in ref. [66], different whole features of fragmentation and hadronization of partons are displayed by different p T regions. The first p T region leads to the the effects and changes by the medium take part in the main role, while their occurrence in the second p T region is weak. Meanwhile, in the third p T region, the impact of the medium becomes insignificant due to the nuclear transparency. The second p T region is expected to consist of a maximum number of string from the string frame of reference, and results in the fusion and creation of strings and collective behavior of partons, and due to string fusion, the second p T region is suggested as a possible region for the formation of the Quark-Gluon Plasma (QGP). The first p T region has a maximum number of hadrons due to the direct hadronization of the low-energy strings into mesons [66] and consequently the minimum number of strings.
In the present work, we used the idea of multiple p T regions and different explanations from ref. [66]. In our work, we consider the first p T region as a soft excitation process, while the second and third p T regions are considered as hard and very hard scattering processes, respectively. There is also a forth region p T < 0.3–0.5, which is regarded as the very soft excitation process where the resonance of pions occurs.
We would also like to emphasize that the transverse momentum spectra of the particles give the information [66] about the transverse excitation degree and dynamic expansion of the collision system. For instance, if we assume the hot and dense matter formed in high energy collisions is the big fireball, then the constituents that make up this fireball, such as quarks and gluons can be regarded as a source of emission and the p T spectrum of the final state particles is contributed to by these sources. The transverse pressure gradient, especially at the edges, cause the transverse expansion of the reaction system. The hot material in the initial stage of collisions expand only in the longitudinal dimension along the z-axis. At the same time, at the transverse edges, the energy density of the reactive material reduces with the longitudinal motion of the system forming a transverse pressure gradient [67,68]. The transverse expansion is very sensitive to the state of matter and during the phase transition, the pressure of the system remains invariant, but the energy density fluctuates a lot. Hence, the study of p T distribution of the interacting systems is very important.

References

  1. Waqas, M.; Li, B.C. Kinetic freeze-out temperature and transverse flow velocity in Au-Au collisions at RHIC-BES energies. Adv. High Energy Phys. 2020, 2020, 1787183. [Google Scholar] [CrossRef] [Green Version]
  2. Wang, H.; Chen, J.H.; Ma, Y.G.; Zhang, S. Charm hadron azimuthal angular correlations in Au + Au collisions at s NN = 200 GeV from parton scatterings. Nucl. Sci. Tech. 2019, 30, 185. [Google Scholar] [CrossRef]
  3. Shen, C.; Yan, L. Recent development of hydrodynamic modeling in heavy-ion collisions. Nucl. Sci. Tech. 2020, 31, 122. [Google Scholar] [CrossRef]
  4. Tawfik, A.N. Out-Of-Equilibrium Transverse Momentum Spectra of Pions at LHC Energies. Adv. High Energy Phys. 2019, 2019, 4604608. [Google Scholar] [CrossRef]
  5. Yu, H.; Fang, D.Q.; Ma, Y.G. Investigation of the symmetry energy of nuclear matter using isospin-dependent quantum molecular dynamics. Nucl. Sci. Tech. 2020, 31, 61. [Google Scholar] [CrossRef]
  6. Csanad, M.; Majer, I. Initial temperature and EoS of quark matter from direct photons. Phys. Part. Nucl. Lett. 2011, 8, 1013–1015. [Google Scholar] [CrossRef]
  7. Li, L.L.; Liu, F.H. Kinetic Freeze-Out Properties from Transverse Momentum Spectra of Pions in High Energy Proton-Proton Collisions. Physics 2020, 2, 277–308. [Google Scholar] [CrossRef]
  8. Waqas, M.; Liu, F.H. Initial, effective, and kinetic freeze-out temperatures from transverse momentum spectra in high-energy proton(deuteron)–nucleus and nucleus–nucleus collisions. Eur. Phys. J. Plus 2020, 135, 147. [Google Scholar] [CrossRef]
  9. Cleymans, J.; Paradza, M.W. Tsallis Statistics in High Energy Physics: Chemical and Thermal Freeze-Outs. Physics 2020, 2, 654–664. [Google Scholar] [CrossRef]
  10. Csanad, M.; Majer, I. Equation of state and initial temperature of quark gluon plasma at RHIC. Cent. Eur. J. Phys. 2012, 10, 850–857. [Google Scholar] [CrossRef] [Green Version]
  11. Adare, A. Enhanced production of direct photons in Au+Au collisions at s NN = 200 GeV and implications for the initial temperature. Phys. Rev. Lett. 2010, 104, 132301. [Google Scholar] [CrossRef] [PubMed] [Green Version]
  12. Nayak, J.K.; Alam, J.-e.; Sarkar, S.; Sinha, B. Measuring initial temperature through photon to dilepton ratio in heavy ion collision. J. Phys. G 2008, 35, 104161. [Google Scholar] [CrossRef]
  13. Soltz, R.A.; Garishvili, I.; Cheng, M.; Abelev, B.; Glenn, A.; Newby, J.; Levy, L.A.L.; Pratt, S. Constraining the initial temperature and shear viscosity in a hybrid hydrodynamic model of s NN = 200 GeV Au+Au collisions using pion spectra, elliptic flow, and femtoscopic radii. Phys. Rev. C 2013, 87, 044901. [Google Scholar] [CrossRef]
  14. Waqas, M.; Peng, G.X.; Ajaz, M.; Ismail, A.A.K.H.; Yang, P.P.; Wazir, Z. Extraction of freezeout parameters and their dependence on collision energy and collision cross-section. arXiv 2021, arXiv:2112.00975. [Google Scholar]
  15. Waqas, M.; Liu, F.H.; Wazir, Z. Dependence of temperatures and kinetic freeze-out volume on centrality in Au-Au and Pb-Pb collisions at high energy. Adv. High Energy Phys. 2020, 2020, 8198126. [Google Scholar] [CrossRef]
  16. Wang, Q.; Liu, F.H.; Olimov, K.K. Initial- and final-state temperatures of emission source from differential cross-section in squared momentum transfer in high energy collisions. Adv. High Energy Phys. 2021, 2021, 6677885. [Google Scholar] [CrossRef]
  17. Tawfik, A.N. Equilibrium statistical-thermal models in high-energy physics. Int. J. Mod. Phys. A 2014, 29, 1430021. [Google Scholar] [CrossRef] [Green Version]
  18. Tawfik, A.N.; Yassin, H.; Elyazeed, E.R.A. Extensive/nonextensive statistics for pT distributions of various charged particles produced in p+p and A+A collisions in a wide range of energies. arXiv 2020, arXiv:1905.12756. [Google Scholar]
  19. Yassin, H.; Elyazeed, E.R.A.; Tawfik, A.N. Transverse momentum spectra of strange hadrons within extensive and nonextensive statistics. Phys. Scr. 2020, 95, 7. [Google Scholar] [CrossRef]
  20. Waqas, M.; Liu, F.H.; Wang, R.Q.; Siddique, I. Energy scan/dependence of kinetic freeze-out scenarios of multi-strange and other identified particles in central nucleus-nucleus collisions. Eur. Phys. J. A 2020, 56, 188. [Google Scholar] [CrossRef]
  21. Waqas, M.; Peng, G.X.; Wang, R.Q.; Ajaz, M.; Ismail, A.A.K.H. Freezeout properties of different light nuclei at the RHIC beam energy scan. Eur. Phys. J. Plus 2021, 136, 1082. [Google Scholar] [CrossRef]
  22. Kumar, L. Systematics of Kinetic Freeze-out Properties in High Energy Collisions from STAR. Nucl. Phys. A 2014, 931, 1114–1119. [Google Scholar] [CrossRef] [Green Version]
  23. Waqas, M.; Peng, G.X. Study of Proton, Deuteron, and Triton at 54.4 GeV. Adv. High Energy Phys. 2021, 2021, 6674470. [Google Scholar] [CrossRef]
  24. Waqas, M.; Peng, G.X.; Liu, F.H. An evidence of triple kinetic freezeout scenario observed in all centrality intervals in Cu–Cu, Au–Au and Pb–Pb collisions at high energies. J. Phys. G 2021, 48, 075108. [Google Scholar] [CrossRef]
  25. Waqas, M.; Peng, G.X.; Liu, F.H.; Wazir, Z. Effects of coalescence and isospin symmetry on the freezeout of light nuclei and their anti-particles. Sci. Rep. 2021, 11, 20252. [Google Scholar] [CrossRef]
  26. Liu, F.H. Unified description of multiplicity distributions of final-state particles produced in collisions at high energies. Nucl. Phys. A 2008, 810, 159–172. [Google Scholar] [CrossRef]
  27. Hagedorn, R. Multiplicities, pT Distributions and the Expected Hadron → Quark-Gluon Phase Transition. Riv. Nuovo Cim. 1983, 6N10, 1–50. [Google Scholar] [CrossRef]
  28. Liu, F.H.; Li, J.S. Isotopic production cross section of fragments in Fe-56 + p and Xe-136 (Xe-124) + Pb reactions over an energy range from A-300 to A-1500 MeV. Phys. Rev. C 2008, 78, 044602. [Google Scholar] [CrossRef]
  29. Tsallis, C. Possible Generalization of Boltzmann-Gibbs Statistics. J. Statist. Phys. 1988, 52, 479–487. [Google Scholar] [CrossRef]
  30. Olimov, K.K.; Kanokova, S.Z.; Olimov, A.K.; Umarov, K.I.; Tukhtaev, B.J.; Gulamov, K.G.; Yuldashev, B.S.; Lutpullaev, S.L.; Saidkhanov, N.S.; Olimov, K.; et al. Combined analysis of midrapidity transverse momentum spectra of the charged pions and kaons, protons and antiprotons in p + p and Pb + Pb collisions at (snn)1/2 = 2.76 and 5.02 TeV at the LHC. Mod. Phys. Lett. A 2020, 35, 2050237. [Google Scholar] [CrossRef]
  31. Ajaz, M.; Waqas, M.; Peng, G.; Yasin, Z.; Younis, H.; Al Karim Haj Ismai L, A. Study of pT spectra of light particles using modified Hagedorn function and cosmic rays Monte Carlo event generators in proton-proton collisions at 900 GeV center of mass energy. arXiv 2021, arXiv:2112.03187. [Google Scholar]
  32. Schnedermann, E.; Sollfrank, J.; Heinz, U.W. Thermal phenomenology of hadrons from 200-A/GeV S+S collisions. Phys. Rev. C 1993, 48, 2462–2475. [Google Scholar] [CrossRef] [PubMed] [Green Version]
  33. Abelev, B.I. Identified particle production, azimuthal anisotropy, and interferometry measurements in Au+Au collisions at s(NN)**(1/2) = 9.2-GeV. Phys. Rev. C 2010, 81, 024911. [Google Scholar] [CrossRef]
  34. Tang, Z.; Yi, L.; Ruan, L.; Shao, M.; Chen, H.; Li, C.; Mohanty, B.; Sorensen, P.; Tang, A.; Xu, Z. Statistical Origin of Constituent-Quark Scaling in the QGP hadronization. Chin. Phys. Lett. 2013, 30, 031201. [Google Scholar] [CrossRef] [Green Version]
  35. Wilk, G.; Wlodarczyk, Z. Interpretation of the Nonextensivity Parameter q in Some Applications of Tsallis Statistics and Lévy Distributions. Phys. Rev. Lett. 2000, 84, 2770. [Google Scholar] [CrossRef] [Green Version]
  36. Adams, J. Identified particle distributions in pp and Au+Au collisions at s(NN)**(1/2) = 200 GeV. Phys. Rev. Lett. 2004, 92, 112301. [Google Scholar] [CrossRef] [Green Version]
  37. Adamczyk, L. Bulk Properties of the Medium Produced in Relativistic Heavy-Ion Collisions from the Beam Energy Scan Program. Phys. Rev. C 2017, 96, 044904. [Google Scholar] [CrossRef] [Green Version]
  38. Seifert, E.; Cassing, W. Baryon-antibaryon dynamics in relativistic heavy-ion collisions. Phys. Rev. C 2018, 97, 044907. [Google Scholar] [CrossRef] [Green Version]
  39. Acharya, S. Production of charged pions, kaons, and (anti-)protons in Pb-Pb and inelastic pp collisions at s NN = 5.02 TeV. Phys. Rev. C 2020, 101, 044907. [Google Scholar] [CrossRef]
  40. Socolowski, O., Jr.; Grassi, F.; Hama, Y.; Kodama, T. Fluctuations of the initial conditions and the continuous emission in hydro description of two-pion interferometry. Phys. Rev. Lett. 2004, 93, 182301. [Google Scholar] [CrossRef] [Green Version]
  41. Tang, Z.; Xu, Y.; Ruan, L.; van Buren, G.; Wang, F.; Xu, Z. Spectra and radial flow at RHIC with Tsallis statistics in a Blast-Wave description. Phys. Rev. C 2009, 79, 051901. [Google Scholar] [CrossRef] [Green Version]
  42. Becattini, F.; Heinz, U.W. Thermal hadron production in p p and p anti-p collisions. Z. Phys. C 1997, 76, 269–286, Erratum in Z. Phys. C 1997, 76, 578.. [Google Scholar] [CrossRef] [Green Version]
  43. Jiang, K.; Zhu, Y.; Liu, W.; Chen, H.; Li, C.; Ruan, L.; Tang, Z.; Xu, Z.; Xu, Z. Onset of radial flow in p + p collisions. Phys. Rev. C 2015, 91, 024910. [Google Scholar] [CrossRef] [Green Version]
  44. Hove, L.V. Multiplicity Dependence of p(T) Spectrum as a Possible Signal for a Phase Transition in Hadronic Collisions. Phys. Lett. B 1982, 118, 138. [Google Scholar] [CrossRef] [Green Version]
  45. Levai, P.; Muller, B. Transverse baryon flow as possible evidence for a quark-gluon plasma phase. Phys. Rev. Lett. 1991, 67, 1519–1522. [Google Scholar] [CrossRef]
  46. Alexopoulos, T.; Anderson, E.W.; Bujak, A.T.; Carmony, D.D.; Erwin, A.R.; Gutay, L.J.; Hirsch, A.S.; Nelson, K.S.; Porile, N.T.; Oh, S.H.; et al. Evidence for Hadronic Deconfinement in p ¯ -p Collisions at 1.8-TeV. Phys. Lett. B 2002, 528, 43–48. [Google Scholar] [CrossRef] [Green Version]
  47. Weiner, R.M. Surprises from the search for quark-gluon plasma? When was quark-gluon plasma seen? Int. J. Mod. Phys. E 2006, 15, 37–70. [Google Scholar] [CrossRef] [Green Version]
  48. Alpgard, K. First Results on Complete Events from p anti-p Collisions at the Center-of-Mass Energy of 540-GeV. Phys. Lett. B 1981, 107, 310–314. [Google Scholar] [CrossRef] [Green Version]
  49. Arnison, G. Some Observations on the First Events Seen at the CERN Proton-anti-Proton Collider. Phys. Lett. B 1981, 107, 320–324, Erratum in Phys. Lett. B 1982, 109, 510.. [Google Scholar] [CrossRef] [Green Version]
  50. Becattini, F.; Castorina, P.; Milov, A.; Satz, H. A Comparative analysis of statistical hadron production. Eur. Phys. J. C 2010, 66, 377–386. [Google Scholar] [CrossRef] [Green Version]
  51. Kraus, I.; Cleymans, J.; Oeschler, H.; Redlich, K. Particle production in p-p collisions and prediction for LHC energy. Phys. Rev. C 2009, 79, 014901. [Google Scholar] [CrossRef] [Green Version]
  52. Waqas, M.; Liu, F.H.; Fakhraddin, S.; Rahim, M.A. Possible scenarios for single, double, or multiple kinetic freeze-out in high energy collisions. Indian J. Phys. 2019, 93, 1329–1343. [Google Scholar] [CrossRef] [Green Version]
  53. Abelev, B.; STAR Collaboration. Systematic measurements of identified particle spectra in pp, d+ Au and Au+Au collisions from STAR. Phys. Rev. C 2009, 79, 034909. [Google Scholar] [CrossRef]
  54. Kolb, P.F.; Heinz, U. Hydrodynamic description of ultrarelativistic heavy-ion collisions. In Quark-Gluon Plasma 3; Hwa, R.C., Wang, X.-N., Eds.; World Scientific: Singapore, 2004. [Google Scholar] [CrossRef]
  55. Abelev, B.B. Production of Σ(1385)± and Ξ(1530)0 in proton-proton collisions at s = 7 TeV. Eur. Phys. J. C 2015, 75, 1. [Google Scholar] [CrossRef] [Green Version]
  56. Waqas, M.; Peng, G.X.; Wazir, Z.; Lao, H. Analysis of kinetic freeze out temperature and transverse flow velocity in nucleus-nucleus and proton-proton collisions at same center of mass energy. Int. J. Mod. Phys. 2021, 30, 2150061. [Google Scholar] [CrossRef]
  57. Aduszkiewicz, A. Measurements of π±, K±, p and p ¯ spectra in proton-proton interactions at 20, 31, 40, 80 and 158 GeV/c with the NA61/SHINE spectrometer at the CERN SPS. Eur. Phys. J. C 2017, 77, 671. [Google Scholar] [CrossRef]
  58. Alper, B.; Böggild, H.; Booth, P.; Bulos, F.; Carolll, L.J.; Damgaard, G.; Von Dardel, G.; Duff, B.; Hansen, K.H.; Heymann, F.; et al. Production Spectra of pi±, K±, rho± at Large Angles in Proton Proton Collisions in the CERN Intersecting Storage Rings. Nucl. Phys. B 1975, 100, 237–290. [Google Scholar] [CrossRef]
  59. Aamodt, K. Production of pions, kaons and protons in pp collisions at s=900 GeV with ALICE at the LHC. Eur. Phys. J. C 2011, 71, 1655. [Google Scholar] [CrossRef] [Green Version]
  60. Adam, J. Measurement of pion, kaon and proton production in proton–proton collisions at s=7 TeV. Eur. Phys. J. C 2015, 75, 226. [Google Scholar] [CrossRef] [Green Version]
  61. Shao, M.; Yi, L.; Tang, Z.; Chen, H.; Li, C.; Xu, Z. Examine the species and beam-energy dependence of particle spectra using Tsallis Statistics. J. Phys. G 2010, 37, 085104. [Google Scholar] [CrossRef]
  62. Cleymans, J.; Worku, D. Relativistic Thermodynamics: Transverse Momentum Distributions in High-Energy Physics. Eur. Phys. J. A 2012, 48, 160. [Google Scholar] [CrossRef]
  63. Biro, T.S.; Purcsel, G.; Urmossy, K. Non-Extensive Approach to Quark Matter. Eur. Phys. J. A 2009, 40, 325–340. [Google Scholar] [CrossRef]
  64. Avdyushev, V.A. A new method for the statistical simulation of the virtual values of parameters in inverse orbital dynamics problems. Sol. Syst. Res. 2009, 43, 543–551. [Google Scholar] [CrossRef]
  65. Chatrchyan, S. Study of high-pT charged particle suppression in PbPb compared to pp collisions at s NN = 2.76 TeV. Eur. Phys. J. C 2012, 72, 1945. [Google Scholar] [CrossRef] [Green Version]
  66. Suleymanov, M. The meaning behind observed pT regions at the LHC energies. Int. J. Mod. Phys. E 2018, 27, 1850008. [Google Scholar] [CrossRef] [Green Version]
  67. Bjorken, J.D. Highly relativistic nucleus-nucleus collisions: The central rapidity region. Phys. Rev. D 1983, 27, 140. [Google Scholar] [CrossRef]
  68. Landau, L.D. On the multiple production of particles in high energy collisions. Izv. Akad. SSSR 1951, 15, 219. [Google Scholar]
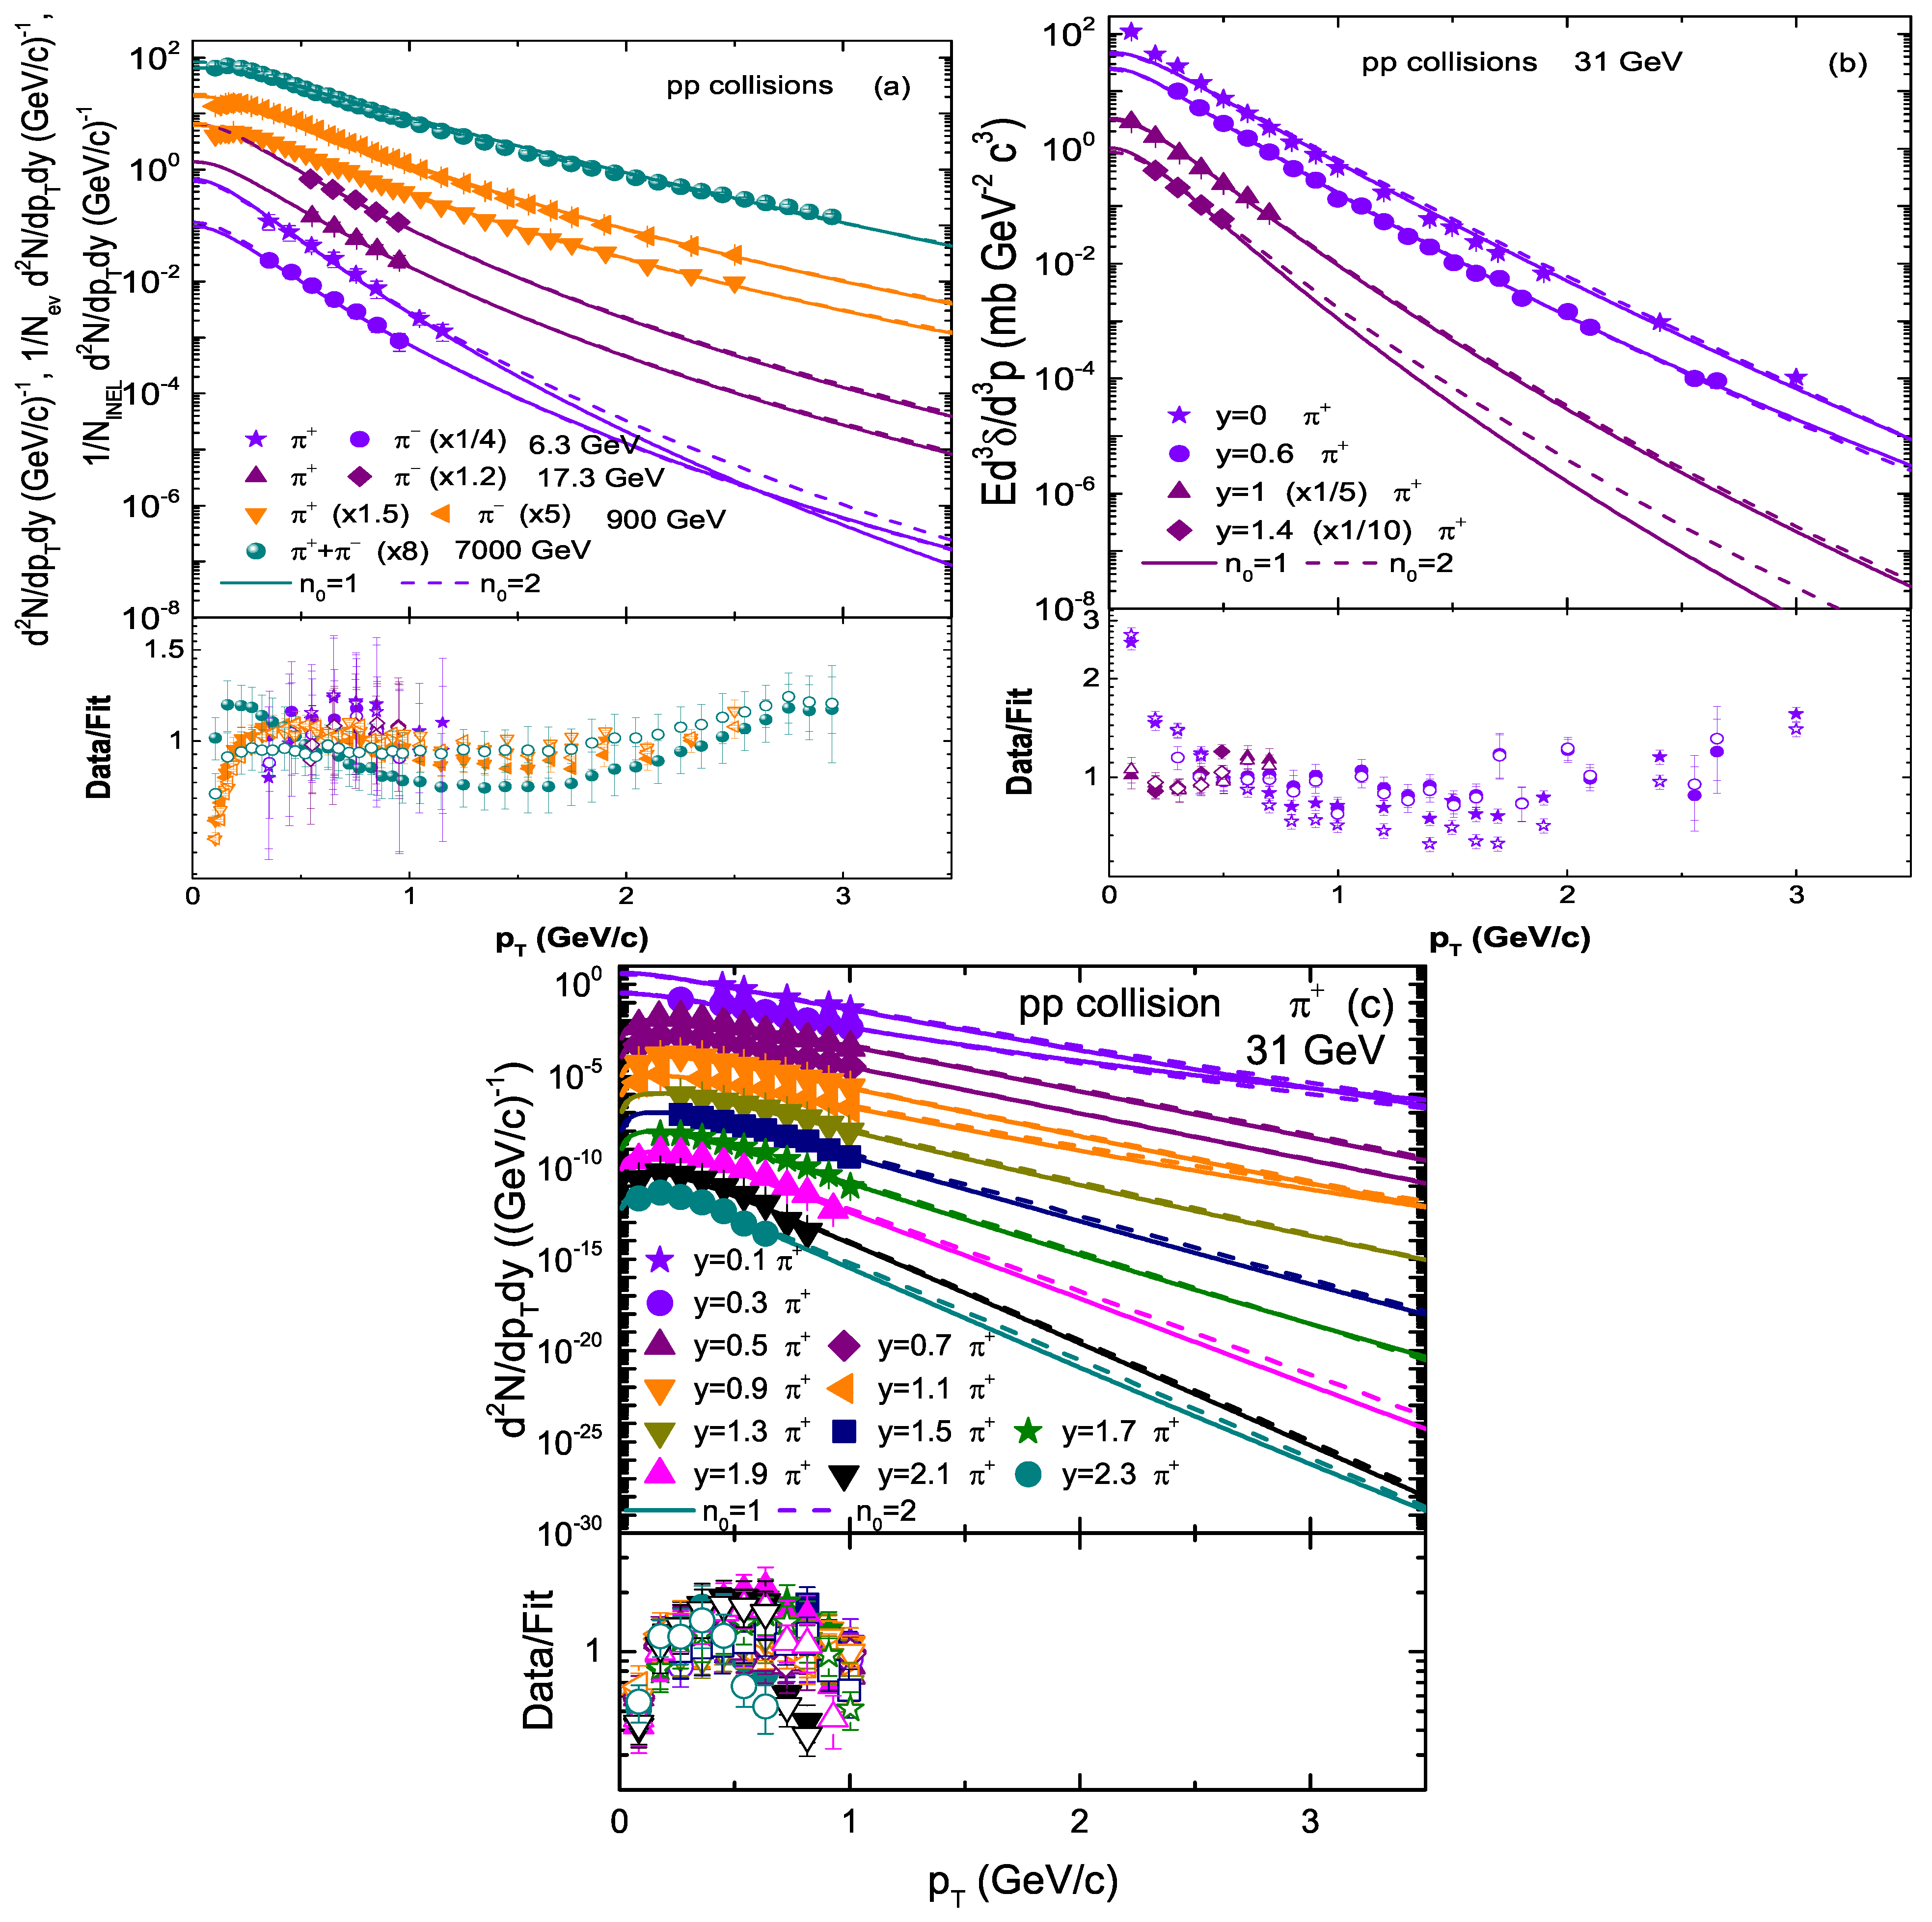
Figure 1. The invariant p T spectra of π + ( π )( π + + π ) measured in inelastic pp collisions. Panel (a) represents the transverse momentum spectra of pion at 6.3, 17.3, 900 and 7000 GeV collision energies, while panels (b) and (c) show the transverse momentum spectra of pion in y = 0–2.3 rapidity slices at 31 GeV. The symbols are the experimental data of NA61/SHINE [57,58] and ALICE Collaborations [59,60], and the curves are our fit results by the blast-wave model with Tsallis statistics based on Equation (1). The solid curves are the fit results by interpreting n 0 = 1 in TBW model, while the dashed curves are the results of the fit by using n 0 = 2 in Equation (1). The spectra at 6.3 and 17.3 GeV for π for both n 0 = 1 and 2 in are scaled by a factor of 1/4 and 1.2, respectively. Similarly, the spectra of π + and π at 900 GeV are scaled by the factor 1.5 and 5, respectively, and the spectra at 7000 TeV is scaled by a factor of 8. The spectra of π + at 31 GeV in rapidity slices y = 1 and 1.4 are scaled by 1/5 and 1/10, respectively. The corresponding data/fit ratios of the fits in upper panels are followed in their lower panels. The filled and open symbols in the data/fit ratios represent the results from the model with n 0 = 1 and n 0 = 2, respectively. The method of least squares is used in the fit for extracting the related parameters. (a) Represents the pull distributions of Figure 1 by the TBW model with n 0 = 1 (upper part of each panel) and n 0 = 2 (lower part of each panel).
Universe 08 00138 g001aUniverse 08 00138 g001b
Figure 2. Kinetic freeze-out temperature as a function of collision energy as well as rapidity at 31 GeV. Panel (a,c) show the dependence of T 0 on the collision energy by interpreting n 0 = 1 and 2, respectively, in the TBW model, while panel (b,d) shows its dependence on rapidity at 31 GeV.
Universe 08 00138 g002
Figure 3. Dependence of transverse flow velocity on collision energy and rapidity at 31 GeV. Panels (a,c) show the dependence of β T on collision energy by interpreting n 0 = 1 and 2, respectively, in the TBW model, while panels (b,d) show its dependence on rapidity at 31 GeV.
Universe 08 00138 g003
Figure 4. Dependence of kinetic freeze-out volume on collision energy as well as rapidity at 31 GeV. Panels (a,c) show the dependence of V on collision energy by using the flow profile n 0 = 1 and 2, respectively, in the TBW model, while panels (b,d) show its dependence on rapidity at 31 GeV.
Universe 08 00138 g004
Figure 5. Dependence of the parameter q on collision energy as well as rapidity at 31 GeV. Panels (a,c) show the dependence of q on collision energy by using the flow profile n 0 = 1 and 2, respectively, in the TBW model, while panels (b,d) show its dependence on rapidity at 31 GeV.
Universe 08 00138 g005
Figure 6. Dependence of the multiplicity parameter N 0 on collision energy as well as rapidity at 31 GeV. Panels (a,c) show the dependence of N 0 on collision energy by using the flow profile n 0 = 1 and 2, respectively, in the TBW model, while panels (b,d) show its dependence on rapidity at 31 GeV.
Universe 08 00138 g006
Figure 7. Dependence of the multiplicity parameter < p T > on collision energy as well as rapidity at 31 GeV. Panels (a,c) show the dependence of < p T > on collision energy by using the flow profile n 0 = 1 and 2, respectively, in the TBW model, while panels (b,d) show its dependence on rapidity at 31 GeV.
Universe 08 00138 g007
Table 1. ( n 0 = 1) Values of free parameters T 0 and β T , V and q, normalization constant ( N 0 ), χ 2 and degree of freedom (dof) corresponding to the curves in Figure 1. The p-values of χ 2 -statistics are also presented, which were calculated in R-software by pchisq ( χ 2 values, degree of freedom).
Energy (GeV)RapidityParticle T 0 (GeV) β T (c) V ( fm 3 ) q N 0 χ 2 /dofp
30.6 GeV y = 0 π + 0.086 ± 0.004 0.459 ± 0.007 2618 ± 100 1.018 ± 0.004 5 ± 0.4 132/151
30.6 GeV y = 0.1 π + 0.085 ± 0.005 0.453 ± 0.010 2700 ± 140 1.012 ± 0.004 0.4 ± 0.05 0.4/20.18
30.6 GeV y = 0.3 π + 0.082 ± 0.004 0.437 ± 0.009 2800 ± 120 1.050 ± 0.005 0.032 ± 0.005 3/50.3
30.6 GeV y = 0.5 π + 0.078 ± 0.006 0.410 ± 0.011 2880 ± 100 1.002 ± 0.004 0.008 ± 0.0003 13/80.89
30.6 GeV y = 0.6 π + 0.077 ± 0.004 0.403 ± 0.010 2935 ± 110 1.037 ± 0.005 2 ± 0.4 29/170.97
30.6 GeV y = 0.7 π + 0.075 ± 0.005 0.400 ± 0.007 3000 ± 109 1.005 ± 0.005 7 × 10 4 ± 4 × 10 5 16/80.98
30.6 GeV y = 0.9 π + 0.072 ± 0.004 0.383 ± 0.010 3138 ± 131 1.009 ± 0.005 6.0 × 10 5 ± 4 × 10 6 18/80.98
30.6 GeV y = 1.0 π + 0.070 ± 0.004 0.378 ± 0.007 3196 ± 102 1.030 ± 0.004 0.9 ± 0.04 7/40.86
30.6 GeV y = 1.1 π + 0.068 ± 0.006 0.371 ± 0.008 3258 ± 114 1.026 ± 0.004 5 × 10 6 ± 3 × 10 7 8/70.67
30.6 GeV y = 1.3 π + 0.064 ± 0.005 0.360 ± 0.010 3329 ± 106 1.013 ± 0.004 5 × 10 7 ± 4 × 10 8 6/60.58
30.6 GeV y = 1.4 π + 0.064 ± 0.005 0.360 ± 0.010 3329 ± 100 1.03 ± 0.004 0.4 ± 0.04 17/10.99
30.6 GeV y = 1.5 π + 0.060 ± 0.004 0.348 ± 0.012 3455 ± 126 1.006 ± 0.004 4 × 10 8 ± 4 × 10 9 11/60.91
30.6 GeV y = 1.7 π + 0.055 ± 0.005 0.328 ± 0.010 3670 ± 130 1.007 ± 0.005 3 × 10 9 ± 3 × 10 10 23/60.0.99
30.6 GeV y = 1.9 π + 0.052 ± 0.005 0.314 ± 0.008 3768 ± 115 1.001 ± 0.004 2 × 10 10 ± 4 × 10 11 48/71
30.6 GeV y = 2.1 π + 0.047 ± 0.004 0.298 ± 0.007 3900 ± 152 1.001 ± 0.004 1.5 × 10 11 ± 4 × 10 12 53/61
30.6 GeV y = 2.3 π + 0.045 ± 0.004 0.280 ± 0.009 3980 ± 180 1.004 ± 0.003 1 × 10 12 ± 5 × 10 13 22/40.99
6.3 GeV y = 0.3 π + 0.080 ± 0.005 0.435 ± 0.012 2800 ± 100 1.02 ± 0.003 0.035 ± 0.004 2.3/50.19
6.3 GeV y = 0.3 π 0.080 ± 0.005 0.435 ± 0.011 2800 ± 103 1.02 ± 0.003 0.033 ± 0.004 1/40.09
17.3 GeV y = 0.1 π + 0.086 ± 0.004 0.454 ± 0.010 2909 ± 121 1.06 ± 0.004 0.46 ± 0.05 0.5/20.22
17.3 GeV y = 0.1 π 0.086 ± 0.004 0.454 ± 0.010 2909 ± 121 1.06 ± 0.004 0.46 ± 0.05 0.5/20.22
900 GeV y < 0.5 π + 0.113 ± 0.005 0.490 ± 0.012 4400 ± 140 1.07 ± 0.005 0.53 ± 0.05 22/300.145
900 GeV y < 0.5 π 0.113 ± 0.005 0.490 ± 0.012 4400 ± 140 1.07 ± 0.005 0.53 ± 0.05 25/300.27
7000 GeV y < 0.5 π + + π 0.135 ± 0.005 0.580 ± 0.012 5070 ± 142 1.08 ± 0.004 1.60 ± 0.4 41/350.77
Table 2. ( n 0 = 2) Values of free parameters T 0 and β T , V and q, normalization constant ( N 0 ), χ 2 and degree of freedom (dof) corresponding to the curves in Figure 1. The p-values of the χ 2 -statistics are also presented, which were calculated in R-software by pchisq ( χ 2 values, degree of freedom).
Energy (GeV)RapidityParticle T 0 (GeV) β T (c) V ( fm ) 3 q N 0 χ 2 /dofp
30.6 GeV y = 0 π + 0.090 ± 0.006 0.441 ± 0.010 2670 ± 125 1.010 ± 0.005 5 ± 0.35 143/151
30.6 GeV y = 0.1 π + 0.089 ± 0.005 0.429 ± 0.011 2750 ± 108 1.010 ± 0.005 0.4 ± 0.04 0.2/20.95
30.6 GeV y = 0.3 π + 0.086 ± 0.005 0.417 ± 0.010 2800 ± 120 1.030 ± 0.004 0.035 ± 0.003 2/50.15
30.6 GeV y = 0.5 π + 0.082 ± 0.006 0.400 ± 0.011 2885 ± 103 1.001 ± 0.003 0.008 ± 0.0003 13/80.88
30.6 GeV y = 0.6 π + 0.081 ± 0.005 0.396 ± 0.009 2935 ± 110 1.032 ± 0.005 2 ± 0.4 31/170.98
30.6 GeV y = 0.7 π + 0.078 ± 0.004 0.385 ± 0.011 3020 ± 100 1.005 ± 0.005 6.9 × 10 4 ± 4 × 10 5 14/80.92
30.6 GeV y = 0.9 π + 0.075 ± 0.005 0.373 ± 0.010 3145 ± 131 1.009 ± 0.0005 6.0 × 10 5 ± 4 × 10 6 15/80.94
30.6 GeV y = 1.0 π + 0.073 ± 0.005 0.367 ± 0.010 3190 ± 105 1.030 ± 0.004 0.9 ± 0.04 5/40.71
30.6 GeV y = 1.1 π + 0.073 ± 0.004 0.366 ± 0.009 3250 ± 110 1.026 ± 0.003 5 × 10 6 ± 4 × 10 7 8/70.67
30.6 GeV y = 1.3 π + 0.070 ± 0.004 0.355 ± 0.011 3329 ± 100 1.008 ± 0.007 5 × 10 7 ± 4 × 10 8 4/60.32
30.6 GeV y = 1.4 π + 0.069 ± 0.004 0.351 ± 0.012 3329 ± 109 1.030 ± 0.004 0.4 ± 0.04 4/10.95
30.6 GeV y = 1.5 π + 0.067 ± 0.005 0.343 ± 0.008 3455 ± 120 1.001 ± 0.003 4 × 10 8 ± 4 × 10 9 7/60.68
30.6 GeV y = 1.7 π + 0.063 ± 0.005 0.325 ± 0.010 3660 ± 110 1.002 ± 0.004 3 × 10 9 ± 3 × 10 10 28/60.99
30.6 GeV y = 1.9 π + 0.059 ± 0.004 0.310 ± 0.010 3768 ± 110 1.001 ± 0.004 2 × 10 10 ± 4 × 10 11 44/70.99
30.6 GeV y = 2.1 π + 0.052 ± 0.005 0.250 ± 0.008 3919 ± 140 1.001 ± 0.004 1.5 × 10 11 ± 4 × 10 12 50/61
30.6 GeV y = 2.3 π + 0.050 ± 0.005 0.270 ± 0.008 3980 ± 120 1.001 ± 0.003 1 × 10 12 ± 5 × 10 13 28/40.99
6.3 GeV y = 0.3 π + 0.085 ± 0.004 0.423 ± 0.010 2800 ± 109 1.005 ± 0.0004 0.035 ± 0.004 2.4/50.208
6.3 GeV y = 0.3 π 0.085 ± 0.004 0.423 ± 0.010 2800 ± 109 1.004 ± 0.0004 0.035 ± 0.004 1.5/40.173
17.3 GeV y = 0.1 π + 0.090 ± 0.004 0.441 ± 0.011 2940 ± 113 1.05 ± 0.004 0.46 ± 0.06 0.2/20.095
17.3 GeV y = 0.1 π 0.090 ± 0.004 0.441 ± 0.011 2940 ± 113 1.05 ± 0.004 0.46 ± 0.06 0.2/20.095
900 GeV y < 0.5 π + 0.119 ± 0.006 0.481 ± 0.010 4410 ± 130 1.06 ± 0.005 0.53 ± 0.05 27/300.37
900 GeV y < 0.5 π 0.119 ± 0.005 0.481 ± 0.012 4414 ± 105 1.06 ± 0.0045 0.53 ± 0.05 31/300.58
7000 GeV y < 0.5 π + + π 0.142 ± 0.006 0.570 ± 0.013 5070 ± 127 1.068 ± 0.004 1.6 ± 0.4 45/350.88
Publisher’s Note: MDPI stays neutral with regard to jurisdictional claims in published maps and institutional affiliations.