
GERDA and LEGEND: Probing the Neutrino Nature and Mass at 100 meV and beyond


Abstract
1. Introduction
2. GERDA Phase I
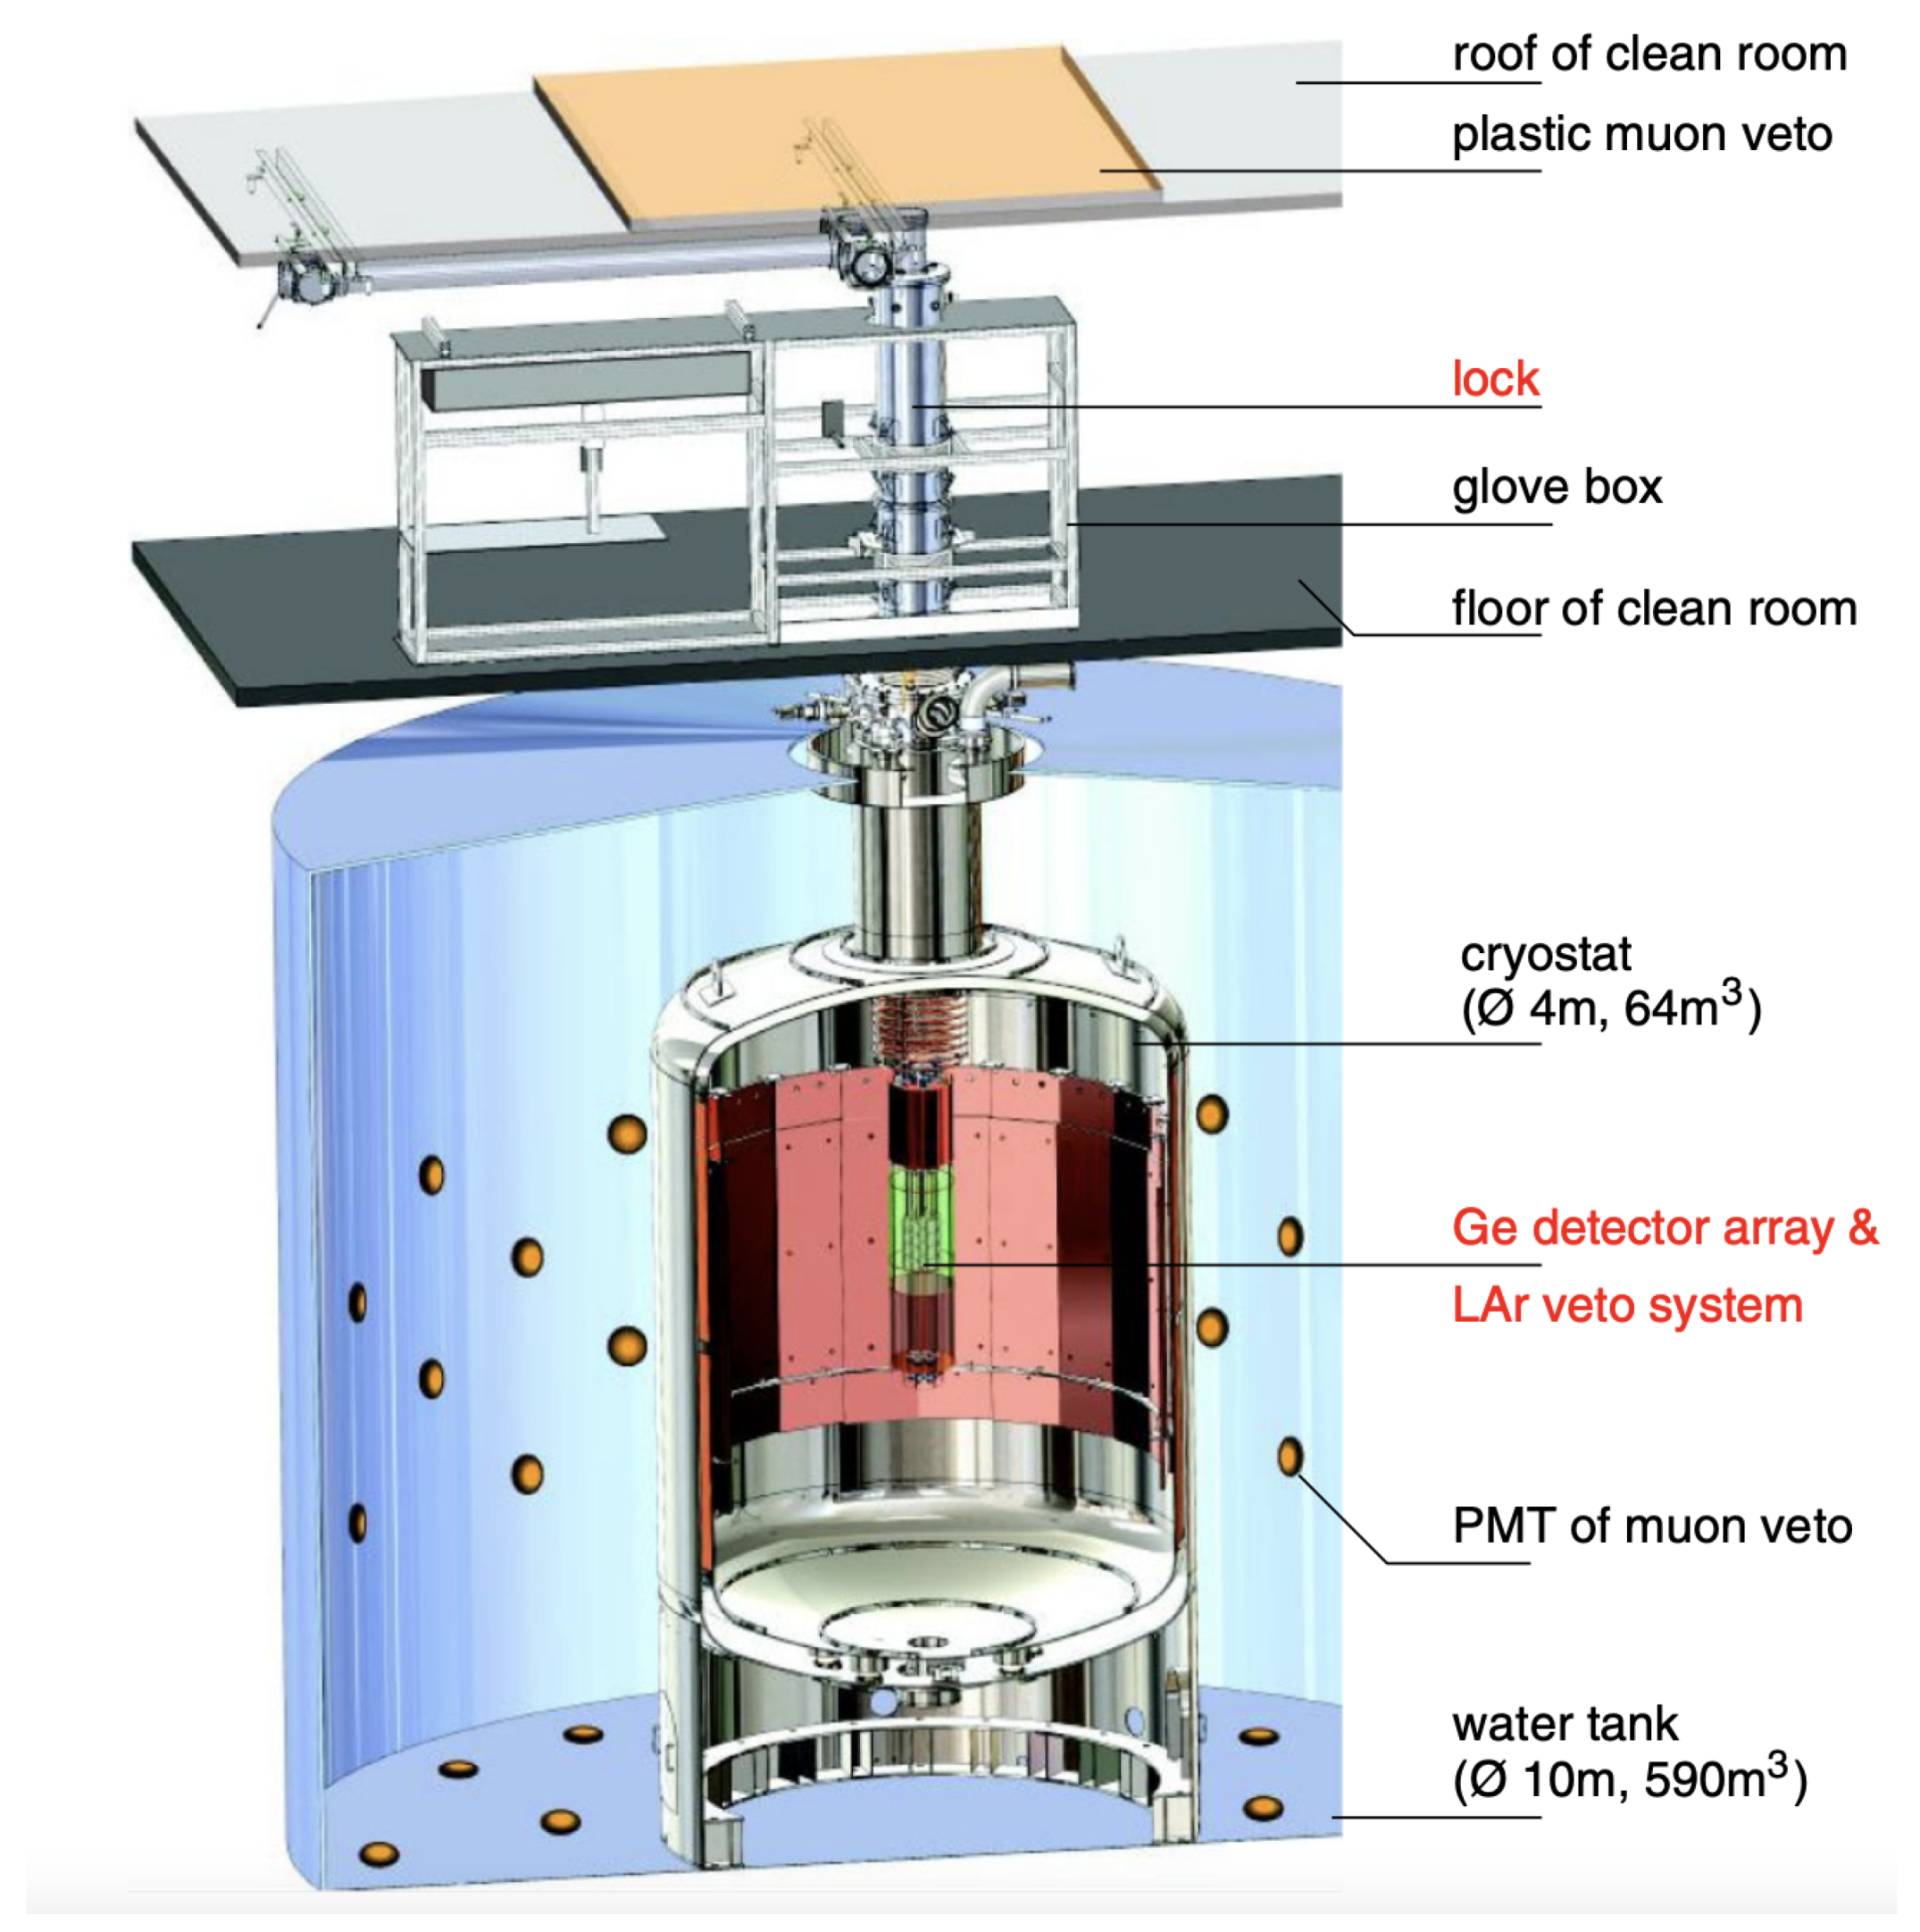
2.1. The Setup
2.2. The Early Activities and the Ar Issue
- Development of the knowledge, procedures and ability to safely handle, cool down and warm up the bare HP-Ge detectors;
- Findings on the role of the passivation layer for the stable operation of the bare HP-Ge detectors in LAr [31] and definition of the detector contacts (re)processing for the stable operation in LAr;
- Mitigation of the Ar-related2 background: since the first commissioning, the K -lines3 intensity has been found to be higher when compared to expectations. K is the decay product of Ar, an isotope produced in the upper atmosphere by cosmic rays via the Ar(,2p)Ar with the expected ratio N(42)/N(Ar) ∼10 [32]; at the time of commissioning, the measured limit for N(42)/N(Ar) was <4.3 [33]. Gerda found that the BI at scaled with the K -lines intensity. The electrostatic field dispersed in LAr from the Ge detector HV-biased surfaces was driving K ions4 close to the detector surfaces. Once in the vicinity of the detectors, the 3.5 MeV particles travel (1 cm) in LAr and (2 mm) in Ge, causing background events at mostly when entering the 1 m thick p contact. The 2424 and 3447 keV scattering in Ge generate background events at too. To mitigate the K background, the LAr in intimate contact with the Ge detectors was confined, enclosing each detector string in an OFHC Cu 60 m thick cylinder, named “mini-shroud”. It largely reduced the volume of LAr where the K ions were collected and drifted to the detector anodes and to the grounded surfaces in their proximity (Cu holders). The Cu mini-shrouds allowed to reduce the BI from cts/(keV·kg·yr) down to cts/(keV·kg·yr) [25]. Later by improving the mini-shroud shield hermeticity and wrapping the detector HV bias contacts in Cu foils, the BI was further reduced to cts/(keV·kg·yr) [25], allowing the start of physical data-taking. Concerning Ar, its endpoint at 565 keV is harmless for decay searches, but its significant activity (1) Bq/kg of LAr greatly reduces the Gerda potential for WIMP dark matter searches.
2.3. Data-Taking and Treatment
2.4. Filtering and Energy Calibration
2.5. Pulse Shape Analysis
2.6. Background Model
2.7. Results
3. GERDA Phase II
3.1. The Upgrade of the Setup
- The Ge-detector string was newly designed to be more compact and to minimize the assembly materials. The Ge-detector holders are now two Silicon plates connected by OFHC Cu threaded bars (Figure 15). The detector contacts changed from spring loaded to wire bonded. Hence, each Ge detector has two evaporated Al pads to receive the wire bond;
- The front-end electronics were redesigned so that one board serves four detectors [39]; this further reduces the per-channel radioactivity by a factor 1.5 and 30 for Ra and Th, respectively;
- The whole lock cabling was renewed to reduce its Rn emanation; the adopted cables are custom made coaxials with red copper conductors and uncolored jackets, hence reducing their radioactivity and Rn emanation by a factor 15 to 25 for Ra and Th than in Phase I, and a factor of 50 in K;
- The detector contacts were made first by flex Cuflon® and later by Pyralux® circuits, to further reduce the mass of the Phase I contacts, and to allow wire bonding connection: these circuits showed superior performances in terms of reliability and radioactivity;
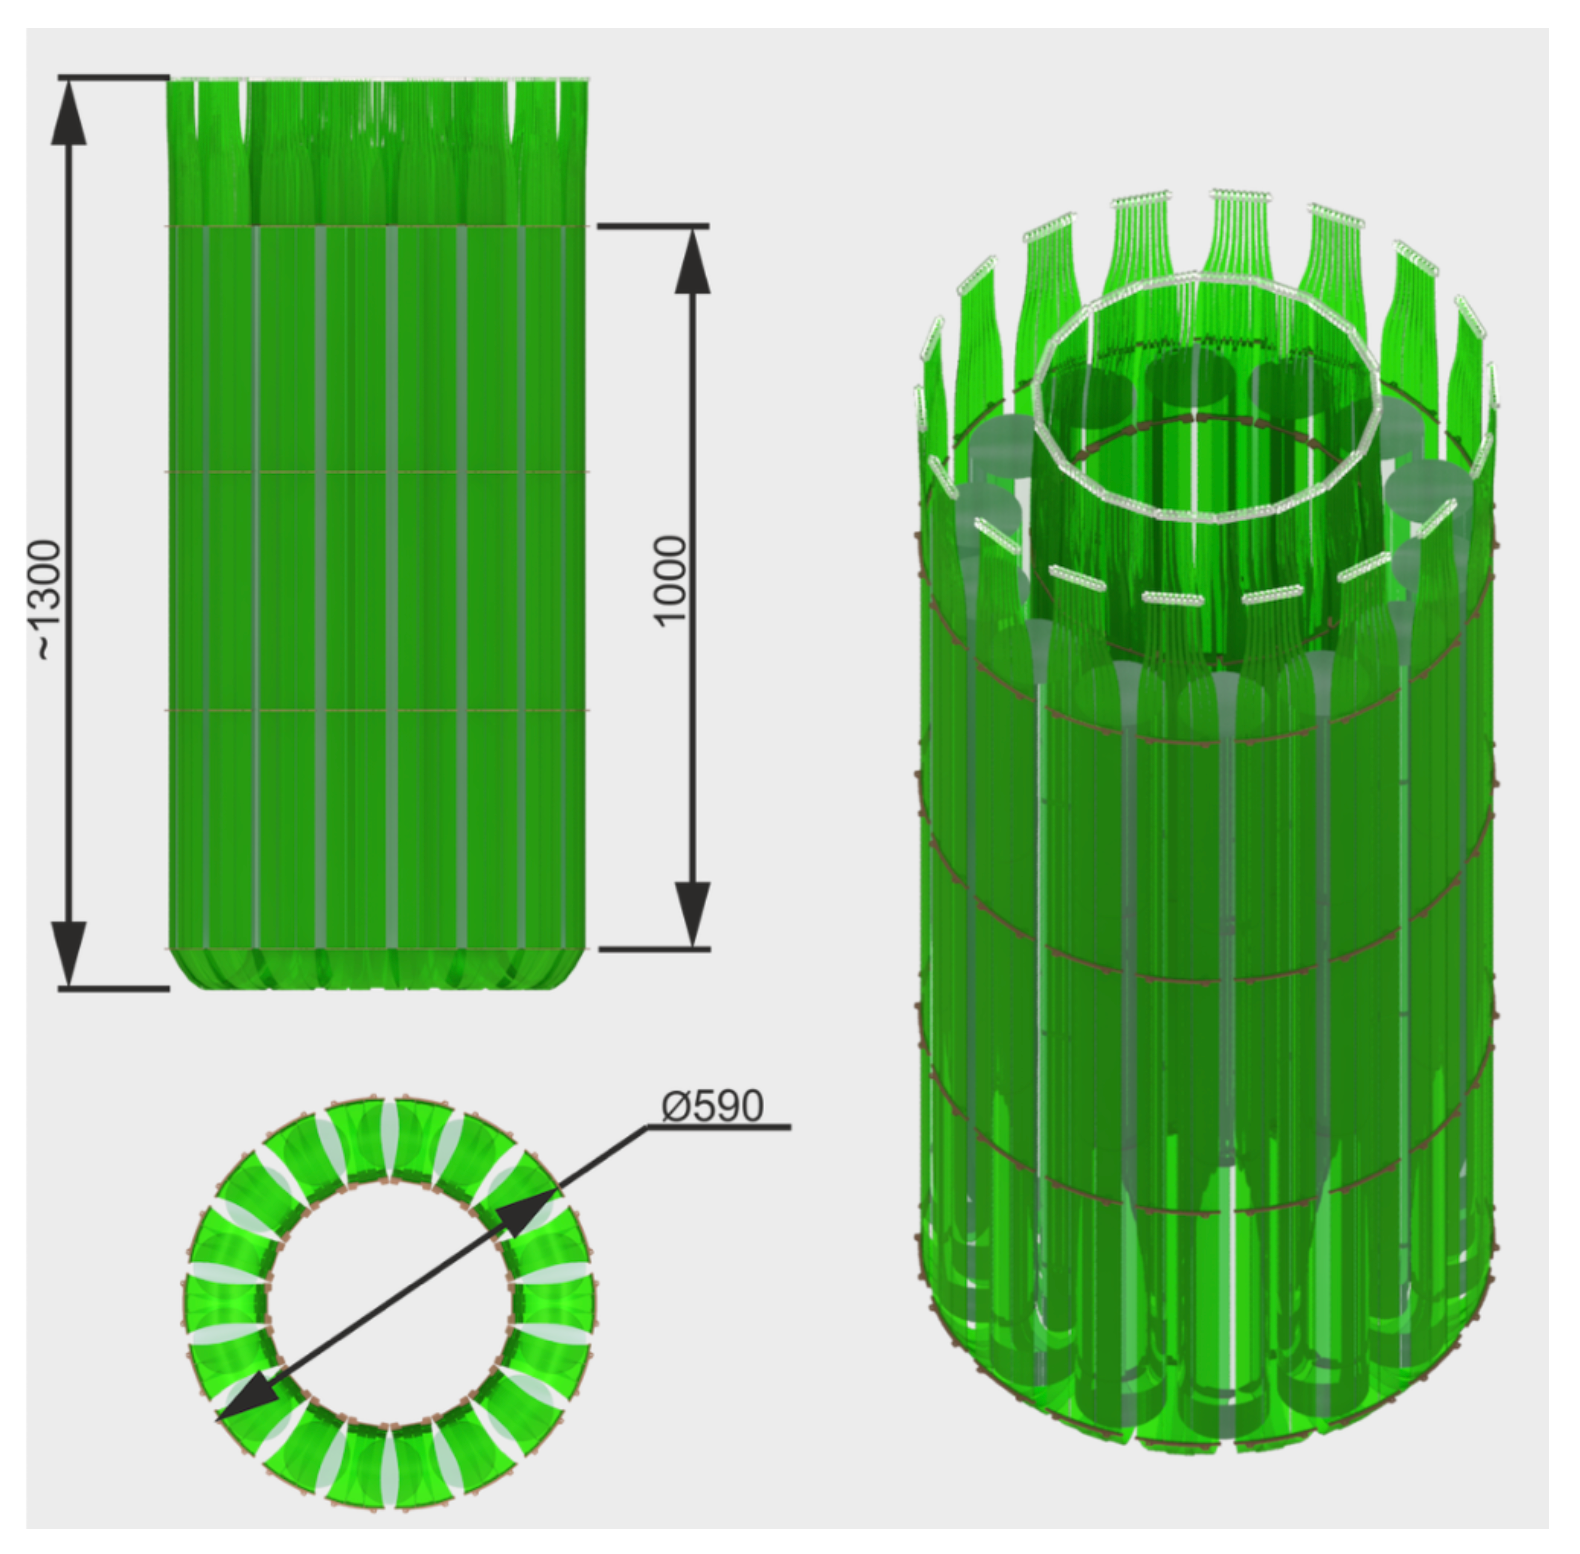
- The volume of ∼50 cm diameter and ∼220 cm height was delimited by an Oxygen Free High Conductivity (OFHC) Cu foil lined with a reflector foil and equipped with 16 photomultipliers (9 top, 7 bottom): the central 100 cm of the cylinder are equipped with 800 m scintillating fibers, replacing the former Cu Rn-shroud foil, read out by Silicon Photo Multipliers (SIPM);
- The Cu mini-shrouds enclosing the detector strings have been replaced by transparent mini-shroud made from the Borexino ultra-low radioactivity nylon [40] to allow the light pulse generated in the LAr in the proximity of the Ge detectors to be visible by the veto instrumentation. For this, the mini-shrouds, the fibers, the extended specular reflector (ESR) foils, and the PMTS were coated with TPB6. The Phase II LAr veto and PSD concepts, the array scheme, the picture of the Ge-detector array, the nylon mini-shrouds and the fiber curtain shroud, are shown in Figure 15 and described in [30].
3.2. Data-Taking and Treatment
3.3. Signal Denoising
3.4. Energy Calibration and Data Partitioning
3.5. Liquid Argon Veto
3.6. Pulse Shape Discrimination
3.7. Background Model
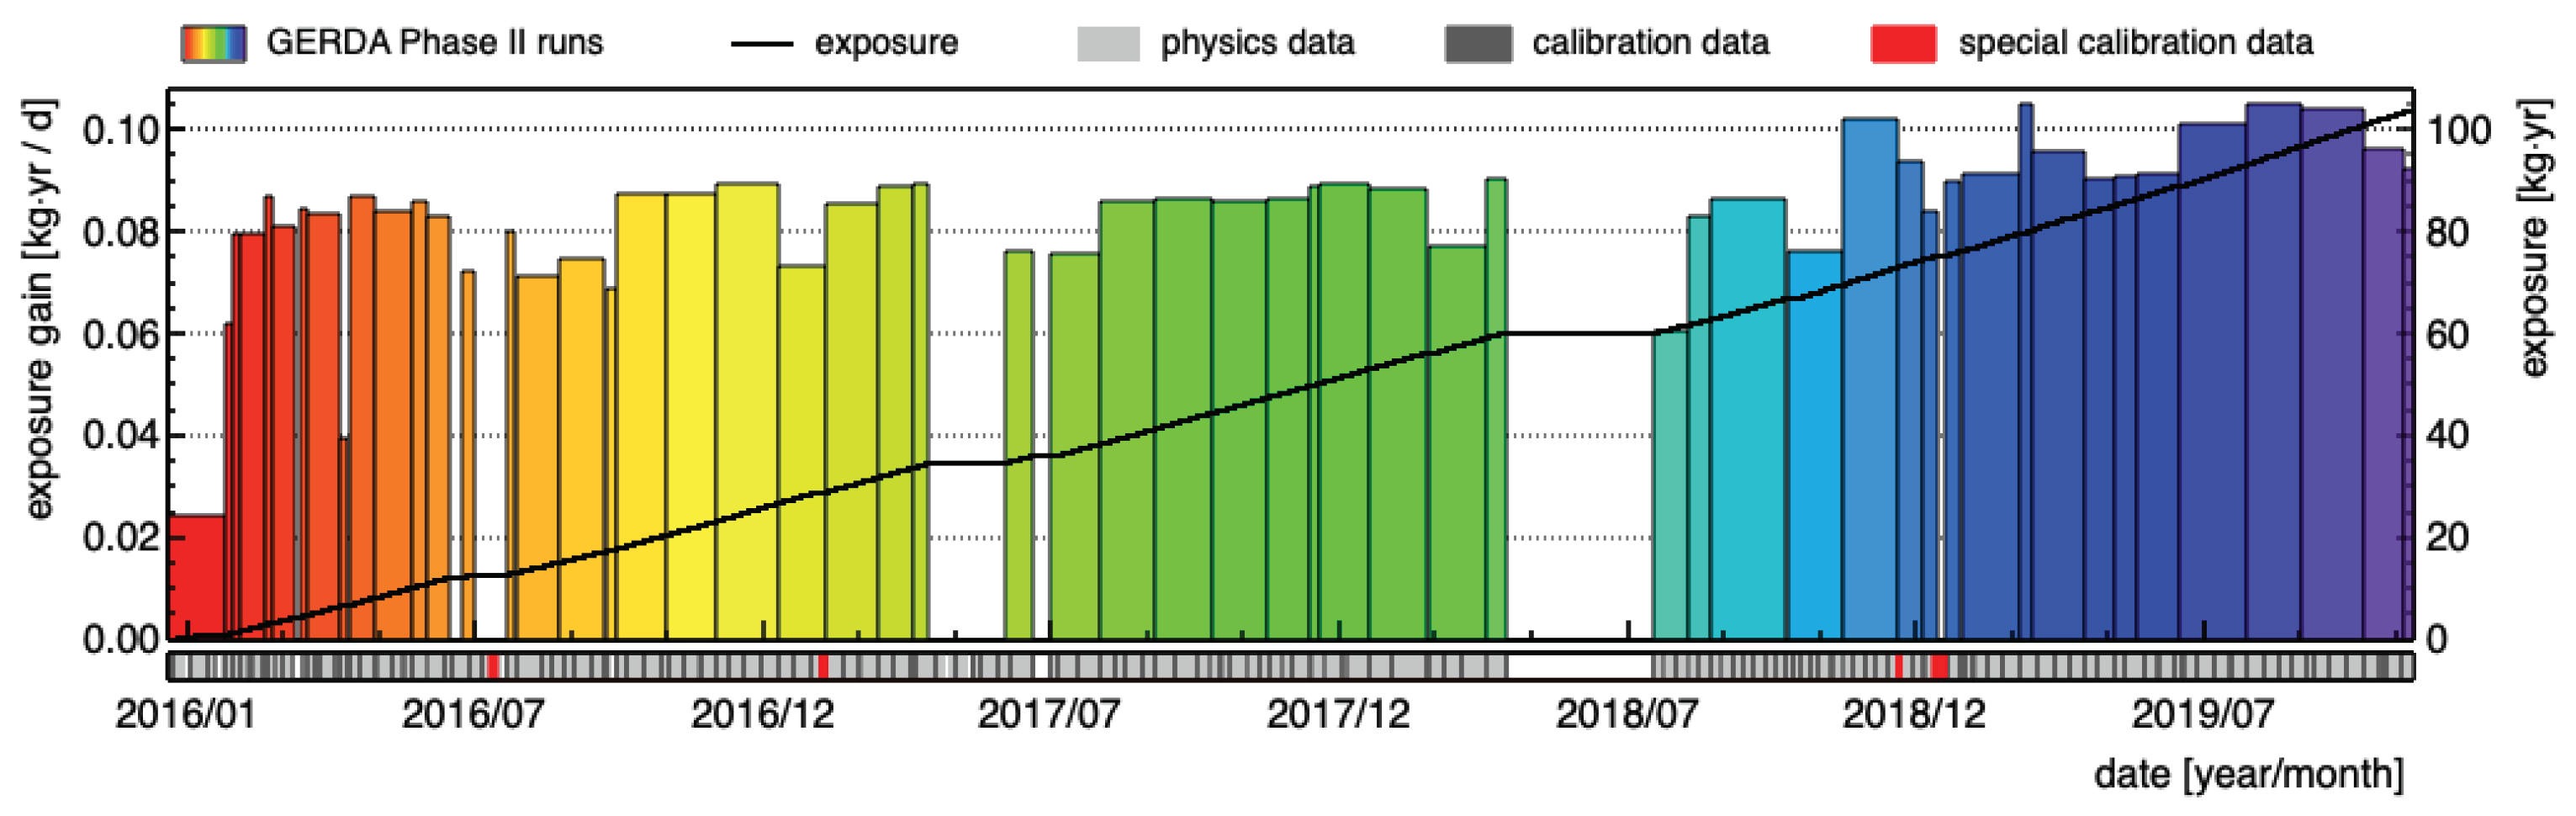
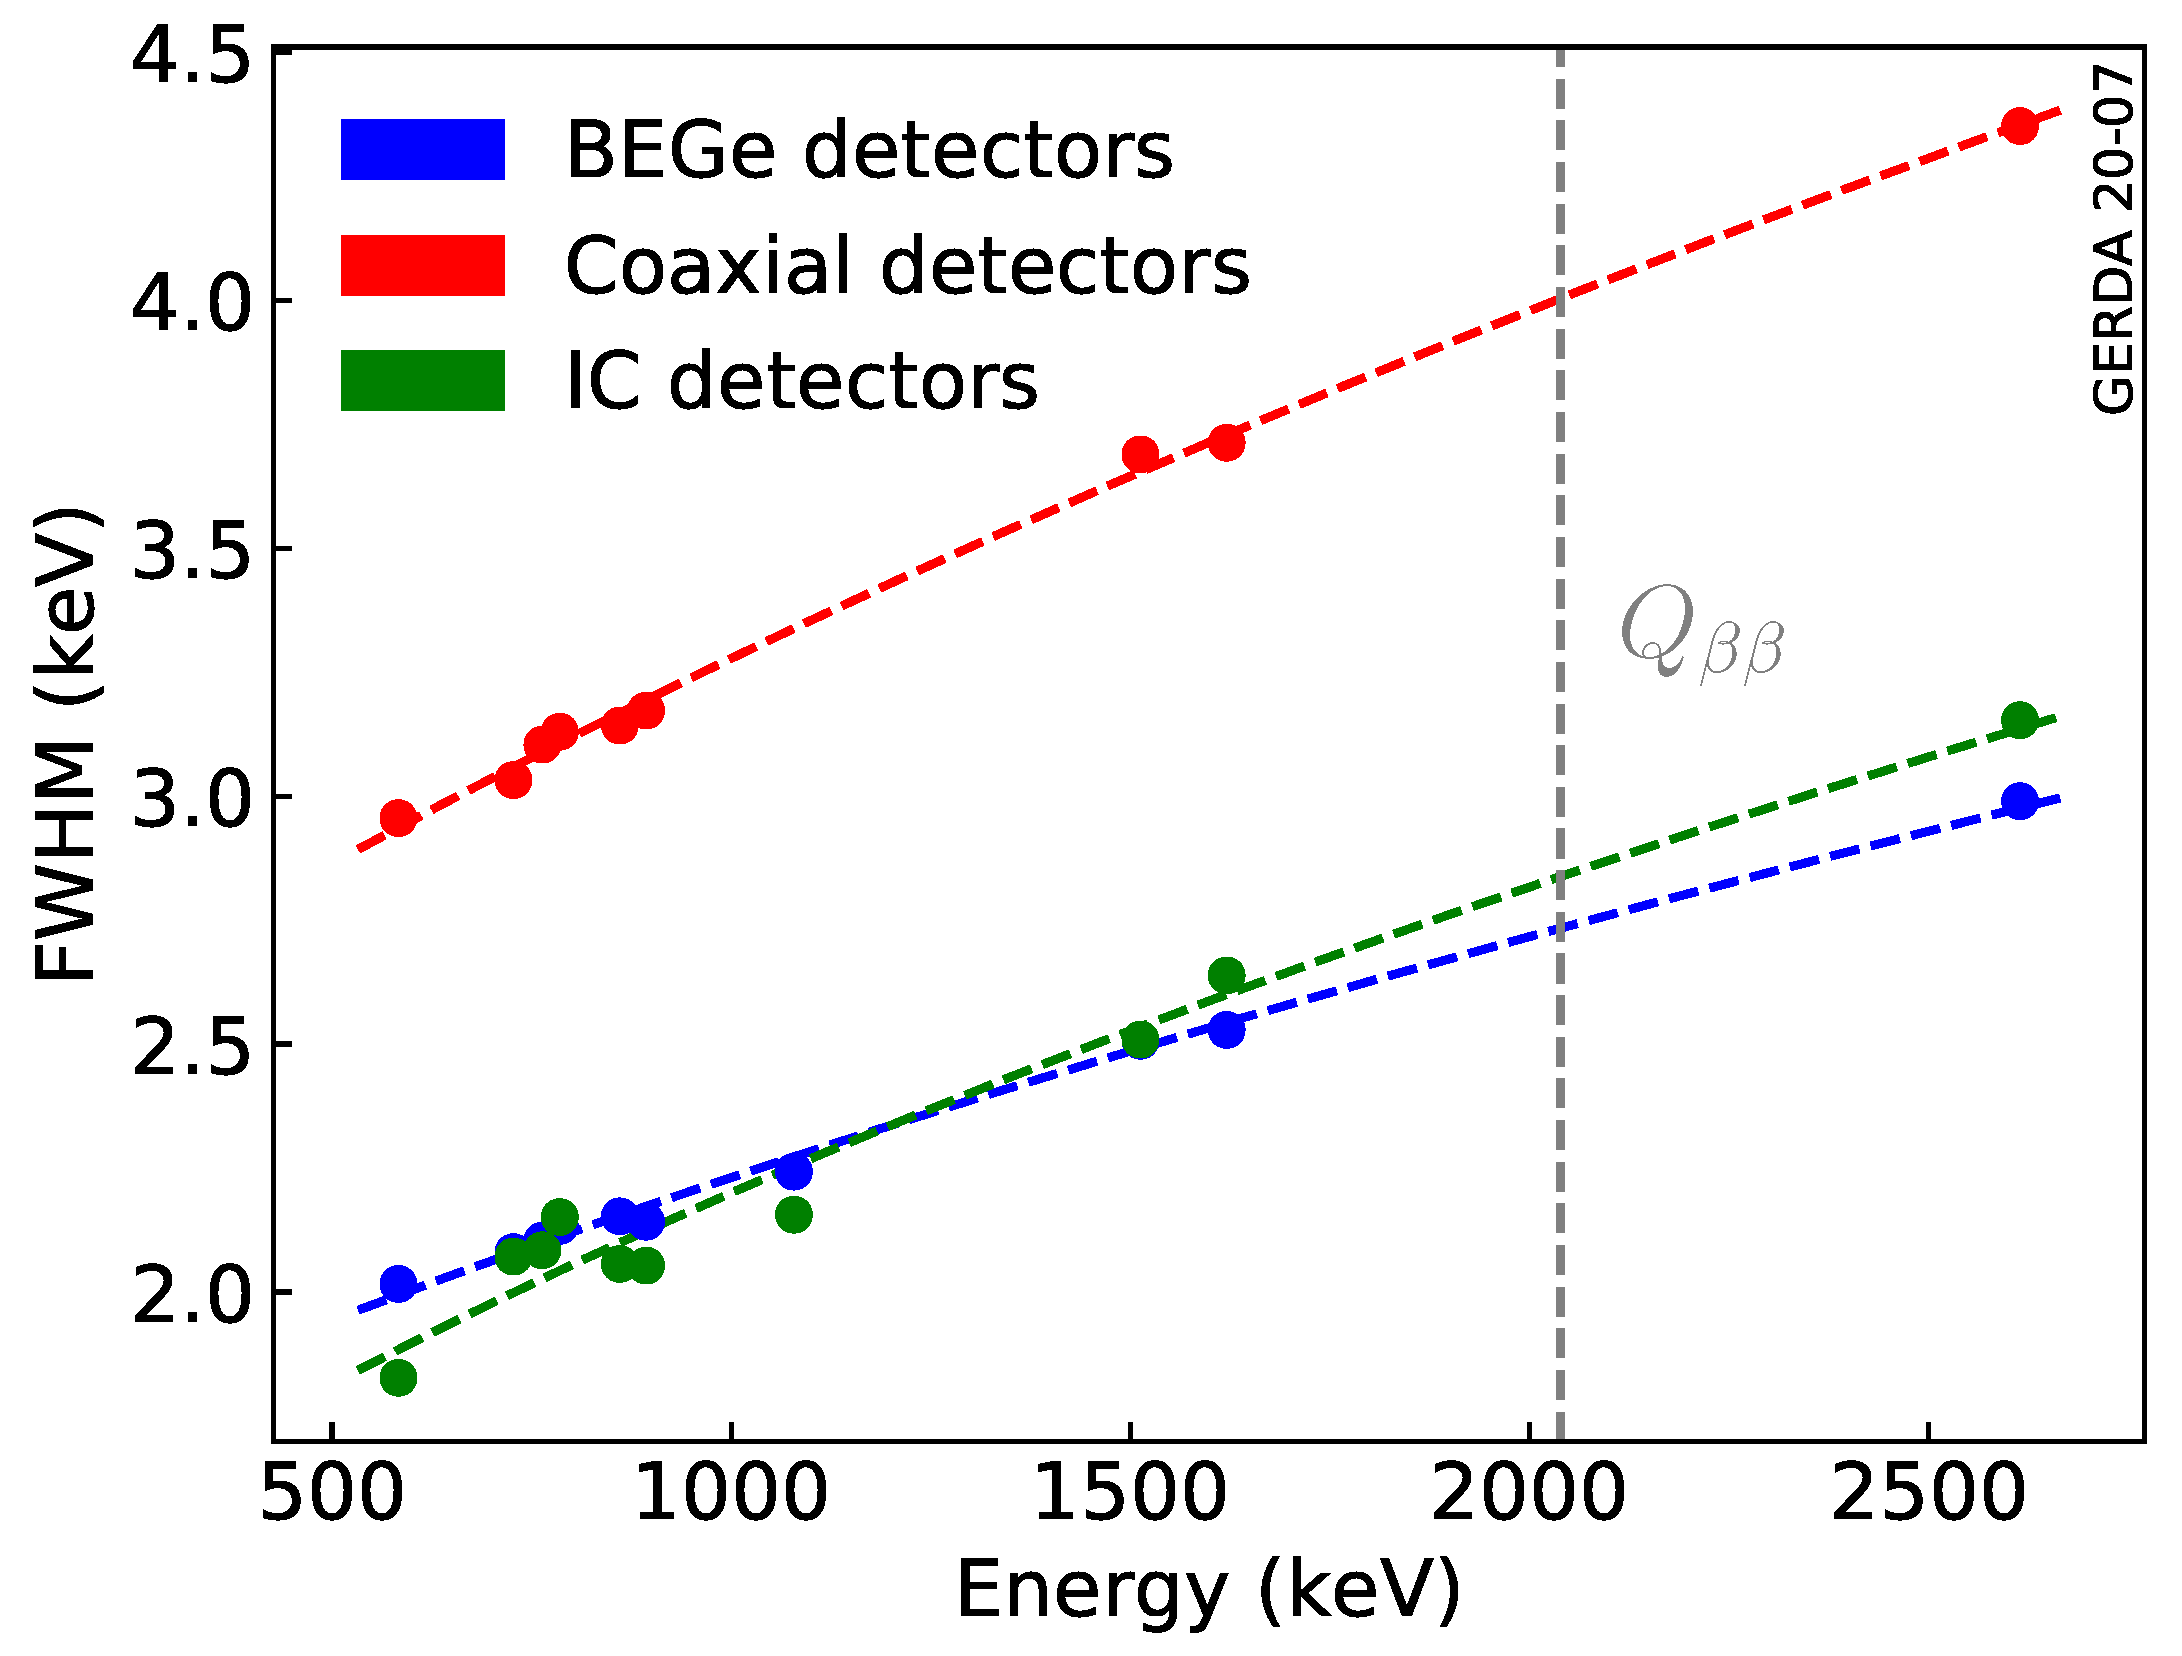
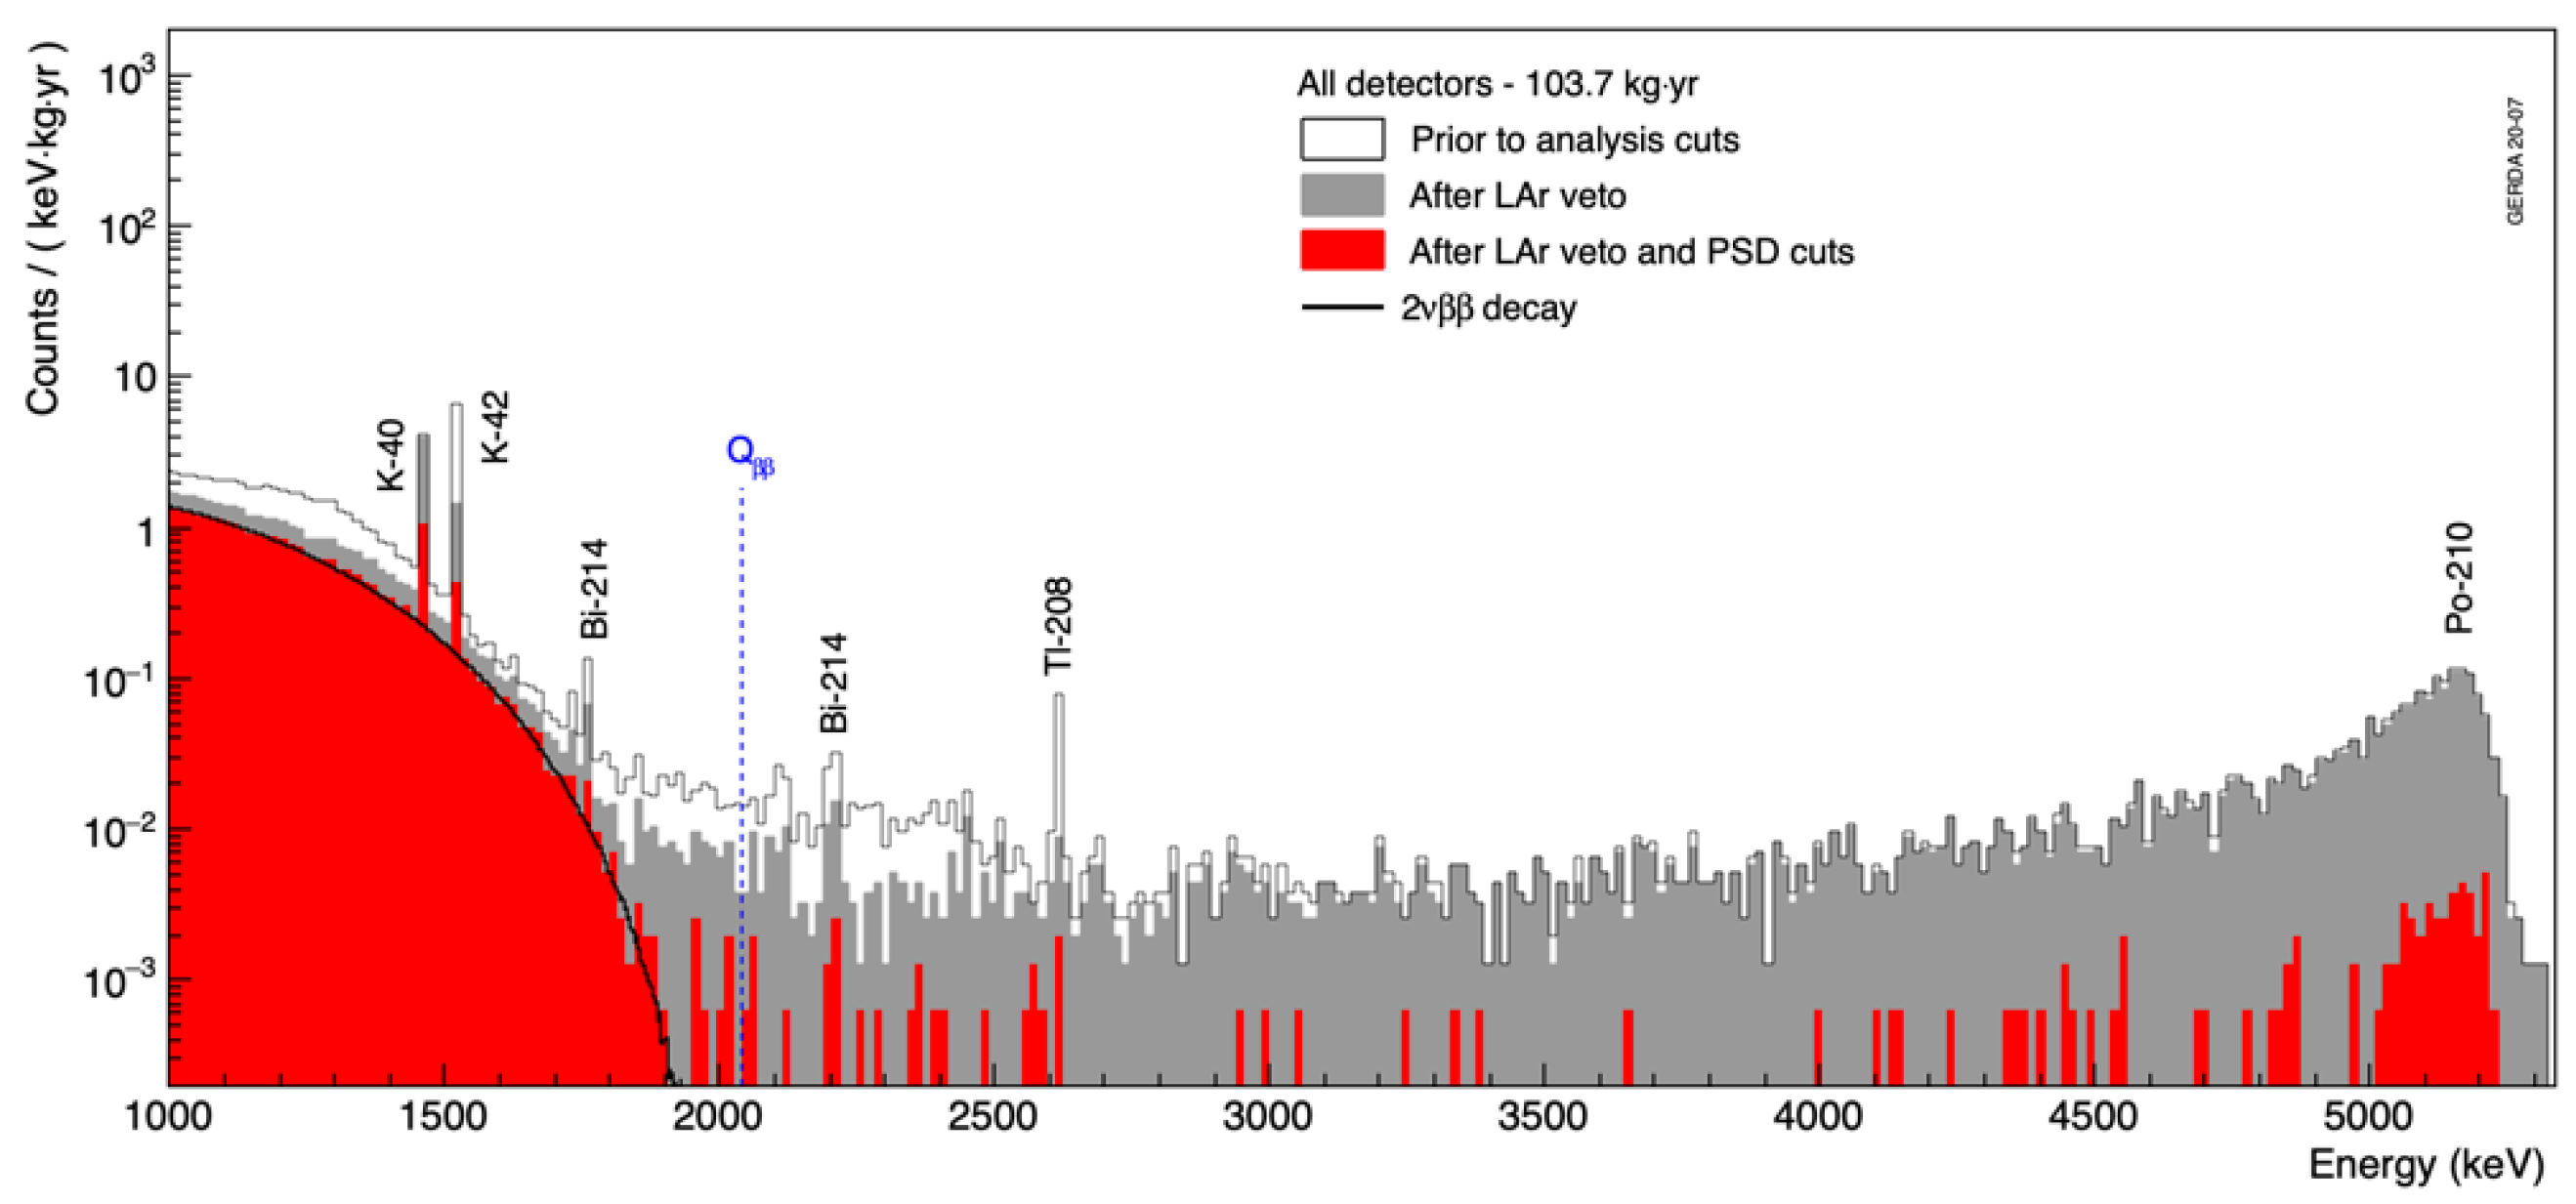
3.8. Results

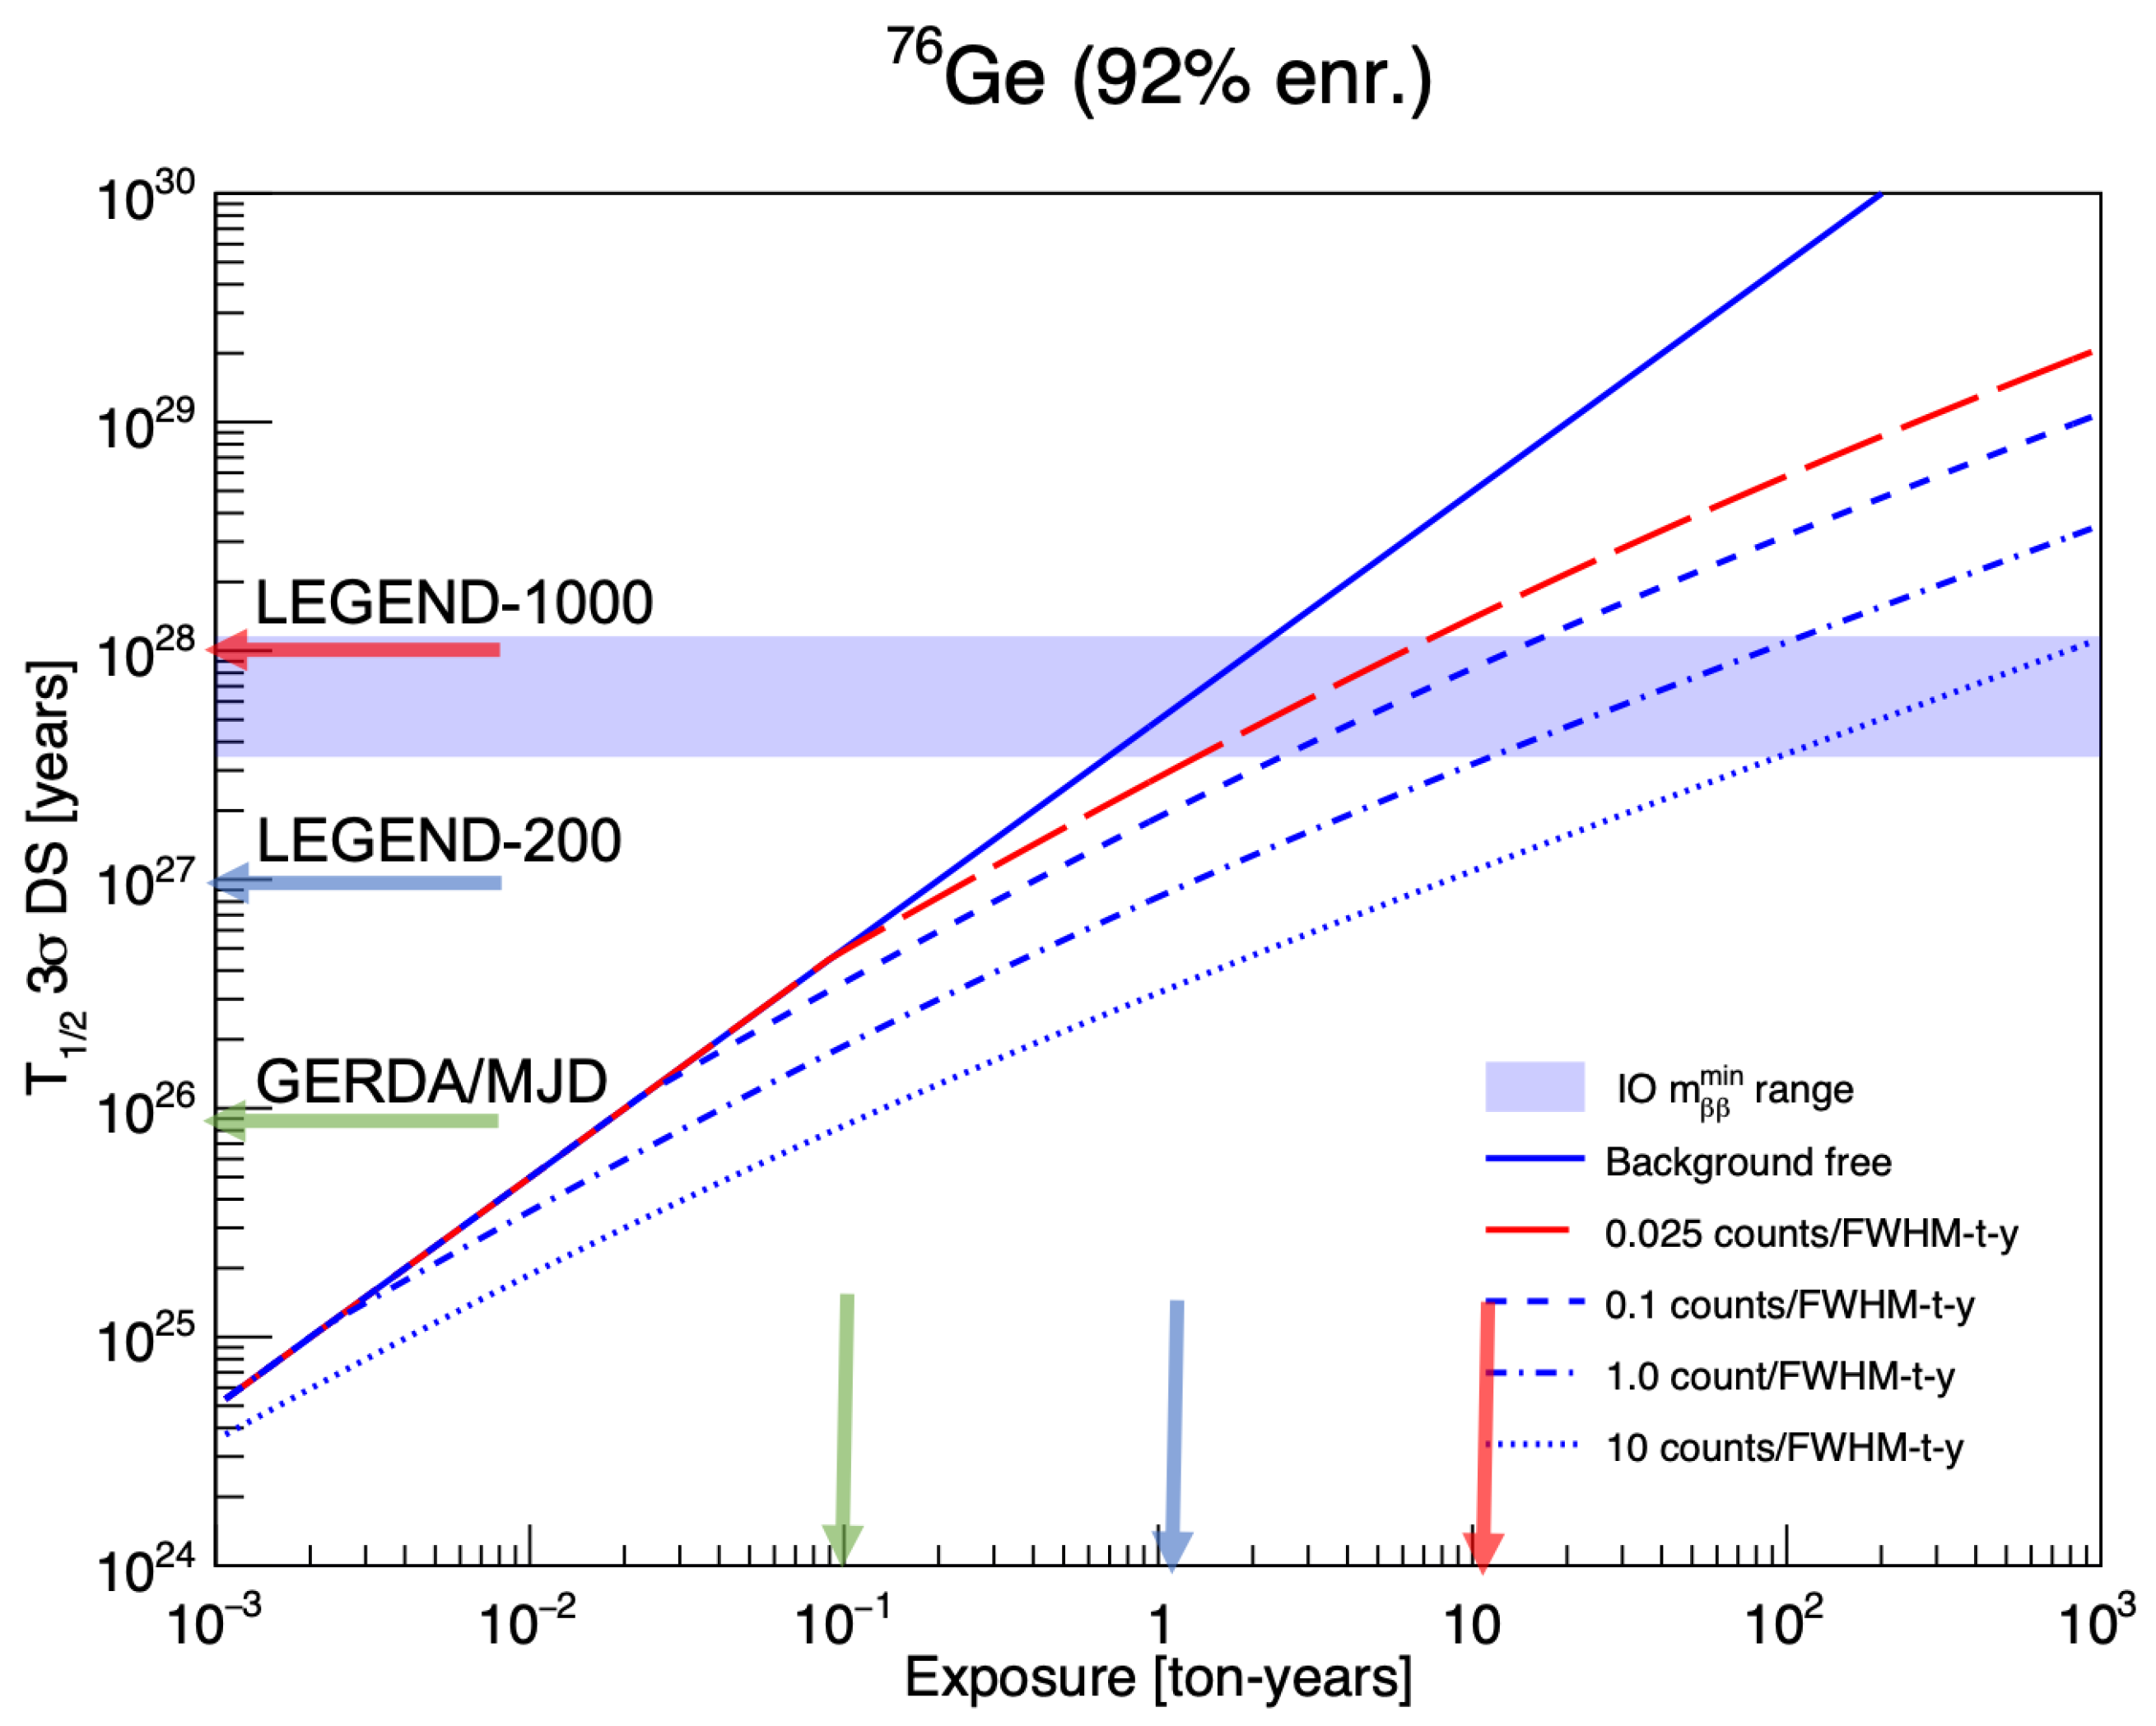
4. Next Generation Ge Experiment: LEGEND
4.1. LEGEND-200
4.2. LEGEND-1000
5. Conclusions
Author Contributions
Funding
Institutional Review Board Statement
Informed Consent Statement
Conflicts of Interest
| 1 | The Gerda HPGe detectors are made of p-type germanium. p+ and n+ contacts are manufactured via boron implantation and lithium diffusion, respectively. Their thickness is about 0.5–1 m and 1 mm, respectively. The lithium-diffused n+ detector surface is a dead layer and acts as a barrier for particles. |
| 2 | ( = 32.9 y; E = 600 keV). |
| 3 | K = 12.6 h; (, E = 3.5 MeV—to of Ca (81.9%), and to , , , accompanied by emission of 1525, 2424, 3447 keV, respectively. |
| 4 | positive K ions are preferentially formed as a result of the Ar decay. |
| 5 | a coarse energy calibration is provided by the FADC. |
| 6 | Tetra-Phenyl-Butadiene, an organic wavelength shifter that absorbs the 128 nm photons from the LAr scintillation light and re-emits it peaked at 420 nm with an efficiency >95%, allows it to be collected by quartz fibers, reflected at the ESR surface and finally detected by PMTs and SiPMs. |
| 7 | The path length of K particles in LAr is less than 1.6 cm, but bremsstrahlung photons from the interaction with LAr can travel as far as ∼10 cm. |
References
- Fukuda, Y. et al. [The Super-Kamiokande Collaboration] Evidence for Oscillation of Atmospheric Neutrinos. Phys. Rev. Lett. 1998, 81, 1562–1567. [Google Scholar] [CrossRef]
- Ahmad, Q.R. et al. [SNO Collaboration] Direct Evidence for Neutrino Flavor Transformation from Neutral-Current Interactions in the Sudbury Neutrino Observatory. Phys. Rev. Lett. 2002, 89, 011301. [Google Scholar] [CrossRef] [PubMed]
- Esteban, I.; Gonzalez-Garcia, M.C.; Maltoni, M.; Martinez-Soler, I.; Schwetz, T. Updated fit to three neutrino mixing: Exploring the accelerator-reactor complementarity. J. High Energy Phys. 2017, 2017, 87. [Google Scholar] [CrossRef]
- Jiang, M. et al. [Super-Kamiokande Collaboration] Atmospheric Neutrino Oscillation Analysis with Improved Event Reconstruction in Super-Kamiokande IV. arXiv 2019, arXiv:1901.03230v1. [Google Scholar]
- Mohapatra, R.N.; Senjanović, G. Neutrino Mass and Spontaneous Parity Nonconservation. Phys. Rev. Lett. 1980, 44, 912. [Google Scholar] [CrossRef]
- Elliott, S.R.; Hahn, A.A.; Moe, M.K. Direct evidence for two-neutrino double-beta decay in 82Se. Phys. Rev. Lett. 1987, 59, 2020. [Google Scholar] [CrossRef]
- Barabash, A.S. Main features of detectors and isotopes to investigate double beta decay with increased sensitivity. Int. J. Mod. Phys. A 2018, 33, 1843001. [Google Scholar] [CrossRef]
- Alduino, C.; Alfonso, K.; Artusa, D.R.; Avignone, F.T., III; Azzolini, O.; Banks, T.I.; Bari, G.; Beeman, J.W.; Bellini, F.; Bersani, A.; et al. Measurement of the two-neutrino double-beta decay half-life of Te with the Cuore-0 experiment. Eur. Phys. J. C 2017, 77, 13. [Google Scholar] [CrossRef]
- Šimkovic, F.; Pantis, G.; Vergados, J.D.; Faessler, A. Additional nucleon current contributions to neutrinoless double β decay. Phys. Rev. C 1999, 60, 055502. [Google Scholar] [CrossRef]
- Freeman, S.J.; Schiffer, J.P. Constraining the 0ν2β matrix elements by nuclear structure observables. J. Phys. G Nucl. Part. Phys. 2012, 39, 124004. [Google Scholar] [CrossRef][Green Version]
- Cappuzzello, F. et al. [NUMEN Collaboration] The Numen project: NUclear Matrix Elements for Neutrinoless double beta decay. Eur. Phys. J. 2018, 54, 72. [Google Scholar] [CrossRef]
- Deppisch, F.F.; Graf, L.; Iachello, F.; Kotila, J. Analysis of light neutrino exchange and short-range mechanisms in 0νββ decay. Phys. Rev. D 2020, 102, 095016. [Google Scholar] [CrossRef]
- Song, L.S.; Yao, J.M.; Ring, P.; Meng, J. Nuclear matrix element of neutrinoless double-β decay: Relativity and short-range correlations. Phys. Rev. C 2017, 95, 024305. [Google Scholar] [CrossRef]
- Fang, D.L.; Faessler, A.; Šimkovic, F. 0νββ-decay nuclear matrix element for light and heavy neutrino mass mechanisms from deformed quasiparticle random-phase approximation calculations for 76Ge, 82Se, 130Te, 136Xe, and 150Nd with isospin restoration. Phys. Rev. C 2018, 97, 045503. [Google Scholar] [CrossRef]
- Hyvarinen, J.; Suhonen, J. Nuclear matrix elements for 0νββ decays with light or heavy Majorana-neutrino exchange. Phys. Rev. C 2015, 91, 024613. [Google Scholar] [CrossRef]
- Šimkovic, F.; Rodin, V.; Faessler, A.; Vogel, P. 0νββ and 2νββ nuclear matrix elements, quasiparticle random-phase approximation, and isospin symmetry restoration. Phys. Rev. C 2013, 87, 045501. [Google Scholar] [CrossRef]
- Faessler, A.; Gonzalez, M.; Kovalenko, S.; Šimkovic, F. Arbitrary mass Majorana neutrinos in neutrinoless double beta decay. Phys. Rev. D 2014, 90, 096010. [Google Scholar] [CrossRef]
- Menendez, J. Neutrinoless ββ decay mediated by the exchange of light and heavy neutrinos: The role of nuclear structure correlations. J. Phys. G Nucl. Part. Phys. 2018, 45, 014003. [Google Scholar] [CrossRef]
- Mustonen, M.T.; Engel, J. Large-scale calculations of the double-β decay of 76Ge, 130Te, 136Xe, and 150Nd in the deformed self-consistent Skyrme quasiparticle random-phase approximation. Phys. Rev. C 2013, 87, 064302. [Google Scholar] [CrossRef]
- Coraggio, L.; Gargano, A.; Itaco, N.; Mancino, R.; Nowacki, F. Calculation of the neutrinoless double-β decay matrix element within the realistic shell model. Phys. Rev. C 2020, 101, 044315. [Google Scholar] [CrossRef]
- Klapdor-Kleingrothaus, H.V.; Krivosheina, I.V.; Dietz, A.; Chkvorets, O. Search for neutrinoless double beta decay with enriched 76Ge in Gran Sasso 1990–2003. Phys. Lett. B 2004, 586, 198. [Google Scholar] [CrossRef]
- Klapdor-Kleingrothaus, H.V.; Krivosheina, I.V. The evidence for the observation of 0νββ decay: The identification of 0νββ events from the full spectra. Mod. Phys. Lett. 2006, 21, 1547–1566. [Google Scholar] [CrossRef]
- Abt, I.; Altmann, M.; Bakalyarov, A.; Barabanov, I.; Bauer, C.; Bellotti, E.; Belyaev, S.T.; Bezrukov, L.; Brudanin, V.; Buettner, C.; et al. A New 76Ge Double Beta Decay Experiment at LNGS. arXiv 2004, arXiv:hep-ex/0404039v1. [Google Scholar]
- Heusser, G. Low Radioactivity Background Techniques. Annu. Rev. Part. Nuc. Sci. 1995, 45, 543. [Google Scholar] [CrossRef]
- Ackermann, K.H. et al. [Gerda Collaboration] The Gerda experiment for the search of 0νββ decay in 76Ge. Eur. Phys. J. C 2013, 73, 2330. [Google Scholar] [CrossRef]
- Klapdor-Kleingrothaus, H.V. et al. [Heidelberg-Moscow Collaboration] Latest results from the Heidelberg-Moscow double beta decay experiment. Eur. Phys. J. A 2001, 12, 147. [Google Scholar] [CrossRef]
- Aalseth, C.E. et al. [Igex Collaboration] Igwx76Ge neutrinoless double-beta decay experiment: Prospects for next generation experiments. Phys. Rev. D 2002, 65, 092007. [Google Scholar] [CrossRef]
- Agostini, M. et al. [Gerda Collaboration] Production, characterization and operation of 76Ge enriched BEGE detectors in Gerda. Eur. Phys. J. C 2015, 75, 39. [Google Scholar] [CrossRef]
- Riboldi, S.; Zocca, F.; Pullia, A.; Barnabé-Heider, M.; Budjas, D.; DÁndragora, A.; Cattadori, C. A low-noise charge sensitive preamplifier for Ge spectroscopy operating at cryogenic temperature in the Gerda experiment. In Proceedings of the IEEE Nuclear Science Symposium and International Workshop on Room-Temperature Semiconductor Detectors, Knoxville, TN, USA, 30 October–6 November 2010; p. 1386. [Google Scholar]
- Agostini, M. et al. [Gerda Collaboration] Upgrade for Phase II of the Gerda experiment. Eur. Phys. J. C 2018, 78, 388. [Google Scholar] [CrossRef]
- Bernabé Heider, M. Performance and Stability Tests of Bare High Purity Germanium Detectors in Liquid Argon for the Gerda Experiment. Ph.D. Thesis, University of Heidelberg, Heidelberg, Germany, 2009. [Google Scholar]
- Peurrung, A.J.; Bowyer, T.W.; Craig, R.A.; Reeder, P.L. Expected atmospheric concentration of 42Ar. Nucl. Instrum. Methods A 1997, 396, 425–426. [Google Scholar] [CrossRef]
- Ashitkov, V.D.; Barabash, A.S.; Belogurov, S.G.; Carugno, G.; Konovalov, S.I.; Massera, F.; Puglierin, G.; Saakyan, P.R.; Stekhanov, V.N.; Umatov, V.I. A Liquid-Argon Ionization Detector for the Study of Double β Decay. Instrum. Exp. Tech. 2003, 46, 153. [Google Scholar] [CrossRef]
- Agostini, M. et al. [Gerda Collaboration] The background in the 0νββ experiment Gerda. Eur. Phys. J. C 2014, 74, 2764. [Google Scholar]
- Agostini, M.; Ur, C.A.; Budjáš, D.; Bellotti, E.; Brugnera, R.; Cattadori, C.M.; di Vacri, A.; Garfagnini, A.; Pandola, L.; Schönert, S. Signal modeling of high-purity Ge detectors with a small read-out electrode and application to neutrinoless double beta decay search in Ge-76. J. Instrum. 2011, 6, P03005. [Google Scholar] [CrossRef]
- Agostini, M. et al. [Gerda Collaboration] Pulse shape discrimination for Gerda Phase I data. Eur. Phys. J. C 2013, 73, 2583. [Google Scholar] [CrossRef]
- Agostini, M.; Pandola, L.; Zavarise, P.; Volynets, O. Gelatio: A General Framework for Modular Digital Analysis of High-Purity Ge Detector Signals. J. Instrum. 2011, 6, P08013. [Google Scholar] [CrossRef]
- Metzger, F.R.; Tandon, G.K. Lifetime of the 1.52-MeV Level in 42Ca. Phys. Rev. 1966, 148, 1133. [Google Scholar] [CrossRef]
- Riboldi, S.; Pullia, A.; Cattadori, C. Improvement of the “CC2” charge sensitive preamplifier for the Gerda phase II experiment. In Proceedings of the 2012 IEEE Nuclear Science Symposium and Medical Imaging Conference Record (NSS/MIC), Anaheim, CA, USA, 29 October–3 November 2012. [Google Scholar] [CrossRef]
- Zuzel, G.; Wojcik, M.; Buck, C.; Rau, W.; Heusser, G. Ultra-traces of 226Ra in nylon used in the Borexino solar neutrino experiment. Nucl. Instrum. Methods A 2003, 498, 240–255. [Google Scholar] [CrossRef]
- Domula, A.; Hult, M.; Kermaidic, Y.; Marissens, G.; Schwingenheur, B.; Wester, T.; Zuber, K. Pulse shape discrimination performance of inverted coaxial Ge detectors. Nucl. Instrum. Methods A 2018, 891, 106. [Google Scholar] [CrossRef]
- Gerda Collaboration. Characterization of inverted coaxial 76Ge detectors in Gerda for future double-β decay experiments. Eur. Phys. J. C 2021, 81, 505. [Google Scholar] [CrossRef]
- Agostini, M.; Pandola, L.; Zavarise, P. Off-line data processing and analysis for the Gerda experiment. J. Phys. (Conf. Ser.) 2012, 368, 012047. [Google Scholar] [CrossRef]
- Radeka, V. Trapezoidal filtering of signals from large germanium detectors at high rates. Nucl. Instrum. Methods 1972, 99, 525–539. [Google Scholar] [CrossRef]
- Agostini, M. et al. [Gerda Collaboration] Improvement of the energy resolution via an optimised digital signal processing in Gerda Phase I. Eur. Phys. J. C 2015, 75, 255. [Google Scholar] [CrossRef]
- INE Laboratory. Gamma-ray Spectrum Catalog of Isotopes. Available online: http://www.radiochemistry.org/periodictable/gamma_spectra/index.html (accessed on 31 May 2021).
- Agostini, M. et al. [Gerda Collaboration] Calibration of the Gerda experiment. Eur. Phys. J. C 2021, 81, 682. [Google Scholar] [CrossRef]
- Agostini, M. et al. [Gerda Collaboration] Final Results of Gerda on the Search for Neutrinoless Double-β Decay. Phys. Rev. Lett. 2020, 125, 252502. [Google Scholar] [CrossRef] [PubMed]
- Agostini, M. et al. [Gerda Collaboration] Results on ββ decay with emission of two neutrinos or Majorons in 76Ge from Gerda Phase I. Nucl. Phys. B 2015, 75, 416. [Google Scholar]
- Agostini, M. et al. [Gerda Collaboration] Modeling of Gerda Phase II data. J. High Energy Phys. 2020, 2020, 139. [Google Scholar] [CrossRef]
- Boswell, M.; Chan, Y.D.; Detwiler, J.A.; Finnerty, P.; Henning, R.; Gehman, V.M.; Johnson, R.A.; Jordan, D.V.; Kazkaz, K.; Knapp, M.; et al. MaGe–A Geant4-Based Monte Carlo Application Framework for Low-Background Germanium Experiments. IEEE Trans. Nucl. Sci. 2011, 58, 1212. [Google Scholar] [CrossRef]
- Geant4 Collaboration Geant4–A simulation toolkit. Nucl. Instrum. Methods A 2003, 506, 250. [CrossRef]
- Agostini, M. et al. [Gerda Collaboration] Improved Limit on Neutrinoless Double-β Decay of 76Ge from Gerda Phase II. Nature 2017, 544, 47. [Google Scholar] [CrossRef]
- Alvis, S.I. et al. [Majorana Collaboration] Search for neutrinoless double-β decay in 76Ge with 26 kg yr of exposure from the Majorana Demonstrator. Phys. Rev. C 2019, 100, 025501. [Google Scholar] [CrossRef]
- Abgrall, N.; Abramov, A.; Abrosimov, N.; Abt, I.; Agostini, M.; Agartioglu, M.; Ajjaq, A.; Alvis, S.I.; Avignone, F.T.; Bai, X.; et al. The large enriched germanium experiment for neutrinoless double beta decay (Legend). AIP Conf. Proc. 2017, 1894, 020027. [Google Scholar]
- Abgrall, N. et al. [Majorana Collaboration] The Majorana Demonstrator Neutrinoless Double-Beta Decay Experiment. Adv. High Energy Phys. 2014, 2014, 365432. [Google Scholar] [CrossRef]
- Wiesinger, C.; Pandola, L.; Schönert, S. Virtual depth by active background suppression: Revisiting the cosmic muon induced background of Gerda Phase II. Eur. Phys. J. C 2018, 78, 7597. [Google Scholar] [CrossRef]
- Gando, A. et al. [KAMland-ZEN Collaboration] Search for Majorana Neutrinos Near the Inverted Mass Hierarchy Region with KamLAND-Zen. Phys. Rev. Lett. 2016, 117, 082503. [Google Scholar] [CrossRef] [PubMed]
- Alduino, C. et al. [Cuore Collaboration] High sensitivity neutrinoless double-beta decay search with one tonne-year of Cuore data. arXiv 2021, arXiv:2104.06906. [Google Scholar]
- Azzolini, O. et al. [Cupid Collaboration] Final Result of Cupid-0 Phase-I in the Search for the 82Se Neutrinoless Double-β Decay. Phys. Rev. Lett. 2019, 120, 032501. [Google Scholar]
- Azzolini, O. et al. [Cupid Collaboration] New Limit for Neutrinoless Double-Beta Decay of 100Mo from the Cupid-Mo Experiment. Phys. Rev. Lett. 2021, 126, 181802. [Google Scholar] [CrossRef] [PubMed]
- Albert, J.B. et al. [Exo Collaboration] Search for Neutrinoless Double-Beta Decay with the Upgraded Exo-200 Detector. Phys. Rev. Lett. 2018, 120, 072701. [Google Scholar] [CrossRef] [PubMed]


| NME Nodel | LNE (HNE) Matrix Elements | ||
|---|---|---|---|
| ( = 1.27) | Ge | Te | Xe |
| IBM2 [12] | 6.34 (181.6) | 4.2 (126.8) | 3.4 (99.2) |
| CDFT [13] | 6.04 (209.1) | 4.89 (193.8) | 4.24 (166.3) |
| QRPA-FFS [14] | 3.12 (187.3) | 2.9 (191.4) | 1.11 (66.9) |
| QRPA-JY [15] | 5.26 (401.3) | 4.0 (338.3) | 2.91 (186.3) |
| QRPA-TU [16,17] | 5.16 (287) | 2.89 (264) | 2.18 (152) |
| ISM-TK [18] | 2.89 (130) | 2.76 (146) | 2.28 (116) |
| QRPA-NC [19] | 5.09 | 1.37 | 1.55 |
| ISM-INFN [20] | 3.34 | 3.26 | 2.49 |
| Component | Units | K | Bi and Ra | Th | Co | BI [ cts/(keV·kg·yr)] |
|---|---|---|---|---|---|---|
| Distant sources: further than 30 cm from the detectors | ||||||
| Cryostat steel | kBq | <72 | <30 | <30 | 475 | <0.05 |
| Cu of the Cryostat | mBq | <784 | ||||
| Th calibration sources | kBq | 20 | <1.0 | |||
| Medium distance sources: 2–30 cm from detectors | ||||||
| 3 Ch. Charge preamplifier w.o pins | Bq/pc | 0.8 | ||||
| Cables and suspensions | mBq/m | 0.2 | ||||
| Close sources: up to 2 cm from detectors | ||||||
| Cu detector holders | Bq/det | <7 | <1.3 | <1.5 | <0.2 | |
| PTFE detector support | Bq/det | 0.1 | ||||
| Mini-shroud | Bq/det | 2.8 | ||||
| Readout/HV contact 1m | Bq/pc | <3.3 | 0.1 | |||
| Data Set | (kg·yr) | bkg | BI | cts | |
|---|---|---|---|---|---|
| without PSD | |||||
| golden | 17.9 | 76 | 18 ± 2 | 5 | |
| silver | 1.3 | 19 | 63 | 1 | |
| BEGe | 2.4 | 23 | 42 | 1 | |
| with PSD | |||||
| golden | 17.9 | 45 | 11 ± 2 | 2 | |
| silver | 1.3 | 9 | 30 | 1 | |
| BEGe | 2.4 | 3 | 5 | 0 | |

| December 2015–May 2018 | July 2018–November 2019 | ||||
|---|---|---|---|---|---|
| Coaxial | BEGe | Coaxial | BEGe | Inverted Coaxial | |
| Number of detectors | 7 | 30 | 6 | 30 | 5 |
| Total mass (kg) | 15.6 | 20 | 14.6 | 20 | 9.6 |
| Exposure (kg·yr) | 28.6 | 31.5 | 13.2 | 21.9 | 8.5 |
| Energy resolution at Q FWHM (keV) | 3.6 ± 0.2 | 2.9 ± 0.3 | 4.9 ± 1.4 | 2.6 ± 0.2 | 2.9 ± 0.1 |
| decay detection efficiency (%): | 46.2 ± 5.2 | 60.5 ± 3.3 | 47.2 ± 5.1 | 61.1 ± 3.9 | 66.0 ± 1.8 |
| Electron containment (%) | 91.4 ± 1.9 | 89.7 ± 0.5 | 92.0 ± 0.3 | 89.3 ± 0.6 | 91.8 ± 0.5 |
| Ge enrichment (%) | 86.6 ± 2.1 | 88.0 ± 1.3 | 86.8 ± 2.1 | 88.0 ± 1.3 | 87.8 ± 0.4 |
| Active volume (%) | 86.1 ± 5.8 | 88.7 ± 2.2 | 87.1 ± 5.8 | 88.7 ± 2.1 | 92.7 ± 1.2 |
| Liquid argon veto (%) | 97.7 ± 0.1 | 98.2 ± 0.1 | |||
| Pulse shape discrimination (%) | 69.1 ± 5.6 | 88.2 ± 3.4 | 68.8 ± 4.1 | 89.0 ± 4.1 | 90.0 ± 1.8 |
| Isotope | Moles | FWHM | BI | Range | ||||
|---|---|---|---|---|---|---|---|---|
| (n·yr) | (kg·yr) | (keV) | (cts/(keV·kg·yr)) | (yr) | (yr) | (meV) | ||
| Gerda [48] | Ge | 1288 | 127.2 | 3.3 | 18.0 | 18.0 | 79–180 | |
| Majorana [54] | Ge | 221 | 26.0 | 2.53 | 4.8 | 2.7 | 200–433 | |
| Cupid-0 [60] | Se | 64.5 | 9.95 | 20.0 | 3.5 | 0.5 | 0.35 | 311–638 |
| Cupid-Mo [61] | Mo | 11.7 | 2.16 | 7.6 | 5.0 | 0.15 | 310–540 | |
| Cuore [59] | Te | 2215 | 1038.4 | 2.8 | 2.2 | 90–305 | ||
| Exo-200 [62] | Xe | 550 | 56 | 71 | 1.7 | 3.7 | 1.8 | 150–400 |
| KAMland-ZEN [58] | Xe | 1585 | 215.5 | 265 | 0.3 | 5.6 | 11.0 | 60–160 |
Publisher’s Note: MDPI stays neutral with regard to jurisdictional claims in published maps and institutional affiliations. |
© 2021 by the authors. Licensee MDPI, Basel, Switzerland. This article is an open access article distributed under the terms and conditions of the Creative Commons Attribution (CC BY) license (https://creativecommons.org/licenses/by/4.0/).
Share and Cite
Cattadori, C.M.; Salamida, F. GERDA and LEGEND: Probing the Neutrino Nature and Mass at 100 meV and beyond. Universe 2021, 7, 314. https://doi.org/10.3390/universe7090314
Cattadori CM, Salamida F. GERDA and LEGEND: Probing the Neutrino Nature and Mass at 100 meV and beyond. Universe. 2021; 7(9):314. https://doi.org/10.3390/universe7090314
Chicago/Turabian StyleCattadori, Carla Maria, and Francesco Salamida. 2021. "GERDA and LEGEND: Probing the Neutrino Nature and Mass at 100 meV and beyond" Universe 7, no. 9: 314. https://doi.org/10.3390/universe7090314
APA StyleCattadori, C. M., & Salamida, F. (2021). GERDA and LEGEND: Probing the Neutrino Nature and Mass at 100 meV and beyond. Universe, 7(9), 314. https://doi.org/10.3390/universe7090314