Abstract
Constraints on neutron star masses and radii now come from a variety of sources: theoretical and experimental nuclear physics, astrophysical observations including pulsar timing, thermal and bursting X-ray sources, and gravitational waves, and the assumptions inherent to general relativity and causality of the equation of state. These measurements and assumptions also result in restrictions on the dense matter equation of state. The two most important structural parameters of neutron stars are their typical radii, which impacts intermediate densities in the range of one to two times the nuclear saturation density, and the maximum mass, which impacts the densities beyond about three times the saturation density. Especially intriguing has been the multi-messenger event GW170817, the first observed binary neutron star merger, which provided direct estimates of both stellar masses and radii as well as an upper bound to the maximum mass.
1. Introduction
The study of neutron stars represents our best chance to study matter under conditions of high density, extreme isospin asymmetry, and relatively cold temperatures which cannot be examined through heavy ion collisions. As explained below, neutron star matter is in strong- and weak-interaction equilibrium, which for densities larger than the nuclear saturation density, fm, which is the normal density found inside atomic nuclei, results in very neutron-rich compositions in which the neutron/proton ratio is 10 to 20. In laboratory nuclei, and in heavy-ion experiments, on the other hand, one generally has more symmetric matter, . Limited information (see Ref. [1] for a review and references) is available through nuclear structure studies of neutron-rich nuclei such as mass, neutron skin, and giant monopole and dipole resonances that can probe cold matter up to , but under relatively symmetric conditions; see Section 4. Recent advances in theoretical neutron matter studies [2] complement experiments and probe extremely neutron-rich matter, but are expansions and therefore limited to densities below about . Measurements of the radii of neutron stars are excellent probes of neutron star matter from , as the pressure of such matter in this range is highly correlated with the radius [3], while the maximum mass neutron star mass probes densities in the range from . Lower and upper bounds on neutron star radii are found through the assumptions of general relativity and causality [4], as discussed in Section 2 and Section 5. Radii can be estimated through studies of thermal X-ray emission from cooling neutron stars, either from young stars or from old, but transiently accreting, sources in quiescence as discussed in Section 6, from pulsar moments of inertia, and from tidal deformabilities and masses inferred from gravitational waves from neutron star–neutron star or black hole–neutron star mergers, as summarized in Section 7 and Section 8. Section 2 reviews the lower limit to the neutron star maximum mass that comes from pulsar timing measurements of the most massive pulsars, and an upper limit may be determined from multi-messenger merger events in which both gravitational waves and electromagnetic signatures are seen, another topic of Section 8. Observational data are expected to grow rapidly in the near future due to both ground-based (SKA [5], FAST [6], and LVC) and space-based (HST, NICER [7], ATHENA [8], and the proposed eXTP [9]) observatories.
2. General Mass and Radius Limits from First Principles
It is useful to examine the most extreme neutron star configurations. For example, Koranda, Stergioulas and Friedman [10] suggested that the most compact stars result from an equation of state (EOS) that is as soft as posssible at low (subsaturation) densities but as stiff as possible at the highest densities. Here, soft and hard refer to the relative pressures p at the corresponding energy densities . The extreme case can be modeled with the maximum compactness EOS where the pressure vanishes at low density but is causal (i.e., having a sound speed equal to light speed) at high densities:
where represents a transition density which is the single parameter of this EOS. When employed in the relativistic stellar structure equations
where m is the mass interior to the radius r, one obtains solutions that depend only on the central energy density and the parameter . In particular, the solution with the maximum possible mass has central values and , as well as , where and are the total mass and radius [11]. Moreover, the maximum mass configuration has , which shows that where is the neutron star maximum mass and MeV fm is the energy density at . At present, the most massive, accurately-measured pulsars are PSR J0348 + 0432 [12], with , and PSR J0740 + 6620 [13], with . While the former is technically a more accurate measurement, it is subject to uncertainties in modeling thermal evolutions of white dwarfs, while the latter is a Shapiro delay measurement not requiring theoretical modeling. With time, the uncertainties of Shapiro delay measurements should decrease. Conservatively, we adopt for the minimum value of , giving 4.19 and 12.7 . These represent the highest possible values for the energy density in a neutron star; a larger measured Mmax will lower them.
For masses smaller than the maximum mass, stars become less compact, i.e., they have smaller values of . From integration of Equation (2), one can determine the dimensionless bounds on as a function of using Equation (1). Rescaling with assumed values for , the region in the diagram excluded by causality is displayed in Figure 1. A star must have km if , with and redshift , about half that of the maximum mass star. For larger minimum values of , the excluded region grows as shown.
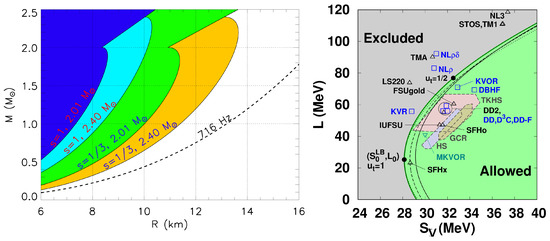
Figure 1.
Left: Regions excluded by the maximum compactness conjecture. The dark (light) blue region is excluded when . Alternatively, regions excluded by the EOS are shown as the green and orange regions. The dashed line denotes the maximum radius from the Keplerian constraint applied to the most-rapidly-spinning pulsar, PSR J1748-2446ad, adapted from Ref. [14]. Right: The gray region is excluded by the unitary gas conjecture. Symbols indicate parameters from various published EOSs and the colored polygons show neutron matter predictions, adapted from Ref. [15].
More realistic conditions (but not bounds) can be estimated with the high-density EOS with , where is the sound speed. It is commonly believed that the realistic high-density limit of the EOS, in which quarks are asymptotically free, is . In this case, , , and in the maximum mass case. Thus, and . Thus, and ; the latter is clearly smaller (by about a factor ) than for , as expected.
The most rapidly-spinning pulsar, PSR J1748-2446ad, can be used to estimate the maximum radii of neutron stars. It can be shown [16] in general relativity, under the assumption of uniform rotation that the maximum (Keplerian) spin rate, where mass-shedding from the equator occurs, is, for a star of non-rotating mass M and radius R,
The spin frequency of PSR J1748-2446ad, 716 Hz [17], implies that km for this pulsar, and automatically applies to all stars with masses greater than this pulsar, in particular for the maximum mass configuration. However, although the mass of this pulsar is unknown, if it is much less than , this limit should apply to most neutron stars.
Measured neutron star masses via pulsar timing are displayed in Figure 2 [14,18]. The figure shows that the error-weighted average masses (dashed lines) are close to for all categories of measurements, but the dispersion in masses is especially small in the case of double neutron star systems. This figure does not include the recently discovered pulsar J0740 + 6620 with [13]. Some other massive estimates are noted, such as the black-widow pulsars B19757 + 20 and PSR J1311-3430, but these have quite large uncertainties due to the unknown sizes and shapes of their companions. These pulsars tend to be massive as they appear to be ’consuming’ their companions. Several additional systems are now known, and it is hoped further observations and models will refine these mass estimates.
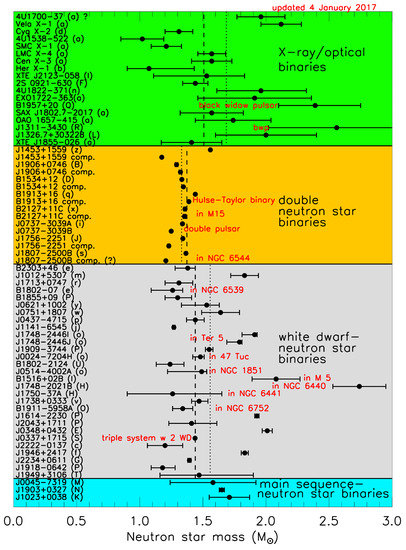
Figure 2.
Masses measured from pulsar timing. Vertical dashed (dotted) lines indicate category error-weighted (unweighted) averages. The figure is updated from that of Ref. [14].
3. Nuclear Physics Constraints on Neutron Star Radii
Lattimer and Prakash [3] discovered that neutron star radii and neutron star matter pressure around are highly correlated. Approximately,
where is the neutron star matter pressure at .2 One can define the symmetry energy as the energy difference between pure neutron matter and symmetric nuclear matter at a given density. Denoting as the baryonic energy per baryon as a function of density and proton fraction x, the symmetry energy is . It is usually assumed that the energy of matter at arbitrary proton fraction may be found with a quadratic interpolation . This is equivalent to expanding in a power series expansion of and neglecting terms higher than quadratic order, for which there is theoretical justification [19]. With this assumption, the symmetry energy may be expanded about :
where MeV, MeV and MeV are symmetry energy parameters. Neutron star matter has a composition determined by energy minimization , where is the energy due to electrons. This minimization is equivalent to beta-equilibrium, , where the s are chemical potentials, which leads to at . Thus, one can approximate neutron star matter by pure neutron matter, and it follows that the neutron matter energy and pressure at are
Here, MeV is the bulk binding energy of nuclear matter at .
A valuable experimental and theoretical lower limit to the energy of neutron matter and the symmetry energy parameters exists from unitary gas considerations which sets a larger lower limit to radii than does causality. A unitary gas refers to the idealized state of fermions interacting via a pairwise short-range s-wave interaction having an infinite scattering length and zero range [20]. The unitary gas conjecture posits that the lower limit to the neutron matter energy at any density is that of a unitary gas [15]. Pure neutron matter has an s-wave scattering length of fm, giving at , where is the Fermi wave number, whereas a unitary gas has . Neutron matter also has an effective range fm, compared to a unitary gas which has . However, both distinctions, as well as its higher-order spin terms and tensor interactions, make neutron matter more repulsive, with therefore a greater energy, than a unitary gas
A unitary gas has the universal behavior
where is the Bertsch parameter, well-measured in cold atom experiments, and is the Fermi energy of non-interacting non-relativistic neutrons. The unitary gas conjecture automatically sets the lower limits MeV, MeV and MeV [15]. This rules out large portions of the plane (right panel of Figure 1), and establishes that many commonly-used dense matter EOSs have poor choices for the symmetry parameters. The lower limit to the neutron pressure at , MeV fm, also establishes that 9.7 km, 1.6 km larger than the causal limit.
4. Constraints Based on Neutron Matter Theory and Nuclear Experiments
There has been much progress in refining the energy of neutron matter from chiral many-body approaches (see Ref. [15] for a summary of recent work). Some examples of their predictions for the symmetry parameters and L are shown in Figure 1, which are seen to be consistent with the unitary gas conjecture, and predict relatively small values of L, in the range 30 MeV MeV, and therefore radii, 10 km R1.4 13 km. Although uncertainties in these calculations increase as the density is increased, error analyses indicate that they are useful up to about 2ns.
The symmetry energy parameters can also be constrained from nuclear measurements. The most accurate measurements are those of nuclear masses. According to the liquid drop model, the nuclear mass can be described primarily as the sum of volume, surface and Coulomb contributions, which scale as A, and , respectively. The volume and surface energies both decrease as the nuclear asymmetry is increased, so that the symmetry energy of a nucleus is positive and proportional to :
where the subscript i refers to the ith nucleus. Additionally, there are shell and pairing contributions to the total energy, but the symmetry energies can be accurately found, modulo the Coulomb term, by
To optimize the symmetry parameters and , one minimizes the quantity
where is the number of nuclei and MeV is a standard error. This results in a narrow correlation ellipse in the plane with orientation with respect to the axis, and widths and [14]. To a reasonable approximation, can be used to propagate this to the plane, as seen in Figure 3.
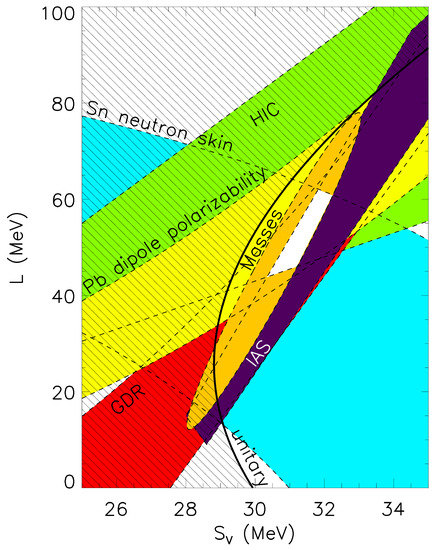
Figure 3.
Experimental constraints on the nuclear symmetry properties compared with those of the unitary gas conjecture. HIC, IAS and GDR are from heavy-ion collisions, isobaric analog states and centroid energies of giant dipole resonances, respectively (see Lattimer and Lim [1] for details).
In a similar way, constraints from neutron skin, dipole polarizability, giant dipole resonance and heavy ion collisions can be overlaid to obtain a relatively small region of overall consistency (Figure 3) suggesting that 30 MeV Sv 32 MeV and 40 MeV ≲ L ≲ 60 MeV.
5. Extrapolations of the EOS to Higher Densities
Having observed that reasonably strict constraints on the energy density and pressure exist up to about from nuclear experiments and up to about from neutron matter theory, it is interesting to couple these with the global constraints of causality and 2M⊙ to limit the EOS at higher densities. A useful parameterization consists of piecewise polytropes. Read et al. [21] demonstrated that three polytropes in addition to a low-density crust are sufficient to adequately describe most existing models of dense matter from Skyrme-like non-relativistic and Walecka-like relativistic field-theoretical models. In principle, continuity of the EOS at the boundaries between these regions requires eight parameters, for example, the boundary densities and pressures, ni, pi for i ∈ 0 − 3. We assume the crust boundary is n0 = ns/2.7 and p0 = 0.2177 MeV fm−3 to match the SLy4 EOS [22] that we use at lower densities.3 Furthermore, we assume ni = 1.85(2i−1)ns for i ∈ 1 − 3 following Ref. [21] who found these were expedient choices to match a variety of published EOSs. Therefore, only three parameters remain unspecified. The range of p1, 8.4 MeV fm−3 < p1 < 20 MeV fm−3 can be inferred from neutron matter studies, since n1 = 1.85ns is small enough that these calculations are still valid. We note that a considerably smaller lower limit to p1, 3.74 MeV fm−3, would follow from the unitary gas conjecture. For the studies reported here, the upper limit to p1 was arbitrarily increased by 50%.4 The ranges of p2 and p3 are restricted from above by causality and from below by the Mmax ≳ 2M⊙ constraint. The parameter ranges and the details of this scheme are summarized in Ref. [4].
The regions of and space that result from sampling these parameters within their allowed ranges are displayed in Figure 4. These ranges are sensitive to the assumed lower limit to ; increasing raises the minimum R as a function of M and the minimum p as a function of . Had the lower limit to been taken from the unitary gas conjecture, the lower limits to R for would have been reduced by about 0.5 km for but effectively unchanged for larger values of . Nevertheless, the lower limits to R for all M are substantially larger than those implied by the maximum compactness conjecture (Figure 1).
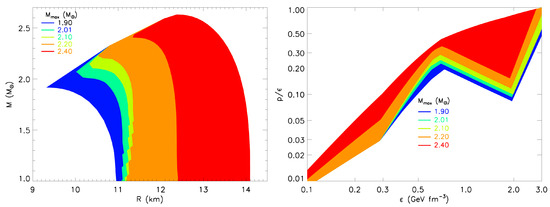
Figure 4.
Left: Allowed regions of space. Right: Allowed regions of space. Colors denote the results of varying the assumed minimum value of .
6. Astrophysical X-Ray Constraints on Mass and Radius
In general, thermal emissions from neutron stars can be used to infer masses and radii. If neutron stars were non-relativistic blackbodies, measurements of total fluxes, peak spectral energies (which are in the X-ray band), and distances D would suffice to predict the source radius. However, thermal measurements need to be corrected for the surface redshift, their uncertain atmospheres and magnetic field structures, and interstellar absorption that may extinguish a large fraction of their emission before it reaches the Earth. Due to the gravitational redshift, the observed flux is reduced by two redshift factors, one for the energy and one for the time, and the observed temperature is reduced by a single redshift factor. Since the flux is proportional to , where D is the source distance, the inferred radius is increased by one redshift factor, . The atmosphere/magnetic field effectively changes the location of the spectral peak from which the color temperature is inferred; this is described by the introduction of a color-correction factor . With predictions of , one can thus infer the angular area of the star , and with a distance estimate, the apparent radius . If one or more spectral lines can be identified, the star’s redshift could be found, allowing both M and R to be inferred. However, it has not yet been possible to observe any such spectral features. An additional complication is that a large fraction of the lower-energy X-rays may be absorbed by the interstellar medium before reaching Earth. Either the amount of absorption, usually described in terms of the column density of hydrogen, , is treated as a fitting parameter along with M and R, which increases the uncertainty in a radius estimate, or must be taken from pulsar dispersion measures or observed extinctions along the line-of-sight to each source. To summarize, uncertainties in D, and dominate the uncertainties in X-ray inferences of neutron star radii.
Focus has therefore been on four classes of sources: (i) isolated neutron stars nearby whose distance can be inferred by parallax, (ii) sources in globular clusters for which estimates of D and are available, (iii) certain bursting sources, which have the advantage of providing an additional observable, related to the Eddington luminosity that depends on M and R, and (iv) phase-resolved spectroscopy of periodic flux variations from rotating neutron stars.
The classic case of a nearby isolated source with a measured parallax is RX J1856-4754. The distance is pc [23], which, coupled with a magnetic hydrogen atmosphere model of Ho et al. [24], gives km. For , this gives km. For this value of , note that km , so even if the mass is different by , the radius would change by only 0.75 km. This source has a featureless spectrum, so its atmospheric composition cannot be confirmed. No other sources have yielded reliable radius estimates.
Globular cluster source measurements are much more prolific. Guillot and Rutledge [25] measured five quiescent (non-bursting) sources, Özel and Freire [18] summarized results for eight sources, and recently, Bogdanov et al. [26] studied an additional source. These sources were found to have best-fit values of ranging from 8.6 to 23.0 km, but this wide range can be reduced significantly if pulsar dispersion measures [27] or reddening measurements [28] are used to find . In this case, it is found that 9.5 km km result [29]. The average, for a star, implies a radius of about 9.6 km. However, some sources may have He rather than H atmospheres, which would increase by 3–5 km. Since these sources are likely to have similar masses, the large variations in their estimated radii point to unresolved problems with systematic uncertainties involving interstellar absorption, atmospheric composition, and distance.
In the case of photospheric radius expansion bursts, the radiation pressure from the thermonuclear ignition of surface layers temporarily levitates the photosphere, and it is possible to infer the corresponding Eddington flux necessary for radiation pressure to balance gravity. With surface redshift corrections,
where is the atmospheric opacity, can be inferred from the maximum observed flux during a burst. The flux falls rapidly from the peak, and within seconds the apparent emitting angular area can be inferred from simultaneous flux and temperature measurements on the ’tail’ of the burst. Together with , A provides the additional information needed to separately estimate M and R, assuming that D, and estimates are valid. Using this method for six photospheric radius expansion bursts, Özel & Freire [18] obtained a mean radius of km. While the stated uncertainty is gratifyingly small, it is probably an artifact of the model being oversimplified, as one can easily demonstrate.
Observations of many bursts from each source yield values for and A, and their standard deviations and . One can construct two parameters and :
From , the stellar compactness can be found: , which requires for a real solution. However, in every burst source observed so far, exceeds 1/8 by more than and often by . This inconsistency may be caused by one or more of the model’s simplifying assumptions: spherical source geometry, constant opacity and color-correction factor during the burst. Uncertainties in a source’s composition and distance also contribute to systematic uncertainties. Furthermore, the redshift factor in Equation (13) may be diminished if is estimated while the photosphere is extended above the surface. Larger radii, and more realistic uncertainties, result if this redshift factor is eliminated [30].
Related to this burst method is the so-called cooling-tail method [31] which focuses on the late-time evolutions. In this method, one fits both the observed spectra and model spectra with blackbody spectra. In addition to the color-correction factor , one introduces the dilution factor w defined so that the bolometric luminosity is conserved
where is the Planck function. It is convenient to define as a parameter that does not depend on distance. Note that in terms of the previously-used . Another fitting factor introduced is .
In this method, one defines the blackbody normalization . Note that, if was equal to the normalization A, it would follow that , but this would lead to non-conservation of bolometric flux. All changes to occurring after the burst’s peak are due to changes in w. The observed evolution of on the tail of the burst is equivalent to the evolution of , allowing the determination of and , and therefore . This gives a trajectory in the plane, which still depends on the assumed opacity and gravity used in the model atmosphere models. Fortunately, for the composition there are only two realistic cases: a solar H/He atmosphere or a pure helium atmosphere. They give results so different that only one choice produces reasonable radii. For a particular composition, an assumed distance then determines another trajectory in the plane. The resulting radii determinations are, of course, limited by the distance uncertainties as in the photospheric radius expansion technique. Results with the cooling-tail method indicate radii larger than in the photospheric radius expansion technique [32,33,34], but their similarly small uncertainties will be systematically affected by imprecisely known distances.
measurements can also be deduced from periodic flux oscillations stemming from thermonuclear bursts on the surfaces of neutron stars, which introduce temperature inhomogeneities [35]. The amplitude of the bursts, their deviation from sinusoids, and their dependence on X-ray energy, are sensitive to gravitational light-bending and can be used to probe space. Recently, the Neutron Star Interior Composition and ExploreR (NICER) was attached to the International Space Station with a primary mission to measure neutron star masses and radii to 5% accuracy through phase-resolved spectroscopy [7]. Although the redshift will be the best-determined quantity, oscillation amplitudes vary with X-ray energies in a way that probes a function of M and R orthogonal to redshift. The two pulsars under primary initial consideration are PSR J0437-4715, whose mass () is already known from pulsar timing, and PSR J0030+0451.
A mid-2020s Chinese-European Enhanced X-ray Timing and Polarimetry (eXTP) space telescope [9] is also planned. This mission will contribute to spin measurements, burst spectra and properties of accretion flows onto neutron stars. The effective surface area will be approximately five times larger than NICER with significantly lower background. A variety of pulsars, including those with known masses in a wide range from to , can be studied.
7. Neutron Star Moments of Inertia, Binding Energies, and Deformabilities
The discovery of the system PSR J0737-3039 containing two pulsars will allow the measurement of the moment of inertia I of the more massive pulsar [36] through the additional periastron advance induced by spin-orbit coupling. A measurement of I accurate to about 10% is ultimately expected. Since , and M is known to better than 0.1%, a tight constraint on the radius should follow. Piecewise polytropes, with constraints of causality and , yield [37]:
with signs indicating upper (lower) bounds, as displayed in the left panel of Figure 5.
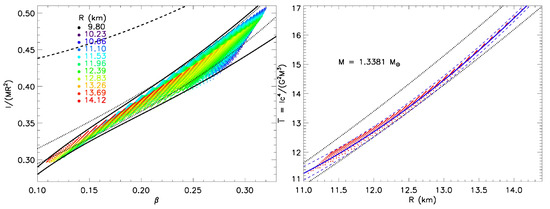
Figure 5.
Moments of inertia computed from piecewise polytropes. Left: Points show values of as a function of compactness assuming and 8.4 MeV fm MeV fm. The solid curves show bounds from Equation (16). The dashed curve is the causal upper limit [37], and colors indicate radius values. Right: The dimensionless moment of inertia as a function of radius R for . The dashed curves show the bounds from Equation (17) and the dotted curves show the bounds from Equation (16).
For the particular case of PSR J0737-3039A, with , the bounds on from a measurement of become tighter (right panel of Figure 5). Ref. [37] finds a fit of the dimensionless , including these bounds, to be
The binding energy is another structural quantity that either can be measured or is important in analyzing astrophysical observations. Indeed, the first multi-messenger event was SN 1987A, not GW170817, in which about 20 neutrinos in a 10 s burst were observed in the Kamiokande and IMB detectors from a gravitational-collapse supernova in the Large Magellanic Cloud on 23 February 1987.5 The next galactic supernova will likely result in the detection of tens of thousands of neutrinos lasting for many tens of seconds. The most straightforward observable is the total radiated neutrino energy, all of which originates from the gravitational binding energy BE of the newly-formed neutron star, about erg. Just as for the moment of inertia, relatively EOS-independent bounds for BE can be found from piecewise polytropes [37]
valid for as shown in Figure 6.
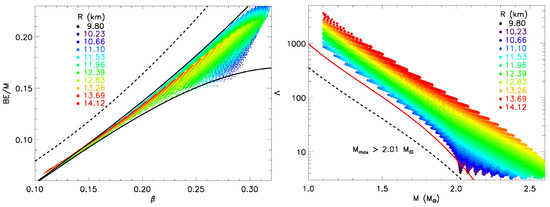
Figure 6.
Neutron star properties from piecewise polytropes. Colors indicate radius values. (Left) Binding energy per unit mass BE as a function of compactness . Solid curves denote the bounds in Equation (18) and the dashed curve shows the causal maximum [37]; (Right) Dimensionless deformability as a function of M. Dashed lines show the causal minimum assuming [38], and the solid line shows the minimum permitted by the unitary gas constraint [38].
It is useful to generate bounds on binding energy formulated entirely in terms of M, even if its uncertainties are larger than that of Equation (18) due to relatively small radius variations. Utilizing piecewise polytropes, Ref. [37] found the bounds
The gravitational wave signal from binary neutron star mergers differs from that of black holes because of finite-size effects, revealed primarily through tidal deformabilities. These are described by the tidal Love number [39,40,41], the proportionality constant between an external tidal field and the quadrupole deformation of a star. It is found by solving an additional first-order differential equation [42] simultaneously integrated with Equation (2), and has values ranging between 0.05 and 0.15 for neutron stars. For black holes, . It is more useful to define a dimensionless deformability by
where is the compactness parameter. is highly correlated with both M and R (right panel of Figure 6), showing, as for moments of inertia and binding energies, a quasi-universal behavior that is insensitive to the EOS. The piecewise polytrope results show that not only does for a configuration decrease with a high power of the mass, but, for a given mass, it also increases with the same high power of the radius. The results of Ref. [42] suggested for , or that is roughly proportional to , so, from the definition of , Equation (20), it is to be expected that . Although this relation breaks down for both small and large masses, or , for the expected mass ranges expected in compact mergers, Ref. [38] found
with the bounds .
8. Applications to and Constraints from GW170817
The marvelous multi-messenger observation of the binary neutron star merger GW170817 provided unprecedented information on neutron star properties that can tightly constrain viable EOSs. First, the gravitational wave data alone set limits on the total mass of the inspiralling stars and their radii. Second, this information, coupled with the detections of a gamma-ray burst 1.7 s after the merger, an optical/infrared afterglow thought to be due to significant mass ejection of very neutron-rich matter resulting in the synthesis of high-opacity heavy elements (the r-process), and radio jets at later times, allows an upper limit to to be estimated [43].
8.1. Inferences from Gravitational Waves
First, we consider what is learned from the gravitational wave data. Tidal deformation results in excess dissipation of orbital energy, speeding up the final stages of the inspiral. Both neutron stars are deformed, and the change in the waveform phase due to tides, to lowest order, is [40]
where is the binary mass ratio, is the so-called chirp mass, and is the time-dependent gravitational wave frequency, which is twice the orbital frequency. is a particular combination of the two stars’ deformabilities:
where and refer to the two stars. GW170817 provided the accurate measurement [44] . With the additional GW170817 constraint , this implies that .
The behavior of as a function of is very similar to that of as a function of M and is shown in Figure 7. This figure shows that decreases with a large power of , approximately 5 to 6, and that EOSs with larger radii, as parameterized by , generally have larger values of for a given value. There is only a weak dependence on q. For the case of GW170817, , it is found that [38]
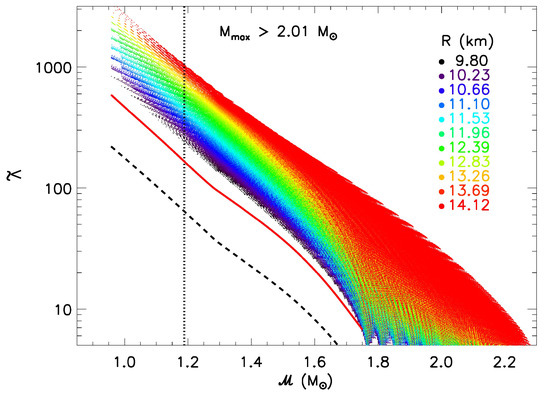
Figure 7.
The binary deformability as a function of chirp mass from piecewise polytropes subject to causality and a . Vertical dotted lines indicate for GW170817, colors indicate values of and component masses are restricted such that they exceed . The dashed line shows the causal minimum and the solid line shows the minimum from the unitary gas constraint [38].
Thus, a precision measurement of coupled with even a poor estimate of has the potential of constraining the neutron star radius rather well.
is a reference radius. A notable result from piecewise polytropes is that stellar radii do not vary appreciably, for a given EOS, in the mass range (the average variation is about 1% [38]). With the approximation , one obtains
which is remarkably insensitive to q. For example, when or , and . Although Equation (26) is based on a number of assumptions, it is substantially the same as Equation (24). It predicts, using and , the constant to be , which has the same mean value although nearly double the uncertainty.
The piecewise polytrope result is important because it now follows that
where , which is useful in the analysis of gravitational wave data in which very broad priors of and are normally assumed. Zhao and Lattimer [38] used piecewise polytropes, without the assumption that , to find, in the case that and that bounds the results. Furthermore, the range of rapidly decreases with ; for , (of course, for ). In comparison, if no correlation is assumed, is virtually unconstrained. The use of Equation (27) effectively reduces the dimensionality of a Markov Chain Monte Carlo gravitational-wave analysis by 1, with a substantial increase in computational speed.
The gravitational waves from the recently observed merger of two neutron stars, GW170817, were initially analyzed by the LVC collaboration [44]. The signal was fitted to the Taylor F2 post-Newtonian aligned-spin model [45,46,47,48,49,50] which has 13 parameters. Seven of those parameters are extrinsic, including the sky location, the source’s distance, polarization angle and inclination, and the coalescence phase and time. The remaining six parameters are intrinsic, including the masses and , dimensionless tidal deformabilities and , and the component’s aligned spins and .
The most accurate result is the measurement of . If spin and deformation effects are small, to lowest order in a post-Newtonian expansion, the orbital behavior only depends on the frequency dependence of the inspiral waveform such that
Here, is the time derivative of the frequency . The GW170817 analysis by the LVC consortium [44] found a relatively precise measurement .6 However, only a vague restriction of the mass ratio, 0.65, is obtained since this parameter only weakly affects waveform models. Incidentally, the additional measurement of the wave amplitude h(t) allows an estimate of the source distance
LVC also determined, to 90% confidence, that , but established no lower bound.7
The initial LVC analysis employed conservative assumptions and did not utilize information obtained from electromagnetic observations (which constrain the source location and distance). Furthermore, correlations between and were not considered. This is tantamount to the assumption that the two stars did not necessarily have the same EOS. However, only under somewhat contrived circumstances is it likely that the EOSs describing the two stars would differ appreciably. For example, one star could be a black hole, which, however, the measured chirp mass makes exceedingly unlikely as there is no known formation mechanism to produce a stellar black hole of less mass than , or one star could be a hybrid star and the other a conventional star [51]. This would generally require the transition mass to be in between the masses of the two stars; otherwise, both would be hybrid or both would be conventional, and both would have correlated s according to . For a close q, this would be especially unlikely. However, even if only one star is a hybrid star, the EOS of the hybrid star below the hybrid transition density would still be identical to that of the hadronic star, and its EOS at higher densities has to be constrained to satisfy the maximum mass constraint. The masses and deformabilities of the two stars would still retain significant correlations. Another possibility is that the stars occupied separate branches in the diagram because one branch (the hadronic branch) is metastable above the phase transition density. Then, the hybrid branch does not have to satisfy the constraint. However, this would require that, for some reason, the lower mass star would be the one to have transitioned to the quark branch while the more massive star did not, opposite to conventional wisdom. More discussion of twin stars, and earlier references, can be found in Refs. [52,53].
By utilizing the additional information described above, De et al. [54] were able to improve the GW170817 analysis, resulting in tighter constraints on and (including the discovery of a lower bound to ). Three parameters were eliminated by using the electromagnetic source’s distance and two-dimensional sky position. Additionally, the prior ranges chosen for the spin parameters and were taken to be smaller than in the LVC analysis, as motivated by observed double neutron star systems. Finally, Ref. [54] correlated the tidal deformabilites using Equation (27).
As seen in Figure 8, the 80% uncertainty region for , is considerably improved compared to found by Ref. [44].8 Later, LVC reanalyzed GW170817 with the EOS correlations as suggested by Ref. [54], together with improved waveform models, and concluded the 90% confidence interval was reduced to . This compares to for Ref. [54].
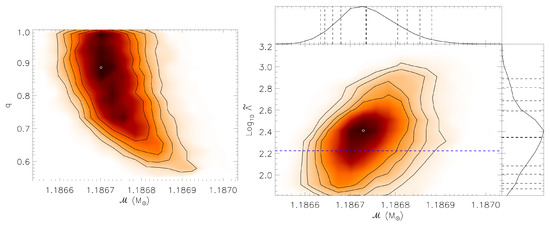
Figure 8.
Neutron star parameters inferred for GW170817 [54], assuming that . Contours refer to 68%, 80%, 90% and 95% confidence levels. Left panel: The binary chirp mass and mass ratio q. Right panel: and the binary deformability . The blue dashed line shows the predicted minimum value from the unitary gas constraint [37]. Attached side panels show the integrated probability distributions over or ; dashed lines show where integrated probabilities reach 2.5%, 5%, 10%, 16%, 50%, 84%, 90%, 95% and 97.5%, respectively.
Figure 8 shows the important result that about 36.2% of the posteriors violate the unitary gas conjecture. It is noteworthy that the EOS correlations introduced by Ref. [55] were determined from EOSs that implicitly satisfy the unitary gas conjecture. If the analysis of Ref. [54] were to also include the unitary gas conjecture, the new 90% confidence interval would change to , putting the two results into clearer agreement.
The uncertainties in and q are correlated. Asymmetric mass ratios are predicted to advance the waveform phase , while a finite deformability retards the phase (Equation (22) and Figure 8). In addition, positive spins are predicted to advance the waveform phase, so fits to the waveform suffer from a triple degeneracy. Fortunately, it is apparent from Equation (23) that itself is relatively insensitive to q, so that is a good proxy for the radii. Assuming and inverting Equation (24), one finds
For GW170817, one finds km. For the initial LVC result, , one finds km. Because the EOS uncertainties in Equation (30) are represented as absolute bounds, we can use the upper limit without introducing additional uncertainty. The correlated-EOS LVC 90% upper bound from Ref. [55] is km, while the De et al. [54] result is km. The implications for the masses and radii for the two neutron stars in GW170817 are summarized in Figure 9. The left (right) panel of this figure shows the inferred deformabilites (radii) of the stars as a function their masses.
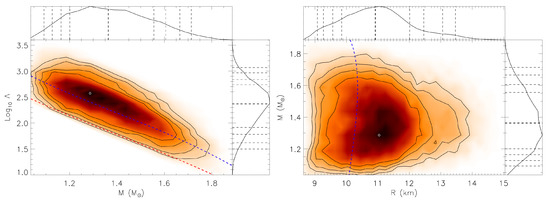
Figure 9.
Similar to Figure 8 but for (left panel) and (right panel, using Equation (21) to estimate radii from M and .). Attached side panels show the integrated probability distributions over or R. The red (blue) dashed curves show bounds from causality (the unitary gas conjecture) [37]. The regions with refer to the more (less) massive star.
8.2. Inferences from Multi-Messenger Observations
The remnant formed in the immediate aftermath of the GW170817 merger is believed to have been differentially rotating and containing sufficient angular momentum to be near its mass-shedding limit. Such an object can be hydrodynamically unstable, metastable, or absolutely stable against gravitational collapse depending on its mass and the EOS. The maximum mass thought to be supportable by differential rotation is about 1.5Mmax, while uniform rotation can support less, a maximum of MUR = ξMmax, where Mmax is the maximum mass of a non-rotating neutron star and ξ ~ 1.2 [56]. Because of binding energies, which depend on both Mand the EOS (Equations (18) or (19)), we consider the baryon mass MB as opposed to the gravitational mass M for this discussion. We then define MB,UR/MB,max = ξb. It has been found that the factors ξ and ξb depend relatively weakly on the EOS [57]. The aftermath of the merger depends mostly on the relative values of the total inspiralling baryon mass MBT = MB1 + MB2, compared to MB,DR and MB,UR, modulo the ejected mass.
If , a prompt collapse to a black hole results, with almost no likelihood for the formation of a gamma-ray burst, mass ejection or radio jets. If , on the other hand, the remnant will be indefinitely stable, as the loss of angular momentum from a uniformly-rotating star is thought to occur on much long timescales. Although a gamma-ray burst, radio jets and ejected mass are all likely in this case, the ejected mass may be “poisoned” by neutrinos emitted from the remnant over long timescales which convert neutrons to protons, rendering synthesis of very heavy elements problematical. The afterglow in this case would tend to be due to “blue” radiation flowing from low-atomic weight, low-opacity material, as opposed to “red” radiation flowing from high-opacity matter consisting of very heavy elements, which is what was observed. In addition, a long-lived remnant will emit vast amounts of dipole radiation from spin-down and magnetic fields, which would enhance the lumninosity radiated by the ejecta. This was apparently not seen in the afterglow from GW170817. We thus infer [43], again, modulo the ejected mass. It is convenient to use Equation (18) for the binding energy since it depends only on M. This situation now allows the estimation of an upper limit for by comparing the inspiralling baryon mass
with the maximum baryon mass that can be supported by uniform rotation
Taking account the total ejected baryon mass 0.05M⊙, we have a cubic equation for Mmax
We use a lower bound for and use the lower bounds on the coefficients from Equation (19) in Equations (31) and (32) to preserve the inequality. With the additional lower bound inferred from relativistic calculations [56,57] of uniformly maximally-rotating stars using causal EOSs that satisfy , we obtain, approximately, . The dependence on q is weak, and for (Figure 8), . However, note that the most likely value of q is unity, for which . This upper limit to can be used to further restrict the dense matter EOS and to further refine the numerous correlations described in this article.
9. Conclusions
The constraints on masses and radii from theory and observations have been reviewed. Inferences from X-ray observations imply radii in substantial agreement with theoretical inferences from neutron matter theory and from nuclear experiments, but suffer from systematic effects that preclude firm constraints on dense matter. The spectacular observation of GW170817, on the other hand, while also producing radius constraints in line with previous results, has different and seemingly smaller systematic uncertainties. Furthermore, additional observations of neutron star mergers offer the possibility to dramatically enhance these constraints as well as set unprecedented bounds on the neutron star maximum mass.
Funding
This research is supported in part by the U.S. Department of Energy Grant DE-FG01-87ER40317 and the NASA Grant 80NSSC17K0554.
Acknowledgments
I would like to acknowledge discussions with Tianqi Zhao and Soumi De, who contributed theoretical insight, calculations and data used in this contribution.
Conflicts of Interest
The author declares no conflict of interest. The funders had no role in the design of the study; in the collection, analyses, or interpretation of data; in the writing of the manuscript, or in the decision to publish the results.
References
- Lattimer, J.M.; Lim, Y. Constraining the Symmetry Parameters of the Nuclear Interaction. Astrophys. J. 2013, 771, 51. [Google Scholar] [CrossRef]
- Drischler, C.; Hebeler, K.; Schwenk, A. Asymmetric nuclear matter based on chiral two- and three-nucleon interactions. Phys. Rev. C 2016, 93, 054314. [Google Scholar] [CrossRef]
- Lattimer, J.M.; Prakash, M. Neutron Star Structure and the Equation of State. Astrophys. J. 2001, 550, 426–442. [Google Scholar] [CrossRef]
- Lattimer, J.M.; Prakash, M. The Equation of State of Hot, Dense Matter and Neutron Stars. Phys. Rept. 2016, 621, 127–164. [Google Scholar] [CrossRef]
- Watts, A.; Xu, R.; Espinoza, C.; Andersson, N.; Antoniadis, J.; Antonopoulou, D.; Buchner, S.; Dai, S.; Demorest, P.; Freire, P.; et al. Probing the neutron star interior and the Equation of State of cold dense matter with the SKA. Advancing Astrophysics with the Square Kilometre Array (AASKA14). arXiv 2015, arXiv:astro-ph.SR/1501.00042. [Google Scholar]
- Smits, R.; Lorimer, D.R.; Kramer, M.; Manchester, R.; Stappers, B.; Jin, C.J.; Nan, R.D.; Li, D. Pulsar science with the Five hundred metre Aperture Spherical Telescope. Astron. Astrophys. 2009, 505, 919–926. [Google Scholar] [CrossRef]
- Gendreau, K.C.; Arzoumanian, Z.; Adkins, P.W.; Albert, C.L.; Anders, J.F.; Aylward, A.T.; Baker, C.L.; Balsamo, E.R.; Bamford, W.A.; Benegalrao, S.S.; et al. The Neutron star Interior Composition Explorer (NICER): Design and development. In Space Telescopes and Instrumentation: Ultraviolet to Gamma Ray; International Society for Optics and Photonics: Bellingham, WA, USA, 2016; Volume 9905, p. 99051H. [Google Scholar]
- Motch, C.; Wilms, J.; Barret, D.; Becker, W.; Bogdanov, S.; Boirin, L.; Corbel, S.; Cackett, E.; Campana, S.; de Martino, D.; et al. The Hot and Energetic Universe: End points of stellar evolution. arXiv 2013, arXiv:astro-ph.HE/1306.2334. [Google Scholar]
- Watts, A.L.; Yu, W.; Poutanen, J.; Zhang, S.; Bhattacharyya, S.; Bogdanov, S.; Ji, L.; Patruno, A.; Riley, T.E.; Bakala, P.; et al. Dense matter with eXTP. Sci. China Phys. Mech. As. 2019, 62, 29503. [Google Scholar] [CrossRef]
- Koranda, S.; Stergioulas, N.; Friedman, J.L. Upper Limits Set by Causality on the Rotation and Mass of Uniformly Rotating Relativistic Stars. Astrophys. J. 1997, 488, 799–806. [Google Scholar] [CrossRef]
- Lattimer, J.M.; Prakash, M. What a Two Solar Mass Neutron Star Really Means. In From Nuclei to Stars; Lee, S., Ed.; World Scientific: Singapore, 2011; p. 275. [Google Scholar]
- Antoniadis, J.; Freire, P.C.; Wex, N.; Tauris, T.M.; Lynch, R.S.; van Kerkwijk, M.H.; Kramer, M.; Bassa, C.; Dhillon, V.S.; Driebe, T.; et al. A Massive Pulsar in a Compact Relativistic Binary. Science 2013, 340, 1233232. [Google Scholar] [CrossRef]
- Cromartie, H.T.; Fonseca, E.; Ransom, S.M.; Demorest, P.B.; Arzoumanian, Z.; Blumer, H.; Brook, P.R.; DeCesar, M.E.; Dolch, T.; Ellis, J.A.; et al. A very massive neutron star: Relativistic Shapiro delay measurements of PSRJ0740+6620. arXiv 2019, arXiv:astro-ph.SR/1904.06759. [Google Scholar]
- Lattimer, J.M. The Nuclear Equation of State and Neutron Star Masses. Ann. Rev. Nuc. Part. Sci. 2012, 62, 485–515. [Google Scholar] [CrossRef]
- Tews, I.; Lattimer, J.M.; Ohnishi, A.; Kolomeitsev, E.E. Symmetry Parameter Constraints from a Lower Bound on Neutron-matter Energy. Astrophys. J. 2017, 848, 105. [Google Scholar] [CrossRef]
- Haensel, P.; Zdunik, J.L.; Bejger, M.; Lattimer, J.M. Keplerian frequency of uniformly rotating neutron stars and strange stars. Astron. Astrophys. 2009, 502, 605–610. [Google Scholar] [CrossRef]
- Hessels, J.W.T.; Ransom, S.M.; Stairs, I.H.; Freire, P.C.C.; Kaspi, V.M.; Camilo, F. A Radio Pulsar Spinning at 716 Hz. Science 2006, 311, 1901–1904. [Google Scholar] [CrossRef] [PubMed]
- Özel, F.; Freire, P. Masses, Radii, and the Equation of State of Neutron Stars. Ann. Rev. Astron. Astrophys. 2016, 54, 401–440. [Google Scholar] [CrossRef]
- Wellenhofer, C.; Holt, J.W.; Kaiser, N. Divergence of the isospin-asymmetry expansion of the nuclear equation of state in many-body perturbation theory. Phys. Rev. C 2016, 93, 055802. [Google Scholar] [CrossRef]
- Zwierlein, M.W. Superfluidity in ultracold atomic Fermi gases. In Novel Superfluids; Bennemann, K.-H., Ketterson, J.B., Eds.; Oxford University Press: Oxford, UK, 2015; Volume 2, Chapter 18. [Google Scholar]
- Read, J.S.; Lackey, B.D.; Owen, B.J.; Friedman, J.L. Constraints on a phenomenologically parametrized neutron-star equation of state. Phys. Rev. D 2009, 79, 124032. [Google Scholar] [CrossRef]
- Douchin, F.; Haensel, P. A unified equation of state of dense matter and neutron star structure. Astron. Astrophys. 2001, 380, 151–167. [Google Scholar] [CrossRef]
- Walter, F.M.; Eisenbeiß, T.; Lattimer, J.M.; Kim, B.; Hambaryan, V.; Neuhäuser, R. Revisiting the Parallax of the Isolated Neutron Star RX J185635-3754 Using HST/ACS Imaging. Astrophys. J. 2010, 724, 669–677. [Google Scholar] [CrossRef]
- Ho, W.; Kaplan, D.L.; Chang, P.; Adelsberg, M.V.; Potekhin, A.Y. Magnetic hydrogen atmosphere models and the neutron star RX J1856.5-3754. Mon. Not. R. Astron. Soc. 2007, 375, 821–830. [Google Scholar] [CrossRef]
- Guillot, S.; Rutledge, R.E. Rejecting proposed dense-matter equations of state with quiescent low-mass X-ray binaries. Astrophys. J. 2014, 796, L3. [Google Scholar] [CrossRef]
- Bogdanov, S.; Heinke, C.O.; Özel, F.; Güver, T. Neutron Star Mass-Radius Constraints of the Quiescent Low-mass X-Ray Binaries X7 and X5 in the Globular Cluster 47 Tuc. Astrophys. J. 2016, 831, 184. [Google Scholar] [CrossRef]
- Dickey, J.M.; Lockman, F.J. H I in the Galaxy. Ann. Rev. Astron. Astrophys. 1990, 28, 215. [Google Scholar] [CrossRef]
- Harris, W.E. A Catalog of Parameters for Globular Clusters in the Milky Way. Astron. J. 1996, 112, 1487. [Google Scholar] [CrossRef]
- Lattimer, J.M.; Steiner, A.W. Neutron Star Masses and Radii from Quiescent Low-Mass X-ray Binaries. Astrophys. J. 2014, 784, 123. [Google Scholar] [CrossRef]
- Steiner, A.W.; Lattimer, J.M.; Brown, E.F. The Equation of State from Observed Masses and Radii of Neutron Stars. Astrophys. J. 2010, 722, 33–54. [Google Scholar] [CrossRef]
- Suleimanov, V.; Poutanen, J.; Revnivtsev, M.; Werner, K. A Neutron Star Stiff Equation of State Derived from Cooling Phases of the X-Ray Burster 4U 1724-307. Astrophys. J. 2011, 742, 122. [Google Scholar] [CrossRef]
- Nättilä, J.; Steiner, A.W.; Kajava, J.J.E.; Suleimanov, V.F.; Poutanen, J. Equation of state constraints for the cold dense matter inside neutron stars using the cooling tail method. Astron. Astrophys. 2016, 591, A25. [Google Scholar] [CrossRef]
- Suleimanov, V.F.; Poutanen, J.; Nättilä, J.; Kajava, J.J.E.; Revnivtsev, M.G.; Werner, K. The direct cooling tail method for X-ray burst analysis to constrain neutron star masses and radii. Mon. Not. R. Astron. Soc. 2017, 466, 906–913. [Google Scholar] [CrossRef]
- Nättilä, J.; Miller, M.C.; Steiner, A.W.; Kajava, J.J.E.; Suleimanov, V.F.; Poutanen, J. Neutron star mass and radius measurements from atmospheric model fits to X-ray burst cooling tail spectra. Astron. Astrophys. 2017, 608, A31. [Google Scholar] [CrossRef]
- Watts, A.L. Thermonuclear Burst Oscillations. Ann. Rev. Astron. Astrophys. 2012, 50, 609–640. [Google Scholar] [CrossRef]
- Lattimer, J.M.; Schutz, B.F. Constraining the Equation of State with Moment of Inertia Measurements. Astrophys. J. 2005, 629, 979–984. [Google Scholar] [CrossRef]
- Lattimer, J.M. Neutron Star Masses And Radii. In Proceedings of the 2019 Xiamen CUSTIPEN Workshop, Xiamen, China, 3–7 January 2019. [Google Scholar]
- Zhao, T.; Lattimer, J.M. Tidal deformabilities and neutron star mergers. Phys. Rev. D 2018, 98, 063020. [Google Scholar] [CrossRef]
- Damour, T.; Nagar, A. Effective one body description of tidal effects in inspiralling compact binaries. Phys. Rev. D 2010, 81, 084016. [Google Scholar] [CrossRef]
- Flanagan, E.E.; Hinderer, T. Constraining neutron star tidal Love numbers with gravitational wave detectors. Phys. Rev. D 2008, 77, 021502. [Google Scholar] [CrossRef]
- Hinderer, T. Tidal Love numbers of neutron stars. Astrophys. J. 2008, 677, 1216–1220. [Google Scholar] [CrossRef]
- Postnikov, S.; Prakash, M.; Lattimer, J.M. Tidal Love numbers of neutron and self-bound quark stars. Phys. Rev. D 2010, 82, 024016. [Google Scholar] [CrossRef]
- Margalit, B.; Metzger, B.D. Constraining the Maximum Mass of Neutron Stars from Multi-messenger Observations of GW170817. Astrophys. J. Lett. 2017, 850, L19. [Google Scholar] [CrossRef]
- Abbott, B.P.; Abbott, R.; Abbott, T.D.; Acernese, F.; Ackley, K.; Adams, C.; Adams, T.; Addesso, P.; Adhikari, R.X.; Adya, V.B.; et al. GW170817: Observation of Gravitational Waves from a Binary Neutron Star Inspiral. Phys. Rev. Lett. 2017, 119, 161101. [Google Scholar] [CrossRef]
- Sathyaprakash, B.S.; Dhurandhar, S.V. Choice of filters for the detection of gravitational waves from coalescing binaries. Phys. Rev. D 1991, 44, 3819–3834. [Google Scholar] [CrossRef]
- Buonanno, A.; Iyer, B.R.; Ochsner, E.; Pan, Y.; Sathyaprakash, B.S. Comparison of post-Newtonian templates for compact binary inspiral signals in gravitational-wave detectors. Phys. Rev. D 2009, 80, 084043. [Google Scholar] [CrossRef]
- Arun, K.G.; Buonanno, A.; Faye, G.; Ochsner, E. Higher-order spin effects in the amplitude and phase of gravitational waveforms emitted by inspiraling compact binaries: Ready-to-use gravitational waveforms. Phys. Rev. D 2009, 79, 104023. [Google Scholar] [CrossRef]
- Mikoczi, B.; Vasuth, M.; Gergely, L.A. Self-interaction spin effects in inspiralling compact binaries. Phys. Rev. D 2005, 71, 124043. [Google Scholar] [CrossRef]
- Bohe, A.; Marsat, S.; Blanchet, L. Next-to-next-to-leading order spin–orbit effects in the gravitational wave flux and orbital phasing of compact binaries. Class. Quant. Grav. 2013, 30, 135009. [Google Scholar] [CrossRef]
- Vines, J.; Flanagan, E.E.; Hinderer, T. Post-1-Newtonian tidal effects in the gravitational waveform from binary inspirals. Phys. Rev. D 2011, 83, 084051. [Google Scholar] [CrossRef]
- Schertler, K.; Greiner, C.; Schaffner-Bielich, J.; Thoma, M.H. Quark phases in neutron stars and a third family of compact stars as signature for phase transitions. Nucl. Phys. A 2000, 677, 463–490. [Google Scholar] [CrossRef]
- Alvarez-Castillo, D.E.; Blaschke, D.B. High-mass twin stars with a multipolytrope equation of state. Phys. Rev. C 2017, 96, 045809. [Google Scholar] [CrossRef]
- Alford, M.; Sedrakian, A. Compact Stars with Sequential QCD Phase Transitions. Phys. Rev. Lett. 2017, 119, 161104. [Google Scholar] [CrossRef]
- De, S.; Finstad, D.; Lattimer, J.M.; Brown, D.A.; Berger, E.; Biwer, C.M. Tidal Deformabilities and Radii of Neutron Stars from the Observation of GW170817. Phys. Rev. Lett. 2018, 121, 091102. [Google Scholar] [CrossRef] [PubMed]
- Abbott, B.P.; Abbott, R.; Abbott, T.D.; Acernese, F.; Ackley, K.; Adams, C.; Adams, T.; Addesso, P.; Adhikari, R.X.; Adya, V.B.; et al. GW170817: Measurements of Neutron Star Radii and Equation of State. Phys. Rev. Lett. 2018, 121, 161101. [Google Scholar] [CrossRef] [PubMed]
- Cook, G.B.; Shapiro, S.L.; Teukolsky, S.A. Rapidly rotating neutron stars in general relativity: Realistic equations of state. Astrophys. J. 1994, 424, 823–845. [Google Scholar] [CrossRef]
- Cho, C.; Swesty, F.D.; Lattimer, J.M. Maximum Masses For Keplerian Rotation with Causal and Pulsar Mass Constraints. 2019; in preparation. [Google Scholar]
| 1. | This formula is accurate to a few percent, despite the fact that the equatorial radius increases by about 50% for a maximally-rotating object. |
| 2. | These formula were updated by Ref. [1] to comply with the 2M⊙ constraint. |
| 3. | It has been verified that the use of realistic alternate crust EOSs and boundaries has negligible effects on our conclusions. |
| 4. | This increase was made so as to make the priors for p1 uninformative when studying GW170817. |
| 5. | In addition, the first multi-messenger observation was Ray Davis’ observation of solar neutrinos from Homestake Mine, South Dakota, in the 1970s. |
| 6. | This value takes into account cosmological redshift corrections. |
| 7. | This result actually corresponds to the upper 80% confidence bound, as it was defined to be the level above which 10% of the probability remains. |
| 8. | Ref. [44] used the notation “90% upper bound”, above which 10% of the posteriors lay, to refer to the equivalent upper 80% bound shown in Figure 8 since 10% of the posteriors lie above it and 10% lie below the lower 80% bound. |
© 2019 by the author. Licensee MDPI, Basel, Switzerland. This article is an open access article distributed under the terms and conditions of the Creative Commons Attribution (CC BY) license (http://creativecommons.org/licenses/by/4.0/).