Abstract
The sudden increase of fluxes of quasi-trapped energetic electrons under the Earth’s radiation belt (ERB) has remained a puzzling phenomenon for decades. It is known as enhancements of forbidden energetic electrons (FEEs). The FEE enhancements are occasionally observed by low-Earth orbit NOAA/POES satellites. Previously, no strong correlation was established between FEEs and geomagnetic activity, while external control of FEE occurrence by solar activity and interplanetary parameters was revealed on a long time-scale. Two important questions are still open: (1) key parameters of the mechanism and (2) solar wind drivers or triggers. In the present study we conducted detailed analysis of three FEE events that occurred during the greatest geomagnetic storms, which dramatically affected space weather. The FEE enhancements occurred under northward IMF and, thus, Bz and convection electric fields could have been neither driver nor trigger. We found that an abrupt and significant change in solar wind pressure is a key solar wind driver of the FEE enhancements observed. The characteristic time of FEE injection from the inner edge of the ERB at L-shell 1.2 to the forbidden zone at L < 1.1 was estimated to be 10–20 min. In the mechanism of ExB drift, this characteristic time corresponds to the radial inward transport of electrons caused by a transient electric field with the magnitude ~10 mV/m.
1. Introduction
Measurements of energetic particle fluxes at low altitudes by low-orbit satellites afford the opportunity to study not only precipitating populations of the Earth’s radiation belt (ERB), but also fluxes below ERB, in the quasi-trapped region or so-called forbidden zone located from the equator to low latitudes. The region of low-drift shells L < 1.2 attracted much attention when it was found that sudden increases in the flux of quasi-trapped energetic electrons with energies from tens to hundreds of keV occur quite frequently and require an explanation [1,2,3]. Using long-term monitoring of energetic particles by the NOAA/POES satellite fleet, a large data set was collected to study this unusual phenomenon ([4] and references therein). Quasi-trapped particles constitute a group between stably trapped and precipitating populations. They should not be confused with precipitating particles, whose lifetime is half the bounce period between mirror points (seconds), and which do not participate in longitudinal drift around the Earth. The quasi-trapped particles are unstably trapped, since their lifetime does not exceed one period of azimuthal drift (hours for energies of tens to hundreds of keV at low L-shells), and, having reached the South Atlantic Anomaly (SAA), they precipitate there. For this reason, fluxes of quasi-trapped particle in the forbidden zone are low on average, and occasional enhancements quickly decay to a background level within a few hours during periods of geomagnetic quiet. On the other hand, flux enhancements that last for several days are often observed, which indicate external driving [3].
Currently, the catalog of the >30 keV quasi-trapped electron flux enhancements in the forbidden zone, called forbidden energetic electrons (FEEs), contains more than 700 daily global maps of the flux intensity distribution from 1998 to present and is continuously updated [5]. Statistical studies based on the catalogue [4,6] revealed close relationships between the frequency of >30 keV FEE occurrence and the solar and interplanetary parameters on a long time scale (years), and with the dipole tilt angle on a medium time scale (months). Studies of a relation between FEEs and geomagnetic activity [3,7] concluded that neither the intensity of the storm-time ring current nor the substorm auroral electrojet have a significant effect on the occurrence of FEEs. Moreover, periods of calm are not an exception for FEE increases. A comprehensive analysis of the most prominent FEE case during quiet time revealed its connection with local compressions of the dayside magnetosphere, which were caused by transient foreshock-associated pressure pulses [8]. However, the question of what the specific external drivers of FEE enhancements might be remains open. The special case mentioned motivates us to take a closer look at the solar wind parameters for FEE events in our study.
Before going into to the details of the problems associated with FEEs, we should note here that the possible influence of the equatorial electrojet on the dynamics of energetic particles in the inner ERB was studied from early years, e.g., [9,10,11]. The role of the SAA area in the ionosphere–magnetosphere coupling is especially important, and we will return to this issue in the Section 4.
The next question concerns the source of electron flux enhancements at the lower L-shells. Suvorova et al. [7] found experimental evidence that the source of these electrons is the inner ERB. Moreover, studies of the inner ERB have shown that the inner belt itself is not in a stationary state, as was long believed, and energetic electron fluxes can suddenly increase not only during major geomagnetic storm [12,13] but even during weak and moderate storms [14]. Long-term particle measurements by Van Allen Probes and DEMETER also showed the occurrence of rapid increases of tens to hundreds of keV electrons in and below the inner belt [15,16,17]. The outer belt has been shown to be the source for the enhancements in the inner belt, while the plasma sheet injections were not necessarily related to this.
Flux enhancements in the radiation belts are considered to be of two types: slow and fast. A slow increase occurs over several days and is associated with diffusive radial transport. Observations showed that diffusive transport does not extend inside L = 2 [15]. By contrast, fast increase (injection) occurs over hours or even less and is associated with radial drift in crossed electric and magnetic fields (e.g., [18]). Thus, it has been established that the observed increases in the electron fluxes both in the inner belt core and below its edge, in the forbidden zone, are earthward injections [1,2,15]. According to observations obtained from Van Allen Probes in highly elliptical orbit, electron injections into the inner belt can occur within 3 h over a relatively short distance of tenths of the L-parameter, while observations from the NOAA/POES low-orbit satellites estimated FEE injections on a 1 h timescale over a distance of ~0.1 L. In the current study, we will determine this time experimentally on the basis of detailed analysis.
Since the characteristic time of FEE enhancement corresponds to the fast radial transport, an electric drift mechanism was proposed [1]. That is, FEE fluxes are enhanced by energetic electrons coming from the inner ERB across the drift shells. Note that the same mechanism was thought to explain the observations in the inner ERB mentioned above, with electrons coming from the outer belt. For the movement of particles across the drift shells, a significant electric field E is necessary, the presence of which in the region of the lower L-shells is not obvious. Specifically, according to the generally accepted concept of the electrodynamics of magnetospheric processes, the large-scale convection electric field E should be shielded from the inner magnetosphere at L < 6. That is, the inner magnetosphere shields the dawn-to-dusk convection (quasi-static) E by setting up polarization charges (i.e., dusk-to-dawn E) at the inner edge of the ring current [19]. However, numerous observations showed that some conditions for the penetration of the convection field in L < 6 may arise. The dawn–dusk electric field is shielded near Earth for low geomagnetic activity (low Kp index), while it has a local maximum at L ~ 4 during moderate activity, and strong E was observed near L ~ 3 during high geomagnetic activity [20]. On the other hand, observations have also shown that the electric field in the L = 2–6 region is very variable during moderate and strong magnetic activity occasionally exceeding 2 mV/m [21].
In this connection, a number of principle questions arise, in particular about the origin of enhanced electric field E at low L-shells: is it convective (quasi-static) or inductive (transient)? If it is an enhanced large-scale convection field, does it penetrate to L < 1.5? If it is an induction electric field generated by a time-varying magnetic field B (∂B/∂t), what are the time scales and rates of change of B at lower L-shells? Penetration electric fields have been studied with ground-based magnetometer and radar measurements. Equatorial electric fields at altitude of ~800 km, mapped along the magnetic field line over distances of only a few hundred kilometers, should approximately correspond to the ionospheric electric field at low latitudes. Studies of the dayside equatorial electrojet showed that the interplanetary electric field partially penetrates from high to lower latitudes in the ionosphere (e.g., [22] and references therein). During southward turning of Bz IMF, the solar wind/magnetospheric electric field penetrates due to enhanced convection (undershielding of the inner magnetosphere). It has been empirically found that the dayside penetration electric field (eastward/dawn–dusk direction) is about 10% of the interplanetary electric field E (e.g., [23]). During northward turning of Bz IMF, it penetrates at night due to ceasing of convection and the inner magnetospheric shielding the electric field (eastward/dusk–dawn direction) [24]. But in this case, the dayside electric field (westward direction) is only a few percent of the interplanetary electric field E [23]. In addition, a recent study showed that a response of the equatorial ionosphere to overshielding electric fields is not uniform in an altitude range from 200 to 800 km [25]. That is, with regard to the electric field, the bottomside (200 km) response can differ significantly from topside (800 km) ionosphere. Thus, there are some unexplored issues related to the adequate representation of penetration electric field distribution with respect to altitude and latitude. Recent satellite measurements of quasi-static electric fields by THEMIS and Van Allen Probes confirmed that the magnetospheric convection electric field can penetrate earthward of L = 3 and enhance up to 2 mV/m during geomagnetic storms [26,27,28]. These studies suggested that observed temporal variations of electric fields were related to the large-scale convection driven by solar wind. Nevertheless, due to shielding, the electric field below L = 2 is on average weak: less than 1 mV/m [20].
Several studies using test particles simulation [15,16,17] have examined the question of what magnitude of electric filed is required to explain the flux enhancements at lower L-shells. They are based on the assumption of penetration of large-scale electric fields into the inner magnetosphere. It is important to note that this approach may explain nighttime deep injections, although daytime injections are also observed. Su et al. [15] have demonstrated that a strong electric field is necessary to explain the energetic electron increases in the inner ERB. The authors suggested that the enhanced large-scale electric fields may penetrate deeper into the inner magnetosphere during storm periods. They concluded that the actual field magnitude is stronger than those in the existing electric field models, particularly for L ≤ 2, and it is even stronger than in the outer magnetosphere. Modeling by [16] showed that injections below the inner edge L = 1.2 during major storms in 2015 is consistent with a rapid enhancement of the convection electric field to 5 mV/m. However, modeling of another event (9 November 2004) showed that the same field was needed, but with westward direction at dayside, expected from an overshielding effect [17]. As discussed above, observation showed that the large-scale westward dayside fields are small.
Transient electric fields measured in the equatorial inner magnetosphere and ionosphere were studied with satellite experiments in several papers [20,21,29,30,31,32,33,34,35,36,37]. The amplitudes of time-varying (inductive) electric fields are quite high. Their characteristic time is about several minutes or less. Inductive electric fields are associated with temporal variations of the magnetic field and, therefore, they are related to the varying solar wind conditions. Modeling of inductive electric fields and its application to simulate the dynamics of energetic particles in the inner magnetosphere is currently under active development [38,39].
Here we present a comprehensive study of the solar wind parameters accompanying the FEE enhancements observed in the energy range from 30 to 300 keV. The cases of three great geomagnetic storms (super storms) are analyzed in detail. The method of data selection is described in Section 2. The results of analysis are presented in Section 3 and discussed in Section 4. Conclusions are offered in Section 5.
2. Methods and Data
2.1. Data
The NOAA project of the polar operational environmental satellite (POES) has been successfully operating for more than 25 years. The satellites have a polar sun-synchronous orbit. The NOAA/POES and MetOp constellation monitors radiation conditions at low altitudes (~850 km), in particular below the inner ERB. The maximum number of satellites in the constellation reached 7 in 2012, and by 2025, 5 satellites are operating in orbit. The data on particles from 2009 are available at https://www.ncei.noaa.gov/data/ (accessed on 4 July 2025). Methods of identification of FEE enhancements and selection of FEE-events are described in details in [4,6].
The energetic electrons are measured by the MEPED telescope [40], which includes electron detectors (>30, >100, and >300 keV). Since 2014, the thresholds of the integral channels have been refined in the technical documentation (>40, >130, >290 keV). In this paper, we will use the old designation. Pairs of detectors with an orthogonal orientation allow simultaneous measuring of the fluxes of quasi-trapped and precipitating particles. The FEE enhancements are observed only in the quasi-trapped electron population near and at the equator, not in the precipitating population [2]. Quasi-trapped particles are those in the drift loss cone, because such particles are inevitably lost (precipitated) in the SAA during one azimuthal drift period (hours). Whereas precipitating particles are in the bounce loss cone, their lifetime is limited to one bounce period (seconds). We have found from observations that electron precipitating fluxes do not enhance at the geomagnetic equator during the FEE-events (e.g., [7]).
In the current work, we analyze total pressure P of the solar wind and orientation of the interplanetary magnetic field (IMF). Solar wind plasma parameters (flow velocity V, proton density D, and temperature T, helium contribution) and magnetic field (strength B and components Bx, By, and Bz) are measured by the ACE or Wind monitors positioned at the first Lagrangian Point (L1). The data on interplanetary parameters are available at https://cdaweb.gsfc.nasa.gov (accessed on 4 July 2025). The total pressure P is calculated as the sum of the dynamic, thermal and magnetic pressures, where the dynamic pressure also includes the contribution of helium ions (measured or 4% of protons density) [41]:
where m is atom mass of proton, He/H is a helium–proton ratio (if not measured, then the average value of 0.04 was taken), k is Boltzmann constant, μ0 is vacuum magnetic permeability. Here P is expressed in terms of SI base units and has the unit Pascal (Pa). In the units commonly used for magnetospheric physics, the magnetic field B is in nT, T in eV, D in cm−3, and V in km/s. Then the pressure P is expressed in nPa and calculated as:
We use geomagnetic indices and ground magnetic field measurements to further correct the propagation timing of solar wind structures moving at the plasma flow velocity from L1 to the Earth. Geomagnetic activity indices and geomagnetic horizontal H or X components are measured on the ground network of magnetometers SuperMAG and INTERMAG (https://supermag.jhuapl.edu/, accessed on 4 July 2025 and https://intermagnet.org/, accessed on 4 July 2025). The direct response of the geomagnetic field to solar wind pressure changes can be detected in the variations of the H/X component. The empirical relationship between geomagnetic activity indices (Dst or its analogues) and solar wind pressure was first obtained by Burton et al. [42]. A time delay correction method based on the relation was described and used by Suvorova et al. [43] and then applied by Dmitriev et al. [44].
2.2. A Catalog of FEE Events
The data from MEPED detectors oriented to the zenith (detector-0), which measure fluxes of locally trapped (quasi-trapped) particles at low latitudes and equator, was used to compile a catalog of FEE events containing daily global maps [5]. Each (30 keV) FEE event usually contains several equatorial enhancements at different times and longitudes (see Figure 2 in [4]). Sometimes enhancements at higher energies (>100 and >300 keV) are observed simultaneously with >30 keV FEE. This information is used for detailed analysis of the FEE events. However, simultaneous increases of fluxes of electrons in higher energy channels is not always observed. Figure 1 shows two examples of the 30 min time profiles of quasi-trapped electron fluxes with energy > 30, >100, and >300 keV measured near the equator outside the SAA region. In the first example, the fluxes increased simultaneously in three energy channels, whereas in the second example, no simultaneous increase of flux of the highest energy electrons was observed. These two FEE enhancements are included in further analysis.
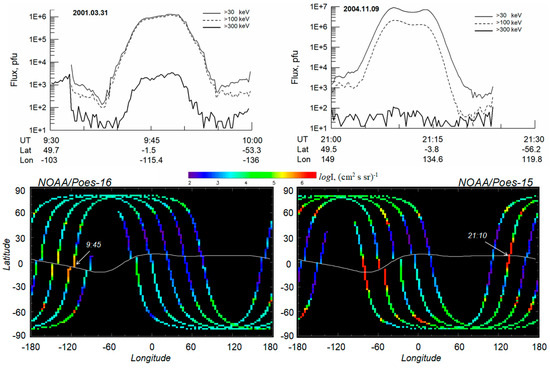
Figure 1.
(Top) Examples of 30 min time profiles of FEE enhancements in energy channels > 30–>300 keV on 31 March 2001 and 9 November 2004. Units of particle flux intensity (pfu) is particles per (cm2 s sr). (Bottom) Fluxes of >30 keV electrons measured by POES-16 at 8—16 UT on 31 March 2001 and by POES-15 at 16-24 UT on 9 November 2004 in geographic coordinates.
2.3. Case Selection Criteria for FEE and Solar Wind Coupling Analysis
The volume of the FEE catalog is estimated in thousands of the equatorial flux enhancements. In the case of daily multiple > 30 keV FEE enhancements, some of them (except the very first one) may be a consequence of the eastward drift of electrons that had previously ended up in the forbidden zone somewhere to the west. These processes can be separated by considering electrons of different energy that drift at different speeds. The drift period Td (in hours) takes into account the relativistic correction as determined by the expression [18]:
where E is the kinetic energy in keV, L is the drift shell in Earth’s radii, γ is the relativistic correction equal to (E + mc2)/mc2, m is the rest mass, and c is the speed of light. Figure 2 shows the dependence of Td on E for different L from 1.05 to 1.2. As one can see, drift periods for 30, 100 and 300 keV energies are very different at low L-shells. Therefore, the lack of simultaneous enhancements in low and high energy channels can be explained by drift motion at different velocities. Namely at L = 1.2, the 300-keV electrons drift azimuthally with the rate of 4° per minute and, thus, quickly escape from the injection region, in contrast to the 30 keV electrons. Hence, it is hard to observe the simultaneous injection of 30 keV and 300 keV electrons.
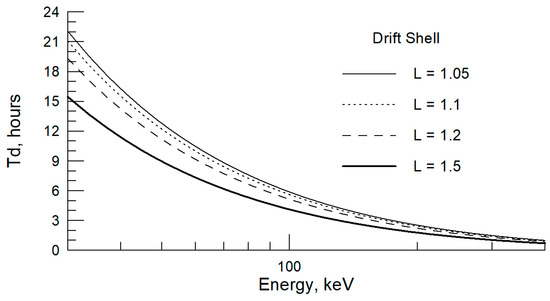
Figure 2.
Drift period Td (hr) of energetic electrons at low L-shells calculated by Equation (1).
Each event is a rather complex combination of particles and satellites moving in opposite directions in longitude. We suppose that the time of simultaneous enhancements in 30 keV and 100 keV channels may be very close to the “injection moment” and hence can be used in further analysis. If the satellite does not observe higher energy electrons, this means that these electrons have already escaped from the injection region, and the low-energy electrons continue to drift slowly and are observed by satellites. This means that the time we are interested in has passed at least an hour or more prior.
Considering the above, the first observed enhancement per day is of greatest interest. However, flux enhancements in the 30 keV FEE may last for several consecutive days. Some of them may be related directly to the injection, while others are a consequence of a slow azimuthal drift of low-energy electrons. Therefore, we considered only the first enhancement in such a long-duration event.
Thus, the observation time can be used to search for the solar wind disturbance resulting in electron flux enhancements deeply inside the magnetosphere, or rather in the topside ionosphere. We selected several “first” FEE enhancements in >30 keV and 100/300 keV from the catalog that were observed during the great geomagnetic storms with the SYM-H index reaching values of −400 to −500 nT in the 23rd and 25th solar cycles. The storms belong to the class of super storms according to criterion suggested in (e.g., [45,46,47]).
3. Results
Table 1 shows some characteristics of FEE enhancements that were selected for analysis. The data set was acquired from the POES—15,16,19 satellites, which are designated as P5, P6, P9. Enhanced flux in the >300 keV channel is marked by an asterisk (*). The characteristics include time, local time, longitude, L-shell, and flux intensity, which correspond approximately to the moment the satellite crosses the equator. The last column contains information on the solar wind (UT corresponds to the time of the ACE/Wind monitor measurements, i.e., without applying a time lag) and storm phase.

Table 1.
Characteristics of FEE fluxes.
During super storms caused by strong impact of coronal mass ejections on the Earth’s magnetosphere, solar wind plasma and IMF parameters are characterized by extreme values and change dramatically. The first response of the geomagnetic field is often a sudden storm commencement (SSC) or sudden impulse (SI), observed by low-latitude ground-based magnetic stations. SSC is associated with the arrival of an interplanetary shock wave at the magnetopause. Extreme negative values of the SYM-H index at the storm main phase indicate intensification of the ring current due to the effect of a large value of southward Bz IMF component. Following the CME-driven shock, other large-scale solar wind structures may impact the magnetosphere with a time lag that may differ slightly from the propagation time of the shock at the solar wind plasma velocity [48]. We use measurements of the geomagnetic field on the ground in order to determine the time of the disturbance impact more accurately.
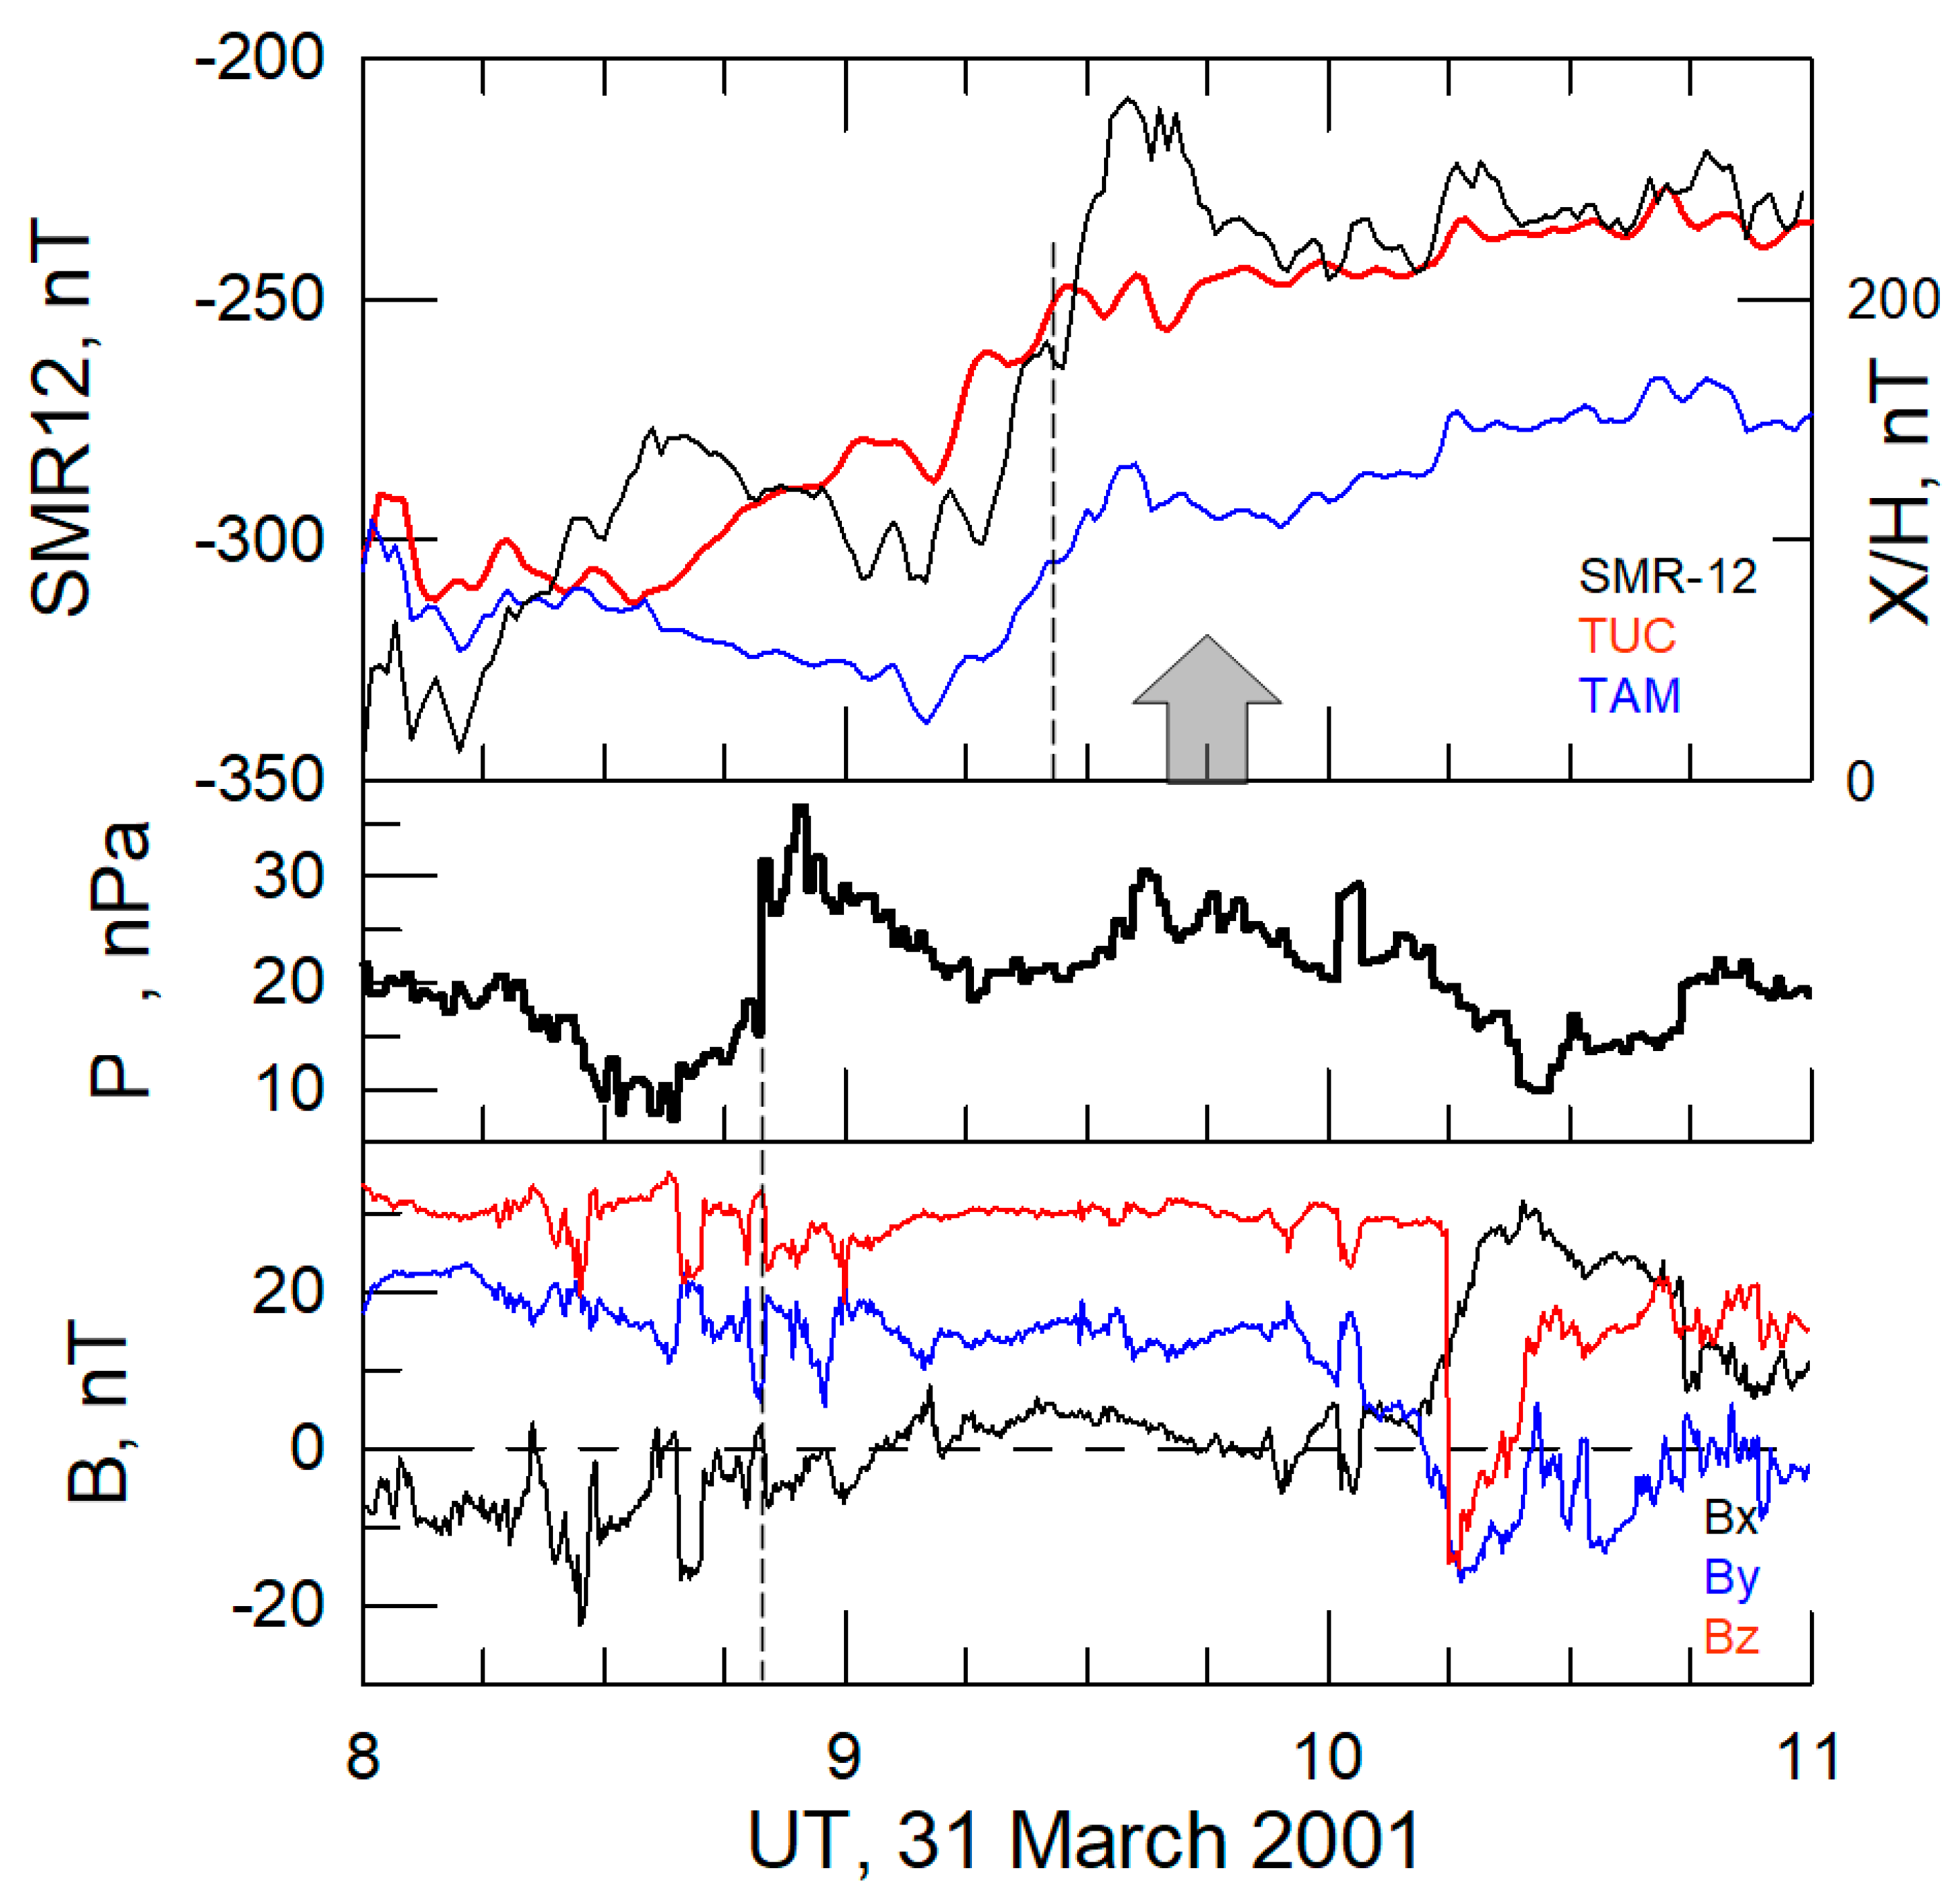
3.1. Case on 31 March 2001
The CME-driven shock accompanied by positive Bz IMF has caused a strong compression of the magnetosphere, observed at the ground as SI of amplitude ~ 100 nT at ~01:00 UT. Later, following Bz turning southward, the main phase started at ~4:20 and continued until 08 UT. At the storm maximum, the SYM-H index reached −437 nT. There was no increase in FEE flux during the entire period of 8 h, although it should be noted that there were only two satellites covering sectors 7-19 LT and 2-14 LT.
The first FEE enhancement was observed during the early recovery phase at ~09:45 UT or more precisely from 09:38 to 09:55 UT (Table 1, Figure 1). In the midnight sector, high-intensity fluxes were simultaneously observed in three energy channels: >30, >100, and >300 keV (a rare case). This means that the satellite was located exactly in the injection region.
Figure 3 shows geomagnetic and solar wind conditions during the storm recovery phase from 8 to 11 UT on 31 March 2001. The upper panel presents the partial ring current index SMR-12 from SuperMAG [49,50]. The SMR-12 index is derived based on the SYM-H index from ground-based magnetometers located within the magnetic local sector centered at noon (9 MLT to 15 MLT) and at geomagnetic latitudes between 50° S and 50° N. Measurements of horizontal component (X or H) of the geomagnetic field from two ground stations of the INTERMAGNET network at low latitudes are shown at the same panel. From 8 to 11 UT, the TAM station (22.8° N, 5.5° E) was at day (~8-11 LT) and TUC (32.2° N, 110.7° W) was at night (~0.5-3.5 LT). Lower panels present the solar wind parameters observed by the ACE upstream monitor: the total pressure P and three IMF components (Bx, By, Bz). The UT corresponds to the observations at the ACE location at ~220 Re. The time delay is estimated at approximately 40 min at the solar wind plasma velocity of ~600 km/s. It would be justified to take a slightly longer lag of 1 h, assuming that the characteristic operating time of the mechanism should be within 10–20 min.
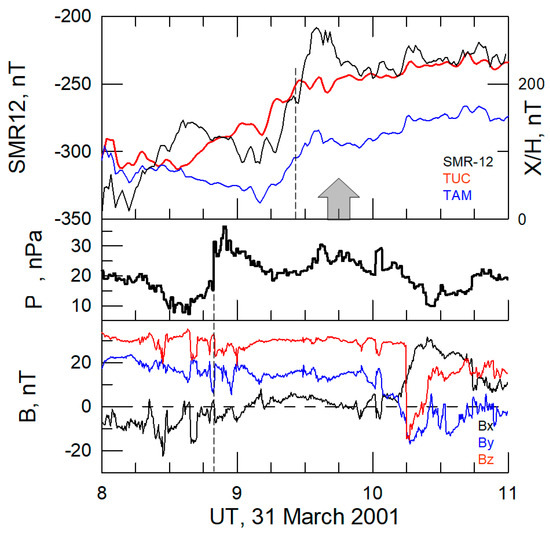
Figure 3.
Geomagnetic and solar wind conditions on 31 March 2001: (top) SuperMAG partial ring current index SMR-12 (black), and X/H-components of the magnetic field at midnight at TUC (red) and pre-noon at TAM (blue) stations of the INTERMAGNET network; the offset values are 32,950 nT (TAM) and 24,500 nT (TUC); (middle and bottom) the solar wind total pressure P and IMF components Bx (black), By (blue), and Bz (red), measured by the upstream monitor ACE. The gray arrow indicates the FEE enhancement at night.
Just before the FEE-time, from about 9:15 to 9:35 UT, the geomagnetic field in the dayside increases rapidly by 70–90 nT, as measured by ground-based magnetometers (Figure 3), with the magnetic field increase typically being a response to the compression effect on the magnetosphere. At the night station TUC, the H-component shows a longer gradual increase with a local minimum around 9:15 UT followed by a rapid rise by 25 nT. Also, after this, three local peaks are observed which may be geomagnetic pulsations of the Pc5 type with a quasi-period 5–7 min. Note that the Pc5 pulsations are exited during strong magnetospheric compressions (e.g., [29,51]).
In Figure 3, the solar wind pressure P shows an abrupt (within 1 min) increase by 20–25 nPa at 8:50 UT accompanied by short-term variations of IMF components. The Bz component was largely positive at least until 10:15 UT (time of ACE). The type of magnetic structure is classified as a magnetic cloud [52]. Taking into account the 40 min time delay interval, the positive change of the solar wind pressure (ΔP) should result in an increase in the geomagnetic field around 9:30 UT, which is in good agreement with observations at the ground-based magnetic field stations (SMR-12, TAM and TUC). A few minutes later, the intense fluxes of the 30–300 keV quasi-trapped electrons at L-shell of ~1.12 at midnight were detected by POES-16 (Table 1).
3.2. Case on 9 November 2004
This case occurred during the second storm in a series that lasted from 7 to 10 November 2004. The first was a super storm; the other two began at recovery phases of the previous storm. During the first storm, only an increase in the >30 keV electron fluxes was observed. The storm on 9 November started with SSC of amplitude ~ 60 nT at ~18:50 UT, followed by the main phase 20 min later. The minimum SYM-H value of ~−250 nT was observed at 21:00 UT. Following the northward turn of Bz, the recovery phase began after ~21:00 UT and continued for 7 h until the storm ring current intensified again. During the main phase, three POES satellites did not detect any increase in FEE fluxes in any LT sector (2-14, 6-18, and 10-22 LT).
The first FEE enhancement was observed at the end of the main phase at ~21:10 UT (Table 1, Figure 1). In the morning sector, high-intensity fluxes were simultaneously observed in two energy channels: >30, and >100. The satellite was probably located near the region of injection.
Figure 4 shows geomagnetic and solar wind conditions from 18:00 to 23:00 UT on 9 November 2004. The upper panel presents the SMR-12 index and X-components from the low-latitude stations ASP (23.8° S, 133.9° E) and PPT (17.6° S, 149.6° W). Local time at 21 UT was ~6 h at ASP and 11 h at PPT. Lower panels present the solar wind parameters measured by the Wind monitor at the upstream location of ~200 Re. The time delay is estimated at approximately 25 min for the solar wind plasma velocity of ~800 km/s.
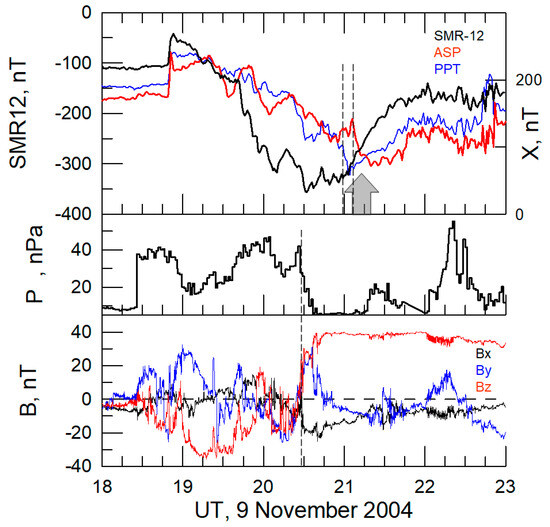
Figure 4.
Geomagnetic and solar wind conditions on 9 November 2004: (top) SuperMAG partial ring current index SMR-12 (black), and X-components of the magnetic field in the morning at ASP (red) and on the pre-noon PPT (blue) stations of the INTERMAGNET network, the offset values are 29,700 nT (ASP) and 29,200 nT (PPT); (middle and bottom) the solar wind total pressure P and IMF components Bx (black), By (blue), and Bz (red), measured by the Wind upstream monitor. The gray arrow indicates the FEE enhancement at early morning.
In the solar wind within 1 h interval from 21:10 UT, a significant decrease in pressure (~35 nPa) accompanied by a rotation of IMF components can be seen at ~20:30 UT. The Bz component turned north and became largely positive. The type of magnetic structure is classified as a magnetic cloud. The ground stations ASP (early morning) and PPT (pre-noon) observed rapid decreases of the geomagnetic field by ~60 nT at 21:07 UT and 21:00 UT, respectively. At the same time, the SMR-12 index does not show any decrease in the daytime geomagnetic field. Note that this index is derived as the average over many available stations within the noon sector in a wide (±50°) latitudinal range. At that time, the end of the main phase, there is a strong effect of the intense ring current at dayside, especially in the post-noon sector. Therefore, in this case, the measurements from individual low-latitude stations are more indicative. The decrease in the daytime magnetic field at low latitudes corresponds to the magnetosphere expansion. Thus, the large negative change in solar wind pressure (ΔP < 0) causes an expansion of the magnetosphere, which is revealed from the decrease in the X-component at low-latitude ground stations located on the dayside. A few minutes later, the fluxes of the 30–100 keV quasi-trapped electrons at L-shell of ~1.05 suddenly began to increase at early morning (Table 1).
3.3. Case on 10 May 2024
The super storm on 10 May was started with SSC of amplitude ~ 100 nT at ~17:05 UT, followed by the main phase ~ 1 h later. The storm peaked with SYM-H ~ −512 nT at ~2 UT on 11 May (the strongest storm of the last 25 years). Another feature of this powerful storm was a very strong substorm with AE ~ 3600 nT [53], which occurred between 19 and 20 UT, and the next day there were even two substorms with AE > 3000 nT. It should be noted that such strong substorms are rare events, classified as supersubstorms and intensively studied in recent years [54,55,56].
As shown in Table 1, at the beginning of the main phase (19:22 UT), one of five POES satellites (7-19 and 9-21 LT) detected the first FEE enhancement in the pre-noon sector (9 LT). Since intense fluxes of >30 and >100 electrons were observed simultaneously, we assume that the satellite was near the injection region. Note that the time 19:22 UT corresponds to the moment of crossing the equator, and the beginning of the increase in the flux was recorded at 19:15 UT.
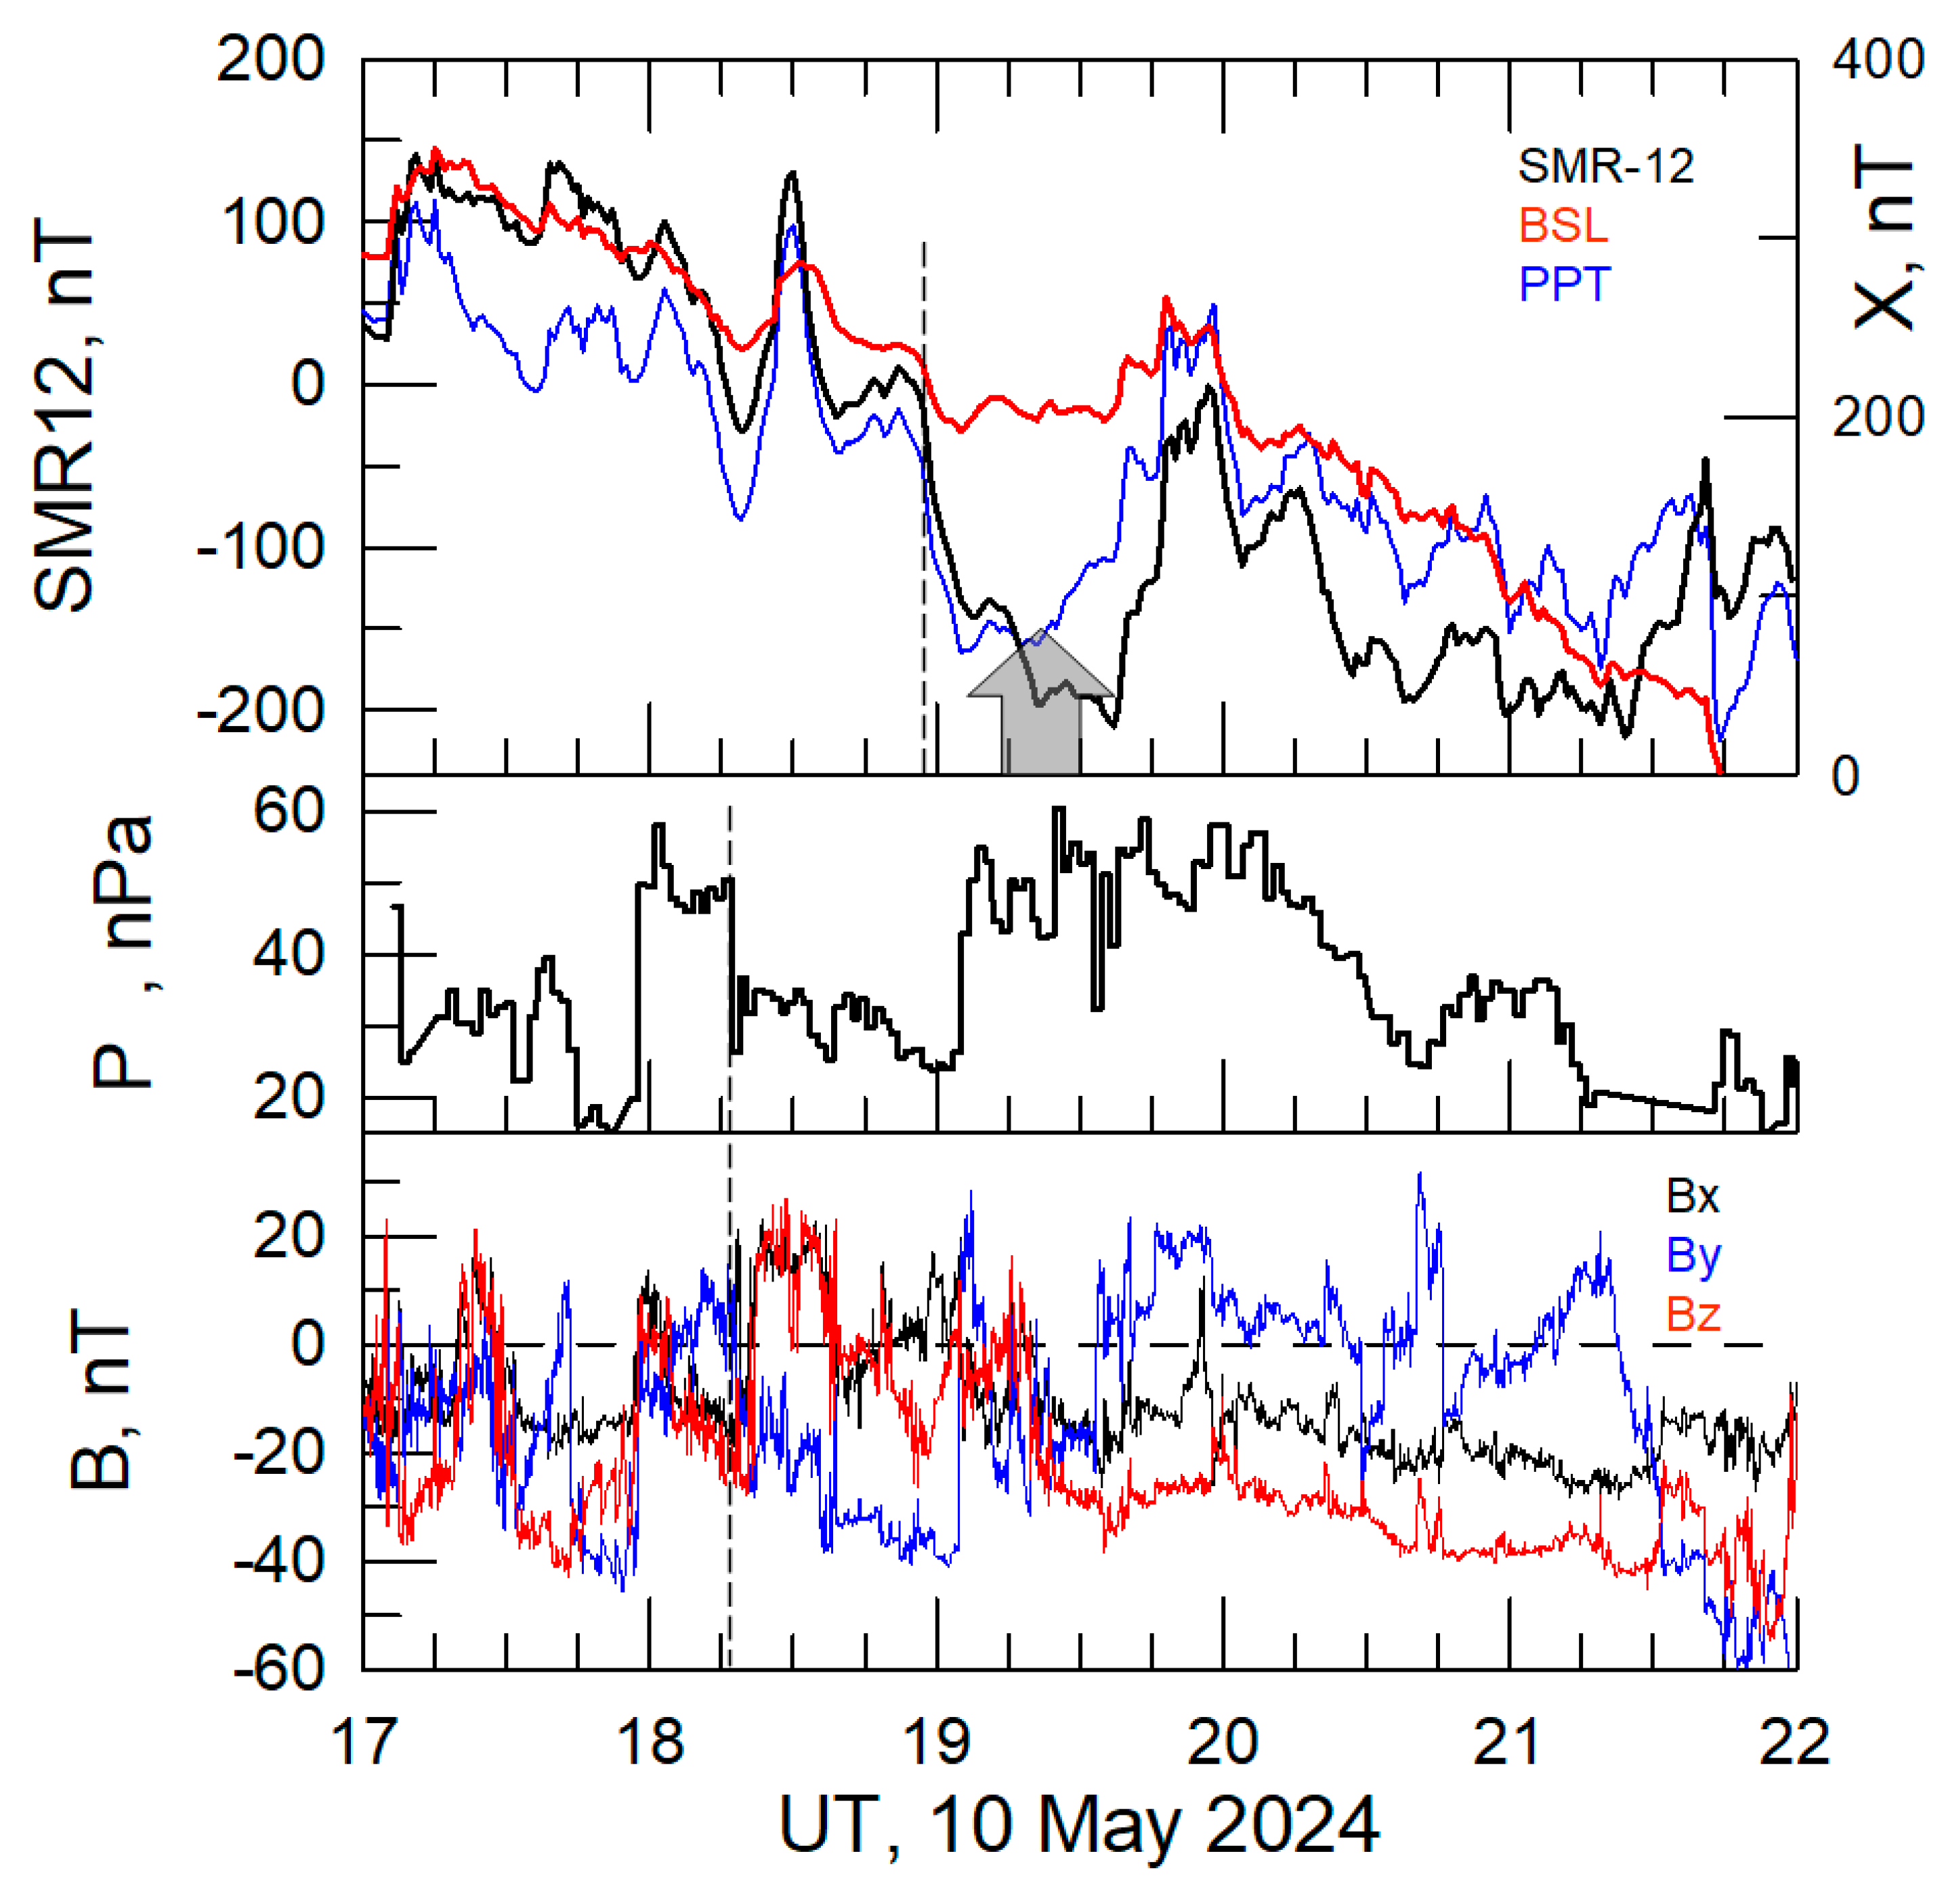
Figure 5 shows geomagnetic and solar wind conditions during the storm from 17:00 to 22:00 UT on 10 May 2024. The upper panel presents the SMR-12 index and X-components from low-latitude stations BSL (30.3° N, 89.6° W) and PPT (17.6° S, 149.6° W). At 19 UT local time was ~13 h at BSL and 9 h at PPT. Lower panels present the solar wind parameters observed by the Wind monitor at upstream location ~ 216 Re. The time delay is estimated at approximately 35 min at solar wind plasma speed of ~650 km/s.
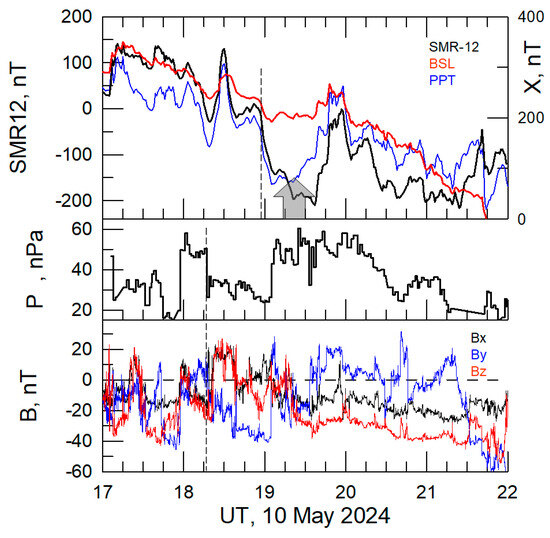
Figure 5.
Geomagnetic and solar wind conditions on 10 May 2024: (top) SuperMAG partial ring current index SMR-12 (black), and X-components of the magnetic field on the post-noon at BSL (red) and on the pre-noon at PPT (blue) stations of the INTERMAGNET network. The offset values are 23,600 nT (BSL) and 28,800 nT (PPT). (Middle and bottom) The solar wind total pressure P and IMF components Bx (black), By (blue), and Bz (red), measured by the Wind upstream monitor. The gray arrow indicates the FEE enhancement at pre-noon.
In Figure 5, within 1 h of the FEE-time, an abrupt pressure decrease (ΔP ~ −20 nPa) is observed at 18:15 UT (time of Wind). The negative pressure change ΔP is accompanied with a northward turn of Bz IMF. The type of magnetic structure is classified as an interplanetary sheath [57]. According to the low-latitude observations at BSL and PPT at ~19 UT, the geomagnetic field rapidly decreases (for 7 min) by ~60 and ~150 nT in the post-noon and pre-noon, respectively. At the beginning of the storm main phase, the ring current is asymmetrical and its influence on the dayside is still insignificant. Therefore, a change in the SMR-12 index also shows a large decrease in the daytime geomagnetic field. Hence, the observed large negative pressure change ΔP led to the magnetosphere expansion and decrease in the X-components at daytime ground stations.
Da Silva et al. [53] reported that in this interval of the northward Bz IMF (see Figure 5) there was no energy input to the magnetosphere (Akasofu parameter was near zero) and the low-energy (tens of keV) particle fluxes in the inner and outer ERB decreased, as observed by the THEMIS probes. They suggested that particles intensively precipitated into the atmosphere over SAA through efficient scattering by wave-particle interaction. On the other hand, observations of the NOAA/POES fleet showed that soon after the sharp pressure decrease, at 19:15 UT, the fluxes of the 30–100 keV quasi-trapped electrons registered by NOAA/POES began suddenly to increase at L-shell of ~1.11 on pre-noon (Table 1). That is, these electrons could be injected below the inner ERB after 19 UT during an absence of the energy input. On the other hand, there were no particle injections at higher L-shells into the inner ERB (L < 2). The injections appeared later, after 21:30 UT, during a gradual increase of the energy input, as observed by THEMIS [53]. Clearly, the FEE-associated injection could not have been due to injections into the inner ERB in this storm. Quite surprisingly, close to this time, the supersubstorm onset was at 19:10 UT, peaked at 19:45 UT, and was recorded as a negative AL excursion at several magnetometer stations in the American sector (pre-noon) according to the INTERMAGNET network (see Supplementary Material). That is, the supersubstorm was associated with the dayside disturbance in the geomagnetic field, which is not typical for auroral disturbances associated with auroral particle precipitations. We suggest that the large negative excursion of AL resulted from a sudden expansion of the dayside magnetosphere and weakening of the geomagnetic field under the sharp drop of the solar wind pressure. This is probably a signature in the horizontal magnetic component of the transient ionospheric electric current. Thus, the FEE injection and supersubstorm observed from 19 to 20 UT are probably interconnected events and manifestations of a single process that occurred in the pre-noon sector.
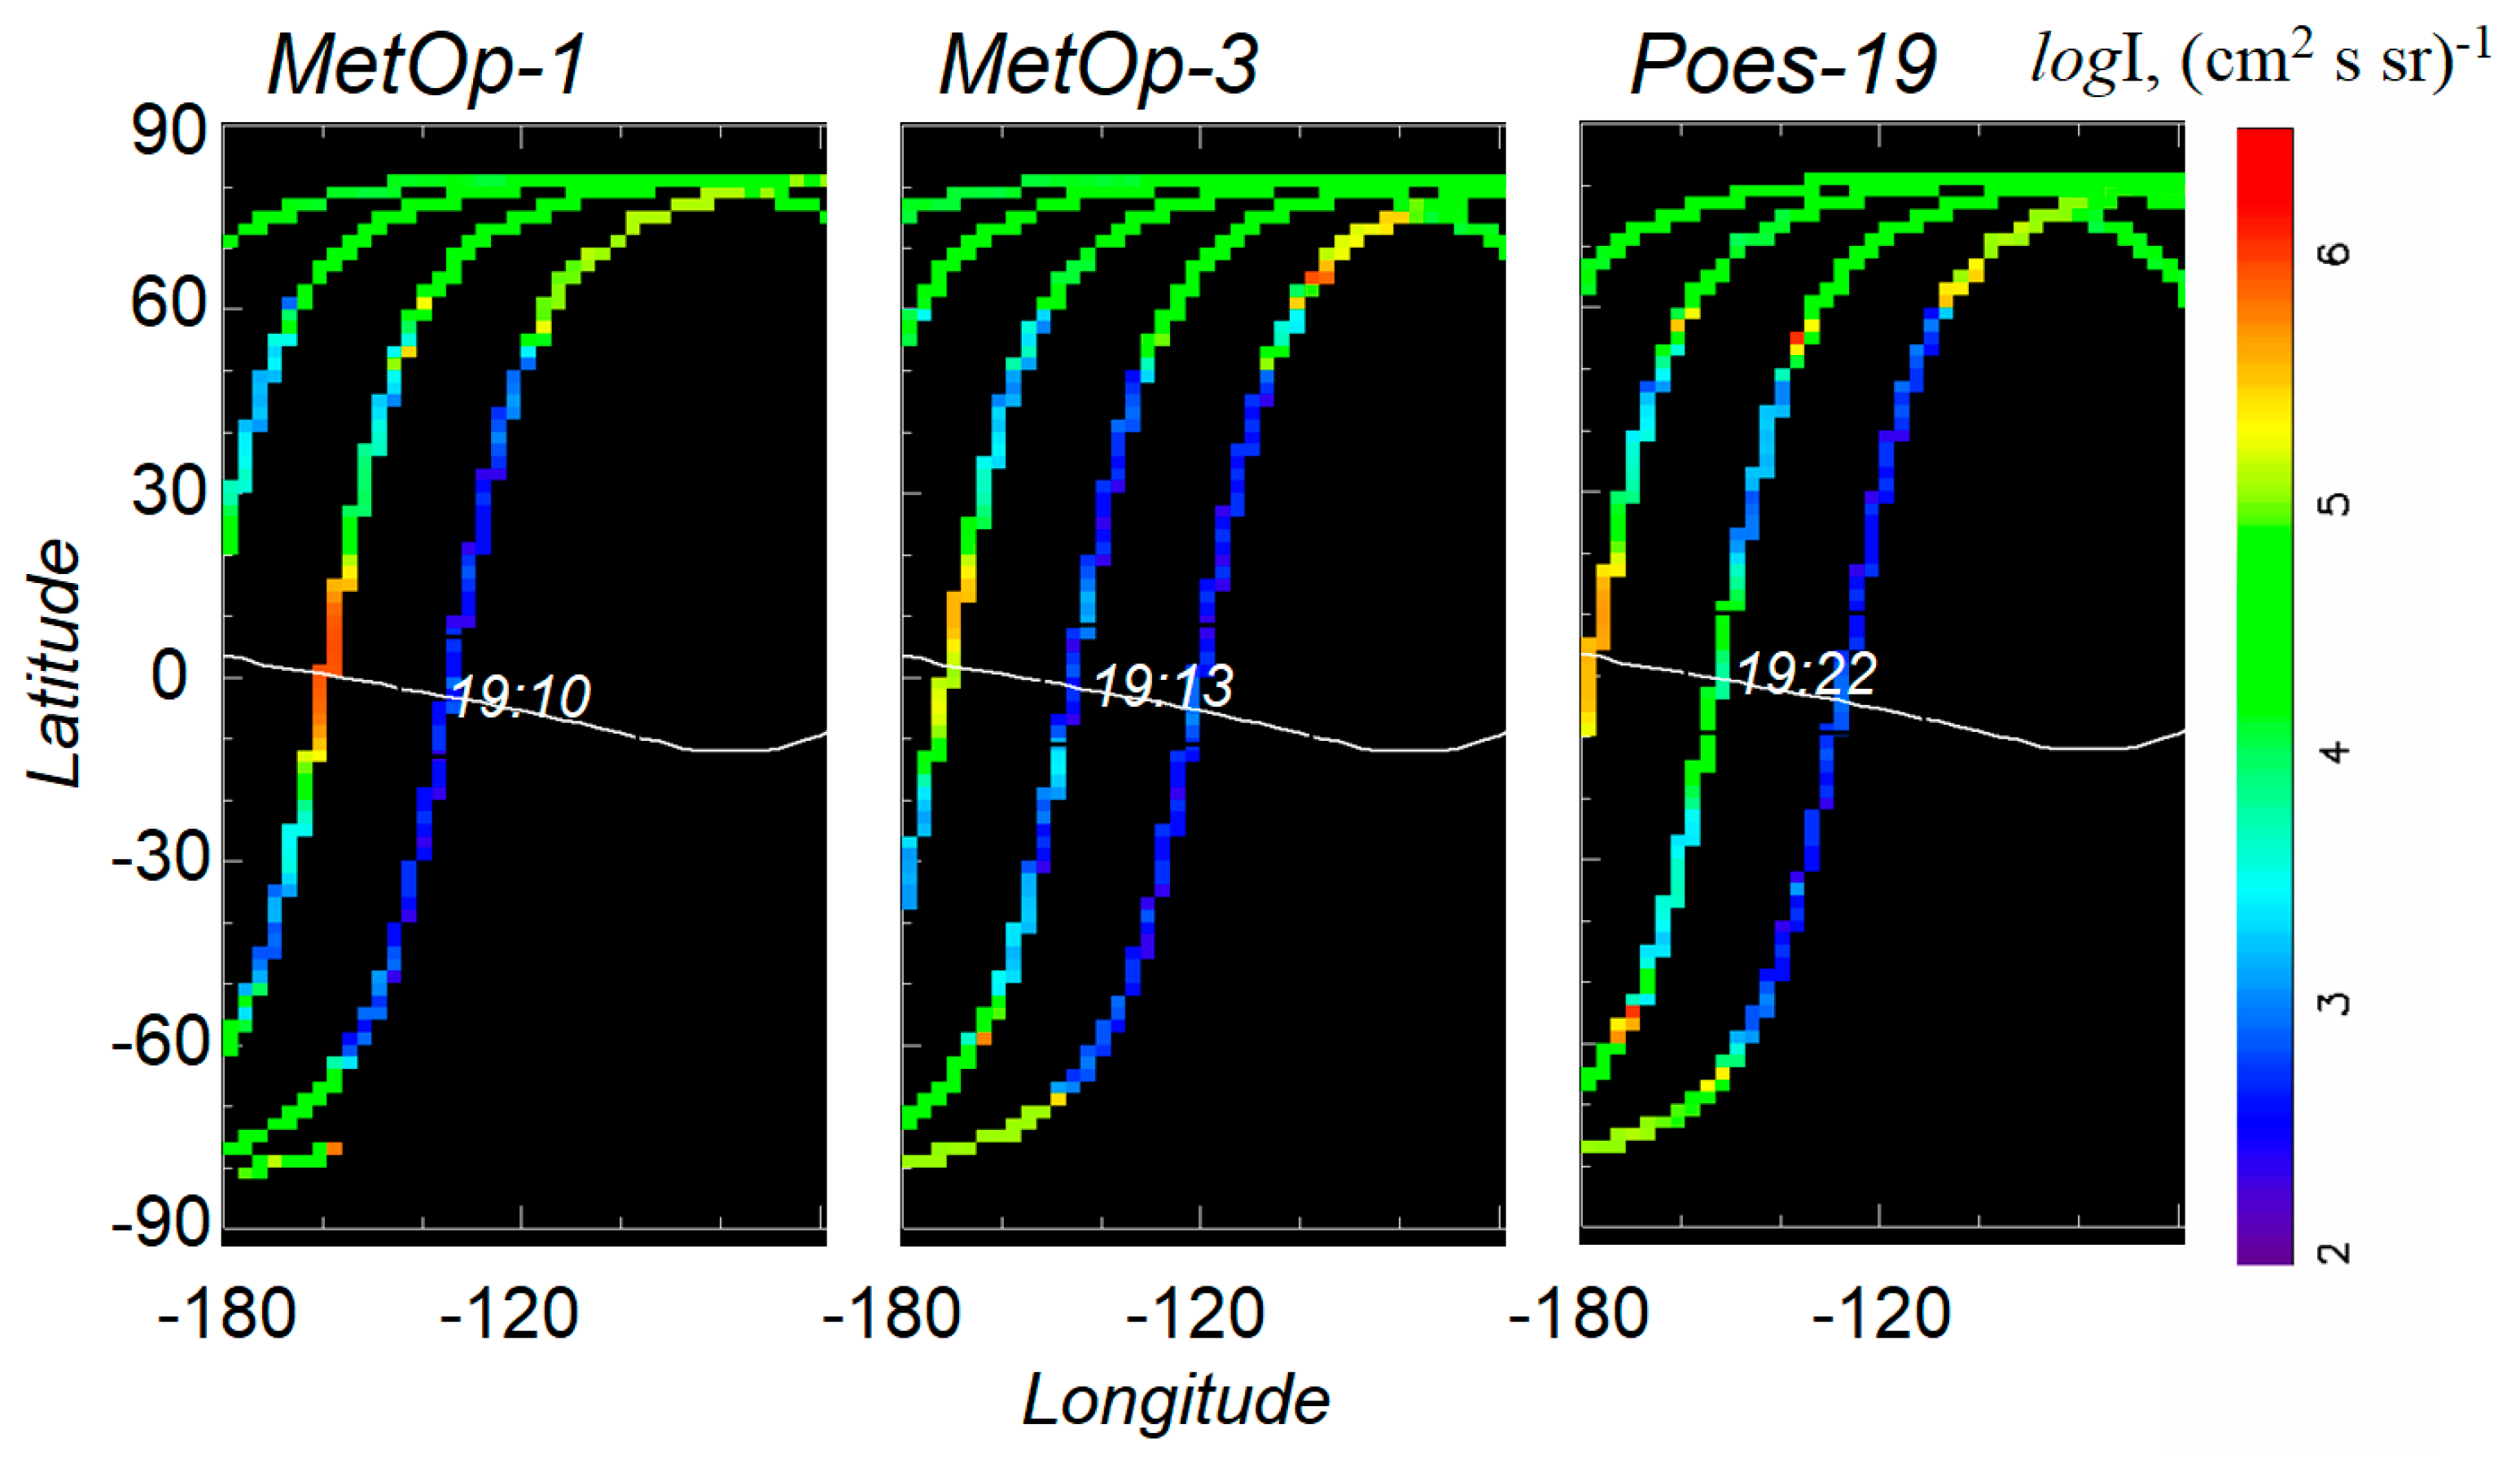
In the case of May 2024, four satellites were arranged in the form of beads on a string in the plane 9-21 LT. Therefore, we have a good opportunity to more accurately determine the injection time. Figure 6 shows variations of flux intensity of the >30 keV electrons along successive passes of the satellites MetOp-1, MetOp-3, and POES-19 in the 60° W–180° W longitudinal sector. In the narrow longitudinal interval 140° W–150° W, the satellites crossed the equator at 19:10 UT (MetOp-1), 19:13 UT (MetOp-3), and 19:22 UT (POES-19). It can be seen that at 19:10 UT the flux is equal to the background level (102 cm−2 s−1 sr−1), and 3 min later the flux is still at the background at the equator, but it increases 10 times at latitudes of 10–15° from the equator. Then, POES-19, which was trailing MetOp-3 by 9–10 min, observed significant flux increase (>104 cm−2 s−1 sr−1) at the equator. That is, during the shortest time interval (~10 min), between successive passes of MetOp-3 and POES-19, the flux increases. Thus, based on the flux dynamics, we determined a characteristic time of 10 min for the arrival of electrons during injection from the inner edge of ERB to the forbidden zone.
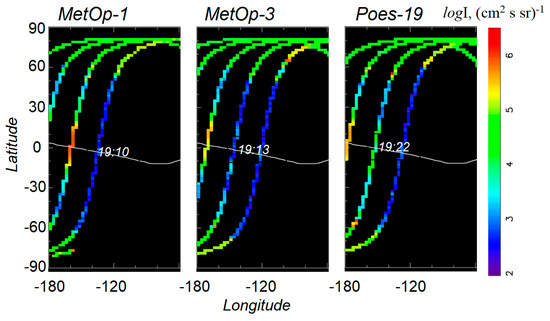
Figure 6.
The intensity of flux of the >30 keV electrons observed by three satellites from 17:00 UT to 21 UT on 10 May 2024. After 19 UT, the satellites crossed the equator in a narrow longitudinal interval (140° W–150° W) successively at 19:10, 19:13, and 19:22 UT. MetOp-3 observed an increase in the flux of quasi-trapped electrons at latitudes 10–15° off the equator. After ~10 min, POES-19 observed a large increase in flux at the equator.
4. Discussion
We assume that the energetic electron fluxes below the ERB suddenly enhance due to the solar wind and IMF changes. We investigate the character of these changes to understand the physical principle underlying the FEE enhancement mechanism. This will also allow us to evaluate the key parameters of the mechanism.
We apply three criteria to select FEE cases for the analysis. (1) The time interval corresponds to a period when the magnetosphere is strongly disturbed by the impact of a CME, which results in a super storm of about −500 nT strength. (2) The FEE enhancement should be the first observed by the satellite constellation after the super storm onset. (3) The simultaneous enhancement in fluxes of electrons with different energies is the main condition for determining the time and location of injection.
Suitable cases were found during three super storms and were analyzed in detail. The FEE enhancements occurred during the storm recovery phase on 31 March 2001, at the end of the main phase on 9 November 2004 and at the beginning of the main phase on 10 May 2024 (Table 1). During great storms, the probability of simultaneous increase in electron fluxes in a wide energy range (from tens to low hundreds of keV) is higher [3]. As seen in Table 1, simultaneous enhancements were observed in >30, >100 and >300 keV energy channels during one case and in >30 and >100 keV channels during other two cases. Then we compared the timing of the first FEE enhancements and abrupt changes of the solar wind pressure P acting on the magnetosphere with a time lag refined from ground-based magnetic observations.
Here, we first discuss an important issue concerning the possible influence of SAA electrodynamics and equatorial electrojet on the occurrence of FEE enhancements. The SAA electrodynamics are strongly influenced by energetic particles of the inner ERB precipitating into the atmosphere above the SAA area during geomagnetic storms. Lin and Yeh [58] have proposed a mechanism of electric field generation due to presence of conductivity gradients in the E-layer during particle precipitations in the SAA. However, this mechanism can only be applied within the region of SAA or in the vicinity (e.g., [59]). Additionally, sporadic energetic particle precipitations producing abundant ionization cause variations of the height-integrated conductivity of the ionosphere and modulation of ionospheric currents, in particular, the equatorial electrojet. Cladis [9] proposed an ionospheric mechanism of resonant acceleration of energetic electrons of the inner ERB and their radial transport to lower L-shells. The solar wind pressure changes, such as SSC, result in magnetic field fluctuations observed on the ground. As the solar wind drives particle precipitations, variations of the equatorial electrojet are amplified and produce magnetic field oscillations. An alternating electric field with an azimuthal component around the equator is established by solar wind variations. If the period of magnetic fluctuations is about the same as the azimuthal drift period of energetic electrons, then the electrons gain energy during the ionospheric current oscillations. In the ionospheric drift-resonant mechanism, the temporal variations of the equatorial electrojet, flowing at the equator with a width of 400–600 km from the dawn to dusk (to the east), should have the same time scale as the drift period of particles. Hence, the process is selective with respect to energy. Pinto et al. [10] have compared peaks in electron spectrum with the power spectra of geomagnetic data from SAA. They found only statistically insignificant peaks in power spectra of pulsations. They concluded that there is no evidence that an acceleration of high-energy electrons (E ~ 0.7–1.3 MeV) was caused by the equatorial electrojet variations. Kudela et al. [11] have showed that the ionospheric mechanism is not appropriate for the low-energy electrons (E < 100 keV). In particular, electrons with energy 30 keV have a long period of azimuthal drift of 19.2 h at shells L < 1.3 (see Figure 2) and, hence, a very long coherence time, of the order of several days, is needed. That is the long drift period of low-energy electrons, indicating that the drift-resonant acceleration mechanism is inappropriate for low-energy electrons. Finally, the ionospheric mechanism is not appropriate for the FEE injections at longitudes far away from the SAA area.
Three super storms began with SSC/SI caused by strong compression due to the effects of high solar wind pressure accompanied by south/north Bz IMF. Previous studies [30,60,61] reported fast injections of relativistic electrons from the outer ERB to L = 2.5 due to the SSC-associated electric field of 80 mV/m amplitude and of 2 min duration. However, in our study, no FEE enhancements were observed during SSC/SI at L < 1.2. In contrast, the first FEE in March 2001 occurred 9 h after the SI, in November 2004, 2.5 h after the SSC, and in May 2024, 2 h after the SSC. From Table 1, we can find a tendency in occurrence of the first FEEs at daytime when the solar wind pressure sharply decreases (negative ΔP) and at nighttime when the pressure sharply increases (positive ΔP).
Case studies and statistical data ([4] and references therein) of FEE enhancements have provided reliable confirmation of the mechanism of radial transport from the inner ERB. Additionally, a characteristic feature of the FEE phenomenon is a significant increase in flux by orders of magnitude over a short period of time (tens of minutes). The observations prove that this was a fast transport or injection with a flux growth time shorter than the orbital period of the POES satellites (<1.7 h), which is different from a slow transport or diffusion that takes a few days. In the current study, we found that the first FEE enhancements occurred within a relatively short time (<20 min) after the pressure change affected the magnetosphere. In addition, the shortest time of the injection of 10 min was estimated for the case of 10 May 2024 based on the successive passes of two satellites. Thus, we conclude that even 10 min may be sufficient for injection into the lower L-shells during periods of great storms.
We now compare this observed time with simplified theoretical estimations derived for the electric drift. The characteristic time of electric drift T across L-shells over a distance δL with velocity VDE is expressed by the relation [8]:
where the Earth’s radius a = 6380 km, and VDE is the electric drift velocity. In the dipole field approximation and in the equatorial plane, there is a simple expression for the velocity: VDE = E┴/B [18]. Moving on to the non-systemic units generally accepted in space physics [km/s, mV/m, nT], we obtain the formula for VDE in [km/s]:
Then we perform integration (4) over L in the interval [L0; L1]:
and we obtain an expression for the characteristic drift time T(E┴, L1) in minutes:
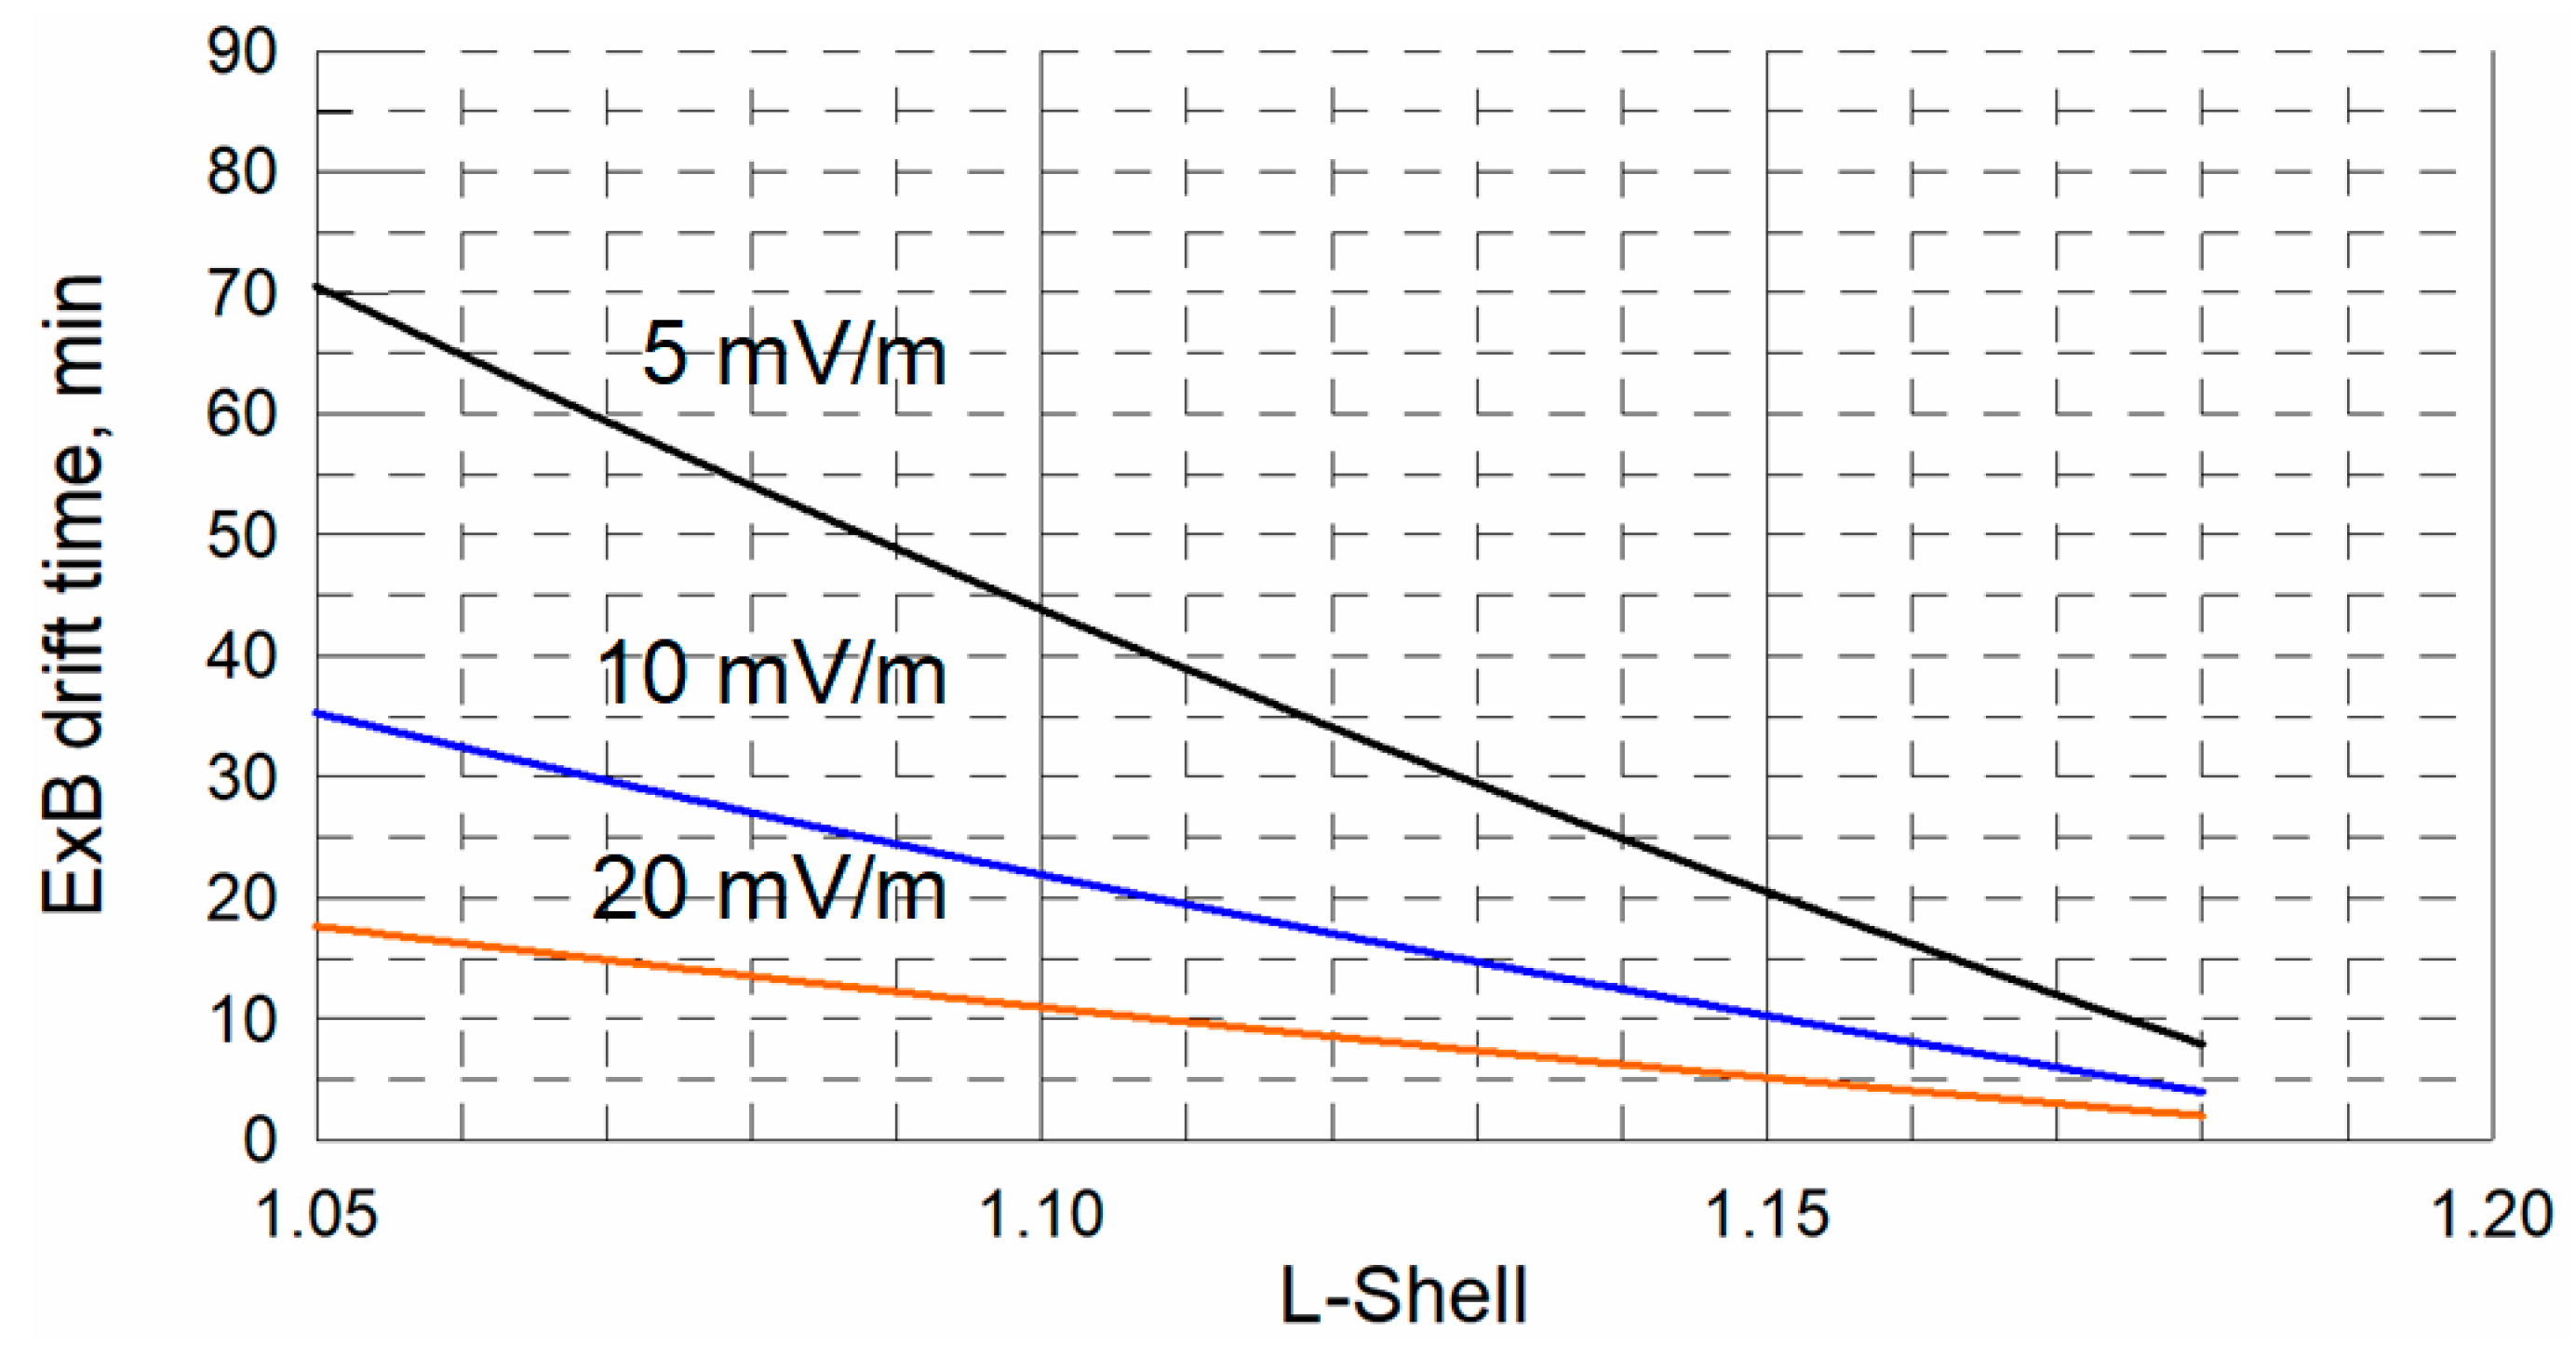
Figure 7 shows the dependence of T on L-shell for different electric field magnitudes E┴. It can be seen that the particle transport from L = 1.2 to 1.15 takes ~ 20 min for E┴ = 5 mV/m and ~10 min for E┴ = 10 mV/m.
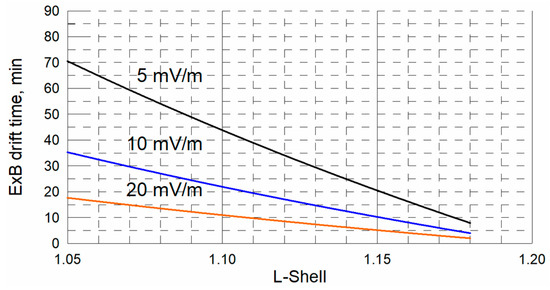
Figure 7.
Time of electric drift from L = 1.2 to lower L-shells, calculated by expression (4) for electric field E┴ = 5, 10, 20 mV/m.
Thus, in the presence of an electric field of 5–10 mV/m, several minutes are enough for the particles to pass further, to the shells L ~ 1.12–1.13. When the electric pulse is repeated, the particles from these shells will reach the lower 1.05–1.10 shells. In such a multiple pulse scenario, the particles can penetrate deeper and deeper. In addition, during the azimuthal motion, the particles leave the injection region (where the electric field acts) and descend along the shells to lower altitudes. In the case of successive multiple injections (staged), this time T may be shorter, on the order of several minutes, but then low-energy particles can get into the quasi-trapped zone in several cycles of radial drift over an hour with sporadic “switching on” of the driver.
The question of the nature and source of the electric field still remains open. The hypothesis of a penetrating large-scale convection electric field could explain the nighttime injections (FEE enhancements), while on the dayside the opposite effect would be observed, with the particles drifting outward. Such penetration of the convection field is possible during the undershielding condition at the night side. The prompt penetrating electric field (PPEF) at the dayside, an alternative, is also associated with southward turning Bz IMF and the dawn-dusk direction of the penetrating electric field, resulting to an outward drift on the dayside. Therefore, large-scale solar wind/magnetospheric penetration electric fields cannot completely solve the problem of low-L injections, particularly at local times other than nighttime. Moreover, from a theoretical point of view, it is difficult to justify a field of several mV/m near the inner edge of ERB and in the forbidden region. It was concluded that none of the global electric field models can describe this penetration field and correctly capture the electric drift or nondiffusive radial transport in the low L-shell region [15,17].
It should be noted that in the three cases considered, the Bz IMF was directed northward. Hence, in these cases, the large-scale convection electric field decreases and an overshielding effect occurs with a predominance of the dusk-to-dawn electric field. This is inconsistent with the conception of the “injection—local time” based on the penetration effect in the night. On the other hand, we have found and demonstrated that abrupt changes in the solar wind pressure, where the dynamic pressure is the main component, might be a more important factor for the low-L injections than the south Bz IMF.
An abrupt change in the solar wind pressure affecting the magnetosphere causes a rapid change in the geomagnetic field strength over time ∂B/∂t. According to Faraday’s law of electromagnetic induction rotE = −∂B/∂t, an induction electric field arises. As one can see in Table 1, the FEE injection is observed at day when ΔP < 0 acts on the magnetosphere; that is, the magnetosphere expands and the magnetic field decreases ∂B/∂t < 0. Therefore, to provide the daytime inward transport, the transient electric field pulse must be present at lower L with an azimuthal component of large amplitude in the dusk-to-dawn direction. It should be noted that before the decrease of pressure, the size of the magnetosphere is extremely small (see the pressure in Figure 2 and Figure 3), such that the magnetopause can be located inside the geosynchronous orbit [62]. In the high-latitude ionosphere, the whole magnetopause is projected into the small cusp region. Under the strong compression the cusp is shifted to low latitudes. The induction electric field for ∂B/∂t < 0 has a dusk-to-dawn direction at the equatorial boundary of the cusp. Hence, this field is approaching very close to the injection region at low L. The question arises of how this field can penetrate into the topside ionosphere at the equator.
We have shown that SSC/SI associated with a large pressure increase does not result in FEE injection. However, the positive pressure pulse during the storm recovery phase is followed by the FEE injection on the night side (see Table 1). When ΔP > 0 acts on the magnetosphere, the magnetic field increases ∂B/∂t > 0, in particular in the tail enriched by plasma during the storm main phase. It should be noted that the transient electric field does not relate to the large-scale convection of the plasma flow, which is driven by the south Bz IMF component. At the early recovery phase, a total effect from overshielding and compression might lead to insignificant penetration (i.e., simple shielding) of electric fields of any direction at night. But we infer that if FEE injection occurs at night, then a transient electric field pulse must be of a dawn-to-dusk (westward) direction. It seems that cases with nighttime FEE injections during the recovery phase are not consistent with the penetration convection field concept, whereas the source of transient electric fields is still unknown.
The authors of the studies [63,64] speculated that the subauroral polarization streams (SAPS) may play an important role in deep electron injection at low L shells. They showed that a SAPS electric field has westward direction in the postmidnight–dawn sector. Further, Huang et al. [65] found that the SAPS electric fields penetrate to low latitudes. These studies suggested that the transient westward electric fields resulted from SAPS in the postmidnight sector may be responsible for the radial inward transport of electrons in the inner magnetosphere. In the case of FEE injection, the same question arises about the penetration of transient electric fields to the equator.
We further found that the south Bz IMF component did not directly control the FEE injections. Moreover, the SSC-type compression also does not lead to FEE injections. In these cases, a northward turning of Bz was observed for ~1 h prior to injection. Apparently, the magnetospheric state controlling the Bz component is important. This means that the Bz IMF may play a supplementary role in the mechanism of FEE injections.
Experimental measurements of electric fields in the inner magnetosphere on the Akebono satellite [33,34,35] revealed the presence of transient and highly fluctuated electric fields. The satellite observations showed the transient appearance of pulsed electric fields with strength amplitudes of tens of mV/m in the low L-shells. The strong pulses of the induction electric field occurred with a period of ~5–7 min. Other experiments also revealed the presence of inductive electric fields in the plasmasphere and deeper [29,30,31,32]. Electric measurements of the C/NOFS satellite at ionospheric altitudes of 400–900 km [36,37] showed the presence of alternating electric fields with an azimuthal component oscillation amplitude of E ~ 5–10 mV/m. Therefore, observations of strong transient (inductive) electric fields in the innermost magnetosphere provide an important argument in favor of the electric drift mechanism, which can explain the rapid (minutes) radial transport of energetic electrons from the inner ERB to the forbidden zone. In our study, we have found a relation between this process and the dynamic pressure of the solar wind.
5. Conclusions
We have studied the flux enhancements of the >30, >100, and >300 keV quasi-trapped electrons (FEE) below the inner radiation belt (L < 1.2) during three super storms in 2001, 2004, and 2024. These FEE enhancements were the first observed after the super storm onset. We showed that the enhancements were rapid and can be explained by the inward radial transport provided by the electric drift mechanism. Using particle measurements from the NOAA/POES satellite fleet, we determined a timescale of electron injection that indicates the characteristic rate of electric drift, and then calculated the magnitude of the electric field corresponding to this rate. Analysis of the interplanetary parameters showed that the abrupt changes in the solar wind dynamic pressure may cause the FEE enhancements. The type of interplanetary structure was a magnetic cloud and an interplanetary sheath with Bz > 0.
Our results are summarized below:
- The occurrence of the FEE increases does not show any preference for any phase (early/maximum in main and recovery phases) of the super storms that confirms the results of previous studies.
- No FEE enhancements were observed during SSC/SI of the super storms.
- The FEE enhancement in each super storm was found to be associated with the abrupt change of the solar wind pressure.
- It was revealed that the sign of the solar wind pressure jump determines the local time sector in which injections can occur: the nighttime FEE injection is observed under a positive jump, and vice versa.
- The increases in the fluxes of the energetic quasi-trapped electrons occur within 20 min after the impact of a pressure jump.
- The results substantiate the conclusion about the action of the electric drift mechanism. The dynamics of FEE injection with a characteristic time of ~20 min is required for an electric field of about 10 mV/m in order to move electrons from the L-shell 1.2 to 1.1. The nature of the electric field is rather inductive (transient), because a sharp pressure jump causes a geomagnetic field to change rapidly over time, and IMF conditions for penetration of the enhanced large-scale convection field are inconsistent with either daytime or nighttime first injections.
Supplementary Materials
The following supporting information can be downloaded at: https://www.mdpi.com/article/10.3390/universe11070226/s1.
Author Contributions
A.V.S. conceptualized the idea, performed the formal analysis and wrote the original draft of the manuscript. A.V.D. developed the data analysis software and contributed to the interpretation of the results. All authors contributed to the editing of the final manuscript. All authors have read and agreed to the published version of the manuscript.
Funding
This research received no external funding.
Data Availability Statement
All the data used in this study are publicly available. The NOAA/POES data were obtained from https://www.ngdc.noaa.gov/stp/satellite/poes/, accessed on 15 March 2025. The solar wind parameters were obtained from NASA Goddard Space Flight Center’s CDAWeb https://cdaweb.gsfc.nasa.gov, accessed on 15 April 2025, geomagnetic indices http://supermag.jhuapl.edu/ (accessed on 4 July 2025).
Acknowledgments
The author is grateful to the NOAA team for providing experimental data on energetic particles measured by the POES and MetOp satellites. The author is grateful to the CDAWeb team for providing free public database of the solar wind from ACE and Wind monitors. We gratefully acknowledge the SuperMAG and INTERMAG collaborators. The study was carried out within the framework of the state assignment of the Lomonosov Moscow State University.
Conflicts of Interest
The author declares that there is no conflict of interests regarding the publication of this paper.
References
- Suvorova, A.V.; Tsai, L.C.; Dmitriev, A.V. On relation between mid-latitude ionospheric ionization and quasi-trapped energetic electrons during 15 December 2006 magnetic storm. Planet. Space Sci. 2012, 60, 363–369. [Google Scholar] [CrossRef]
- Suvorova, A.V.; Dmitriev, A.V.; Tsai, L.C.; Kunitsyn, V.E.; Andreeva, E.S.; Nesterov, I.A.; Lazutin, L.L. TEC evidence for near-equatorial energy deposition by 30 keV electrons in the topside ionosphere. J. Geophys. Res. Space Phys. 2013, 118, 4672–4695. [Google Scholar] [CrossRef]
- Suvorova, A.V.; Dmitriev, A.V. Radiation aspects of geomagnetic storm impact below the radiation belt. In Cyclonic and Geomagnetic Storms: Predicting Factors, Formation and Environmental Impacts; Banks, V.P., Ed.; NOVA Science Publishing: New York, NY, USA, 2015; pp. 19–76. [Google Scholar]
- Suvorova, A.V. Solar-cycle variations of forbidden energetic electrons enhancements. Universe 2023, 9, 374. [Google Scholar] [CrossRef]
- Suvorova, A.V.; Dmitriev, A.V. Conditions for the occurrence of intense fluxes of energetic electrons at L < 1.2 associated with solar activity and solar wind parameters. Sol.-Terr. Phys. 2024, 10, 75–82. [Google Scholar] [CrossRef]
- Suvorova, A.V. Flux enhancements of >30 keV electrons at low drift shells L < 1.2 during last solar cycles. J. Geophys. Res. Space Phys. 2017, 122, 12274–12287. [Google Scholar] [CrossRef]
- Suvorova, A.V.; Huang, C.M.; Matsumoto, H.; Dmitriev, A.V.; Kunitsyn, V.E.; Andreeva, E.S.; Nesterov, I.A.; Tsai, L.-C. Low-latitude ionospheric effects of energetic electrons during a recurrent magnetic storm. J. Geophys. Res. Space Phys. 2014, 119, 9283–9303. [Google Scholar] [CrossRef]
- Suvorova, A.V.; Dmitriev, A.V.; Parkhomov, V.A. Energetic electron enhancements under the radiation belt (L < 1.2) during a non-storm interval on 1 August 2008. Ann. Geophys. 2019, 37, 1223–1241. [Google Scholar] [CrossRef]
- Cladis, J.B. Resonance acceleration of particles in the inner radiation belt. In Radiation Trapped in the Earth’s Magnetic Field; McCormac, B.M., Ed.; D. Reidel: Hingham, MA, USA, 1966; p. 112. [Google Scholar]
- Pinto, O.; Pinto, R.C.A.; Gonzalez, W.D.; Gonzalez, A.L.C. About the origin of peaks in the spectrum of inner belt electrons. J. Geophys. Res. 1991, 96, 1857–1860. [Google Scholar] [CrossRef]
- Kudela, K.; Matisin, J.; Shuiskaya, F.K.; Akentieva, O.S.; Romantsova, T.V.; Venkatesan, D. Inner zone electron peaks observed by the “Active” satellite. J. Geophys. Res. 1992, 97, 8681–8683. [Google Scholar]
- Kikuchi, T.; Evans, D.S. Energetic electrons observed by NOAA-6 over Japan (L = 1.3) at the time of geomagnetic storm on February 8–9, 1986. In Proceedings of Research Institute of Atmospheric; Nagoya University: Nagoya, Japan, 1989; Volume 36, pp. 137–140. [Google Scholar]
- Tanaka, Y.; Nishino, M.; Iwata, A. Magnetic storm-related energetic electrons and magnetospheric electric fields penetrating into the low-latitude magnetosphere (L ~ 1.5). Planet. Space Sci. 1990, 38, 1051–1059. [Google Scholar]
- Tadokoro, H.; Tsuchiya, F.; Miyoshi, Y.; Misawa, H.; Morioka, A.; Evans, D.S. Electron flux enhancement in the inner radiation belt during moderate magnetic storms. Ann. Geophys. 2007, 25, 1359–1364. [Google Scholar]
- Su, Y.-J.; Selesnick, R.S.; Blake, J.B. Formation of the inner electron radiation belt by enhanced large-scale electric fields. J. Geophys. Res. Space Phys. 2016, 121, 8508–8522. [Google Scholar] [CrossRef]
- Selesnick, R.S.; Su, Y.-J.; Blake, J.B. Control of the innermost electron radiation belt by large-scale electric fields. J. Geophys. Res. Space Phys. 2016, 121, 8417–8427. [Google Scholar] [CrossRef]
- Selesnick, R.S.; Su, Y.-J.; Sauvaud, J.-A. Energetic electrons below the inner radiation belt. J. Geophys. Res. Space Phys. 2019, 124, 5421–5440. [Google Scholar] [CrossRef]
- Lyons, L.R.; Williams, D.J. Quantitative Aspects of Magnetospheric Physics; D. Reidel Pub. Co.: Dordrecht, The Netherlands; Boston, MA, USA, 1984. [Google Scholar] [CrossRef]
- Kelley, M.C.; Fejer, B.G.; Gonzales, C.A. An explanation for anomalous equatorial ionospheric electric fields associated with a northward turning of the interplanetary magnetic field. Geophys. Res. Lett. 1979, 6, 301–304. [Google Scholar]
- Rowland, D.E.; Wygant, J.R. Dependence of the large-scale, inner magnetospheric electric field on geomagnetic activity. J. Geophys. Res. Space Phys. 1998, 103, 14959–14964. [Google Scholar]
- Maynard, N.C.; Aggson, T.L.; Heppner, J.P. The plasmaspheric electric field as measured by ISEE 1. J. Geophys. Res. 1983, 88, 3681–3990. [Google Scholar]
- Kikuchi, T.; Hashimoto, K.K. Transmission of the electric fields to the low latitude ionosphere in the magnetosphere-ionosphere current circuit. Geosci. Lett. 2016, 3, 4. [Google Scholar] [CrossRef]
- Huang, C.-S. Continuous penetration of the interplanetary electric field to the equatorial ionosphere over eight hours during intense geomagnetic storms. J. Geophys. Res. 2008, 113, A11305. [Google Scholar] [CrossRef]
- Bhaskar, A.; Vichare, G. Characteristics of penetration electric fields to th equatorial ionosphere during southward and northward IMF turnings. J. Geophys. Res. Space Phys. 2013, 118, 4696–4709. [Google Scholar] [CrossRef]
- Hui, D.; Vichare, G. Variable responses of equatorial ionosphere during undershielding and overshielding conditions. J. Geophys. Res. Space Phys. 2019, 124, 1328–1342. [Google Scholar] [CrossRef]
- Califf, S.; Li, X.; Blum, L.; Jaynes, A.; Schiller, Q.; Zhao, H.; Malaspina, D.; Hartinger, M.; Wolf, R.A.; Rowland, D.E.; et al. THEMIS measurements of quasi-static electric fields in the inner magnetosphere. J. Geophys. Res. 2014, 119, 9939–9951. [Google Scholar] [CrossRef]
- Califf, S.; Li, X.; Wolf, R.A.; Zhao, H.; Jaynes, A.N.; Wilder, F.D.; Malaspina, D.M.; Redmon, R. Large-amplitude electric fields in the inner magnetosphere: Van Allen Probes observations of subauroral polarization streams. J. Geophys. Res. 2016, 121, 5294–5306. [Google Scholar] [CrossRef]
- Califf, S.; Li, X.; Zhao, H.; Kellerman, A.; Sarris, T.E.; Jaynes, A.; Malaspina, D.M. The role of the convection electric field in filling the slot region between the inner and outer radiation belts. J. Geophys. Res. 2017, 122, 5294–5306. [Google Scholar] [CrossRef]
- Laakso, H.; Schmidt, R. Pc4-5 pulsations in the electric field at geostationary orbit (GEOS 2) triggered by sudden storm commencements. J. Geophys. Res. 1989, 94, 6626–6632. [Google Scholar]
- Wygant, J.; Mozer, F.; Temerin, M.; Blake, J.; Maynard, N.; Singer, H.; Smiddy, M. Large amplitude electric and magnetic field signatures in the inner magnetosphere during injection of 15 MeV electron drift echoes. Geophys. Res. Lett. 1994, 21, 1739–1742. [Google Scholar]
- Kim, K.-H.; Cattell, C.A.; Lee, D.; Takahashi, K.; Yumoto, K.; Shiokawa, K.; Mozer, F.S.; Andre, M. Magnetospheric responses to sudden and quasiperiodic solar wind variations. J. Geophys. Res. 2002, 107, 1406. [Google Scholar] [CrossRef]
- Kozelova, T.V.; Lazutin, L.; Kozelov, B. Energetic particle bursts before the main substorm injection. Adv. Space Res. 2002, 30, 1805–1808. [Google Scholar]
- Shinbori, A.; Nishimura, Y.; Ono, T.; Kumamoto, A.; Oya, H. Electrodynamics in the duskside inner magnetosphere and plasmasphere during a super magnetic storm on March 13–15, 1989. Earth Planets Space 2005, 57, 643–659. [Google Scholar]
- Shinbori, A.; Ono, T.; Iizima, M.; Kumamoto, A.; Nishimura, Y. Enhancements of magnetospheric convection electric field associated with sudden commencements in the inner magnetosphere and plasmasphere regions. Adv. Space Res. 2006, 38, 1595–1607. [Google Scholar] [CrossRef]
- Nishimura, Y.; Shinbori, A.; Ono, T.; Iizima, M.; Kumamoto, A. Storm-time electric field distribution in the inner magnetosphere. Geophys. Res. Lett. 2006, 33, L22102. [Google Scholar] [CrossRef]
- Pfaff, R.; Rowland, D.; Freudenreich, H.; Bromund, K.; Le, G.; Acuña, M.; Klenzing, J.; Liebrecht, C.; Martin, S.; Burke, W.J.; et al. Observations of DC electric fields in the low-latitude ionosphere and their variations with local time, longitude, and plasma density during extreme solar minimum. J. Geophys. Res. 2010, 115, A12324. [Google Scholar] [CrossRef]
- Pfaff, R.; Uribe, P.; Fourre, R.; Kujawski, J.; Maynard, N.; Acuña, M.; Rowland, D.; Freudenreich, H.; Bromund, K.; Martin, S.; et al. The vector electric field investigation (VEFI) on the C/NOFS satellite. Space Sci. Rev. 2021, 217, 85. [Google Scholar] [CrossRef]
- Ilie, R.; Daldorff, L.K.S.; Liemohn, M.W.; Toth, G.; Chan, A.A. Calculating the inductive electric field in the terrestrial magnetosphere. J. Geophys. Res. Space Phys. 2017, 122, 5391–5403. [Google Scholar] [CrossRef]
- Liu, J.; Ilie, R.; Liemohn, M.W.; Toth, G. The role of inductive electric fields shaping the morphology, asymmetry, and energy content of the storm-ring current. J. Geophys. Res. Space Phys. 2025, 130, 5391–5403. [Google Scholar] [CrossRef]
- Evans, D.S.; Greer, M.S. Polar Orbiting Environmental Satellite Space Environment Monitor: 2. Instrument Descriptions and Archive Data Documentation; Technical Report; Space Environment Center: Boulder, CO, USA, 2004. [Google Scholar]
- Dmitriev, A.V.; Suvorova, A.V.; Veselovsky, I.S. Statistical characteristics of the heliospheric plasma and magnetic field at the Earth’s orbit during four solar cycles 20–23. In Handbook on Solar Wind: Effects, Dynamics and Interactions; Johannson, H.E., Ed.; NOVA Science Publishing: New York, NY, USA, 2009; pp. 81–144. [Google Scholar]
- Burton, R.K.; McPherron, R.L.; Russell, C.T. An empirical relationship between interplanetary conditions and Dst. J. Geophys. Res. 1975, 80, 4204–4214. [Google Scholar] [CrossRef]
- Suvorova, A.; Dmitriev, A.; Chao, J.-K.; Thomsen, M.; Yang, Y.-H. Necessary conditions for the geosynchronous magnetopause crossings. J. Geophys. Res. 2005, 110, A01206. [Google Scholar] [CrossRef]
- Dmitriev, A.V.; Suvorova, A.V.; Chao, J.-K.; Wang, C.B.; Rastaetter, L.; Panasyuk, M.I.; Lazutin, L.L.; Kovtyukh, A.S.; Veselovsky, I.S.; Myagkova, I.N. Anomalous dynamics of the extremely compressed magnetosphere during 21 January 2005 magnetic storm. J. Geophys. Res. Space Phys. 2014, 119, 877–896. [Google Scholar] [CrossRef]
- Elvidge, S.; Themens, D.R. The probability of the May 2024 geomagnetic superstorms. Space Weather 2025, 23, e2024SW004113. [Google Scholar] [CrossRef]
- Tsurutani, B.T.; Kamide, Y.; Arballo, J.; Gonzalez, W.; Lepping, R. Interplanetary causes of great and superintense magnetic storms. Phys. Chem. Earth 1999, 24, 101–105. [Google Scholar]
- Lakhina, G.S.; Tsurutani, B.T. Geomagnetic storms: Hystorical perspective to modern view. Geosci. Lett. 2016, 3, 5. [Google Scholar] [CrossRef]
- Kilpua, E.; Koskinen, H.E.J.; Pulkkinen, T.I. Coronal mass ejections and their sheath regions in interplanetary space. Living Rev. Sol. Phys. 2017, 14, 5. [Google Scholar] [CrossRef] [PubMed]
- Gjerloev, J.W. The SuperMAG data processing technique. J. Geophys. Res. 2012, 117, A09213. [Google Scholar] [CrossRef]
- Newell, P.T.; Gjerloev, J.W. SuperMAG-based partial ring current indices. J. Geophys. Res. 2012, 117, A05215. [Google Scholar] [CrossRef]
- Dmitriev, A.; Chao, J.-K.; Thomsen, M.; Suvorova, A. Geosynchronous magnetopause crossings on 29–31 October 2003. J. Geophys. Res. 2005, 110, A08209. [Google Scholar] [CrossRef]
- Burlaga, L.; Sittler, E.; Mariani, F.; Schwenn, R. Magnetic loop behind an interplanetary shock: Voyager, Helios, and IMP 8 observations. J. Geophys. Res. 1981, 86, 6673–6684. [Google Scholar]
- Da Silva, L.A.; Shi, J.; Alves, L.R.; Resende, L.C.A.; Vieira, L.E.A.; Costa, J.E.R.; Marchezi, J.P.; Agapitov, O.V.; Sibeck, D.G.; dos Santos, A.M.; et al. Space weather effects over SAMA during the extreme geomagnetic storm on May 10–11, 2024: Disturbances of the neutral and ionized atmosphere. Front. Astron. Space Sci. 2025, 12, 1550635. [Google Scholar] [CrossRef]
- Tsurutani, B.T.; Hajra, R.; Echer, E.; Gjerloev, J.W. Extremely intense (SML ≤ −2500 nT) substorms: Isolated events that are externally triggered? In Annales Geophysicae; Copernicus GmbH: Göttingen, Germany, 2015; Volume 33, pp. 519–524. [Google Scholar]
- Zong, Q.-G.; Yue, C.; Fu, S.-Y. Shock induced strong substorms and super substorms: Preconditions and associated oxygen ion dynamics. Space Sci. Rev. 2021, 217, 33. [Google Scholar] [CrossRef]
- Marchuk, R.A.; Mishin, V.V.; Penskikh, Y.V.; Klibanova, Y.Y.; Mikhalev, A.V. Geomagnetic disturbances and midlatitude airglow during the 20 December 2015 magnetic storm. J. Geophys. Res. Space Phys. 2025, 130, e2025JA033979. [Google Scholar] [CrossRef]
- Hajra, R.; Tsurutani, B.T.; Lakhina, G.S.; Lu, Q.; Du, A. Interplanetary Causes and Impacts of the 2024 May Superstorm on the Geosphere: An Overview. Astrophys. J. 2024, 974, id264. [Google Scholar] [CrossRef]
- Lin, C.S.; Yeh, H.C. Satellite observations of electric fields in the South Atlantic anomaly region during the July 2000 magnetic storm. J. Geophys. Res. 2005, 110, A03305. [Google Scholar] [CrossRef]
- Da Silva, L.A.; Shi, J.; Resende, L.C.A.; Agapitov, O.V.; Alves, L.R.; Batista, I.S.; Arras, C.; Vieira, L.E.; Deggeroni, V.; Marchezi, J.P.; et al. The role of the inner radiation belt dynamic in the generation of auroral-type sporadic E-layers over South American Magnetic Anomaly. Front. Astron. Space Sci. 2022, 9, 970308. [Google Scholar] [CrossRef]
- Blake, J.B.; Kolasinski, W.A.; Fillius, R.W.; Millen, E.G. Injection of electrons and protons with energies of tens of MeV into L < 3 on March 24, 1991. Geopys. Res. Lett. 1992, 19, 821–824. [Google Scholar]
- Li, X.; Roth, I.; Temerin, M.; Wygant, J.R.; Hudson, M.K.; Blake, J.B. Simulation of the prompt energization and transport of radiation belt particles during the March 24, 1991 SSC. Geophys. Res. Lett. 1993, 20, 2423–2426. [Google Scholar]
- Dmitriev, A.V.; Lin, R.L.; Liu, S.-Q.; Suvorova, A.V. Model prediction of geosynchronous magnetopause crossings. Space Weather 2016, 14, 530–543. [Google Scholar] [CrossRef]
- Lejosne, S.; Kunduri, B.S.; Mozer, F.S.; Turner, D.L. Energetic electron injections deep into the inner magnetosphere: A result of the subauroral polarization stream (SAPS) potential drop. Geophys. Res. Lett. 2018, 45, 3811–3819. [Google Scholar] [CrossRef]
- Califf, S.; Zhao, H.; Gkioulidou, M.; Manweiler, J.W.; Mitchell, D.G.; Tian, S. Multi-event study on the connection between subauroral polarization streams and deep energetic particle injections in the inner magnetosphere. J. Geophys. Res. Space Phys. 2022, 127, e2021JA029895. [Google Scholar] [CrossRef]
- Huang, C.-S.; Zhang, Y.; Wang, W.; Lin, D.; Wu, Q. Low-latitude zonal ion drifts and their relationship with subauroral polarization streams and auroral return flows during intense magnetic storms. J. Geophys. Res. Space Phys. 2022, 126, e2021JA030001. [Google Scholar] [CrossRef]


Disclaimer/Publisher’s Note: The statements, opinions and data contained in all publications are solely those of the individual author(s) and contributor(s) and not of MDPI and/or the editor(s). MDPI and/or the editor(s) disclaim responsibility for any injury to people or property resulting from any ideas, methods, instructions or products referred to in the content. |
© 2025 by the authors. Licensee MDPI, Basel, Switzerland. This article is an open access article distributed under the terms and conditions of the Creative Commons Attribution (CC BY) license (https://creativecommons.org/licenses/by/4.0/).