Abstract
The galaxy NGC 7469 is a bright infrared source with an active galactic nucleus (AGN) and an intense star-forming region with a radius of approximately 500 parsecs, where the star formation rate is estimated to be 20–50 . This study presents the results of spectral and photometric observations carried out during the period from 2020 to 2024 at the Fesenkov Astrophysical Institute (Almaty, Kazakhstan) and the Nasreddin Tusi Shamakhy Astrophysical Observatory (Shamakhy, Azerbaijan). Photometric data were obtained using B, V, and Rc filters, while spectroscopic observations covered the wavelength range of 4000–7000 Å. Data reduction was performed using the IRAF and MaxIm DL Pro6 software packages. An analysis of the light curves revealed that after the 2019–2020 outburst, the luminosity level of NGC 7469 remained relatively stable until the end of 2024. In November–December 2024, an increase in brightness (∼0.3–0.5 magnitudes) was recorded. Spectral data show variations in the Ha fluxes and an enhancement of them at the end of 2024. On BPT diagrams, the emission line flux ratios [OIII]/H and [NII]/H place NGC 7469 on the boundary between regions dominated by different ionization sources: AGN and star-forming regions. The electron density of the gas, estimated from the intensity ratios of the [SII] 6717, 6731 Ålines, is about . Continued observations will help to determine whether the trend of increasing brightness and emission line fluxes recorded at the end of 2024 will persist.
1. Introduction
Active galactic nuclei (AGN) emit energy due to the accretion of matter onto supermassive black holes (SMBHs) located at their centers. It is widely accepted that the primary source consists of an optically thick, geometrically thin accretion disk (peaking in the optical/UV range) and a hot region known as the corona in the innermost part of the system, which emits X-rays [1,2]. The central region is surrounded by two zones: the broad-line region (BLR), which is located closer to the nucleus and is responsible for the formation of broad emission lines, and the narrow-line region (NLR), which extends up to several kiloparsecs and contains gas of lower density [3]. One of the important properties of active galactic nuclei (AGN) is the presence of winds—powerful gas outflows moving at velocities of up to tens of thousands of kilometers per second. These winds are capable of transporting large amounts of energy and matter, significantly affecting star formation processes in their host galaxies. Galactic winds can also heat and ionize gas in the surrounding regions and influence the growth of the central black hole. Thus, the disk wind is considered one of the sources of ionizing radiation, along with the AGN itself and the accretion disk. A disk wind can be driven by the radiation pressure from the active nucleus or the disk acting on the surrounding gas and dust. It gives rise to multiple high-density clouds and, in some cases, high-velocity jets [4]. Galactic winds have a particularly strong impact in relatively dense environments and therefore at smaller radii. The disk wind is launched perpendicular to the surface of the accretion disk and does not shield the broad-line region (BLR) [5,6]. In some AGNs, the disk wind may be the source of gamma-ray emission [7]. The motion of disk winds leads to the appearance of blueshifted (or redshifted) emission and absorption components in the UV and X-ray spectra of galaxies. Disk winds may also influence the accretion disk itself, altering the conditions for the launching of subsequent outflows [8]. The properties of disk winds are used to study the structure of the BLR in Seyfert galaxies, as discussed, for example, in [9,10,11]. According to the unified model of AGN, the main differences between Seyfert galaxies of types Sy1 and Sy2 are explained by different viewing angles with respect to the observer. Other factors, such as the accretion rate and the influence of the host galaxy, also play a role [12,13,14]. The relationship between optical and X-ray spectra, as well as the similarities and differences in the spectral properties of various types of Seyfert galaxies, are discussed in [15,16,17,18].
The existence of changing-look active galactic nuclei (CL AGN) is confirmed by the appearance and disappearance of broad emission lines over time intervals of 100–5000 days, which are shorter than those predicted by traditional accretion disk models. The term CL AGN was initially introduced to describe systems that change their X-ray spectra from weakly or non-absorbed to heavily absorbed or Compton-thick states [19]. However, in recent years, this term has been widely used to describe changes in optical spectra, particularly variations in the width of emission lines during transitions from type 1 to type 2 (or 1.8, 1.9) and vice versa [20,21]. Such changes impose strict constraints on the physics of the outer accretion disk, the BLR, and the coronal region.
The Seyfert galaxy NGC 7469, located at coordinates , is classified as a type Sy . It exhibits high luminosity in the infrared wavelength range. The central source is surrounded by a star-forming region with a radius of about 500 parsecs and a star formation rate of 20–50 [22,23,24]. The spectral and photometric variability of NGC 7469 has been studied by many authors. In particular, light curves over different time intervals are presented in [25,26,27,28,29]. The multi-wavelength campaign [30] dedicated to the study of NGC 7469 focuses on the physical structure of the active galactic nucleus (AGN) wind using high-resolution X-ray spectroscopy with Chandra HETGS and photoionization modeling. The authors concluded that variations in the ionizing continuum lead to changes in the ionization state of the wind components [30,31]. Observations of NGC 7469 conducted in 2016–2019 with the -600 telescope of the Shamakhy Observatory recorded three flares in the B, V, and filters [32]. Results of spectral studies in the optical range are reported in [33,34,35,36]. The time lag between the response of optical emission lines and changes in X-ray and UV radiation allows for an estimation of the size of the BLR region. This parameter has been repeatedly determined by various authors [1,37,38,39,40]. For instance, Vincentelli et al. (2023) [1] reported a ∼1-day lag between UV and optical bands, while Peterson et al. (2014) [34] found broader centroid distributions, with delays ranging from near-zero (He II) to ∼10 days for H; earlier studies indicated lags of 4–5 days for H. In the X-ray/UV domain, Kammoun et al. (2021) [37] confirmed lag spectra after filtering long-term trends. During a four-month monitoring campaign, variations in the time lag depending on both wavelength and temporal scale were also observed [1]. One of the reasons for these changes is the varying contribution of short-wavelength emission sources at different epochs—for instance, the involvement or enhancement of emission from the hot corona or the star-forming region. The interaction between the galactic nucleus and the star-forming zone is discussed in [41]. High-angular-resolution imaging and infrared observations showed that the nucleus has minimal influence on the star-forming region. Studies using the VLT/MUSE integral field spectrograph revealed the presence of two types of outflows in the circumnuclear region: a slow one intersecting the star-forming ring and a faster one detected in the [O III] line, likely driven by AGN activity [42]. Recent observations with the James Webb Space Telescope (JWST) identified 36 new star-forming regions in the center of NGC 7469, confirming ongoing star formation activity [43].
This paper presents the results of spectral and photometric observations of NGC 7469 carried out at the Fesenkov Astrophysical Institute (Almaty, Kazakhstan) and the Nasreddin Tusi Shamakhy Astrophysical Observatory (Shamakhy, Azerbaijan).
The aim of the study. Given the significant photometric and spectral variability of NGC 7469, we planned to estimate the current state of the object using data from our new observations.
The layout of our paper is as follows. In Section 2, a description of the procedure and methods of observation and processing of results is provided. In Section 3, we describe the results of observations and data obtained from analysis of light curves and lag-correlations between B and V values, as well as Rc and V. The change in fluxes of the emission lines and in the continuum is considered. BMP diagrams show that both ionization sources, AGN and star formation, may contribute equally to the ionization of the emission-line regions. In Section 4, we discuss our results, in particular in the context of the long-term changes in the brightness of the galaxy and its current state. In Section 5, it is assumed that the observed increase in brightness and fluxes in H , which began at the end of 2024, perhaps marks the beginning of a new active stage in the evolution of NGC 7469. When the parameters and characteristics of the galaxy were determined, we relied on the Lambda-Cold Dark Matter cosmological model.
2. Observations and Data Reduction
The primary spectral observations of NGC 7469 were carried out using the AZT-8 telescope . A diffraction spectrograph equipped with an STT-3200 CCD camera (2184 × 1472) was used. The width of the entrance slit was . The spectral resolution was approximately . For flux calibration, spectra of standard stars with known energy distributions were obtained immediately before or after the object spectrum. The observational data were processed using IRAF version 2.16 [44] software packages, with the application of DARK and FLAT calibration frames. A He–Ne–Ar lamp spectrum was used for wavelength calibration. All results were corrected for atmospheric extinction and redshift. Several spectra of NGC 7469 were also obtained with the m AZT-20 telescope at the Fesenkov Astrophysical Institute. Its innovative spectrograph is equipped with volume phase holographic gratings and an EMCCD camera. Additional spectral observations of the galaxy were conducted using the 2-m telescope at the Shamakhi Astrophysical Observatory.
Since 2016, photometric observations in the optical wavelength range have been conducted at the Tian Shan Astronomical Observatory (TShAO) of the Fesenkov Institute. The 1 m Carl Zeiss telescope equipped with an Alta F16M CCD camera (4096 × 4096 pixels, 9 m), and a set of BVRc filters has been used. The field of view (FOV) is , with a scale of /pixel. Field stars with known BVRc magnitudes were used as standards for differential photometry (Table 1). Image processing was performed using dark and flat frames. The galaxy’s brightness was measured using a aperture and the method of differential photometry with the MaximDL Pro6 [45] software package. To convert instrumental magnitudes to the standard BVRc photometric system, appropriate transformation equations were applied [29].

Table 1.
Characteristics of reference stars used for photometric studies of NGC 7469.
3. Results of Photometric and Spectral Studies
The results of our photometric observations from 2020 to 2024 are presented in Table 2. The light curve of the galaxy NGC 7469 for the period 2013–2024, based on our data, is shown in Figure 1.
Table 2.
B, V, Rc magnitudes of NGC 7469 obtained in 2020–2024.
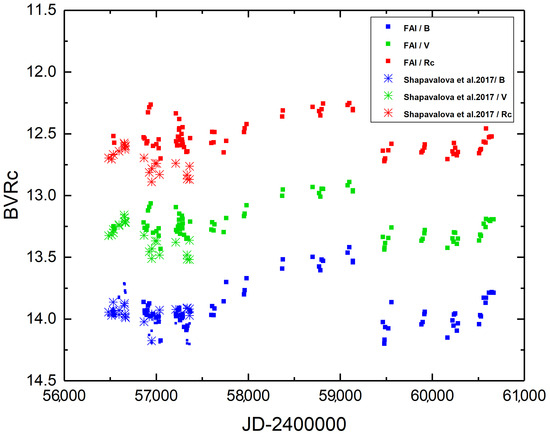
Figure 1.
Light curves obtained in B (blue), V (green), (red) filters during 2013–2024. The X-axis shows date—2400000, and the Y-axis represents stellar magnitudes. Crosses denote data from [28]; other points are FAI data.
Since 2017, a gradual brightening has been noted, with a significant increase by the end of 2019. A high brightness level persisted until the end of 2020 [35]. Subsequently, the galaxy’s brightness remained stable at a relatively low level until October 2024. An increase of approximately ∼0.3–0.5 magnitudes occurred during the last two months of the previous year (Figure 1).
Based on the plot shown in Figure 2, it can be concluded that as the brightness of the galaxy increases, the color indices and decrease; in other words, luminosity of NGC 7469 in the blue wavelengths of the spectrum grows faster than in the red one. Such a “bluer-when-brighter” (BWB) effect is found in many galaxies and quasars [46,47,48,49].
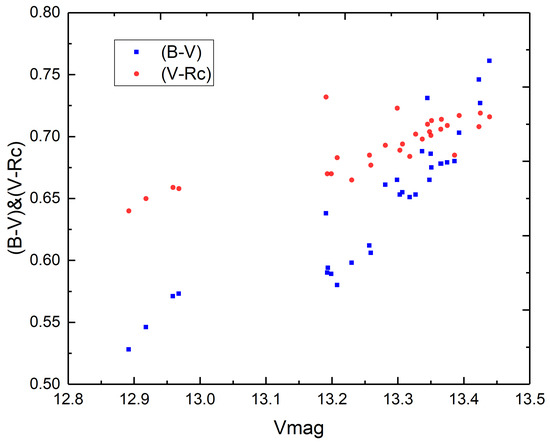
Figure 2.
Dependence of color indices on V magnitudes. X-axis: ; Y-axis: (blue) and (red).
The cross-correlation analysis between the B, V, and filters shows no significant time delay within the measurement uncertainties, indicating synchronous brightness variations at different wavelengths. However, the low cadence of observations significantly reduces the accuracy of our estimates.
The minimum temporal resolution of our observations is 1 day, as the intervals between adjacent epochs generally do not exceed 10–30 days. This value defines the step size used in the lag estimation during the cross-correlation analysis shown in Figure 3. The diagram demonstrates that the maxima of the cross-correlation functions for V vs. B and V vs. occur at zero lag (Lag ), and the width of the central peak is approximately days, indicating a high degree of synchrony in the variations. Taking into account the data sampling and the symmetry of the correlation peaks, the uncertainty in lag estimation is day. Therefore, we conclude that the time lag between the B, V, and filters is either absent or within day, indicating simultaneous brightness variations across these bands.
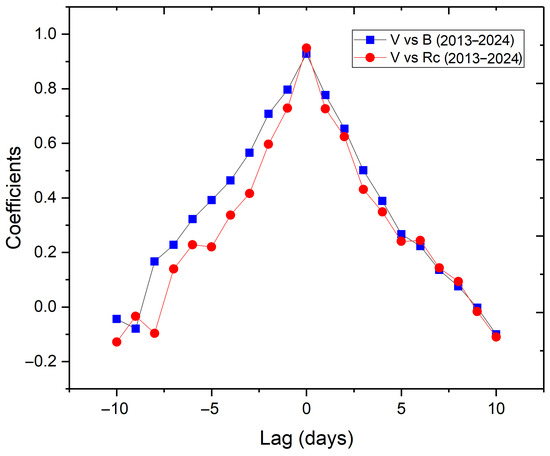
Figure 3.
Lag-correlation between brightness values in the B and V filters, as well as and V, for the galaxy NGC 7469 during the period 2013–2024.
Spectral observations of the galaxy NGC 7469 were carried out using several telescopes. Figure 4 and Figure 5 show examples of spectra obtained with different instruments. These spectra cover various wavelength ranges and have different resolutions. The reduced spectra, obtained from multiple telescopes in the 4000–7200 Å range with varying spectral resolutions (see Table 3), were further processed in IRAF [44]. Continuum fitting was performed interactively using low-order polynomials in carefully selected continuum windows. Emission lines were modeled with Gaussian profiles via the splot task in IRAF, and line fluxes were computed by integrating the line profile after subtracting the local continuum. The accuracy of line measurements was assessed visually and by analyzing residuals. The line ratios used for diagnostics (e.g., BPT diagram) are based on these measurements, and the results are discussed in relation to nuclear activity and star formation in Section 4. Galactic extinction corrections were applied using values from NED based on the [50] maps.
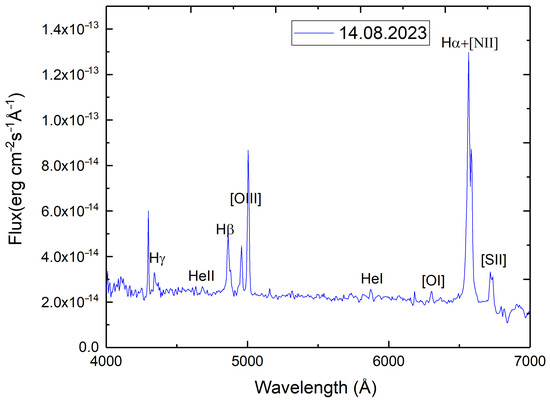
Figure 4.
Spectrum of NGC 7469, in the spectral range from Å to Å, obtained at the 2 m telescope (Shamakhy, Azerbaijan).
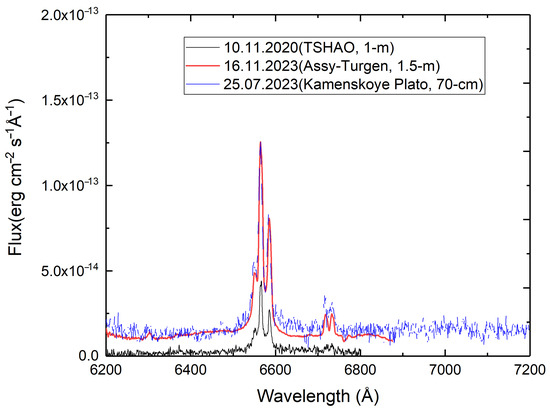
Figure 5.
Spectra of NGC 7469 in the spectral range from Å to Å, obtained at the -m, 70 cm and 1 m telescopes of FAI.
Table 3.
Fluxes in the emission lines and continuum in the spectrum of NGC 7469.
During the processing of the spectral observations, fluxes in the emission lines and in the continuum were obtained.
Figure 6 shows a trend of gradual increase in fluxes in the H emission line, indicating that the observed flux variations are driven by variations in the broad components of the emission lines. In the spectrum obtained on 16 November 2023, with the AZT-20 telescope, the intensity ratio of the [S ii] lines was measured as (see Table 3). Assuming an electron temperature of K, this corresponds to an electron density of –1000 cm−3, according to the diagnostic diagrams [51]. The estimation assumes isothermal conditions, a homogeneous excitation region, and negligible influence of radiation pressure.
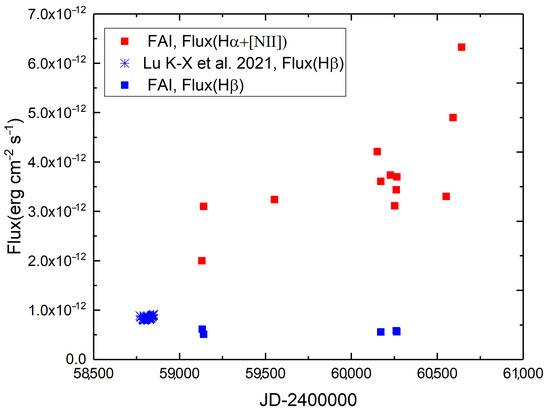
Figure 6.
Variations in the emission line fluxes of H and H. The X-axis shows date—2400000, and the Y-axis shows absolute fluxes H and H. The H fluxes are shown. The data from Lu et al. [38] are marked with blue asterisks.
The low continuum level at the end of 2020 corresponds to the photometric measurements and indicates a decline in AGN activity following a flash. Subsequently, in 2022–2023, an increase in the continuum is observed. Finally, during late 2023–2024, the rise in brightness and continuum level, along with the increase in emission line fluxes, may indicate the onset of a new active phase (see Figure 7 for the spectral energy distribution of NGC 7469). The galaxy NGC 7469 has a complex circumnuclear structure. The central source is surrounded by a ring-like star-forming region with a radius of about 500 parsecs. One of the challenges associated with such objects is identifying the dominant source of ionizing photons. In addition to the central source, the accretion disk, hot corona, and star-forming region can also contribute to ionization. The BPT diagram is used to identify the main sources of ionization and to investigate the relationship between AGN ionizing radiation and the contribution from star-forming regions [52,53]. Table 4 presents the flux ratios of the emission lines H, H, [O iii] 5007 Å, [N ii] 6583 Å, and [S ii] 6717 + 6731 Å. These lines were chosen because they are the strongest emission features in AGN spectra, and the corresponding ratios are only weakly affected by extinction (see Figure 8 and Figure 9).
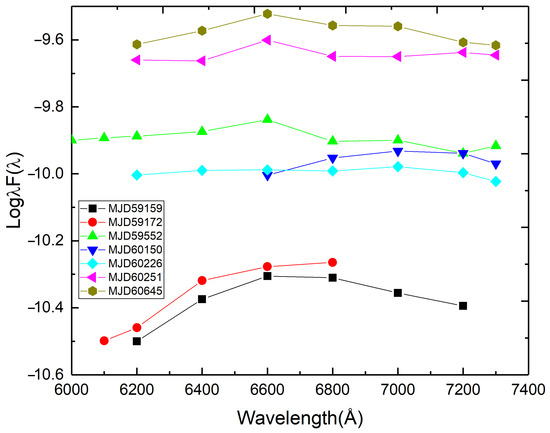
Figure 7.
The spectral energy distribution (SED) of NGC 7469 on different observation dates. The X-axis represents wavelength Å, and the Y-axis represents .
Table 4.
Line ratios and their logarithms for NGC 7469.
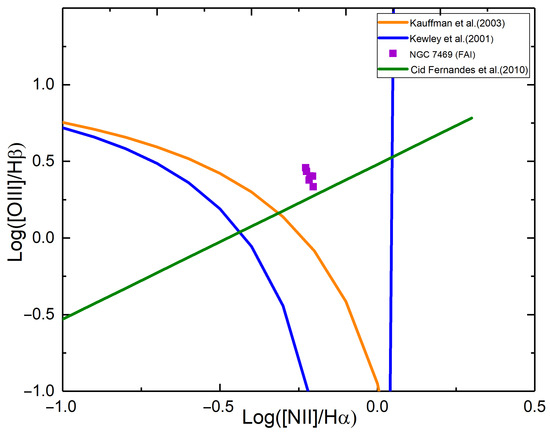
Figure 8.
Relationship between emission line intensity ratios in the spectrum of NGC 7469 [54,55,56].
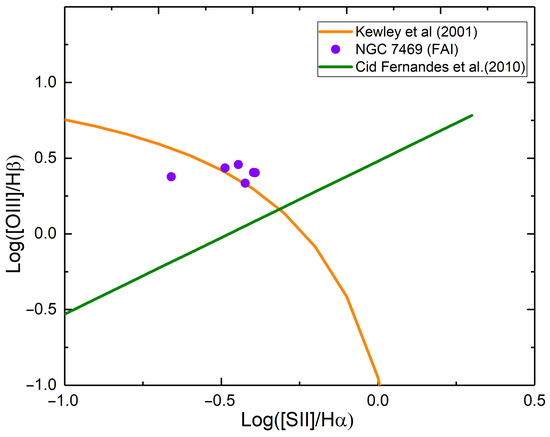
Figure 9.
Relationship between emission line intensity ratios in the spectrum of NGC 7469 [55,56].
Figure 8 shows the positions of different classes of objects based on the intensity ratios of the emission lines vs. .
Figure 9 shows the positions of different classes of objects based on the intensity ratios of the emission lines vs. for NGC 7469.
On the BPT diagram, the galaxy NGC 7469 is located slightly above and slightly below the boundary defined by Kauffmann et al. [54], falling within the region of potential model uncertainties indicated by the authors of [55,56]. This boundary separates objects where either active galactic nuclei or star-forming regions dominate the ionization processes. The position of the studied galaxy suggests that it occupies an intermediate zone. In other words, both ionization sources—AGN and star formation—may contribute equally to the ionization of the emission-line-forming regions.
4. Discussion
We carried out a series of photometric and spectroscopic observations of NGC 7469 in order to identify the signs of its variability. The light curves in the three filters have similar forms (Figure 1). The time lags between B mag and V mag and between V mag and R mag are close to zero. The color indices decrease as the brightness of the galaxy increases; in other words, there is a “bluer-when-brighter” (BWB) trend. After the 2019 outburst, the galaxy’s brightness remained at a low level with fluctuations of – mag for three years (Figure 1). At the end of 2024, an increase in the brightness of the galaxy, accompanied by a decrease in color indices, is observed.
Most of our spectra were obtained with an entrance slit of 7″. During our observations, the emission fluxes in the lines and in the continuum experience synchronous fluctuations. Good correlations between the H and H fluxes variability, and between the indicated emission fluxes and intensities of the corresponding continuum, were found (Figure 6). The relatively low spectral resolution of our data did not allow us to select the broad emission components in the H and H lines. The spectral energy distribution (SED) of NGC 7469 on different observation dates is presented in Figure 8. The low continuum level at the end of 2020 corresponds to the photometric measurements and indicates a decline in AGN activity following a flash. Subsequently, in 2022–2023, an increase in the continuum is observed. Finally, during late 2023–2024, the rise in continuum level, along with the increase in emission line fluxes, may indicate the onset of a new active phase.
The variability of the galaxy NGC 7469 can be provoked by the complex multi-component structure of the circumnuclear region. The main sources of ionization of the line-emitting regions are the accretion disk and the hot corona. The continuum flux from the accretion disk varies with time, and these variations are echoed later by changes in the flux of the broad emission lines. Optical variations, on timescales of days and up to a few weeks, can be fully explained by the variable X-rays as they illuminate the accretion disc [57]. In the galaxy NGC 7469, the black hole is surrounded by a star-forming zone (SF), consisting of at least two rings. The study of the SF structure, the interaction between AGN and SF, and their influence on the observed spectrum were considered in the papers [41,57,58,59]. Galactic outflows can be driven either by starburst processes or by an active galactic nucleus. Recent discovery of new star-forming regions suggests a potentially growing role of this source in the ionization processes. Moreover, the possible influence of the hot corona on the degree of gas ionization cannot be completely ruled out. There are enough sources of possible variability. As for the galaxy NGC 7469, the first signs of its activity appeared in 2023–2024. Further observations will show what will be the next stage of this object’s evolution.
5. Conclusions
This study presents the results of spectral and photometric observations of the active galaxy NGC 7469, carried out primarily during 2020–2024 at the Fesenkov Astrophysical Institute (Almaty, Kazakhstan) and the Nasreddin Tusi Shamakhi Astrophysical Observatory (Shamakhy, Azerbaijan). Analysis of the light curves and spectral characteristics has revealed key features of the galaxy’s behavior in the optical range.
After the 2019 outburst, the galaxy’s brightness decreased to a minimum and remained at this level for about three years with irregular fluctuations within – magnitudes. Similar behaviour is typical for many Seyfert galaxies. All brightness variations occurred synchronously across three filters; thus, the LAG values obtained from cross-correlation analysis between B and V, and V and , equaled zero. During this period, changes in emission-line fluxes were observed, possibly caused by changes in the broad components of emission profiles H and H . The electron density Ne[SII] of 900– was determined. Analysis of BPT diagrams shows that the AGN and star-formation zone may be the source of ionizing energy in the galaxy. Active changes in the galaxy: an increase in brightness and fluxes in H began at the end of 2024. Perhaps they mark the beginning of a new active stage in the evolution of NGC 7469. Only new observations may confirm or disprove this assumption.
Author Contributions
Conceptualization, methodology and visualization, S.S. and L.K.; formal analysis, L.K. and S.S.; investigation, S.S. and L.K.; resources, V.K., N.H. and I.R.; data curation, S.S. and L.A.; writing—original draft preparation, review and editing, S.S. and L.K.; supervision, project administration and funding acquisition, S.S. All authors have read and agreed to the published version of the manuscript.
Funding
This research is funded by the Ministry of Science and Higher Education of the Republic of Kazakhstan (Grant No. AP22784884 and Grant No. BR24992759 and No. BR24992807).
Data Availability Statement
The original contributions presented in this study are included in the article. Further inquiries can be directed to the corresponding author.
Acknowledgments
The authors express their gratitude to the SHAO team and the FAI observers for their assistance in organizing and conducting the spectral and photometric observations.
Conflicts of Interest
The authors declare no conflicts of interest. The funders had no role in the design of the study, in the collection, analyses or interpretation of data, in the writing of the manuscript or in the decision to publish the results.
References
- Vincentelli, F.M.; Beard, M.; Hardy, I.M.; Cackett, E.; Horne, K.; Pahari, M. The evolution of the UV /optical lag spectrum of NGC 7469 seen by the Liverpool Telescope. Astron. Nachrichten 2023, 344, e20230018. [Google Scholar] [CrossRef]
- Lynden-Bell, D. Galactic Nuclei as Collapsed Old Quasars. Nature 1969, 223, 690–694. [Google Scholar] [CrossRef]
- Osterbrock, D.E. Astrophysics of Gaseous Nebulae and Active Galactic Nuclei; University Science Books: Melville, NY, USA, 1989. [Google Scholar]
- Dyda, S.; Davis, S.W.; Proga, D. Time-dependent AGN disc winds—I. X-ray irradiation. Mon. Not. R. Astron. Soc. 2024, 530, 5143–5154. [Google Scholar] [CrossRef]
- Netzer, H. Disc winds spectral energy distribution and the variability time-scale of active galactic nuclei. Mon. Not. R. Astron. Soc. 2025, 539, 3242–3249. [Google Scholar] [CrossRef]
- Costa, T.; Sijacki, D.; Haehnelt, M.G. Feedback from active galactic nuclei: Energy- versus momentum-driving. Mon. Not. R. Astron. Soc. 2014, 444, 2355–2376. [Google Scholar] [CrossRef]
- Sakai, N.; Yamada, T.; Inoue, Y.; Owen, E.R.; Michiyama, T.; Tomaru, R.; Fukazawa, Y. The Disk Wind Contribution to the Gamma-Ray Emission from the Nearby Seyfert Galaxy GRS 1734-292. Astrophys. J. 2025, 980, 131. [Google Scholar] [CrossRef]
- Ganguly, S. The Effects of Winds on Accretion Disks and Spectra of X-Ray Binaries and Active Galactic Nuclei. Bull. Am. Astron. Soc. 2023, 241, 217.01D. [Google Scholar]
- Kollatschny, W.; Zetzl, M. Accretion disk wind as explanation for the broad-line region structure in NGC 5548. Astron. Astrophys. 2013, 551, L6. [Google Scholar] [CrossRef]
- Tombesi, F.; Meléndez, M.; Veilleux, S.; Reeves, J.N.; González-Alfonso, E.; Reynolds, C.S. Wind from the black-hole accretion disk driving a molecular outflow in an active galaxy. Nature 2015, 519, 436–438. [Google Scholar] [CrossRef]
- Xu, X.; Wang, J. Spatially Resolved Ionized Outflows Extending to 2 kpc in Seyfert 1 Galaxy NGC 7469 Revealed by the Very Large Telescope/MUSE. Astrophys. J. 2022, 933, 110. [Google Scholar] [CrossRef]
- Antonucci, R. Unified Models for Active Galactic Nuclei and Quasars. Annu. Rev. Astron. Astrophys. 1993, 31, 473–521. [Google Scholar] [CrossRef]
- Urry, C.M.; Padovani, P. Unified Schemes for Radio-Loud Active Galactic Nuclei. Publ. Astron. Soc. Pac. 1995, 107, 803. [Google Scholar] [CrossRef]
- Elvis, M. A Structure for Quasars. Astrophys. J. 2000, 545, 63–76. [Google Scholar] [CrossRef]
- Grupe, D. A Complete Sample of Soft X-Ray-selected AGNs. II. Statistical Analysis*. Astron. J. 2004, 127, 1799. [Google Scholar] [CrossRef]
- Sulentic, J.W.; Zwitter, T.; Marziani, P.; Dultzin-Hacyan, D. Eigenvector 1: An Optimal Correlation Space for Active Galactic Nuclei. Astrophys. J. 2000, 536, L5–L9. [Google Scholar] [CrossRef]
- Xu, D.; Komossa, S.; Zhou, H.; Wang, T.; Wei, J. The Narrow-Line Region of Narrow-Line and Broad-Line Type 1 Active Galactic Nuclei. I. A Zone of Avoidance in Density. Astrophys. J. 2007, 670, 60–73. [Google Scholar] [CrossRef]
- Fabian, A.C.; Zoghbi, A.; Wilkins, D.; Dwelly, T.; Uttley, P.; Schartel, N.; Miniutti, G.; Gallo, L.; Grupe, D.; Komossa, S.; et al. 1H 0707-495 in 2011: An X-ray source within a gravitational radius of the event horizon. Mon. Not. R. Astron. Soc. 2012, 419, 116–123. [Google Scholar] [CrossRef]
- Komossa, S. Tidal disruption of stars by supermassive black holes: Status of observations. J. High Energy Astrophys. 2015, 7, 148–157. [Google Scholar] [CrossRef]
- Matt, G.; Guainazzi, M.; Maiolino, R. Changing look: From Compton-thick to Compton-thin, or the rebirth of fossil active galactic nuclei. Mon. Not. R. Astron. Soc. 2003, 342, 422–426. Available online: https://academic.oup.com/mnras/article-pdf/342/2/422/3417682/342-2-422.pdf (accessed on 5 July 2025).
- LaMassa, S.M.; Cales, S.; Moran, E.C.; Myers, A.D.; Richards, G.T.; Eracleous, M.; Heckman, T.M.; Gallo, L.; Urry, C.M. The Discovery of the First “Changing Look” Quasar: New Insights into the Physics and Phenomenology of Active Galactic Nuclei. Astrophys. J. 2015, 800, 144. [Google Scholar] [CrossRef]
- Genzel, R.; Weitzel, L.; Tacconi-Garman, L.E.; Blietz, M.; Cameron, M.; Krabbe, A.; Lutz, D.; Sternberg, A. Infrared Imaging and Spectroscopy of NGC 7469. Astrophys. J. 1995, 444, 129. [Google Scholar] [CrossRef]
- Soifer, B.T.; Bock, J.J.; Marsh, K.; Neugebauer, G.; Matthews, K.; Egami, E.; Armus, L. High Spatial Resolution Mid-Infrared Observations of Three Seyfert Galaxies. Astron. J. 2003, 126, 143–152. [Google Scholar] [CrossRef]
- Song, Y.; Linden, S.T.; Evans, A.S.; Barcos-Muñoz, L.; Privon, G.C.; Yoon, I.; Murphy, E.J.; Larson, K.L.; Dí az-Santos, T.; Armus, L.; et al. A Comparison between Nuclear Ring Star Formation in LIRGs and in Normal Galaxies with the Very Large Array. Astrophys. J. 2021, 916, 73. [Google Scholar] [CrossRef]
- Merkulova, N.I. UBVRI Light Curves of the Seyfert Galaxy NGC 7469 During 1990–1998: Microvariability. Astron. J. 2000, 119, 631. [Google Scholar] [CrossRef]
- Doroshenko, V.T.; Sergeev, S.G.; Efimov, Y.S.; Klimanov, S.A.; Nazarov, S.V. X-ray and optical variability of the seyfert galaxy NGC 7469. Astron. Lett. 2010, 36, 611–633. [Google Scholar] [CrossRef]
- Ugol’kova, L.S.; Artamonov, B.P.; Shimanovskaya, E.V.; Bruevich, V.V.; Burkhonov, O.; Egamberdiev, S.A.; Metlova, N.V. Study of the nuclear activity of the Seyfert galaxy NGC 7469 over the period of observations 2008–2014. Astron. Lett. 2017, 43, 233–240. [Google Scholar] [CrossRef]
- Shapovalova, A.I.; Popović, L.Č.; Chavushyan, V.H.; Afanasiev, V.L.; Ilić, D.; Kovačević, A.; Burenkov, A.N.; Kollatschny, W.; Spiridonova, O.; Valdes, J.R.; et al. Long-term optical spectral monitoring of NGC 7469. Mon. Not. R. Astron. Soc. 2017, 466, 4759–4775. [Google Scholar] [CrossRef][Green Version]
- Shomshekova, S.A.; Reva, I.V.; Kondratyeva, L. Standardization of the photometric system of the 1-meter telescope on TSHAO. Natl. Acad. Sci. Repub. Kazakhstan Phys.-Math. Ser. 2017, 4, 155–161. [Google Scholar]
- Mehdipour, M.; Kaastra, J.S.; Costantini, E.; Behar, E.; Kriss, G.A.; Bianchi, S.; Branduardi-Raymont, G.; Cappi, M.; Ebrero, J.; Di Gesu, L.; et al. Multi-wavelength campaign on NGC 7469. III. Spectral energy distribution and the AGN wind photoionisation modelling, plus detection of diffuse X-rays from the starburst with Chandra HETGS. Astron. Astrophys. 2018, 615, A72. [Google Scholar] [CrossRef]
- Trevese, D.; Saturni, F.G.; Vagnetti, F.; Perna, M.; Paris, D.; Turriziani, S. A multi-epoch spectroscopic study of the BAL quasar APM 08279+5255. I. C IV absorption variability. Astron. Astrophys. 2013, 557, A91. [Google Scholar] [CrossRef]
- Binnatova, Z.F.; Abdullayev, B.I.; Huseynov, N.A. BVRcIc Monitoring of the seyfert galaxy of the first type NGC 7469. Astron. J. Azerbaijan 2023, 18, 47–53. [Google Scholar] [CrossRef]
- Kim, D.C.; Sanders, D.B.; Veilleux, S.; Mazzarella, J.M.; Soifer, B.T. Optical Spectroscopy of Luminous Infrared Galaxies. I. Nuclear Data. Astrophys. J. Suppl. 1995, 98, 129. [Google Scholar] [CrossRef]
- Peterson, B.M.; Grier, C.J.; Horne, K.; Pogge, R.W.; Bentz, M.C.; De Rosa, G.; Denney, K.D.; Martini, P.; Sergeev, S.G.; Kaspi, S.; et al. Reverberation Mapping of the Seyfert 1 Galaxy NGC 7469. Astrophys. J. 2014, 795, 149. [Google Scholar] [CrossRef]
- Shomshekova, S.A.; Denissyuk, E.K.; Valiullin, R.R.; Kusakin, A.V.; Reva, I.V.; Krugov, M.A. Photometric and Spectral Researches of the seyfert galaxies NGC 4151 and NGC 7469. News Natl. Acad. Sci. Repub. Kazakhstan Phys.-Math. Ser. 2020, 4, 127–134. [Google Scholar]
- Denissyuk, E.K.; Valiullin, R.R.; Shomoshekova, S.A.; Kondratyeva, L.N.; Reva, I.V.; Aimanova, G.A.; Krugov, M.A. Results of Spectral Observations of 15 Seyfert Galaxies. Astrophysics 2022, 65, 447–455. [Google Scholar] [CrossRef]
- Kammoun, E.S.; Papadakis, I.E.; Dovčiak, M. Modelling the UV/optical continuum time-lags in AGN. Mon. Not. R. Astron. Soc. 2021, 503, 4163–4171. [Google Scholar] [CrossRef]
- Lu, K.X.; Wang, J.G.; Zhang, Z.X.; Huang, Y.K.; Xu, L.; Xin, Y.X.; Yu, X.G.; Ding, X.; Wang, D.Q.; Feng, H.C. Reverberation Mapping Measurements of Black Hole Masses and Broad-line Region Kinematics in Mrk 817 and NGC 7469. Astrophys. J. 2021, 918, 50. [Google Scholar] [CrossRef]
- Pahari, M.; McHardy, I.M.; Vincentelli, F.; Cackett, E.; Peterson, B.M.; Goad, M.; Gültekin, K.; Horne, K. Evidence for variability time-scale-dependent UV/X-ray delay in Seyfert 1 AGN NGC 7469. Mon. Not. R. Astron. Soc. 2020, 494, 4057–4068. [Google Scholar] [CrossRef]
- Nandra, K.; Papadakis, I.E. Temporal Characteristics of the X-Ray Emission of NGC 7469. Astrophys. J. 2001, 554, 710–724. [Google Scholar] [CrossRef]
- Feuillet, L.M.; Kraemer, S.; Meléndez, M.B.; Fischer, T.C.; Schmitt, H.R.; Reeves, J.N.; Trindade Falcão, A. Core Revelations: The Star Formation and Active Galactic Nucleus Connection at the Heart of NGC 7469. Astrophys. J. 2025, 983, 49. [Google Scholar] [CrossRef]
- Robleto-Orús, A.C.; Torres-Papaqui, J.P.; Longinotti, A.L.; Ortega-Minakata, R.A.; Sánchez, S.F.; Ascasibar, Y.; Bellocchi, E.; Galbany, L.; Chow-Martínez, M.; Trejo-Alonso, J.J.; et al. MUSE Reveals Extended Circumnuclear Outflows in the Seyfert 1 NGC 7469. Astrophys. J. 2021, 906, L6. [Google Scholar] [CrossRef]
- Bohn, T.; Inami, H.; Diaz-Santos, T.; Armus, L.; Linden, S.T.; U, V.; Surace, J.; Larson, K.L.; Evans, A.S.; Hoshioka, S.; et al. GOALS-JWST: NIRCam and MIRI Imaging of the Circumnuclear Starburst Ring in NGC 7469. Astrophys. J. 2023, 942, L36. [Google Scholar] [CrossRef]
- Fitzpatrick, M.; Placco, V.; Bolton, A.; Merino, B.; Ridgway, S.; Stanghellini, L. Modernizing IRAF to Support Gemini Data Reduction. arXiv 2024, arXiv:2401.01982. [Google Scholar]
- Astronomical Imaging Software. Available online: https://diffractionlimited.com/product/maxim-dl/ (accessed on 2 June 2025).
- Negi, V.; Joshi, R.; Chand, K.; Chand, H.; Wiita, P.; Ho, L.C.; Singh, R.S. Optical flux and colour variability of blazars in the ZTF survey. Mon. Not. R. Astron. Soc. 2021, 510, 1791–1800. [Google Scholar] [CrossRef]
- Rakshit, S.; Stalin, C.S. Optical Variability of Narrow-line and Broad-line Seyfert 1 Galaxies. Astrophys. J. 2017, 842, 96. [Google Scholar] [CrossRef]
- Sukanya, N.; Stalin, C.S.; Joseph, P.; Rakshit, S.; Praveen, D.; Damle, R. Long-term ultraviolet variability of Seyfert galaxies. J. Astrophys. Astron. 2018, 39, 65. [Google Scholar] [CrossRef]
- Artamonov, B.P.; Bruevich, V.V.; Gusev, A.S.; Ezhkova, O.V.; Ugol’Kova, L.S.; Shimanovskaya, E.V. Nuclear activity of the Seyfert galaxy NGC 7469 in 1990–2006: Observations from the Mt. Maidanak Observatory. Astron. Rep. 2010, 54, 767–775. [Google Scholar] [CrossRef]
- Schlafly, E.F.; Finkbeiner, D.P. Measuring Reddening with Sloan Digital Sky Survey Stellar Spectra and Recalibrating SFD. Astrophys. J. 2011, 737. [Google Scholar] [CrossRef]
- Osterbrock, D.E.; Ferland, G.J. Astrophysics of Gaseous Nebulae and Active Galactic Nuclei, 2nd ed.; University Science Books: Melville, NY, USA, 2006. [Google Scholar]
- Baldwin, J.A.; Phillips, M.M.; Terlevich, R. Classification Parameters for the Emission-Line Spectra of Extragalactic Objects. Publ. Astron. Soc. Pac. 1981, 93, 5. [Google Scholar] [CrossRef]
- Veilleux, S.; Osterbrock, D.E. Spectral Classification of Emission-Line Galaxies. Astrophys. J. Suppl. 1987, 63, 295. [Google Scholar] [CrossRef]
- Kauffmann, G.; Heckman, T.M.; Tremonti, C.; Brinchmann, J.; Charlot, S.; White, S.D.M.; Ridgway, S.E.; Brinkmann, J.; Fukugita, M.; Hall, P.B.; et al. The host galaxies of active galactic nuclei. Mon. Not. R. Astron. Soc. 2003, 346, 1055–1077. [Google Scholar] [CrossRef]
- Kewley, L.J.; Heisler, C.A.; Dopita, M.A.; Lumsden, S. Optical Classification of Southern Warm Infrared Galaxies. Astrophys. J. Suppl. 2001, 132, 37–71. [Google Scholar] [CrossRef]
- Cid Fernandes, R.; Stasińska, G.; Schlickmann, M.S.; Mateus, A.; Vale Asari, N.; Schoenell, W.; Sodré, L. Alternative Diagnostic Diagrams and the ‘Forgotten’ Population of Weak Line Galaxies in the SDSS. Mon. Not. R. Astron. Soc. 2010, 403, 1036–1053. [Google Scholar] [CrossRef]
- Papoutsis, M.; Papadakis, I.E.; Panagiotou, C.; Dovčiak, M.; Kammoun, E. X-ray reverberation as an explanation for UV/optical variability in nearby Seyferts. arXiv 2024. [Google Scholar] [CrossRef]
- Clavijo-Bohórquez, W.E.; de Gouveia Dal Pino, E.M.; Melioli, C. AGN and Star Formation feedback in the evolution of galaxy outflows. arXiv 2023. [Google Scholar] [CrossRef]
- Zhang, L.; Ho, L.C. The Interaction between AGN and Starburst Activity in the Circumnuclear Region of NGC 7469 as Viewed with JWST. Astrophys. J. Lett. 2023, 953, L9. [Google Scholar] [CrossRef]


Disclaimer/Publisher’s Note: The statements, opinions and data contained in all publications are solely those of the individual author(s) and contributor(s) and not of MDPI and/or the editor(s). MDPI and/or the editor(s) disclaim responsibility for any injury to people or property resulting from any ideas, methods, instructions or products referred to in the content. |
© 2025 by the authors. Licensee MDPI, Basel, Switzerland. This article is an open access article distributed under the terms and conditions of the Creative Commons Attribution (CC BY) license (https://creativecommons.org/licenses/by/4.0/).