1. Introduction
Celestial systems, predominantly in a plasma state or surrounded by plasma, are significantly influenced by magnetic fields (
B). Since plasma consists of charged particles such as electrons and ions, it is highly responsive to magnetic fields. For instance, turbulent plasma energy is converted into magnetic energy through a process known as the dynamo. Conversely, magnetic energy is converted into the plasma’s kinetic or thermal energy, as observed in phenomena such as Alfvén waves and magnetic reconnection.
1 Additionally, the balance between plasma pressure and magnetic pressure determines the stability of the plasma system. Moreover, by transporting angular momentum, magnetic fields act as a brake on celestial plasma systems, gradually slowing their rotation and playing a critical role in the regulation of star formation and the development of accretion disks. Furthermore, magnetorotational instability (MRI) in accretion disks enhances turbulence, driving angular momentum outward and allowing material to accrete inward. These mechanisms, which are crucial to the dynamics of astrophysical systems, are essential for understanding their behavior not only in distant celestial objects but also in the Sun [
1,
2,
3,
4,
5,
6].
In addition to these macroscale effects, magnetic fields impact the production of elementary particles. Perturbed electrons, influenced by the Lorentz force, can be shared among neighboring nuclei, leading to an increase in density due to superposition effects. Consequently, the enhanced shielding effect reduces the potential barrier between interacting nuclei, thereby elevating nucleosynthesis reaction rates [
7]. Since ubiquitous magnetic fields have been present since shortly after the Big Bang and can influence plasma systems while maintaining electrical neutrality, they are among the most probable candidates for contributing to matter production in the Universe.
Despite these broad influences of ever-present magnetic fields, their origin is not clearly understood. In the very early Universe, various quantum fluctuation processes, such as QCD or phase transitions, are thought to have formed primordial magnetic fields (PMF) [
8,
9,
10]. As the density of plasma particles increased through nucleosynthesis, Their enhanced collision frequency and plasma fluctuations led to misalignments between the gradients of electron density,
, and pressure,
(or temperature,
), such that
. Known as the Biermann battery effect, this phenomenon acts as a source term in the magnetic induction equation, generating magnetic fields [
8,
11]. The primordial magnetic fields (PMF) from this epoch are estimated to have been extremely weak, in the range of
, compared to the currently observed average magnetic field strength
[
12]. This discrepancy suggests that more enhanced and efficient dynamo processes must have existed [
13,
14,
15].
The generation, amplification, and propagation of magnetic fields in plasmas differ significantly from those in free space. In free space, the induction and propagation of magnetic fields can be explained by Maxwell’s equations and electrodynamics. However, in plasmas, the presence of massive charged particles and fluctuating magnetic structures mutually interfere, giving rise to additional magnetic field structures. Often, the induced magnetic eddy remains a local fluctuation that decays into smaller-scale structures rather than evolving or propagating to larger scales, due to the interactive constraints imposed by other massive charged particles. Therefore, the generation and sustained propagation of magnetic fields in plasmas require additional energy and constraints. The behavior of magnetic fragments in plasmas resembles that of fluid eddies.
The transport of magnetic fields in plasmas, leading to their amplification at large or small scales, is referred to as dynamo [
13]. These phenomena are essentially the induction of the magnetic field through electromotive force (EMF,
, where
represents fluid velocity). The migration of magnetic energy toward larger scales is referred to as an inverse cascade of energy, leading to a large-scale dynamo (LSD). Conversely, the transfer of magnetic energy toward smaller scales, resulting in a peak in the small scale regime, is referred to as a small-scale dynamo (SSD). The forward cascade of energy is often observed in both hydrodynamics (HD) and magnetohydrodynamics (MHD). However, the inverse cascade requires more stringent conditions, such as 2D HD systems with conserved kinetic energy
and enstrophy
, 3D MHD systems with helicity (
), differential rotation, or magnetorotational instability (MRI), also known as the Balbus-Hawley instability [
1,
16,
17]. The migration and amplification of the magnetic field are influenced by various factors, and the critical conditions governing these processes remain an active area of research and debate. In particular, the turbulent electromotive force, which acts as a source for the large-scale magnetic field, is not easy to analyze its physical theoretical properties.
However, with helicity in magnetic fields, the turbulent electromotive force can be represented as , regardless of whether the system is dominated by kinetic or magnetic energy. Here, and are pseudo and regular tensors, respectively, and denotes the large-scale magnetic field.
The
and
coefficients not only simplify the nonlinear dynamo process but also allow an algebraic approach to the dynamo process for further theoretical investigation. In particular, for rotational structures such as the Sun,
and
with the angular velocity
describe the periodically oscillating magnetic fields in the northern and southern hemispheres and the evolution of the poloidal and toroidal fields with a phase difference of 90 degrees [
6,
18]. Moreover, the solar magnetic induction equation, incorporating the full forms of
and
along with the large-scale poloidal and toroidal magnetic fields
,
, may explain not only the 22-year periodic evolution of the solar magnetic field but also non-periodic solar (magnetic) activities. There have been numerous efforts to determine these coefficients through dynamo theories such as mean field theory (MFT), the eddy-damped quasi-normal Markovian (EDQNM) approximation, or the direct interaction approximation (DIA) [
16,
19,
20]. However, only approximate forms of the
and
coefficients are available at present. These theories suggest that
is composed of residual helicity,
, while
is related to turbulent energy
or
. It has long been considered that
induces magnetic fields, while
, combined with molecular resistivity
, was thought to simply diffuse the fields. However, their derivations represent first- and second-order approximations that involve unresolved integral factors or Green functions. Since these cannot be solved self-consistently, there is reason to question whether such tentative conclusions, based on incomplete analytical approaches, are indeed valid.
From the viewpoint of magnetohydrodynamics (MHD), the net diffusivity consists of the molecular diffusivity
and the turbulence diffusivity
. Similar to
and
,
is also a tensor that is reciprocally related to the conductivity
. The characteristics of
depend on both temperature and density. More critically,
is characterized by the frequency
and the magnetic field
B.
can take on negative values depending on
and
. When
is analyzed using kinetic models, this tensor has the potential to become negative depending on the wave frequency
and the cyclotron frequency
, q: charge, m: mass of the particle). Interestingly, MHD fluid simulations of decaying magnetized plasma systems also demonstrate the inverse transport of magnetic energy due to negative diffusion, regardless of the conditions typically associated with inverse cascade [
21,
22,
23]. However, the inverse transport of magnetic energy in the decaying system is more related to turbulent diffusivity rather than molecular properties. In this article, we investigate the negative turbulence diffusivity, the
effect in the helically forced system. This highlights the fluid dominance over the electromagnetic
effect in plasmas composed of many charged particles.
To determine the magnetic diffusivity, the fluctuation in
was considered. Kraichnan proposed that if the fluctuation of
were large enough, the diffusion could become negative [
24]. This model was further generalized by Moffatt, followed by numerous analytical and numerical models [
25,
26]. Later, a more direct numerical method to calculate the
and
effects was proposed. Using an additional test magnetic field
, fluctuating magnetic fields
were obtained numerically and used for the computation of dynamo coefficients [
27,
28]. Recently, Bendre et al. [
29] proposed the iterative removal of sources (IROS) method, which uses the time series of the mean magnetic field and current as inputs. Besides, negative magnetic diffusivity was also observed in a liquid sodium experiment [
30], where small-scale turbulent fluctuations contributed to negative magnetic diffusivity in the interior region.
In our previous work [
31,
32], we derived
and
using large-scale magnetic energy
and magnetic helicity
without any additional assumptions or the need to impose extra constraints on the system. We generated their profiles using raw simulation data and successfully reproduced the evolving large-scale magnetic field, consistent with direct numerical simulations (DNS). After confirming that the model produced results in agreement with DNS, we derived a new form of
that requires turbulent kinetic energy
and helicity
. We constructed the profile of
and reproduced the large-scale magnetic field, again in good agreement with other results.
and
thus serve as effective references, providing a standard for evaluating new methodologies.
In this article, we applied the model to systems with increased magnetic Reynolds numbers (), indicating enhanced nonlinearity but keeping a magnetic Prandtl number (). We found that the model produced consistent results, particularly in the kinematic regime. Then, we applied the turbulent kinetic data to the new form of . The extended model also successfully reproduced the large-scale magnetic field. This result indicates that turbulent kinetic helicity—previously neglected in conventional theory—plays a crucial role in magnetic diffusivity. Since our model does not rely on artificial assumptions or well-contrived methods, it can be applied not only to DNS but also to observational data. This is what sets our model apart from others. However, the application of our model to the increasing system also demonstrates that there is a room for improvement. The increasing magnetic effect with needs to be included. Additionally, the results indicated the need for an in-depth study of the physical meaning of the correlation length ‘l’.
The structure of this paper is as follows. In
Section 2, we describe the numerical model and code.
Section 3 presents the results of numerical calculations, while
Section 4 explains the related theory. For consistency and readability, the theory is not simply cited but is presented with additional detailed explanations. We added a field structure model to elucidate the intuitive and physical meaning of
and
diffusion. This model may appear ad hoc; however, it is grounded in the mathematical formulation of the electromotive force (EMF), which acts as the source term for the magnetic field in the magnetic induction equation, taking into account both non-helical and helical velocity fields. It effectively captures the physical interpretations of the
and
effects. We also include a partial IDL script used for calculating the large scale magnetic field
. The final section provides a summary.
3. Result
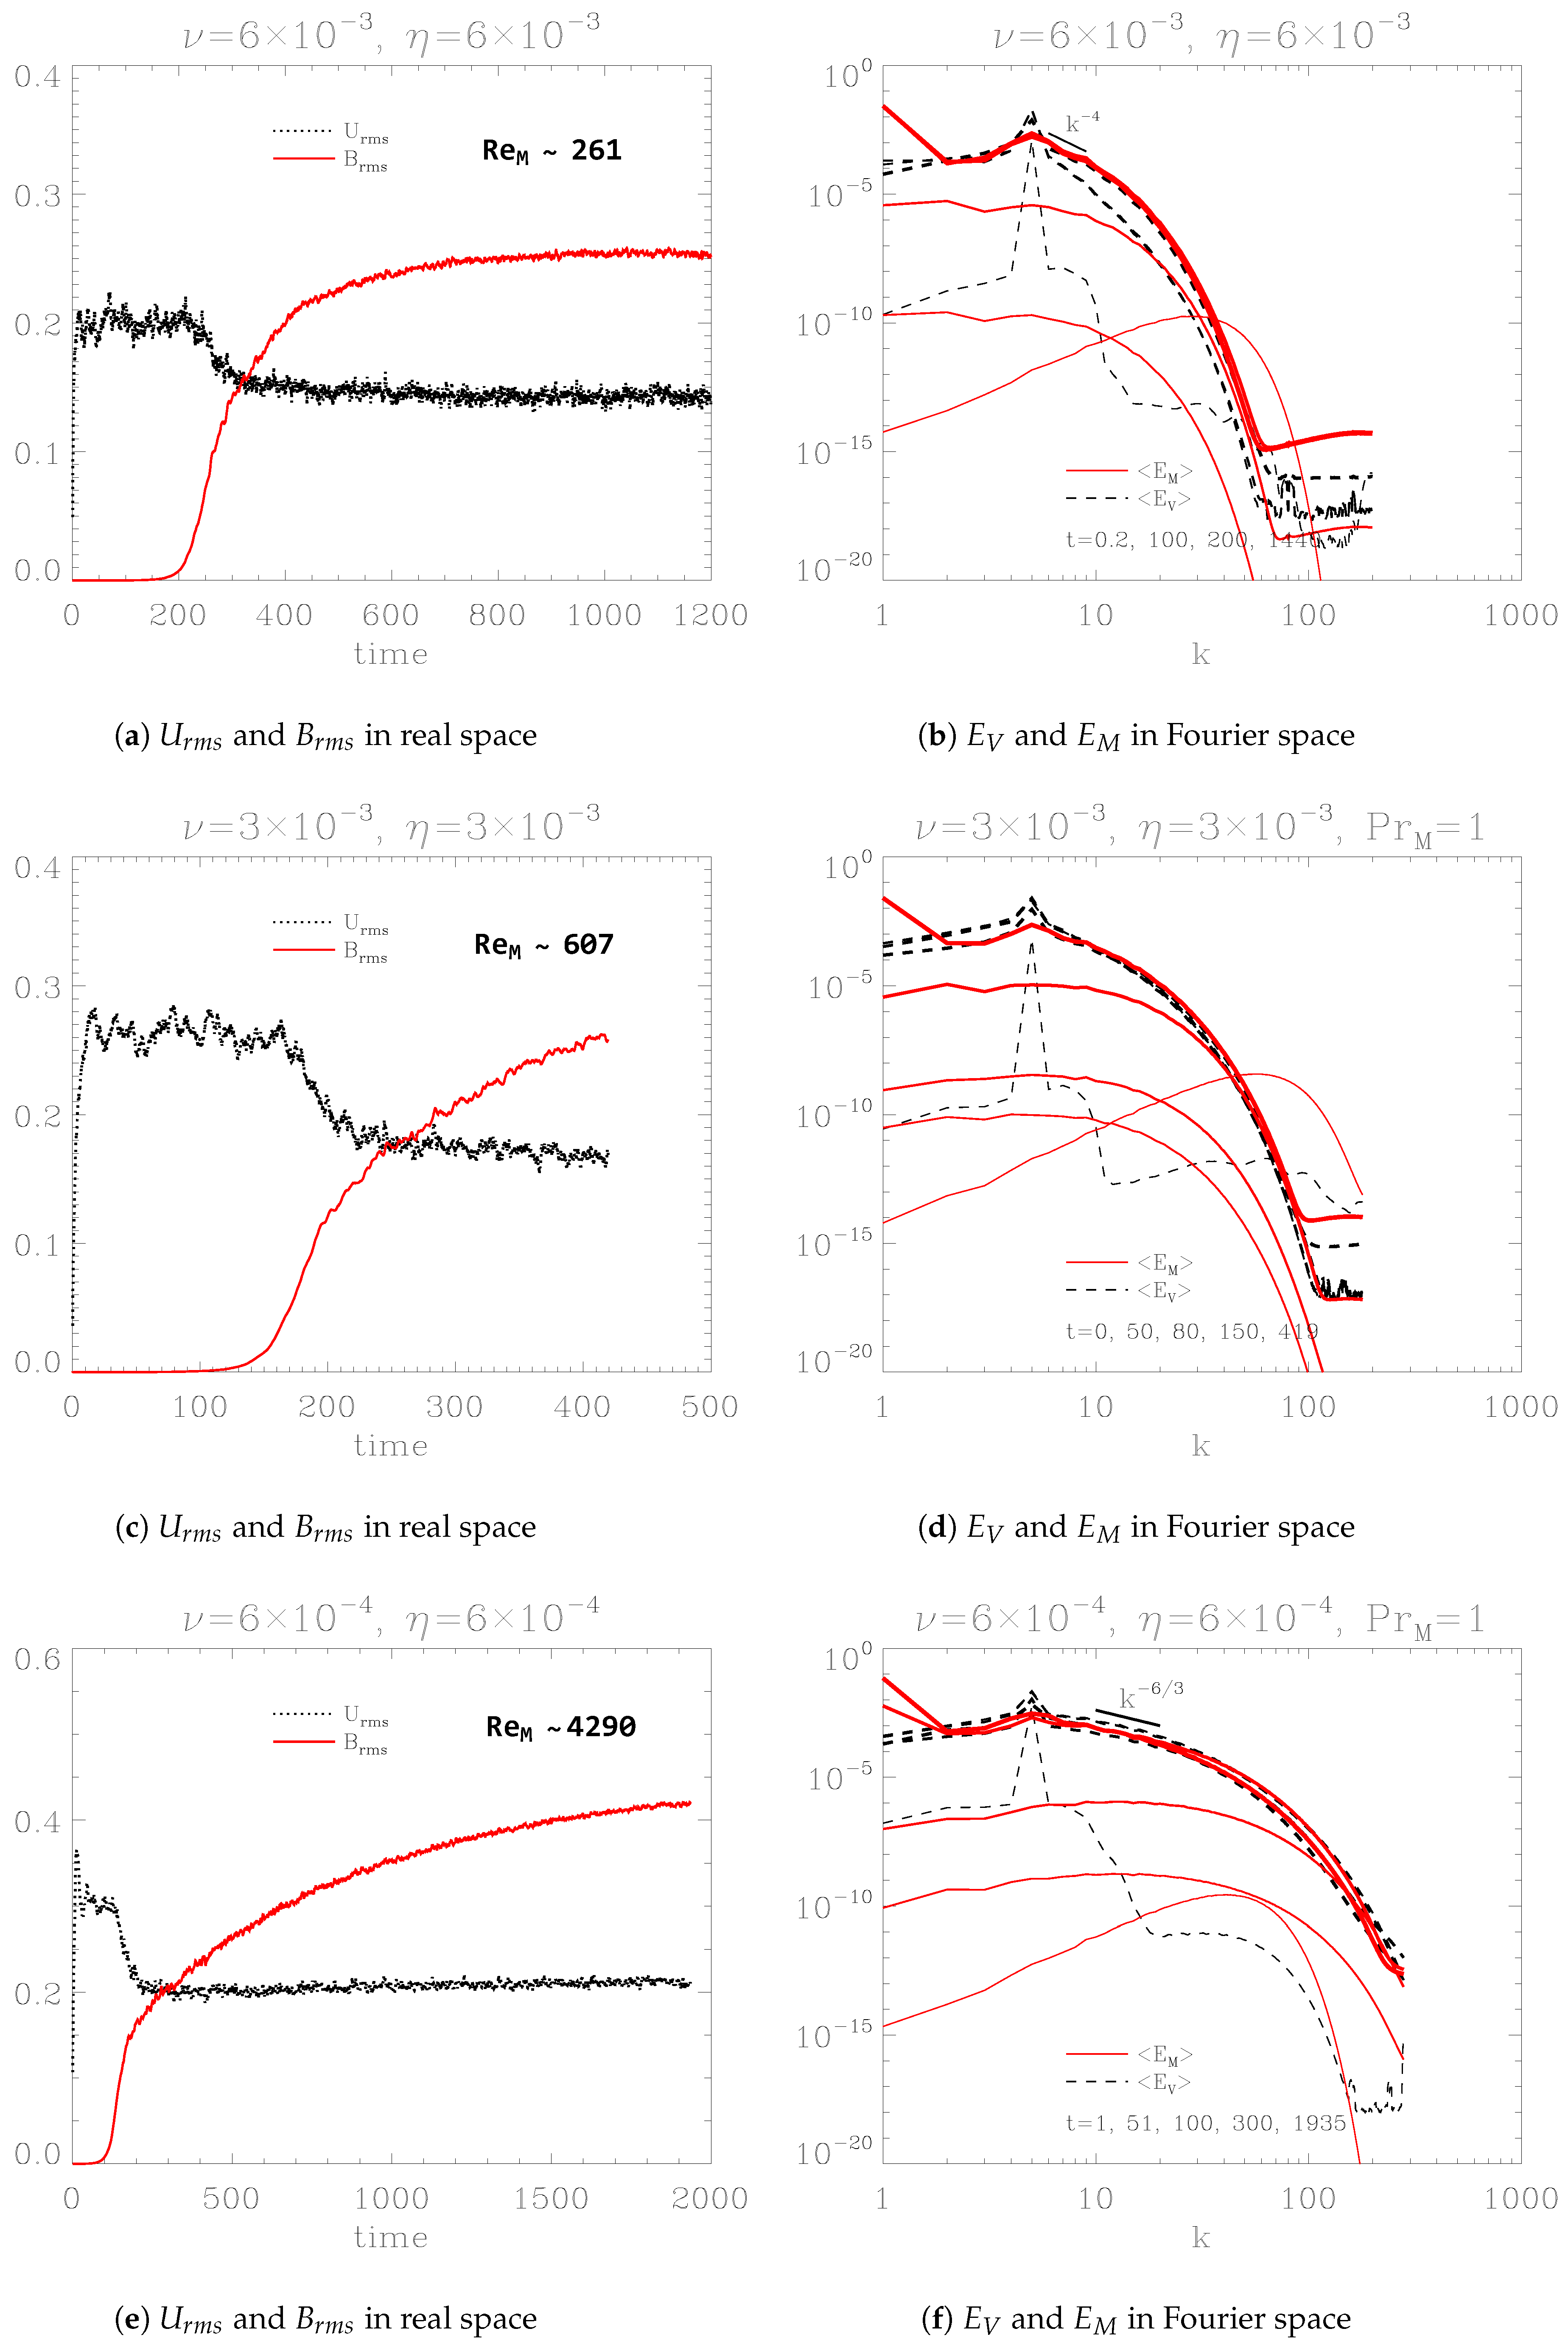
Figure 7a–f show the temporal evolution of root mean squared velocity
and magnetic field
(left panel), and the spectra of kinetic energy
and magnetic energy
for magnetic Reynolds numbers
, 607, and 4290 (right panel). Both
and
were calculated as
and
, respectively. The corresponding magnetic diffusivities and velocities for different
are
with
,
with
, and
with
. Since the two larger
cases have not yet reached saturation,
U was approximately estimated for these cases. The evolution and saturation profiles differ slightly across the cases. The left panel shows that as
increases, more time is required for the fields to reach saturation. Additionally, the right panel indicates that as
increases, the small-scale regime of the energy spectrum flattens. Despite these variations, some common features are observed for the unit magnetic Prandtl number,
. First, the left panel consistently shows that
U decreases as
B grows, demonstrating the conversion of kinetic energy into magnetic energy. Second, increasing
leads to stronger saturated fields. Furthermore, the increasing
flattens the energy spectrum, transitioning from
to
near to Kolmogorov’s scaling factor,
. This behavior reflects the influence of increased small-scale energy on enhancing diffusion effects.
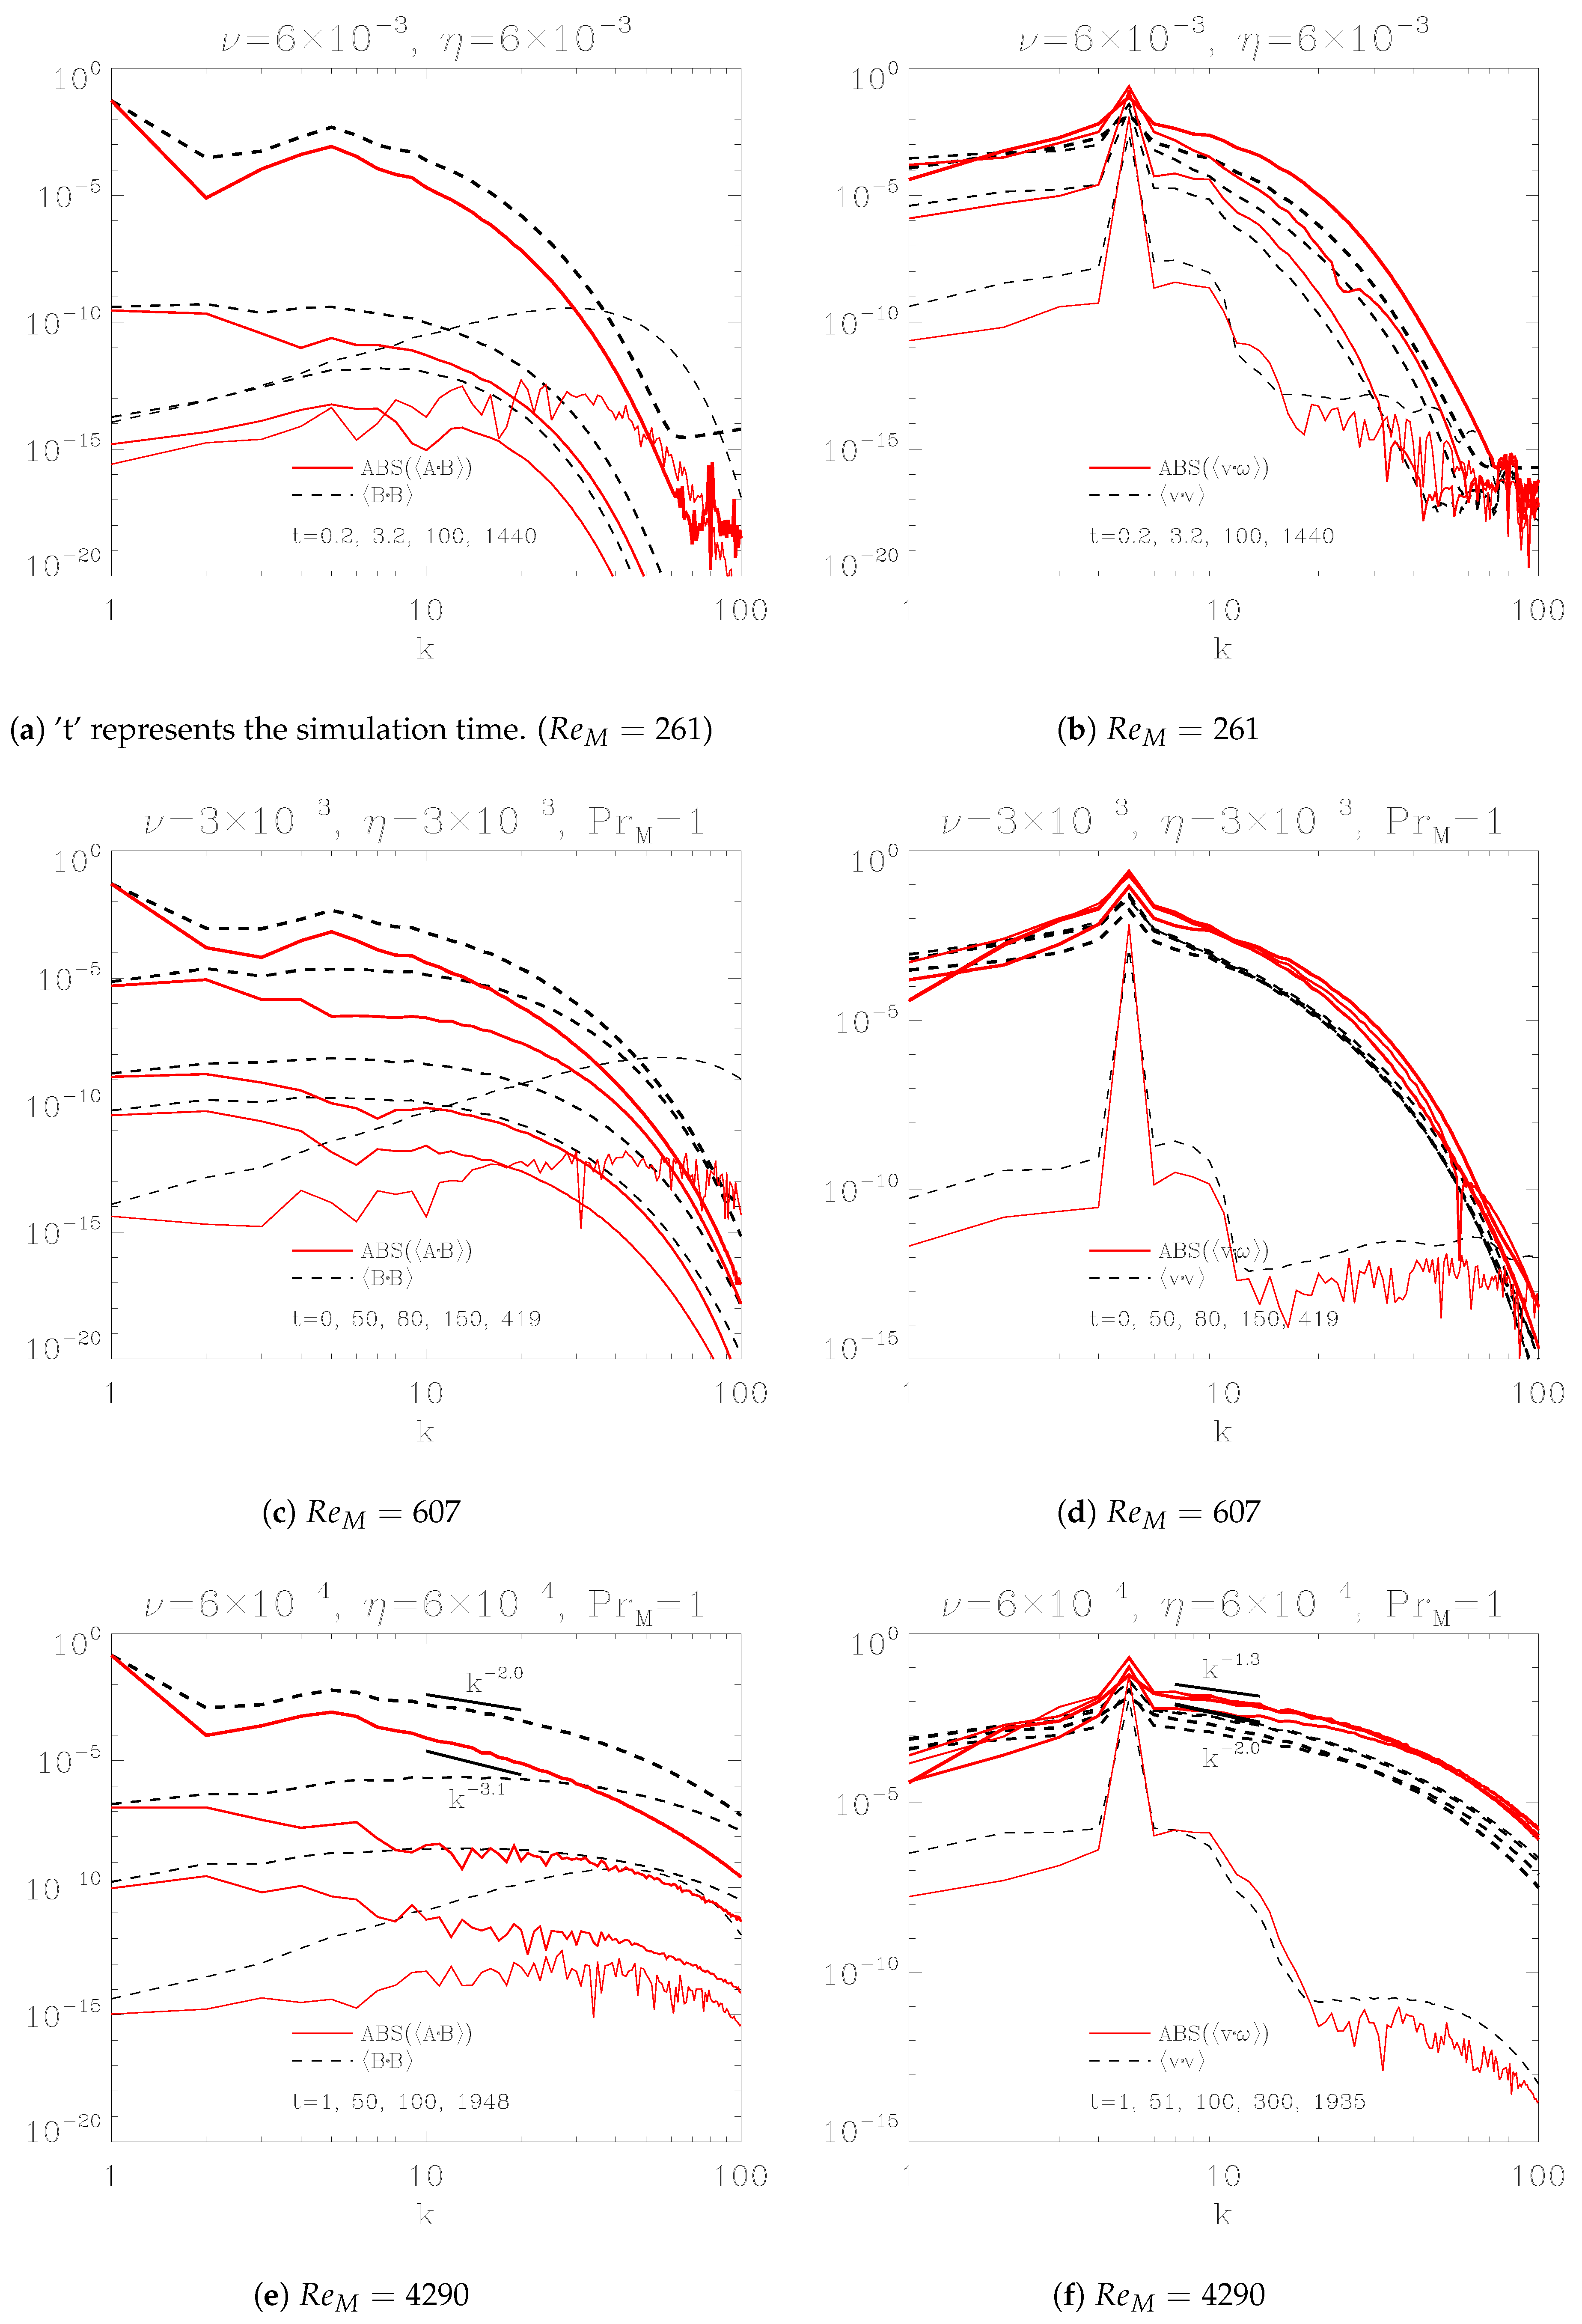
Figure 5a–f present the spectra of magnetic helicity
and magnetic energy
in the left panel, and kinetic helicity
alongside kinetic energy
in the right panel. The values of
and
are consistent with those in
Figure 7. As shown in the left panel, both
and
reveal that magnetic strength at
increases over time, eventually exceeding that at the forcing scale
. In contrast, magnetic strength at smaller scales (
) diminishes as
at
grows, clearly demonstrating the inverse cascade of magnetic energy. Note that the polarity of
at large scales is negative in this right-handed kinetic forcing system. Additionally,
Figure 7e,f exhibit Kolmogorov’s energy scaling. The different scaling factors—
,
,
, and
—remain consistent, despite their small discrepancies. These variations stem from the limited Reynolds number and the relatively small resolution
. On the right panel, the evolution of plasma motion shows a dependence on the Reynolds number. For instance, comparing
Figure 7e with
Figure 7f,
and
converge by
, faster than the magnetic field’s evolution. Although the same viscosity and diffusivity were used (
,
), their asymmetric evolutions might seem unusual. However, Equations (2) and (4) are inherently not symmetric, and the coupling between them adds further complexity to their behavior. As the Reynolds number increases, the asymmetrical balance between
and
becomes more pronounced.
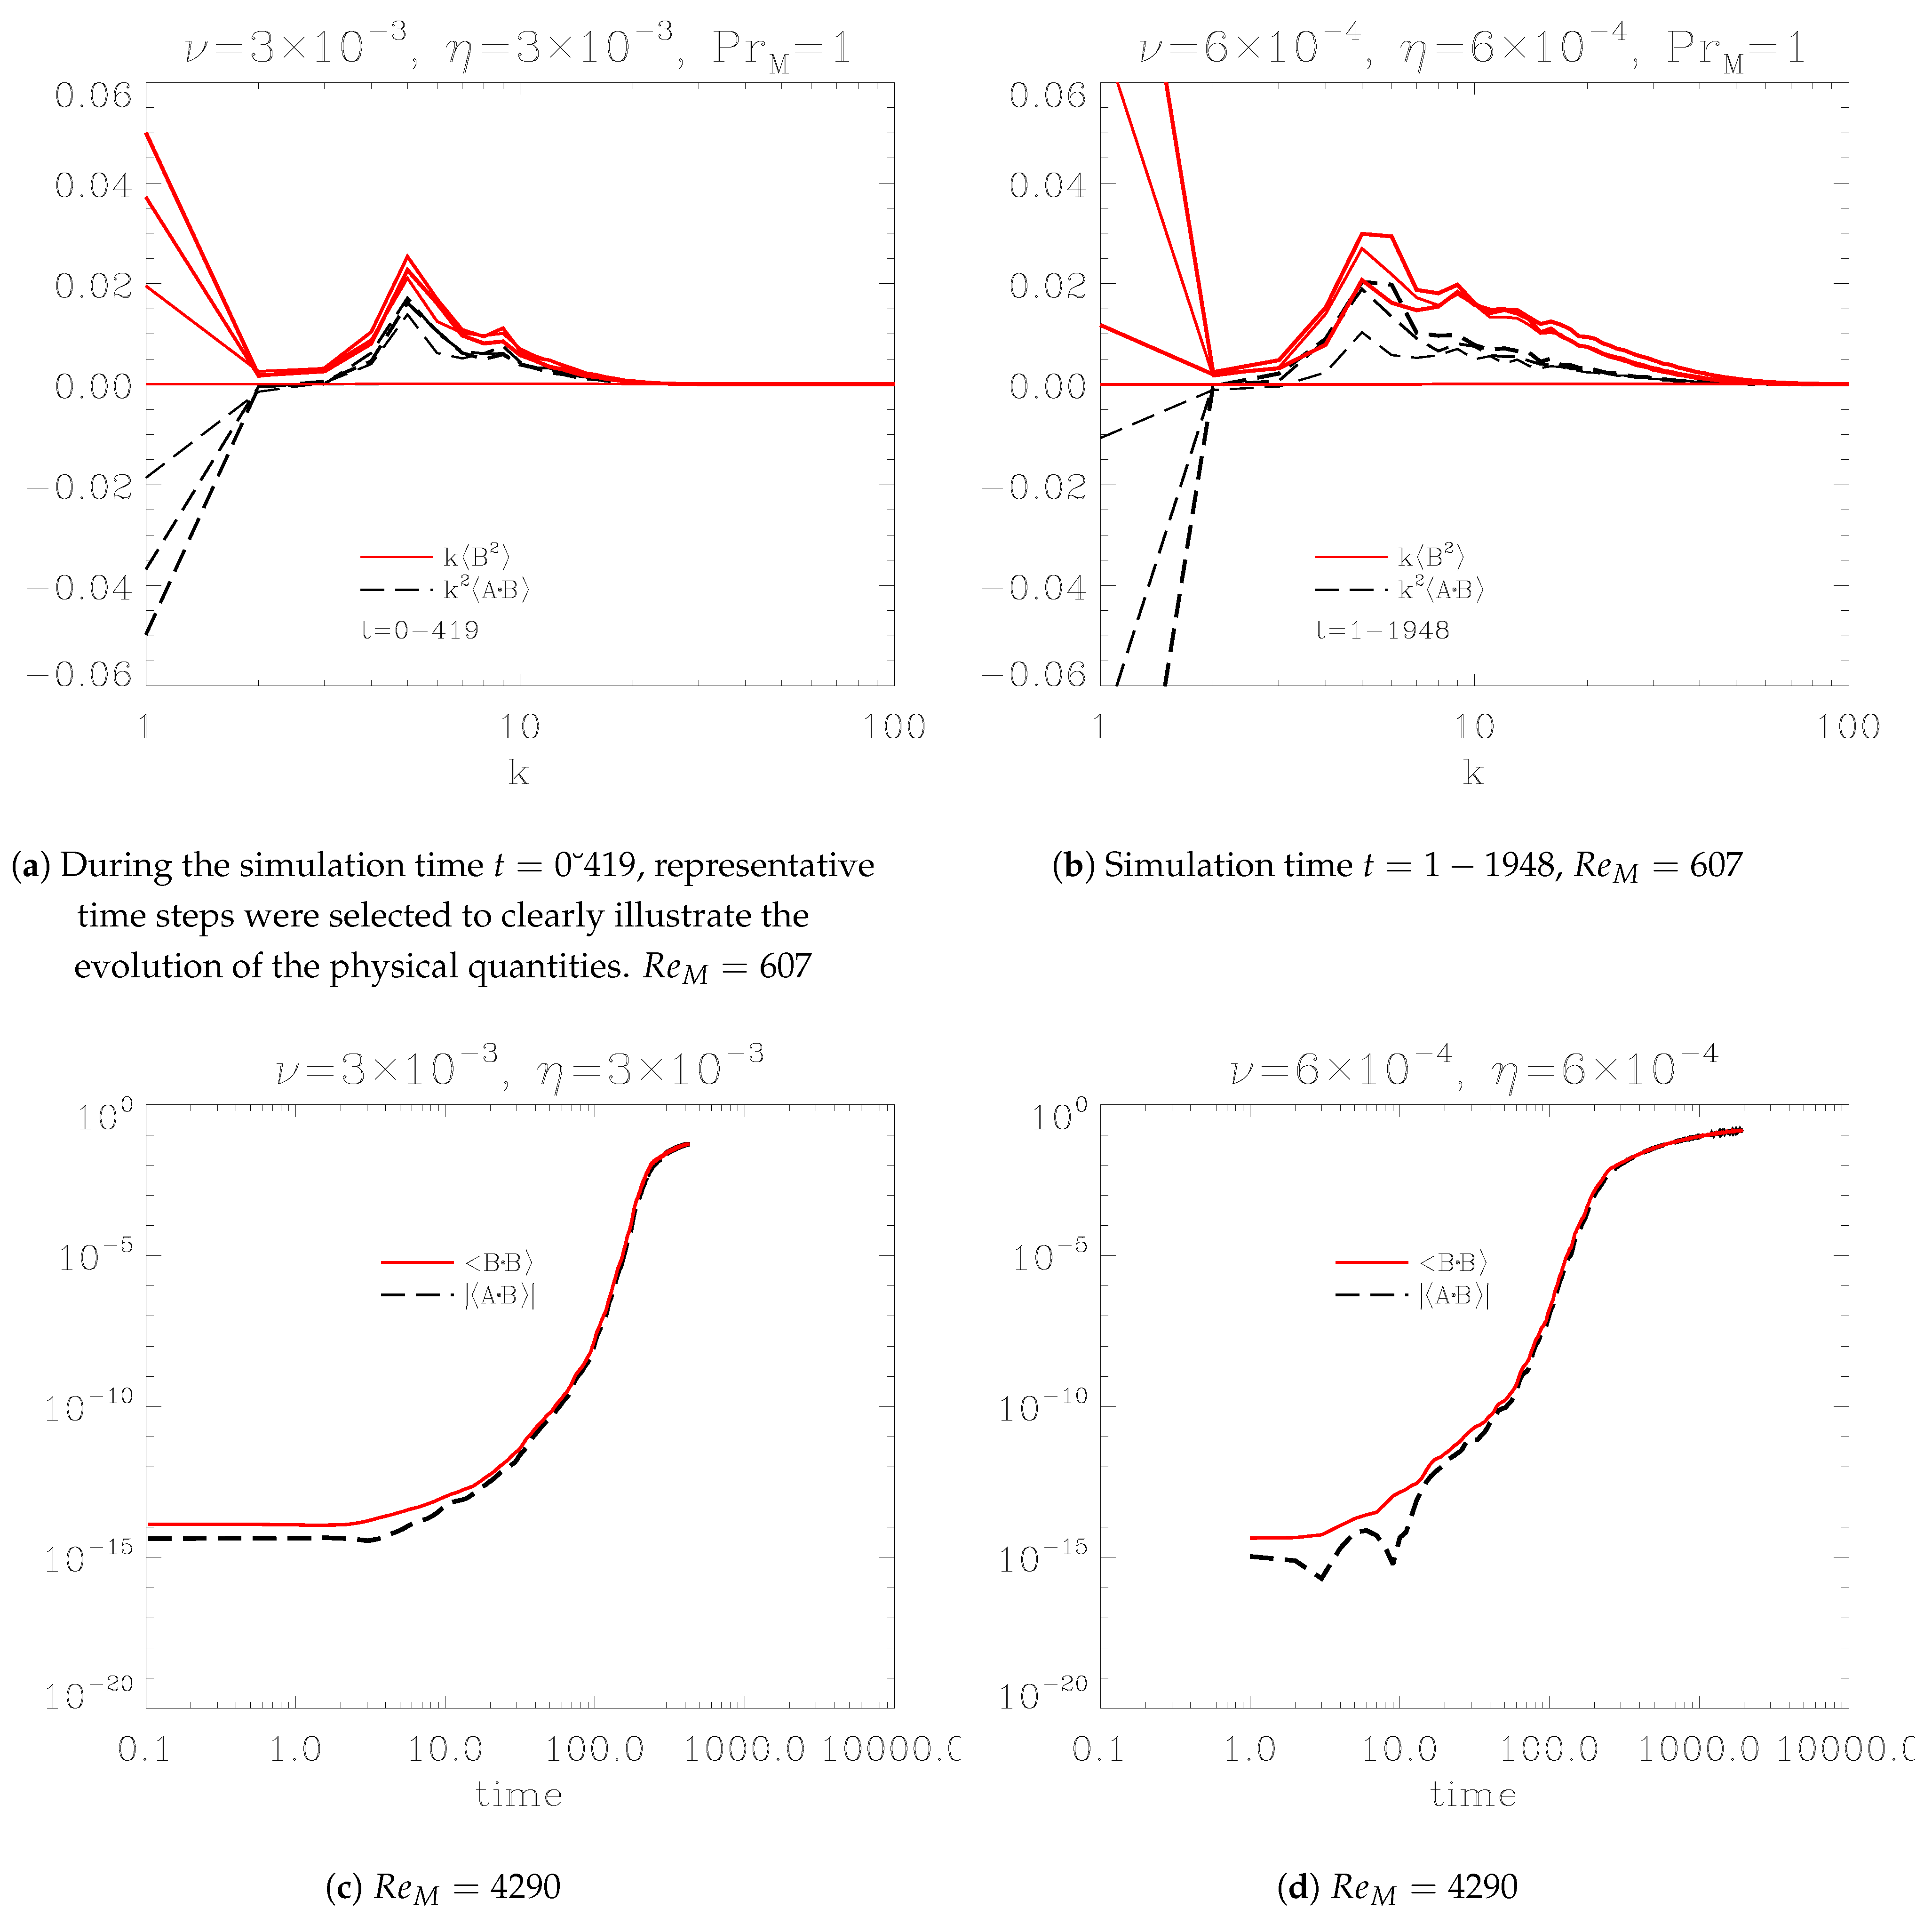
Figure 1a,b show the spectra of current helicity,
and
, with the aim of demonstrating the conservation of magnetic helicity. Due to the small magnitude of magnetic helicity at small scales, we instead use current helicity,
. The system is driven with positive (right-handed) helical kinetic energy at
. This forcing generates magnetic helicity of opposite polarization, i.e., left-handed magnetic helicity, which is inversely cascaded toward large scale. To conserve total magnetic helicity, right-handed magnetic helicity is produced at smaller scales. This explains why the polarities of the large-scale and small-scale regimes are opposite.
Figure 1c,d show the temporal evolution of large-scale magnetic energy,
, and large-scale magnetic helicity,
. As noted earlier, magnetic helicity in large scale is negative, but we use its absolute value for comparison. Initially,
is smaller than
in both cases. However, their magnitudes converge over time, such that
. The discrepancy
is related to the determination of
and
.
Figure 2a–f include the large-scale kinetic energy (
, black dot-dashed line) and magnetic energy (
, red solid line) in the left panel. Since
is very small throughout the entire range, we have multiplied both
and
by 10 for better visibility. In the right panel, the kinetic helicity ratio
and the magnetic helicity ratio
are illustrated.
increases at
and becomes saturated. In contrast,
remains at a very low value. We also include the evolving profiles of the
(dotted line) and
(dashed line) coefficients, obtained from the large-scale magnetic energy and magnetic helicity. The
coefficient oscillates between positive and negative values, while
remains negative. Both coefficients converge to zero as
saturates. However, the contribution of
is much smaller than conventional inference, which predicts it should remain negative and converge to zero as the magnetic field grows (see
, where
). With the Laplacian
, the negative
amplifies the magnetic field:
. The
effect originates from the spatial distribution of the curl of the current density,
. Mathematically, the
effect here represents diffusion in plasmas. Plasma turbulence, acting as a diffusion mechanism, can efficiently transport magnetic energy to larger scales. Near saturation,
oscillates heavily during this nonlinear stage. We applied a smoothing function in IDL, averaging over 10 nearby points. The
and
profiles were obtained from the evolving magnetic data
. Regardless of the theory behind
and
, it must account for these profiles. We will soon demonstrate that the
and
coefficients, based on these profiles, can reproduce the evolving
obtained from DNS.
The evolution of the helicity ratios is consistent with a system forced by helical right-handed kinetic energy. The kinetic helicity ratio
at
(the forcing scale) remains close to 1 (with
, see Equation [
5]). Other
values at
for the large scale and
for the small-scale regime show positive oscillations. In contrast, the magnetic helicity ratios
evolve quite differently. The large-scale helicity ratio eventually converges to
, while those at smaller scales grow to positive values, indicating the conservation of magnetic helicity. We will discuss this issue further using vector analysis and the field structure model.
indicates the simulation time interval between each data point.
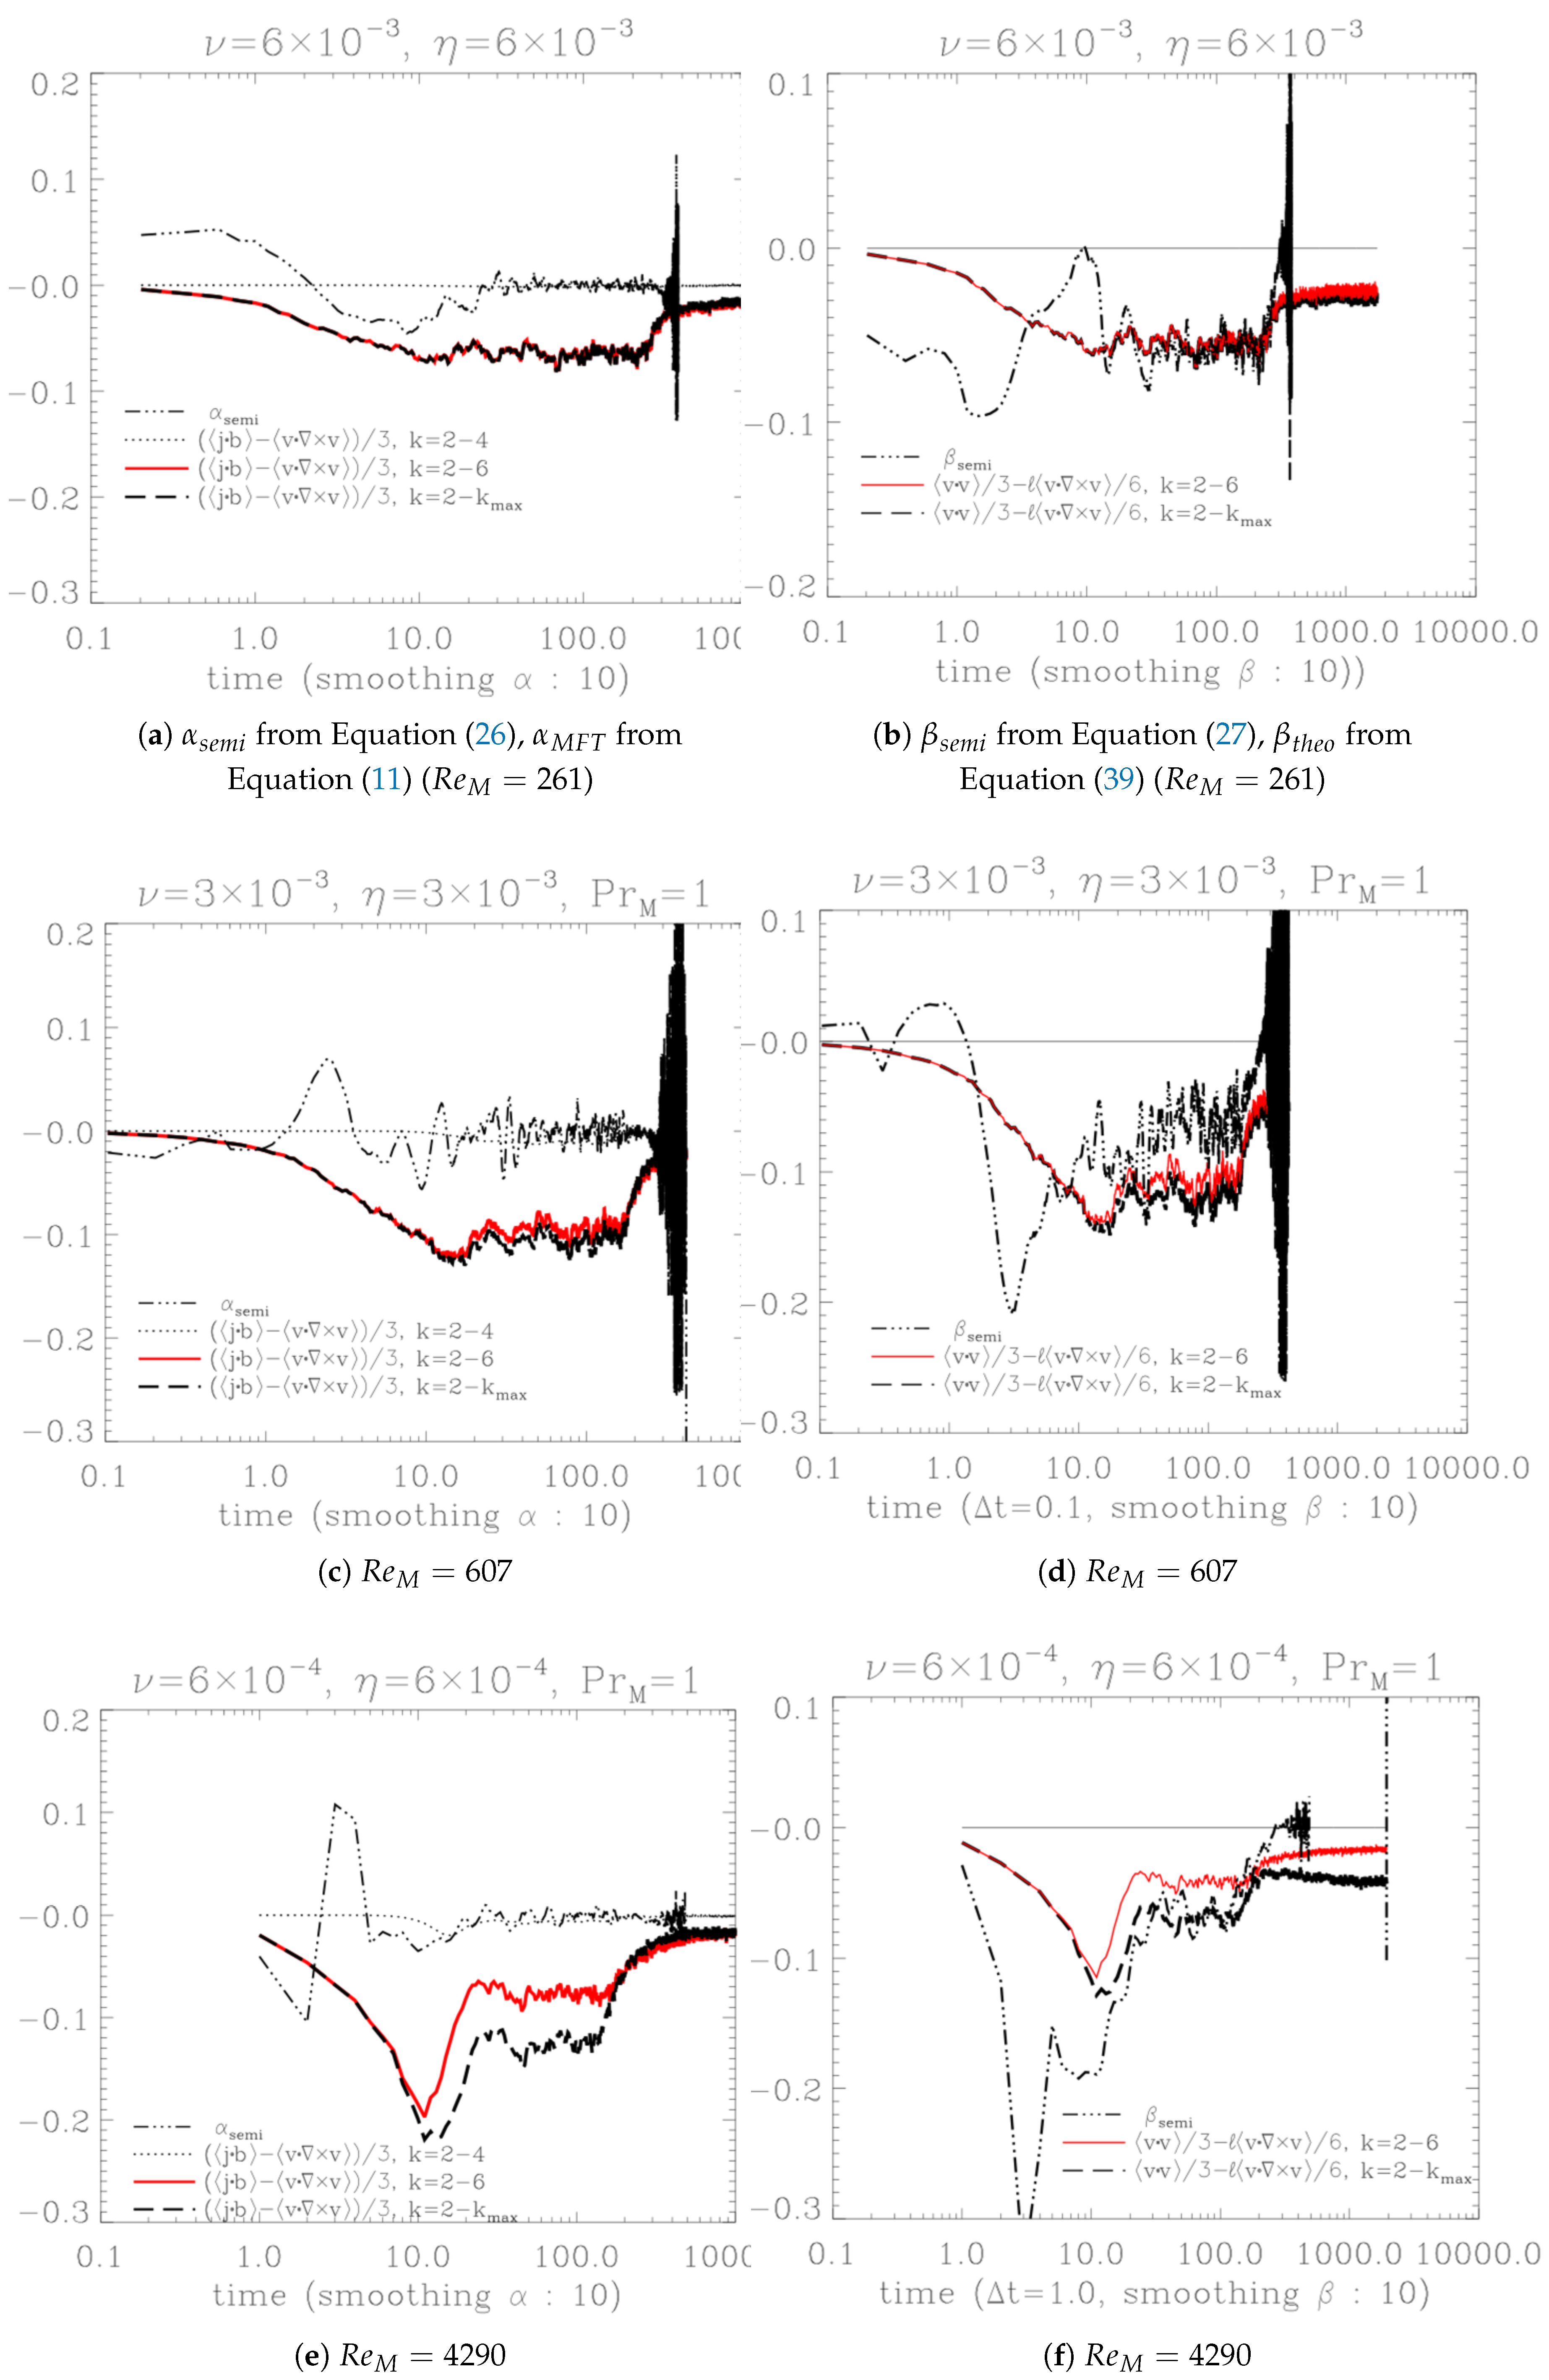
Figure 3a–f compare the profiles of
and
. The
profile (represented as
or
, dot-dashed line) in the left panel is calculated using the large-scale magnetic data
and
. The other lines are obtained from
, where the correlation time
is set to one unit of simulation time. Here,
and
represent the current helicity and kinetic helicity in the small scales, respectively. This
is a basic form of MFT, DIA, and EDQNM. However, the exact range of the turbulent or small-scale regime for these pseudo-scalars is not yet known. Therefore, we compared them for different ranges:
(dotted line),
(solid), and
(dashed). The value of
for
is negligibly small, while the other ranges including the forcing scale
yield practically the same results. Apparently, kinetic helicity at the forcing scale largely looks to determine the profile of
. However, as shown in
Figure 3e, the
profiles for
and
are distinct. This separation suggests that more helicity migrates toward the smaller scale regime with increasing
. On the other hand, the
profile derived from the large-scale magnetic data oscillates and converges to zero much earlier. The relatively weak
effect indicates a small electromagnetic contribution to the plasma dynamo. Statistically, in a plasma system composed of many charged particles constraining one another, the strong electromagnetic effect is somewhat limited. The weak
effect is quite reasonable in such plasmas. Nevertheless, it is this electrodynamic effect that determines the system’s polarity in the early time regime.
The right panel includes the profile of
(
or
, dot-dashed line) derived from large-scale magnetic data, alongside
calculated from turbulent kinetic energy
and kinetic helicity
. While conventional theory attributes kinetic helicity solely to the
effect, detailed calculations reveal that it also influences
diffusion. For a non-helical velocity field,
remains positive, consistent with traditional theory. However, in the presence of helicity, the helical kinetic structure can diffuse magnetic energy to larger scales. In
Figure 3b, we compare the conventional
with
(
,
, dotted line),
, and
across various ranges. The plot shows that
remains positive, diffusing the large-scale magnetic field. In contrast,
and
(indicating
) become negative, potentially amplifying the large-scale magnetic field. The plot demonstrates that
generally aligns with
, except in the early and saturated time regimes (logarithmic time scale). In the early regime, the effect of the initial seed magnetic field persists. In the saturated regime, turbulent magnetic effects seem to play a more significant role in the
profile. The range of consistency is relatively extensive. Since
and
serve as standard references for
, the alignment of
indicates that turbulent kinetic energy and kinetic helicity contribute to
diffusion. However, near saturation, the discrepancies between
and
in
Figure 3b,d,f suggest that additional magnetic effects are needed to fully account for the quenching of the
effect.
Figure 4a–f demonstrate the turbulent electromotive force (EMF,
, left panel) and the evolution of the large-scale magnetic field
in the right panel. These plots verify the validity of the newly obtained
and
coefficients from
Figure 2. In the left panel, we compare the curl of
with its linearized representations,
. As mentioned earlier, the exact range of the turbulent scale remains unclear. Therefore, instead of directly calculating
, we replaced it with
(red solid line). For
and
, however, direct calculation is possible. We included two types of
for comparison. The semi-
and semi-
(dotted line) represent
and
obtained from large-scale magnetic data, while the semi-
and theo-
(dot-dashed line) indicate
from the large-scale magnetic data and
derived from the small-scale kinetic data.
The plots show that the EMF with
and
, as well as the EMF with
and
, coincide with the DNS EMF
in the kinematic regime. However, these
and
EMFs begin to diverge slightly before the DNS EMF becomes saturated. The EMF with semi-
and semi-
evolves lower than the DNS EMF, while the EMF with semi-
and theo-
evolves higher than the DNS EMF. All
or
from large-scale magnetic data oscillate significantly in the nonlinear regime. These coefficients require the calculation of
for the logarithmic argument, which becomes very small near the saturated regime (
in Equations (
26) and (
27), left panel in
Figure 5). The difference between them exceeds the computational roundoff error, leading to significant numerical noise. To mitigate this, a smoothing function in IDL (averaging over 10 neighboring points) was applied, but it proved insufficient.
In the right panel, the evolution of the large-scale magnetic field
is shown.
from DNS (black solid line),
from semi-
and semi-
(dot-dashed line), and
from
and
(red dashed line) are presented. The reproduced fields coincide quite well with the DNS data. However, as the dynamo process becomes nonlinear, the theoretical
as well as
becomes less efficient. These evolutions are consistent with the field profiles in
Figure 3.
from turbulent kinetic data closely matches
from large-scale magnetic data, except in the early time regime and the saturated regime. In the early time regime, the effect of the initial conditions persists, while in the nonlinear regime,
does not fully capture the growth of the turbulent magnetic field. This discrepancy in the nonlinear regime leads to differences in the profiles of
.
from the conventional
and
is much smaller and out of range.
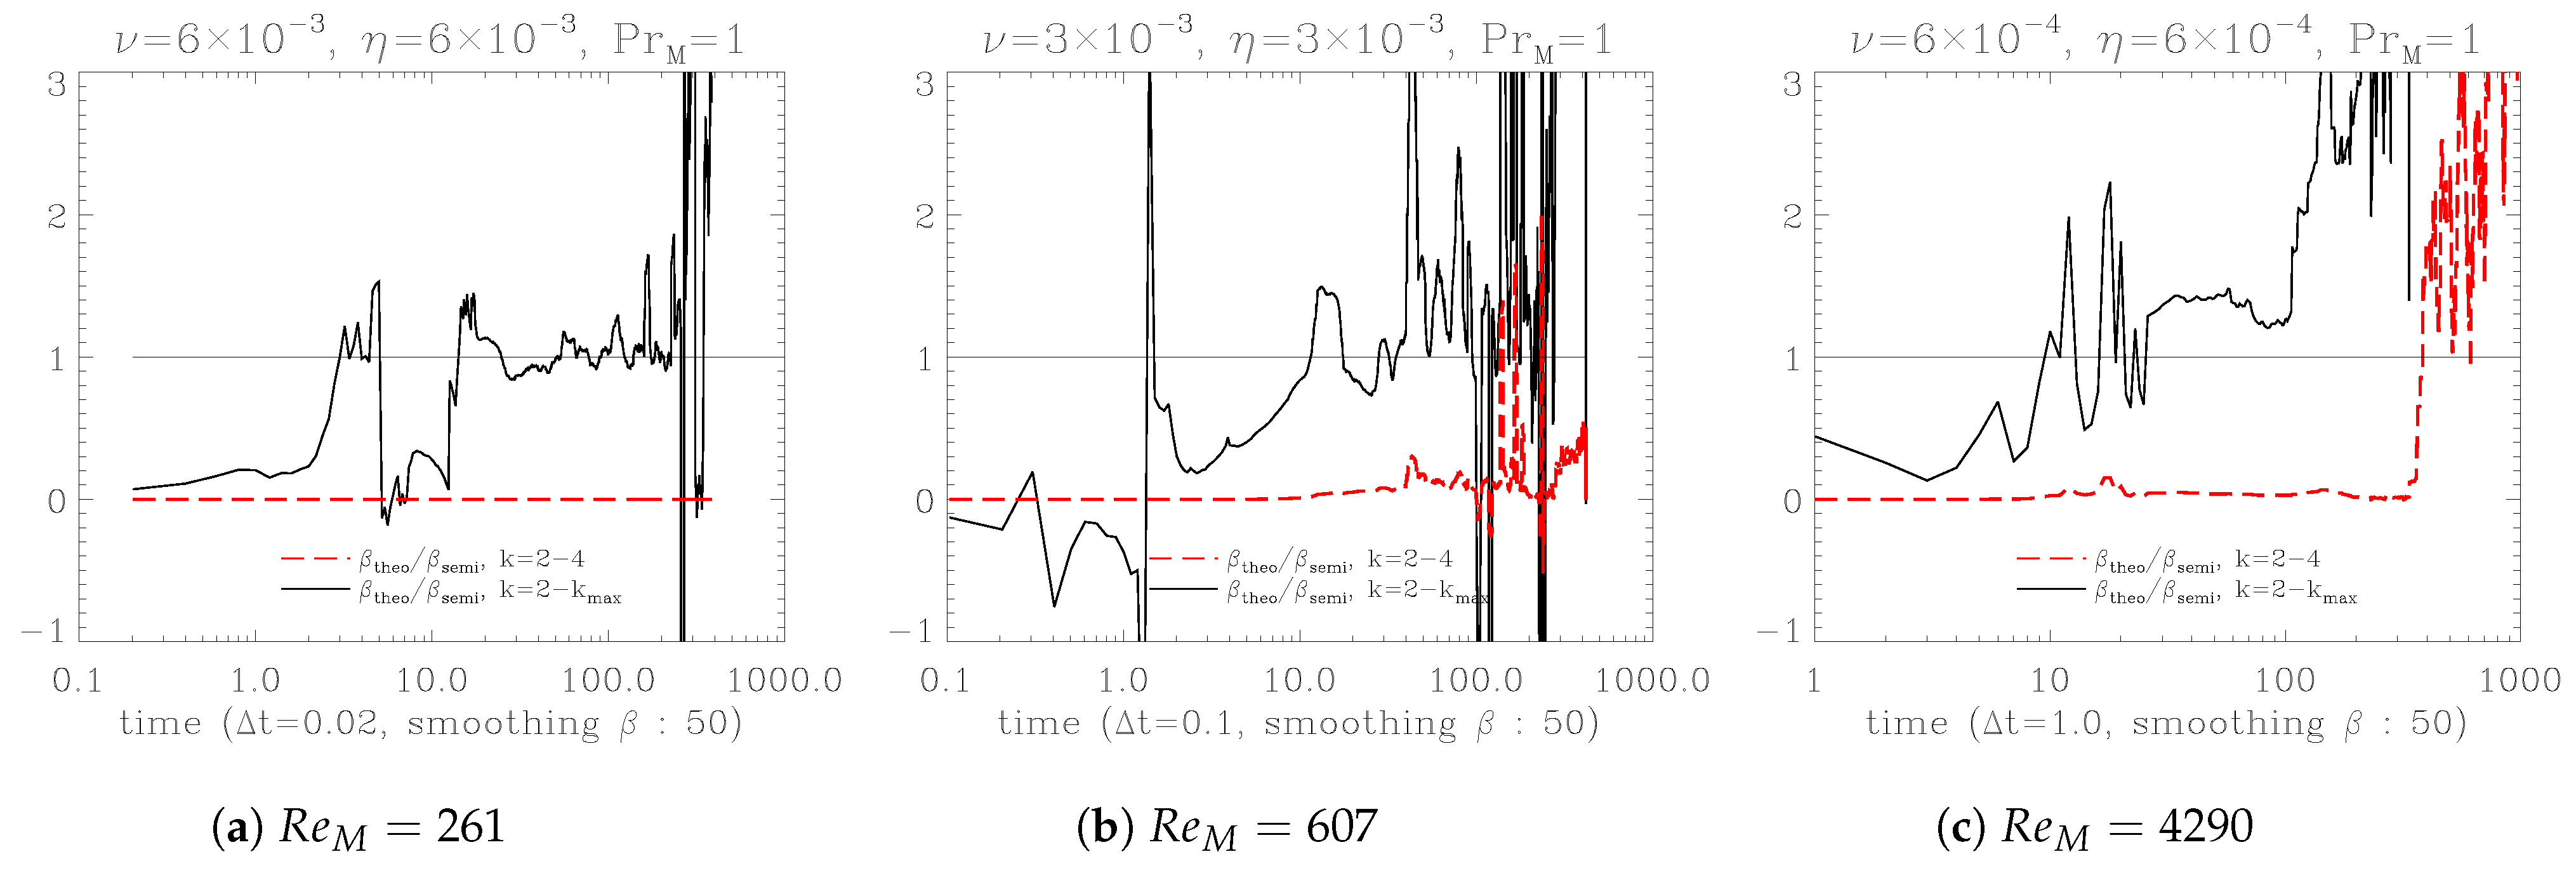
Figure 6a–c illustrate the ratio of
to
. As the plots show, while
is small, these two coefficients are quite close. As
increases, the contribution of
surpasses the actual
. This indicates that
, composed of the turbulent velocity field, is not quenched sufficiently, implying that
diffusion requires additional effects. One of the good candidates is the turbulent magnetic effect.
4. Discussion
As
increases, the magnetic field becomes frozen into the fluid eddies, allowing its intrinsic properties to emerge.
Figure 3 shows that the
effect is not dominant, while the
effect becomes more significant. Considering the evolution of large-scale magnetic fields (
Figure 2, left panel),
quenching appears to be a more critical factor than
quenching in the growth of helical magnetic fields. Compared to the conventional theory of
quenching, this is a major difference we have discovered in this work.
To understand the physical meanings of
and
for EMF, we consider the field structure shown in
Figure 8. The left figure represents a counterclockwise circular structure of a plasma turbulence eddy, over which a magnetic field
threads through the eddy, influencing its structure and energy distribution. The plasma motions,
and
, with
to produce current densities,
and
. According to Ampère’s law, these two current densities induce a magnetic field,
. In other words, the curl of
and
can expressed as
, representing the diffusion of the magnetic field. Eventually,
and
should weaken in the presence of this induced magnetic field.
If the velocity field is helical, however, we have an additional velocity poloidal component
, as shown in the right figure. This velocity interacts with the induced magnetic field to generate current density:
. The current density
induces an additional magnetic field
, which forms left-handed magnetic helicity with
. Here,
acts as the poloidal field, and
acts as the toroidal field. The toroidal and poloidal fields strengthen each other in what is called the
process. Additionally,
can interact with
to generate
. In this case,
and
form right-handed magnetic helicity on a smaller scale. However, the interaction
appears to dominate over
because
and
do not generally align. This net process repeats, producing magnetic helicities that add or subtract pseudo-scalars.
Figure 1 and
Figure 2b,d,f (
,
at
) are associated with this process and are based on the linearization of the EMF,
and
(Equation [
39]).
On the other hand,
is a normal scalar, whereas
is a pseudoscalar. Under the parity operator (reflection symmetry [
41,
45]),
reverses its sign, while
remains unchanged. However, the quantity
l also changes its sign under the parity operator. Consequently,
behaves as an ordinary scalar. The second order velocity moment in Equation (
13) is an example of a statistical identity involving both a normal scalar and a pseudoscalar. Equation (
36) represents a second-order statistical velocity identity in real space [
39]. In addition, there exist statistical identities corresponding to the magnetic field, which have the same mathematical form and share the same physical properties. These identities play a crucial role in closing the equations in EDQNM [
19].
5. Conclusions
Conventionally, attempts have been made to determine and using methods such as MFT, DIA, and EDQNM. However, these approaches involve physical quantities that cannot be solved in a fully self-consistent manner. Therefore, we explored alternative approaches to compute and using either large-scale magnetic data or small-scale turbulent kinetic data. and calculated from large-scale magnetic and accurately reproduced , except for the case where . This indicates that and can serve as a reference for observations, simulations, and theoretical analyses, provided that the system has not yet reached full saturation. However, since they are obtained from and , which contain all physical effects, it is necessary to derive them analytically using the original theoretical method, namely the function iterative method with a closure theory, to understand the underlying physical mechanisms.
Here, we replaced the second moment of the turbulence velocity,
, with turbulent kinetic energy and kinetic helicity to derive and apply
. Unlike conventional theories, the effect of kinetic helicity can make the second moment value negative, demonstrating that magnetic diffusion is directed toward
. In other words, when the poloidal fluid motion
combines with the toroidal fluid motion
and the magnetic field, the direction of diffusion can change. We briefly examined this mechanism in
Figure 8. Negative magnetic diffusion is not a forbidden specific phenomenon. It becomes positive when combined with the Laplacian
, leading to energy migration toward larger scales. Even hydrodynamics suggests conditions that imply negative diffusion. Specifically, for two eddies aligned in the same direction,
, a region where
can appear momentarily as
[
40]. However, the impact is not significant, suggesting that the interaction between the magnetic field and
—which inherently involves helicity—plays a more prominent role.
Meanwhile, we determined the correlation length l through a trial-and-error method, but the relationship between this length and the strength of kinetic helicity in the system remains unclear. Furthermore, as the effect of the magnetic field increases, fails to accurately represent . This implies that should include magnetic field effects in addition to turbulent kinetic energy and kinetic helicity. However, since the direct relationship between u and b is currently unclear, it is difficult to explain how to modify the identity of the second moment. This appears to require further research.
Overall, the small
effect and the large
effect in magnetic field amplification explain how the magnetic field is induced in plasma. In systems where charged particles interfere with other magnetic eddies, it shows that the effect of magnetic diffusion due to fluid characteristics is greater than electromagnetic effects. However, this does not imply that the
effect is insignificant. As seen in
Figure 8, the
effect appears to determine the system’s polarity in conjunction with the conservation of magnetic helicity, while the actual amplification of the magnetic field is likely governed by
diffusion. As
or
, or the degree of nonlinearity, increases, the fluidic characteristics of plasma, due to its electrical neutrality in plasmas, become more dominant. Furthermore, in certain regions, the enhanced magnetic field naturally evolves in a way that lowers the energy density by increasing the eddy scale, following the law of entropy increase. Finally, in this paper, we examined the case where
; however, to accurately describe natural phenomena, it is also necessary to investigate the general ranges where
and
. The study on
and
presented in this work aims to reproduce the DNS and observed magnetic fields to obtain accurate profiles and, from these, understand the physical mechanisms of the internal processes that give rise to
and
.
