Abstract
We present a Fisher information matrix study of the parameter estimation precision achievable by a class of future space-based, “mid-band”, gravitational wave interferometers observing monochromatic signals. The mid-band is the frequency region between that accessible by the Laser Interferometer Space Antenna (LISA) and ground-based interferometers. We analyze monochromatic signals observed by the TianQin mission, gLISA (a LISA-like interferometer in a geosynchronous orbit) and a descoped gLISA mission, gLISAd, characterized by an acceleration noise level that is three orders of magnitude worse than that of gLISA. We find that all three missions achieve their best angular source reconstruction precision in the higher part of their accessible frequency band, with an error box better than sr in the frequency band [] Hz when observing a monochromatic gravitational wave signal of amplitude that is incoming from a given direction. In terms of their reconstructed frequencies and amplitudes, TianQin achieves its best precision values in both quantities in the frequency band [] Hz, with a frequency precision Hz and an amplitude precision . gLISA matches these precisions in a frequency band slightly higher than that of TianQin, [] Hz, as a consequence of its smaller arm length. gLISAd, on the other hand, matches the performance of gLISA only over the narrower frequency region, [] Hz, as a consequence of its higher acceleration noise at lower frequencies. The angular, frequency, and amplitude precisions as functions of the source sky location are then derived by assuming an average signal-to-noise ratio of 10 at a selected number of gravitational wave frequencies covering the operational bandwidth of TianQin and gLISA. Similar precision functions are then derived for gLISAd by using the amplitudes resulting in the gLISA average SNR being equal to 10 at the selected frequencies. We find that, for any given source location, all three missions display a marked precision improvement in the three reconstructed parameters at higher gravitational wave frequencies.
Keywords:
gravitational waves; space-based interferometry; data analysis; monochromatic gravitational wave signals PACS:
04.80.Nn; 95.55.Ym; 07.60.Ly
1. Introduction
The first direct observation of a Gravitational Wave (GW) signal was announced by the Laser Interferometer Gravitational-Wave Observatory (LIGO) project [1] on 11 February 2016 [2]. This event, named GW150914, represents one of the most important achievements in experimental physics today. Two interferometers, located in Livingston (Louisiana) and Hanford (Washington), simultaneously measured and recorded strain data, providing researchers with a remarkable level of confidence in the detection. This allowed them to conclusively identify the source of the observed GW signal as a merging binary system of black holes, with component masses of and . The event was detected at a luminosity distance of Mpc, corresponding to a redshift of , with uncertainties reported at the confidence level.
The direct observation of this event marks the beginning of GW astronomy [3], a historic moment comparable in magnitude to the early astronomical observations made in the year 1610 by Galileo Galilei [4]. Quite like Galileo then, we have just started to explore the capabilities of our new observational tools, which promises to reveal secrets of the universe inaccessible by any other means.
Since the first detection announcement in 2016, several other GW signals have been observed by the LIGO–Virgo–KAGRA (LVK) collaboration [1,5]. Ground-based detectors that are widely separated on Earth and operate in coincidence can discriminate a GW signal from random noise and provide enough information for reconstructing the source’s sky location, luminosity distance, mass(es), dynamic time scale, and other observables [6,7].
Space-based interferometers, on the other hand, have enough data redundancy to validate their measurements and uniquely reconstruct an observed signal with their six links along their three arms [8,9]. Missions such as LISA 1 or the Chinese mission TaiJi [10], with their million-kilometers-long optical links, will be able to estimate the phase noise levels and its statistical properties over the observational frequency bands they operate within. By relying on a Time-Delay Interferometric (TDI) measurement [8] that is insensitive to GWs [11], space-based interferometers will assess their in-flight noise characteristics in the lower part of the band, that is, at frequencies smaller than the inverse of the round-trip light time. Instead, at higher frequencies where they can synthesize three independent interferometric measurements, they will be able to perform a data consistency test based on the null stream technique [7,12,13], that is, a non-linear parametric combination of the TDI measurements that achieves a pronounced minimum at a unique point in the search parameter space when a signal is present. In addition, by taking advantage of the Doppler and amplitude modulations introduced by the motion of the array around the Sun on long-lived GW signals, space-based interferometers will measure the values of the parameters associated with the GW source of the observed signal [9].
Although a space-based array such as LISA and TaiJi can synthesize the equivalent of four interferometric TDI combinations (the Sagnac TDI combinations , for example) [8], their best sensitivity levels are achieved only over a relatively narrow region of the mHz frequency band. At frequencies lower than the inverse of the round-trip light time, the sensitivity of a space-based GW interferometer is determined by the level of residual acceleration noise associated with the nearly free-floating proof masses of the onboard gravitational reference sensor and the size of the arm length. In this region of the accessible frequency band, the magnitude of a GW signal in the interferometric data scales, in fact, linearly with arm length. Instead, at frequencies higher than the inverse of the round-trip light time, the sensitivity is primarily determined by the photon count statistics at the photodetectors [14]. The sensitivity in this part of the accessible frequency degrades linearly with the arm length because the shot-noise is inversely proportional to the square root of the received optical power and the GW signal no longer scales with the arm length. From the above considerations, we may conclude that, for a defined configuration of the on-board science instrumentation, the best sensitivity level and the corresponding bandwidth over which it is achieved are uniquely determined by the size of the array.
The frequency range over which the best sensitivity level of a space-based interferometer is achieved is particularly important when detecting signals that increase in frequency over time, such as those produced by merging binary black hole systems. Astrophysical models theoretically predict [15] a vast population of coalescing binary systems, with masses similar to those involved in GW150914. They will generate GWs with characteristic amplitudes detectable by both LISA and TaiJi within a frequency range spanning approximately Hz to Hz. The lower frequency limit corresponds to the assumption of observing a GW150914-like signal for a period of five years (approximately equal to its coalescing time). The upper limit instead corresponds to the value at which the signal’s amplitude equals the interferometer’s sensitivity, in this case that of LISA. Although one could in principle increase the size of the optical telescopes and rely on more powerful lasers so as to increase the upper frequency cut-off to enlarge the observational bandwidth, in practice, pointing accuracy and stability requirements together with the finiteness of the on-board available power would result in a negligible gain.
A natural way to broaden the millihertz band, so as to fill the frequency gap between the region accessible by LISA and TaiJi and that by ground interferometers, is to fly additional interferometers of smaller arm length. An interferometer such as that of the Chinese TianQin mission [16], or the geosynchronous Laser Interferometer Space Antenna (gLISA) [14,17,18], could naturally accomplish this scientific objective.
In this article, we present an analysis of the precision achievable by TianQin, gLISA, and by a de-scoped version of gLISA, gLISAd, to reconstruct the parameters characteristic of a monochromatic signal.2 The mid-band frequency region is expected to contain a wide variety of sources of sinusoidal signals. The white-dwarf–white-dwarf binary systems present in our galaxy and hundreds of thousands to millions of binary black holes with masses in the (10–100 ) range may be regarded as primary monochromatic sources for these detectors. The GW signals emitted by these systems can last for several months in the mid-band frequency region accessible by these detectors.
Analyses similar to those presented in this article have already appeared in the literature for the LISA and TianQin missions [20,21,22]. There, however, either the long-wavelength approximation for the detector response was used over the entire operational frequency band [20,21] or a representation of the interferometer response in the complex domain [22] resulted in a mathematically incorrect expression of the Doppler modulation due to the interferometer motion around the Sun.
Our analysis relies on the published noise spectral densities characterizing the sensitivities of the TianQin and gLISA missions, and of the mission concept gLISAd. gLISA, which has been analyzed for about ten years by a collaboration of scientists and engineers at the Jet Propulsion Laboratory, Stanford University, the University of California San Diego, the National Institute for Space Research (INPE, Brazil), and Space Systems Loral, was shown to fit the cost limits of the NASA astrophysics probe class mission program. It is expected to achieve shot-noise-limited sensitivity in the higher end of its accessible frequency band as a consequence of its arm length being equal to roughly km range, surpassing LISA’s sensitivity by a factor of about 353. TianQin and gLISA will reach their optimal sensitivity in a frequency band that perfectly complements those covered by LISA, TaiJi, and advanced LIGO (aLIGO). As a result, the combined detection range for GWs will extend across – Hz (see Figures below).
Regarding the onboard scientific payload of gLISA, which primarily includes the laser, optical telescope, and inertial reference sensor, we assume a noise performance comparable to that of LISA [17]. Other subsystems are considered to contribute noise levels that lead to a high-frequency noise spectrum primarily governed by photon-counting statistics. For further details, we refer the reader to Appendix A of Ref. [14]. As mentioned earlier, we will also consider a gLISA de-scoped mission, gLISAd, which differs from the gLISA specifications by displaying an acceleration noise level that is worse by three orders of magnitudes. As gravitational wave astronomy has now become a reality, it is likely that other space-based interferometer designs of lower costs and less demanding technological developments will be pursued. As will be shown in this article, a mission such as gLISAd could deliver good science on a reduced budget as it could rely on a technology that has already been flown on the Gravity Recovery and Climate Experiment Follow-On (GRACE-FO) mission [19]4.
The paper is organized as follows. In Section 2, we first derive the expression of the TDI Michelson response [8] of a geocentric interferometer rotating around the Sun and Earth. We carry this out for the equilateral configurations of the TiaQin, gLISA, and gLISAd missions. TianQin is a triangular constellation with a nominal arm length km, designed to orbit the Earth with a period days while also revolving around the Sun alongside Earth. The constellation is inclined at an angle of relative to the ecliptic plane. gLISA and gLISAd are instead in a geosynchronous orbit that is inclined with respect to the equator [17]. These motions introduce amplitude and Doppler modulations on the observed monochromatic signals that define the accuracies and precisions of the measured parameters characterizing them. In Section 3, after presenting a brief reminder of the Fisher information matrix formalism, we then derive the analytic expressions of the Fisher information matrix associated with the responses of the three orthogonal TDI channels A, E, and T [24] to a sinusoidal GW signal5. This is described by an amplitude , a frequency in the rest frame of the source, and two angles () associated with the location of the source in the sky. The analytic expressions of the Fisher information matrix, which were derived using the Python library (version 3.13.2) for symbolic mathematics SymPy [25] were then imported into a Python program for graphical representation and analysis. In Section 4, we discuss the results of our analysis. We find that all three missions achieve their best angular source reconstruction precision in the higher part of their accessible frequency band, with an error box better than sr in the frequency band [] Hz when observing a monochromatic GW signal of amplitude and incoming from a given direction. In terms of their reconstructed frequencies and amplitudes, TianQin achieves its best precisions in both quantities in the frequency band [] Hz, with a frequency precision Hz and an amplitude precision . gLISA matches these precisions in a frequency band slightly higher than that of TianQin, [] Hz, as a consequence of its shorter arm length. gLISAd, on the other hand, matches the performance of gLISA only in the narrower frequency region [] Hz, as a consequence of its higher acceleration noise at lower frequencies.
By assuming a signal-to-noise ratio of 10 (averaged over source sky location and polarization states) for the TianQin and gLISA missions, we then derive their angular, frequency, and amplitude precisions as functions of the source sky location for a selected number of GW frequencies covering the operational bandwidths of the three interferometers. Relying on the same GW amplitudes resulting in an SNR of 10 for gLISA, we then obtain the angular, frequency, and amplitude precisions for the gLISAd mission. The three sets of results show, for any given source-sky location, that all three missions display a marked precision improvement in the three reconstructed parameters at higher GW frequencies.
2. The Interferometer Response to a Sinusoidal Signal
The geometry of the array is shown in Figure 1. The three spacecraft continuously exchange six laser beams, with each incoming beam being combined with the local laser light at the receiving optical bench. This process yields six Doppler measurements, denoted as (). To enable the detection and analysis of GWs at the expected signal amplitudes, the frequency fluctuations of the six lasers—present in all Doppler measurements—must be suppressed to a level below that of secondary noise sources, such as proof mass and optical path noise [8].
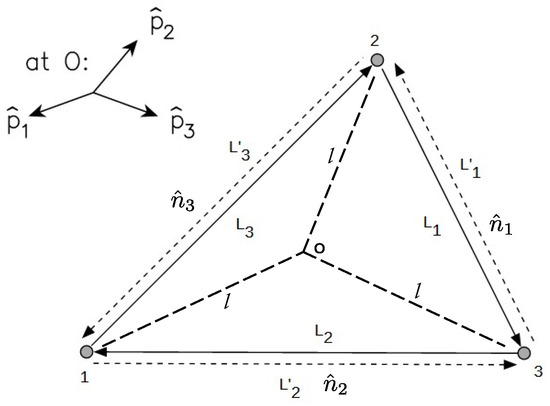
Figure 1.
Schematic configuration of the interferometer. Each spacecraft is positioned at an equal distance from a central reference point o, with unit vectors defining the directions from o to each of the three spacecraft. The unit vectors represent the directional axes between pairs of spacecraft, following the specified orientation. The optical paths are denoted by , with depending on whether the light beam is seen propagating clock- or anti-clockwise, and the spacecraft index i corresponds to the opposite spacecraft. Primed and unprimed delays account for differences in the light travel times due to the Sagnac effect [8].
We adopted the following labeling convention for the Doppler data. , for instance, represents the one-way Doppler shift recorded at spacecraft 3 for a signal transmitted from spacecraft 2 along arm 1. , on the other hand, denotes the Doppler shift measured at spacecraft 2 for a signal received from spacecraft 3 along arm . Due to the rotation of the triangular spacecraft array around both the Sun and the Earth, the one-way light travel times between any pair of spacecraft are generally unequal as a consequence of the Sagnac effect [26]. To accurately combine the data, it is necessary to account for the signal propagation delays, which depend on the direction of light travel along each link. Following [27], the arms are labeled with single numbers given by the opposite spacecraft; e.g., arm 2 (or ) is opposite spacecraft 2; primed delays are used to distinguish light times taken in the counter-clockwise sense and unprimed delays for clockwise light times (see Figure 1).
Frequency fluctuations arise from various sources, including the lasers, optical benches, proof masses, fiber optics, and the inherent noise at the photodetectors (such as shot-noise fluctuations). These fluctuations imprint distinct time-dependent signatures on the Doppler observables; see Refs. [28,29] for a detailed discussion. The one-way Doppler response to GWs, denoted as , was initially derived in Ref. [30] for a stationary spacecraft array and later extended in Ref. [31] to account for the realistic orbital configuration of the LISA array as it orbits the Sun.
Let us examine, for example, the “second-generation” unequal-arm Michelson TDI observables [32], denoted as (). These observables can be expressed in terms of the Doppler measurements as follows:6
with and obtained from Equation (1) by appropriately permuting the spacecraft indices. The semicolon notation in Equation (1) highlights the fact that applying multiple sequential delays to a measurement is inherently non-commutative. This arises from the time dependence of the light travel times and (), meaning that the order in which delays are applied is crucial for effectively canceling laser noise [8,27,33,34]. To be clear, the delayed measurement is generally not equal to , illustrating the asymmetry of the delay operations (using units where the speed of light ).
It is clear that and the corresponding first generation TDI combination, X, (the unequal-arm Michelson observable valid for a stationary array [28,30]) will display different responses to the GW signal and the secondary noise sources. However, since the corrections introduced by the motion of the array to the GW signal response and to the secondary noises are proportional to the product between their time derivatives and the difference between the actual light travel times and those valid for a stationary array, it is easy to show [35] that, at 1 Hz, the largest corrections to the signal and the noises (due to the Sagnac effect) are about four orders of magnitude smaller than their main counterparts. Since the amplitudes of these corrections scale linearly with the Fourier frequency, we can completely disregard this effect over the entire bands of the interferometers considered [27]. Furthermore, for the orbits of the three arrays analyzed, the three arm lengths will differ at most by ∼0.2% [14] and the resulting degradation in signal-to-noise ratio introduced by adopting signal templates that neglect the inequality of the arm lengths will be of only a few tenths of a percent. For these reasons, in what follows, we will focus on the expressions of the GW responses of various second-generation TDI observables by disregarding the differences in the delay times experienced by light propagating clockwise and counterclockwise, and by assuming the three arm lengths of the considered three geocentric missions to be constant and equal to their nominal reference values. In the case of TianQin, for example, its arm length , while for gLISA and gLISAd, . This approximation has been referred to in the literature as the rigid adiabatic approximation [36], and the formalism of Ref. [37] discussed this for LISA.
From these considerations, we infer that the expressions of the GW signal and the secondary noises in the second-generation TDI combinations, (), can be expressed in terms of the corresponding equal arm-length combinations, ). For instance, the GW signal in the second-generation unequal-arm Michelson combination, , can be expressed in terms of the GW response of the corresponding equal arm-length Michelson combination, , in the following way [12]:
From Equation (2) above, we conclude that any data analysis technique for the second-generation TDI combinations can be obtained by considering the corresponding equal-arm length TDI expressions. In what follows, we will focus our attention on the three equal arm-length Michelson combinations ().
The expressions of the relative frequency changes , induced by a transverse traceless gravitational wave propagating from the source direction , have been derived in Ref. [30] for a stationary triangular array and are equal to
where represents the delay of the gravitational wavefront to the position of the spacecraft relative to the center of the array and is the unit vector indicating the location of spacecraft i from the center o of the array. The terms contain the effects of the GW signal at the times of emission and reception of the laser photon packet and are equal to
where is the GW tensor; the three-tensor and are traceless and transverse to , and their components in the TT-gauge coordinates frame are equal to
In Equation (5), and are the wave’s two independent polarization functions. In the case of a monochromatic GW signal, they can be expressed as
where and are the GW (constant) amplitudes of each polarization and is the GW angular frequency.7
The expression of the equal-arm Michelson interferometer response to a sinusoidal GW can be written as follows (see Appendix A):
where
and
In Equations (9) and (10), the delay-times are equal to , , , and , while . The expressions for the other two equal-arm Michelson interferometers, and , can be obtained from by permutation of the spacecraft indices.
Since the array is not stationary, the GW signal will appear in the equal-arm Michelson measurement as modulated in amplitude and phase. In order to derive its expression, it is convenient to express it in the inertial reference frame centered on the Solar System Baricenter (SSB). In the coordinate frame where the spacecraft are at rest, their positions relative to the center of the array , and the unit vectors along the arms can be written as follows:
and
where
The trajectories of the three GW space observatories analyzed in this work are geocentric, with their three spacecraft simultaneously orbiting Earth and the Sun. Additionally, the normal vectors of their detector plane point in specific (constant) directions in the sky. Since the observatory’s guiding centers lie on the ecliptic plane, it is convenient to introduce a SSB ecliptic coordinate system. In these coordinates, we align the x axis with the direction to the vernal equinox, and define as the vector from the origin of the SSB coordinate system to the guiding center of the array. Here, AU is constant, the function describes the motion of the guiding center around the Sun and yr is the rotation frequency around the Sun. The vectors and can then be expressed in the SSB coordinate system as [31].8
and
is the rotation matrix that relates the coordinates attached to the interferometer to those defined earlier in the SSB, and is equal to
where denotes the inclination of the orbital plane of the spacecraft array relative to the ecliptic and the function represents the rotation phase of each spacecraft around the guiding center of the array with angular velocity . For simplicity, we set , so that at , the vector is aligned with the x axis of the SSB coordinate system.
A transverse traceless tensor, associated with a GW signal emitted by a source located at latitude and longitude relative to the SSB coordinate system, is given by the following expression:
where
where () are the usual Euler angles for which the wave’s direction of propagation is equal to .
In the SSB frame and considering that , the terms inside the sine and cosine functions in Equations (9) and (10) assume the following forms:
Here, represents the combination of retarded times L and , while refers to the Doppler phase, which can be expressed in terms of the angular coordinates of the GW source as .
Based on these considerations and the coordinate transformations discussed above, the interferometer’s response to a sinusoidal signal in the SSB can be written in the following form:
with
and
After substituting Equations (24) and (25) into Equation (23) and some straightforward algebra, assumes the following form
where is the GW phase relative to the SSB. Applying a procedure analogous to that described above, we can derive the responses of the other two Michelson interferometers and relative to the SSB.
Furthermore, we can obtain the responses of the three orthogonal TDI channels A, E, and T in terms of , , and by relying on the following expressions:
After some algebra, the three orthogonal channels () assume the following forms:
where
with the index . The terms are the functions derived earlier defining the expressions of the responses .
3. The Fisher Information Matrix Formalism
Different sources of GWs emit distinct types of signal, which are characterized by properties intrinsically linked to their physical parameters. These may be the distribution of the source mass, its distance to the interferometer, its location in the sky, and the angular frequency of the emitted radiation. To understand the physical nature of the source that emitted an observed GW signal, it is essential to estimate the parameters that characterize it and evaluate their precisions. Here, we will estimate the precisions achieved by the GW missions TianQin, gLISA, and gLISAd by relying on the Fisher Information Matrix (FIM) formalism in the case of sinusoidal signals. We will assume these signals to be characterized by an amplitude , a frequency , and two Euler angles () associated with the wave’s direction of propagation. As we will describe in more detail in the section presenting our results, we have limited our analysis to linearly and circularly polarized signals. This is because the results corresponding to an arbitrary polarization will be “in between” those presented.
The Fisher information matrix of a GW interferometer response , whose Fourier transform is denoted by , is given by the following general expression (see, e.g., [20,38,39]):
where represents the one-sided noise power spectral density and is the partial derivative of the interferometer response to a gravitational wave signal with respect to the component of the parameter vector . Since the noise spectrum can be treated as constant over the relatively narrow bandwidth centered on the frequency of the signal, Equation (38) can be rewritten in the following form as a consequence of the Parseval theorem (see, e.g., [22,40]):
Equation (39) allows us to derive the following expressions for the Fisher information matrices of the optimal combinations () [8,24,31]:
where , , and are the one-sided noise power spectral densities of the () combinations, respectively.
Under the assumption of Gaussian noise, from the above expressions, it is easy to see that the Fisher information matrix for the combined () configuration, , is equal to the sum of Fisher information matrices of the optimal combinations ():
Our analysis of the parameter precisions achievable by the three space missions will therefore rely on the expression of the Fisher information matrix obtained from Equation (41).
As mentioned earlier, we limited our analysis to GW signals characterized by (i) linear polarization, for which and , and (ii) circular polarization, with . In the case of binary systems, for instance, these scenarios correspond to specific orientations of the source orbital plane relative to the line of sight to the detector: edge-on, where the orbital plane is aligned with the line of sight, and face-on, where the orbital plane is perpendicular to the line of sight. For this reason, our Fisher information matrix has dimensions in the parameter space.
Since the inverse of the Fisher information matrix is equal to the covariance matrix, we conclude that the parameters’ precisions are equal to the following [39]:
Note that the diagonal elements of the above matrix represent the variances of the corresponding parameters, while the off-diagonal ones are the covariances between pairs of them. To quantify the error box of source sky localization, we will use the following estimate of the ellipse area determined by the errors , , and ,
Expressions of the Signal’s Derivatives
To derive the expression of the Fisher information matrix (Equation (39)), we need to calculate the derivatives of the detector’s TDI responses to the signal with respect to the parameters . They can be obtained from Equations (34)–(36). The derivation of the response of the A combination is shown below. The expressions for the other two TDI responses, E and T, follow a similar procedure and structure. Thus, after some long but straightforward algebra, the derivatives of A can be expressed in the following form:
where
and the expressions of are given by Equation (37). From these expressions, we then obtain the product of the two derivative terms as follows:
Note that () are functions of the parameter vector , and both depend on the derivatives with respect to . Furthermore, by applying the trigonometric identities , , and , Equation (47) can be rewritten as follows:
The integral appearing in the Fisher matrix, with the integrand given by Equation (48), is evaluated over an assumed observation time equal to one year. During such a period of time, the terms in the integrand multiplying , and vanish. This is because their time dependencies are periodic with periods much shorter than one year and are therefore orthogonal to the functions and . For this reason, the expression of the element in the Fisher information matrix integrand reduces to the following one:
The analytic expressions of the partial derivatives of the interferometer response were derived using the symbolic package SymPy [25]. A specialized function was developed to systematically identify all time-dependent terms within the equations. These terms were organized into a dataframe with one column for the time-dependent components, another column for their corresponding coefficients, and a third for the expressions of their symbolic integrals. The final expression of the integral was obtained by summing all the coefficients in the dataframe, each multiplied by its corresponding symbolic integral. This approach was essential to avoid potential errors associated with numerical integration and to obtain the final elements of the Fisher information matrix as functions of the GW parameters.
4. Parameters Precisions
In this section, we evaluate the measurement precisions of the parameters () that characterize a monochromatic GW signal. We derive their magnitudes for (i) linearly and (ii) circularly polarized signals, in terms of the location of the source in the sky described by angles (, ), the signal frequency , and for a selected number of GW amplitudes . The precisions of the angular parameters () are combined in an angular error box whose size is determined through Equation (43).
Our results are obtained by integrating the Fisher information matrix over a period year. The GW amplitudes are selected by requiring the average SNR of the TianQin and gLISA missions to be equal to 10 at the following selected frequencies: Hz. From the graph of the optimal sensitivity [8] of the gLISA mission (see Figure 2), we can then infer the values of the GW amplitudes that correspond to an SNR of 10 and use them in the analysis of gLISAd. As we will see, since gLISAd is penalized at lower frequencies by an acceleration noise that is 1000 times larger than that of gLISA, its scientific capabilities are severely impacted in this frequency band. It should be noted, however, that since gLISA and gLISAd share the same trajectory, their precisions would become equal with GW signals of larger amplitudes, resulting in an SNR of 10 in gLISAd.
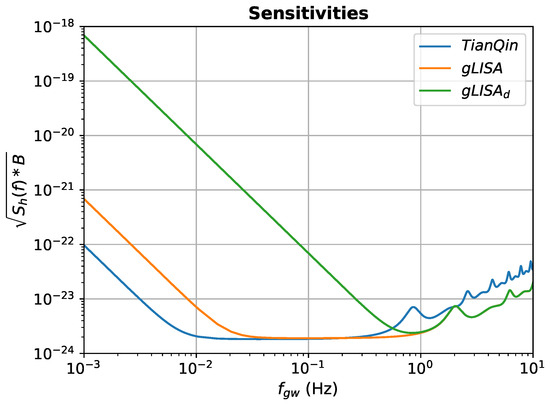
Figure 2.
Sensitivity curves, , for the three missions considered [8]. is equal to the noise spectrum divided by the r.m.s. GW response taken over sources randomly distributed over the celestial sphere and of random polarization states. An integration time of one year has been assumed, which corresponds to a frequency bin .
Our analysis is performed using optimal combinations () for an equal-arm array. Their corresponding one-sided noise power spectral densities () are given by the following expressions [8]:
where and are the acceleration and optical path noise spectra, respectively [8]. The magnitude of these spectra depends on the specific GW mission considered, and they are equal to
The above expressions of the TianQin noise spectra were obtained from [22], those for gLISA are as in [17], and those for gLISAd differ from those of gLISA by degrading the magnitude of its acceleration noise by a factor of . Note that these noise spectra are for relative frequency fluctuations as we work with fractional Doppler measurements throughout this article.
Based on these noise spectra and the expression of the Fisher information matrix derived earlier, we can then derive the parameter precisions characterizing a monochromatic GW signal. In the following subsections, we present our results for the three interferometer missions. We first plot the source location error, , as a function of the GW frequency and for three values of the GW amplitude: . This is achieved for both linearly and circularly polarized GW signals to quantify the differences between them. We then plot the precisions of the GW amplitude and the GW frequency as functions of the GW frequency and polarization states. Our results agree quite well with the corresponding analytic expressions () given below [38,40]:
where is the nominal distance from the center of the interferometer to the SSB (in seconds), is the observation time, and is the corresponding signal-to-noise ratio averaged over the source directions and polarization states of the wave.
The presented analysis offers insight into the relative performance of the detectors. We consider signals at frequencies Hz and whose amplitudes are such as to result in an average SNR of 10 for the TianQin and gLISA missions. In Table 1, we provide the GW amplitudes that result in such an SNR for TianQin and gLISA, and we provide the average SNR of gLISAd when the values for the amplitudes are as in the case of gLISA. Since the SNR achievable by gLISAd with these amplitudes at frequencies smaller than 1 Hz is less than 1, it will come as no surprise that its achievable precisions in the signal parameters will be rather poor in this part of the band. However, at frequencies larger than 1 Hz, gLISAd will equal the performance of gLISA.

Table 1.
Values of the GW amplitudes, at the selected five GW frequencies, resulting in an average SNR of 10 for TianQin and gLISA. The SNRs for gLISAd at the gLISA GW amplitudes are also provided.
4.1. TianQin Parameter Estimation Errors
In Figure 3a, we plot the angular resolution, , of TianQin as a function of the signal frequency and for three values of the GW amplitude (, ). This is achieved by selecting the source location to be at (, ), which corresponds to the sky location of a galactic binary system to be observed by TianQin [16]. The effects of GW polarization are also investigated by plotting the angular resolutions for linear (dashed lines) and circular (continuous lines) polarizations. As expected, the angular errors for the two polarizations differ by about a factor of 2, while their values scale quadratically with the wave’s amplitude [41] (see Equation (58)). Also, the angular errors given by Equation (58) and our results obtained using the Fisher information matrix formalism are in good agreement, as can easily be verified. In Figure 3b, we then plot the precision of the GW frequency, , as a function of the GW frequency and the same three GW amplitudes. We may notice, in agreement with Equation (59), that it scales linearly with the GW amplitude, and the results for the two polarizations differ only by a factor of . In Figure 3c, we then show the precision of the GW amplitude, . Again, in agreement with Equation (60), we see that it is independent of the value of the GW amplitude itself and depends mildly on the polarization state of the wave, as the dashed and continuous lines again differ by a factor of .
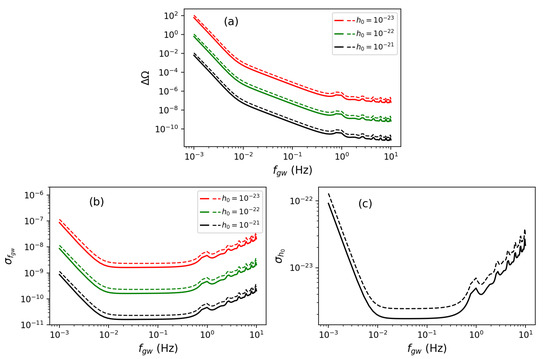
Figure 3.
TianQin angular (a), frequency (b), and amplitude (c) precisions as functions of the GW frequency, , and for three values of the GW amplitude. The source location was selected to be at (, ), which corresponds to the sky location of a galactic binary system to be observed by TianQin. Continuous lines are for circular polarization, while dashed lines are for linear polarization. See text for a detailed discussion.
It is important to highlight that the frequency and amplitude errors are proportional to the sensitivity (Figure 2), exhibiting larger values at both low and high frequencies. In contrast, the angular error decreases as frequency increases, achieving its best value around 10 Hz—a characteristic that does not align with the sensitivity curve. This behavior can be understood through the frequency dependence of the angular precision. Equations (58)–(60) describe the general relationship between the precision of the observables, the SNR, and the GW frequency. In particular, for a given GW amplitude, the SNR is inversely proportional to the sensitivity curve. Consequently, Equations (59) and (60), which determine the precision of the GW frequency and amplitude, reflect their proportionalities to the sensitivity curve. Equation (58), on the other hand, shows that the angular precision is proportional to the squared sensitivity and inversely proportional to the square of the GW frequency. This results in lower precision at lower frequencies compared to higher ones, as seen in part (a) of Figure 3.
In what follows, we present the precisions for different positions of the source in the sky. Figure 4 shows the TianQin angular precision as a function of the location of the source, (), for the following selected GW frequencies: , , , 1, 10 Hz. This is done for (a) linear and (b) circular polarized signals, and for a signal-to-noise ratio (averaged over polarization states and source locations) equal to 10.
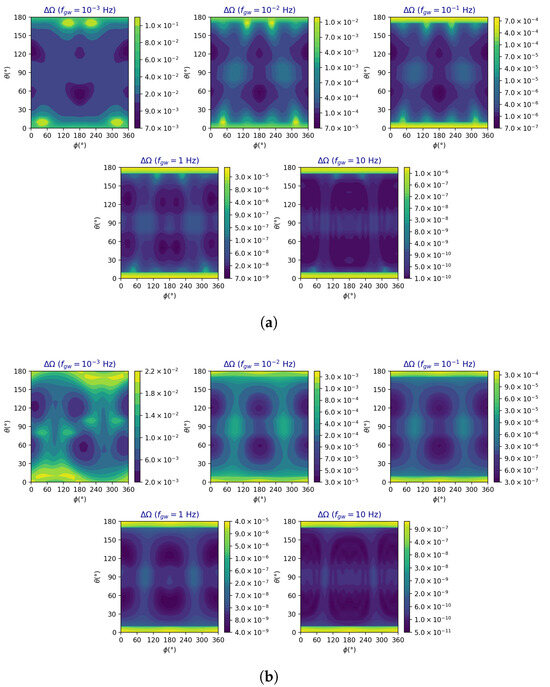
Figure 4.
TianQin angular precision as a function of the location of the source in the sky and for the selected five GW frequencies. The average signal-to-noise ratio has been taken to be equal to 10 and the polarization of the waves is linear in (a) and circular in (b).
The angular resolutions for both linearly and circularly polarized GWs show some degradation at and for some values of the angle , which depend on the frequency of the GW and the polarization state. This is a consequence of the plane of the TianQin array being almost orthogonal to the plane of the ecliptic. At Hz, , for instance, and for linearly polarized waves, we may notice that at , the angular resolution degrades by about an order of magnitude w.r.t. its best value. Similarly, at , we notice the same degradation at , complementary to the configuration with . We may also observe that the angular precision and its dynamic range improve throughout the sky as the GW frequency increases. At Hz, for example, the dynamic range in angular resolution for linearly polarized signals is approximately three orders of magnitude and increases to approximately four orders of magnitude at . For circularly polarized signals, the angular resolution and its dynamic range at each GW frequency improve further by approximately a factor of ten over the linear polarization case.
In Figure 5, we turn to the precision in the reconstructed wave amplitude in terms of the location of the source in the sky, the five GW frequencies (, , , 1, 10 Hz) and for (a) linearly and (b) circularly polarized waves, respectively. As in the case of the angular precision, here the amplitude precision also shows a loss along the directions and for some values of the angle . We may also notice that, independently of the GW polarization, the precision in the amplitude increases with the GW frequency in the interval Hz and decreases with the GW frequency in the interval Hz. This is due to the dependence of the TianQin sensitivity curve on the GW frequency (see Figure 2). Also, as expected, the precision of the reconstructed amplitude is better for circularly polarized GW signals, while the corresponding dynamic ranges over the source sky location are comparable for the two polarizations.
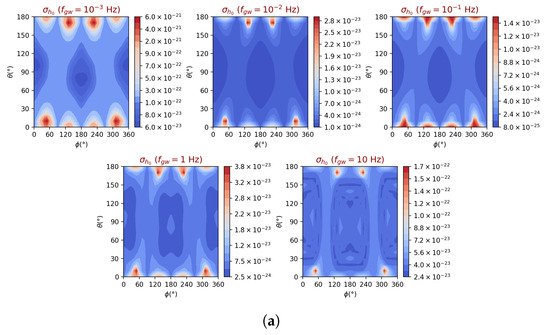
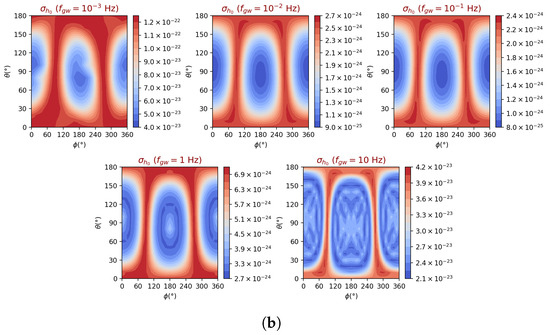
Figure 5.
TianQin GW amplitude precision, , as a function of the location of the source in the sky and for selected five GW frequencies. The average signal-to-noise ratio has been assumed to be equal to 10 and the polarization of the wave has been chosen to be linear in (a) and circular in (b).
In the next two sets of contour plots, we finally present the TianQin GW frequency precisions, , as functions of the source sky location, for the same five GW frequencies considered in the earlier plots, and for an average SNR of 10. Figure 6a shows the precision for linearly polarized waves, while Figure 6b covers circularly polarized signals. Both contour plots show a dynamic range equal to approximately 10 across the entire sky and for all GW frequencies considered. Although the difference in magnitude of the precision between the two polarizations is on average equal to a factor of at the frequencies considered, the equal-level contours from the two polarizations show some marked differences in terms of the location of the source in the sky. Also, like the previous precision contour plots, here we may notice that at and for some values of , the frequency precision shows some degradation. This is because at these source locations, the signal-to-noise ratio is penalized by the inclination of the array w.r.t. the plane of the ecliptic (equal to approximately ). Optimal precisions are achieved around and for frequencies in the range [] Hz, and for both linear and circular polarizations. At higher frequencies, the location of the optimal points changes. This is because at these frequencies, the antenna patterns become functions of the GW frequency and the direction-dependent travel time of the GW across the array.
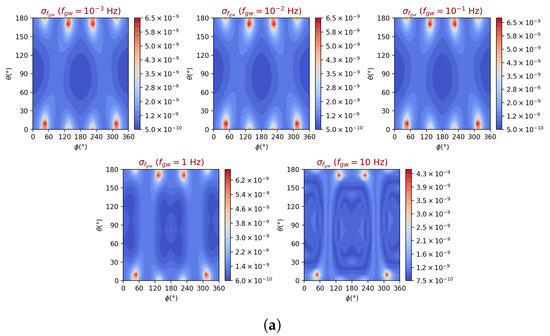
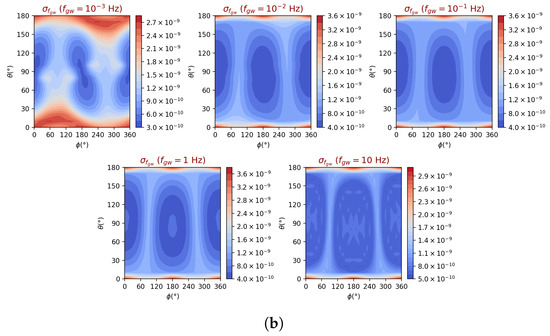
Figure 6.
TianQin estimated precision of the GW frequency, , as a function of the location of the source in the sky and for selected five GW frequencies. The average signal-to-noise ratio has been assumed to be equal to 10 and the polarization of the wave has been chosen to be linear in (a) and circular in (b).
4.2. gLISA Parameter Estimation Errors
The analysis for gLISA follows a similar approach to that described earlier for TianQin, with key differences arising from its distinct orbit and design. In Figure 7a, we present the angular resolution, , as a function of for the same source location selected for TianQin and the same three GW amplitudes (, , ). The results are shown for circular (solid lines) and linear (dashed lines) polarizations, which differ by approximately a factor of two as well. Compared to TianQin, the angular error for gLISA is larger at lower frequencies; above Hz, the performance of both detectors becomes comparable in terms of the source location error. A similar trend is observed in the precision of the frequency and amplitude, as shown in Figure 7b,c, respectively. Both precisions follow the behavior of the sensitivity curve, presented in Figure 2, with lower precision at low frequencies, better precision in the intermediate range, and degraded precision above .
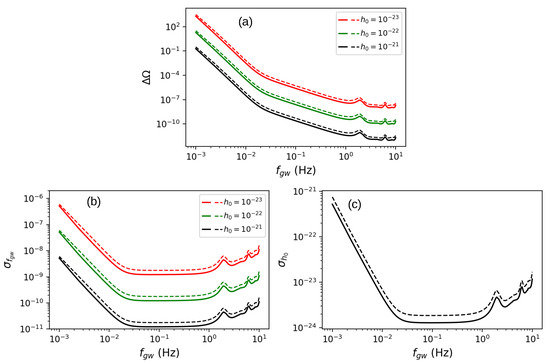
Figure 7.
The gLISA angular (a), frequency (b), and amplitude (c) precisions as functions of the GW frequency, , for the same source location and the three values of the GW amplitude considered in the previous subsection for TianQin. Continuous lines are for circular polarization, while dashed lines are for linear polarization. See text for a detailed discussion. As in the case of the TianQin mission, the angular precision is not proportional to the sensitivity curve as it includes an additional frequency dependence captured by Equation (58).
The angular resolution of gLISA, , as a function of the source location in the sky (), is presented in Figure 8 for linear (a) and circular (b) polarizations, and for the same GW frequencies selected for TianQin. A degradation in angular resolution is observed around , which becomes less pronounced at higher frequencies due to the increased sensitivity of the detector in this part of the accessible band and changes with the polarization state of the wave. At Hz and , the angular resolution of linearly polarized waves degrades by approximately an order of magnitude compared to its best value. In contrast, at Hz, the localization error spans three orders of magnitude between its minimum and maximum values.
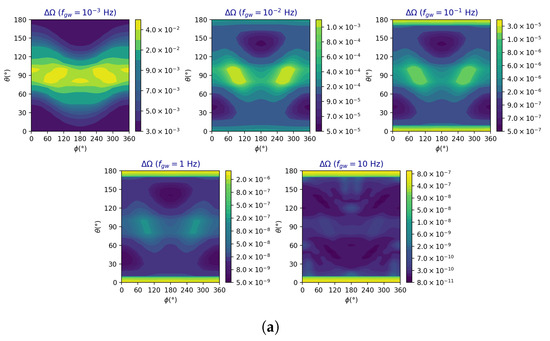
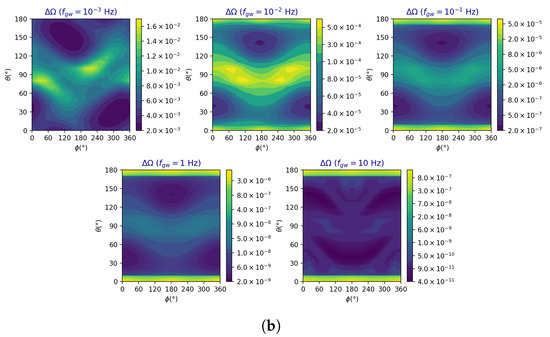
Figure 8.
gLISA angular precision as a function of the location of the source in the sky and for the selected five GW frequencies. The average signal-to-noise ratio has been taken to be equal to 10 and the polarization of the waves is linear in (a) and circular in (b).
The differences in orders of magnitude between the minimum and maximum errors show no significant variation when comparing linear and circular polarizations. Moreover, in all cases, the best angular resolutions are achieved for the source locations around , , and , and , , indicating optimal sensitivity in these regions.
It should be noted that the region of lower precision around is “complementary” to the regions of lower precision estimated for TianQin. This distinction arises from the differences in orbital configurations: TianQin’s orbital plane is nearly perpendicular to the ecliptic, whereas gLISA operates with a 1.5° tilt relative to the celestial equator. Another aspect to note is that the maximum angular error for gLISA is seven times lower than that of TianQin at a frequency of 1 Hz and for circularly polarized waves.
In Figure 9, we show the precisions in the GW amplitude as functions of the GW frequency, the location of the source in the sky, and for linearly (a) and circularly (b) polarized signals. It can be seen that the minimum and maximum values differ by only a factor of approximately three, indicating relatively small variation between different frequencies. Similarly to angular precision, these graphs show a loss around and its proximity, which varies with the angle. In addition, as for TianQin, the amplitude precisions are slightly better for circular than for linear polarization.
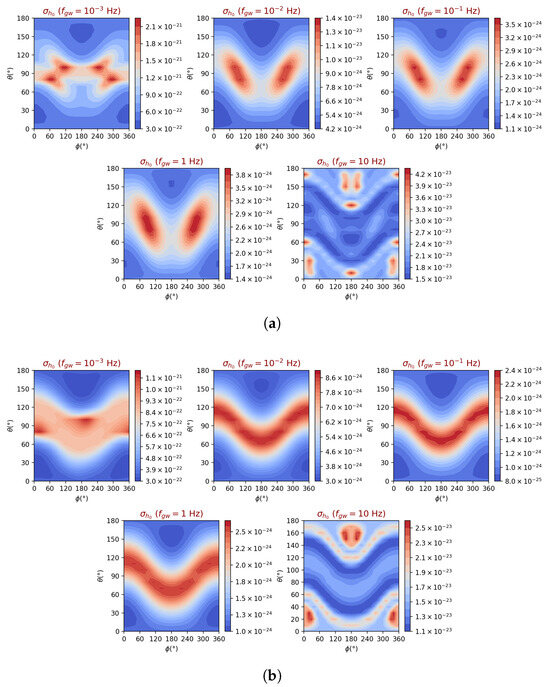
Figure 9.
gLISA GW amplitude precision as a function of the location of the source in the sky and for five selected GW frequencies. The average signal-to-noise ratio has been assumed to be equal to 10 and the polarization of the wave has been chosen to be linear in (a) and circular in (b).
The errors in the reconstructed GW frequency, , as a function of the source’s location, are presented in Figure 10. They exhibit a structure very similar to that observed in the graphs for the amplitude, except for that at frequency . For linear polarization, the error at Hz follows the same behavior as the other frequencies, while for circular polarization, the optimal responses are now located at and . Additionally, the error dynamic range for circular and linear polarizations is nearly identical.
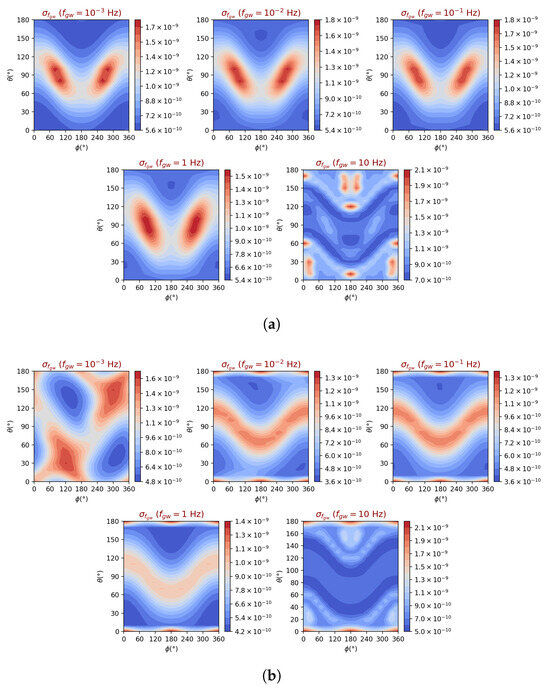
Figure 10.
gLISA GW frequency estimated precision as a function of the location of the source in the sky and for selected five GW frequencies. The average signal-to-noise ratio has been assumed to be equal to 10 and the polarization of the wave has been chosen to be linear in (a) and circular in (b).
4.3. gLISAd Parameter Estimation Errors
The performance of gLISAd at low frequencies, shown in Figure 11a–c, reflects its low sensitivity in this part of the frequency band. However, at higher frequencies, gLISAd achieves precisions comparable to those of gLISA and slightly better than those characterizing TianQin. Part (a) presents the angular precision as a function of the GW frequency for the same source location considered earlier for TianQin and gLISA. The results for the precision at Hz are not presented due to the poorer sensitivity of this detector at that frequency. At Hz, the angular error is six orders of magnitude worse than that of TianQin and five orders of magnitude worse than that of gLISA. However, at Hz and above, the gLISAd precisions in angular, amplitude, and frequency reconstructions become equal to those of gLISA and better than those of TianQin. In part (b), the frequency error closely follows the sensitivity curve for the three GW amplitudes considered. Finally, part (c) illustrates the amplitude error, which is independent of the signal amplitude and is therefore represented using a single color.
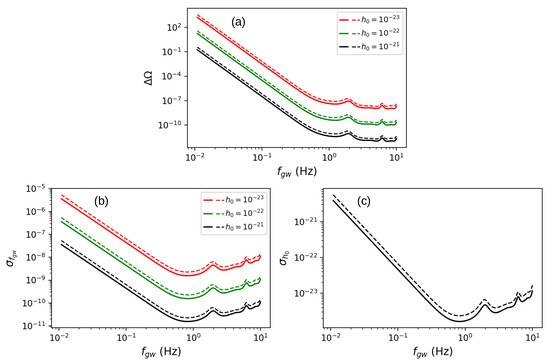
Figure 11.
The angular (a), frequency (b), and amplitude (c) precisions as functions of the GW frequency, , and for three values of the GW amplitude. The angular location of the GW signal has been selected as in the previous two corresponding sets of graphs for TianQIn and gLISA. Continuous lines are for circular polarization, while dashed lines are for linear polarization. See the text for a detailed discussion. Again, the angular precision is not proportional to the sensitivity curve as it includes an additional frequency dependence captured by Equation (58).
In the following contour plots, the precision of each parameter is now presented not for a specific source, but as a function of the angular positions ( and ) at frequencies ranging from to 10 Hz.
Figure 12 shows the angular precision for linearly polarized waves (a) and circularly polarized waves (b). As expected, due to the detector geometry and trajectory, the contour plot topologies are identical to those of gLISA, with maximum and minimum error values larger due to the poorer sensitivity at frequencies smaller than 1 Hz. However, at frequencies larger than 1 Hz, we recover the same contour lines shown for gLISA as at these frequencies gLISA and gLISAd achieve the same SNR. A similar behavior is also evident in the amplitude and frequency precision contours discussed below.
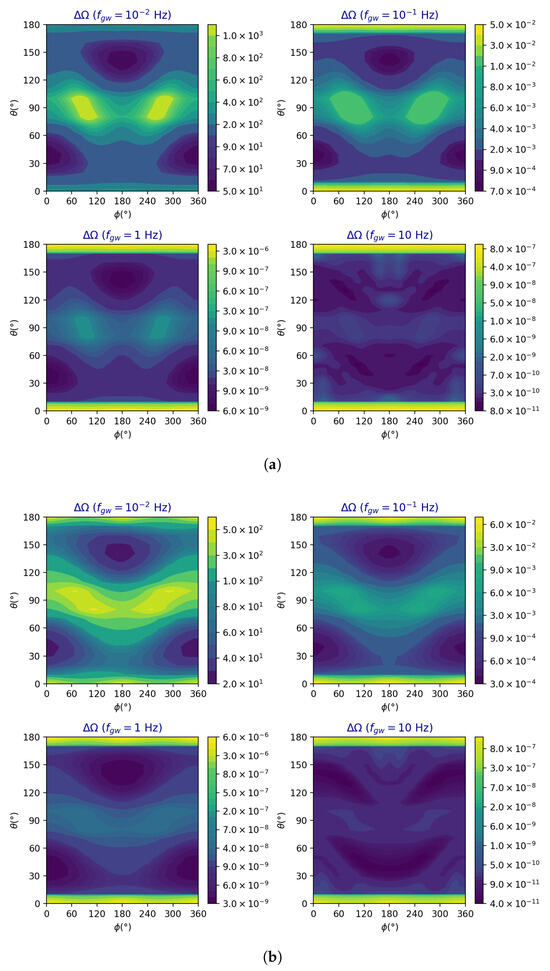
Figure 12.
gLISAd angular precision as a function of the location of the source in the sky and for the four selected GW frequencies. The GW amplitudes are those given in Table 1, which result in an average SNR of 10 in gLISA. The polarization of the waves is linear in (a) and circular in (b).
The amplitude precisions are given in Figure 13, for linearly polarized (a) and circularly polarized signals, while the frequency precisions are shown in Figure 14a,b.
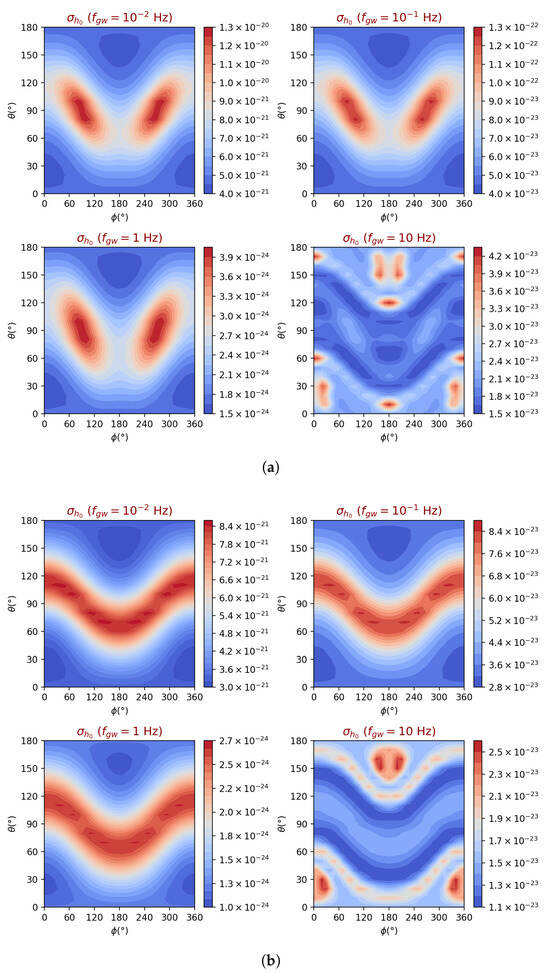
Figure 13.
gLISAd GW amplitude precision as a function of the location of the source in the sky and for four selected GW frequencies. The GW amplitudes are those given in Table 1, which result in an average SNR of 10 in gLISA. The polarization of the waves is linear in (a) and circular in (b).
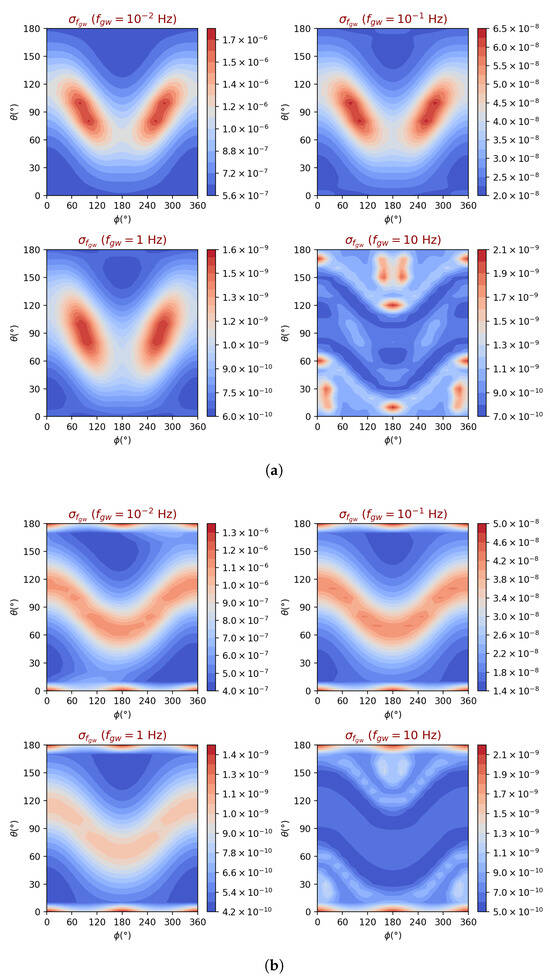
Figure 14.
gLISAd 2GW frequency estimated precision as a function of the location of the source in the sky and for selected four GW frequencies. The GW amplitudes are those given in Table 1, which result in an average SNR of 10 in gLISA. The polarization of the waves is linear in (a) and circular in (b).
It is interesting to estimate the GW amplitudes, at the five selected frequencies, which would make gLISAd achieve an average SNR of 10 like gLISA. From Table 1, it is easy to infer that, at Hz, an amplitude would give an SNR of 10 in gLISAd. Instead, at Hz, an amplitude would be required, while at Hz, a smaller amplitude of would be needed. These signals could be emitted by either super-massive black holes in the lower part of the band or stellar-mass binary black-holes at higher frequencies. As mentioned above, at frequencies above 1 Hz gLISAd achieves the same sensitivity as gLISA, matching its precisions in this frequency band.
5. Summary of the Results and Conclusions
We presented a Fisher information matrix study of the parameter estimation precisions achievable with a class of future space-based, mid-band, GW interferometers observing monochromatic signals. Mid-band gravitational wave detectors have the potential to play an important role in enabling multi-band observations when operated in conjunction with longer arm length interferometers (such as LISA and Taiji) and ground-based interferometers. By bridging the frequency gap between these instruments, mid-band detectors can extend the observational window allowing the tracking of GW sources across a wide frequency range—see, e.g., [15,42]—in principle from to Hz.
In this work, we analyzed monochromatic signals observed by the TianQin mission, gLISA (a LISA-like interferometer in a geosynchronous orbit), and a de-scoped gLISA mission, gLISAd, characterized by an acceleration noise level that is three orders of magnitude worse than that of gLISA. We found that all three missions achieve their best angular source reconstruction precision in the higher part of their accessible frequency band, with an error box better than sr in the frequency band [] Hz when observing a monochromatic GW signal of amplitude and incoming from a given direction. In terms of their reconstructed frequencies and amplitudes, TianQin achieves its best precisions in both quantities in the frequency band [] Hz, with a frequency precision Hz and an amplitude precision . gLISA matches these precisions in a frequency band slightly higher than that of TianQin, [] Hz, as a consequence of its smaller arm length. gLISAd, on the other hand, matches the performance of gLISA only over the narrower frequency region, [] Hz, as a consequence of its higher acceleration noise at lower frequencies. The angular, frequency, and amplitude precisions as functions of the source sky location were then derived by assuming an average signal-to-noise ratio of 10 at a selected number of GW frequencies covering the operational bandwidth of TianQin and gLISA. Similar precision functions were then derived for gLISAd by using the amplitudes resulting in the gLISA average SNR of 10 at the same selected frequencies. We found that, for any given source location, all three missions displayed a marked precision improvement in the three reconstructed parameters at higher GW frequencies.
The precision levels presented in this article are based on the noise spectral densities presented in the literature for the TianQin and gLISA mission concepts. However, it should be noted that the key parameter that contains the noise and determines the precision values is the SNR. This can also be seen in the analytical expressions provided by Equations (58)–(60), for the precision of the parameters considered. An increase or decrease in SNR will result in different parameter precisions, as can be inferred from the aforementioned equations.
Our analysis has shown that these three missions will be able to fill the frequency gap between the region accessible by LISA and TaiJi and that by ground interferometers. The mid-band frequency region is expected to contain a wide variety of sources of sinusoidal signals, such as the white-dwarf–white-dwarf binary systems present in our galaxy and hundreds of thousands to millions of binary black holes now routinely observed by ground-based interferometers. The GW signals emitted by these systems can last for several months in the mid-band frequency region accessible by these detectors, making them primary candidates for detection and analysis, to be then followed up with ground-based interferometers. We plan to extend our analysis to chirping signals emitted by these sources in a forthcoming article.
Author Contributions
Conceptualization, M.F.S., T.A.F. and M.T.; methodology, M.F.S., T.A.F. and M.T.; software, M.F.S. and T.A.F.; validation, M.F.S., T.A.F. and M.T.; formal analysis, M.F.S., T.A.F. and M.T.; investigation, M.F.S., T.A.F. and M.T.; resources, M.F.S., T.A.F. and M.T.; data curation, M.F.S., T.A.F. and M.T.; writing—original draft preparation, M.F.S., T.A.F. and M.T.; writing—review and editing, M.F.S., T.A.F. and M.T.; visualization, M.F.S. and T.A.F.; supervision, M.T.; project administration, M.T.; funding acquisition, M.F.S., T.A.F. and M.T. The authors of this article contributed equally to the work reported. All authors have read and agreed to the published version of the manuscript.
Funding
For M.F.S., this research was funded by Conselho Nacional de Desenvolvimento Científico e Tecnológico, grant No. 173535/2023-2. For T.A.F., this research was funded by the National Science Foundation under grant number NSF-PHY2110509. For M.T., this research was funded by the Polish National Science Center Grant No. 2023/49/B/ST9/02777.
Data Availability Statement
Data are contained within the article.
Acknowledgments
We thank our institutions (UTFPR/UFPR, LSU and INPE) for their kind hospitality while this work was being carried out.
Conflicts of Interest
The authors declare no conflicts of interest. The funders had no role in the design of the study; in the collection, analysis, or interpretation of data; in the writing of the manuscript; or in the decision to publish the results.
Abbreviations
The following abbreviations are used in this manuscript:
| GW | Gravitational Wave |
| TDI | Time-Delay Interferometry |
Appendix A. Michelson Response to a Sinusoidal Signal
Based on the one-way Doppler time series given in Equations (3) and (4), we can obtain the two-way Doppler data measured onboard spacecraft 1 and then derive the response of the Michelson interferometer with equal-arm-length, . The following expressions of the two-way Doppler responses measured onboard spacecraft 1 from arm 3 () and arm 2 () are equal to
and
From the above two-way Doppler combinations, it is then possible to obtain the following expression for the equal-arm-length Michelson combination :
Since , and so forth by cyclic permutation of the indices, can be rewritten as follows:
The terms can be further expanded to explicitly show their dependence on the parameters characterizing the GW signal. Thus, substituting into the expression of , we obtain
where and are given by
Note the expression of the equal-arm-length Michelson response, Equation (A4), displays the characteristic “four-pulse” structure [30], as the GW signal appears in it at four distinct delay times. Let us denote these time delays as , where the subscript a represents the various combinations of these retarded times. Thus, Equation (A6) can be written as
where we have defined . By substituting the terms from Equation (A8) into Equation (A4) of the Michelson interferometer, and after performing some algebraic manipulations, we obtain the response of a stationary Michelson interferometer to a sinusoidal GW signal:
where
and
where the time delays () are equal to , , and . Following a similar procedure as described above, the responses of the other two Michelson interferometers, and measured onboard spacecraft 2 and 3, respectively, can be derived.
Notes
| 1 | The LISA mission went through several design assessments over its development cycle, each resulting in a different mission sensitivity. Here, we will adopt the latest LISA mission concept, characterized by an arm length of Mkm, an acceleration noise of , and a high-frequency noise of . |
| 2 | gLISA is a constellation of three LISA-like satellites in an Earth geosynchronous orbit; gLISAd differs from gLISA by having an acceleration noise level that is worse by three orders of magnitude and equal to over the “mid-region” frequency band. This acceleration noise level has already been demonstrated by the Gravity Recovery and Climate Experiment Follow-On (GRACE-FO) mission [19]. |
| 3 | The gLISA sensitivity and the analysis of the magnitude of the noises that define it have been discussed in the main body and appendix of Ref. [14]. In addition, the LISA Pathfinder experiment [23] has demonstrated the noise level of the optical bench adopted by LISA to be three orders of magnitude smaller than its anticipated value, thereby confirming the scientific capabilities of gLISA. |
| 4 | GRACE-FO demonstrated that two Earth-orbiting spacecraft could coherently and continuously track each other with laser light and achieve a noise level of at frequencies above 100 mHz. |
| 5 | The A, E, and T combinations were first presented in [24] and may be written in terms of the three Unequal-Arm Michelson combinations X, Y, and Z [8] by using the following expressions: , , . These combinations are designed to maximize the SNR achievable by a space-based interferometer. |
| 6 | In addition to the primary inter-spacecraft Doppler measurements (), which contain the GW signal, each spacecraft also conducts on-board metrology measurements. These are necessary due to the presence of two lasers and two proof masses in the onboard drag-free control system. However, as demonstrated in [8], these onboard measurements can be appropriately time-delayed and linearly combined with the inter-spacecraft measurements, effectively reducing the system to an equivalent configuration with only three lasers and six one-way inter-spacecraft measurements, simplifying the interferometric analysis. |
| 7 | The expressions of the wave’s two independent amplitudes can also be written using complex notation in the following way: . However, care must be taken when performing calculations similar to those presented in [22] as ℜ parts of the complex representation of the wave should be taken first. |
| 8 | For ease of calculation, we have approximated the trajectory of the centers of the arrays around the SSB to be perfectly circular with a period of 1 year. |
References
- Aasi, J.; Abbott, B.P.; Abbott, R.; Abbott, T.; Abernathy, M.R.; Ackley, K.; Adams, C.; Adams, T.; Addesso, P. Advanced LIGO. Class. Quantum Grav. 2015, 32, 074001. [Google Scholar] [CrossRef]
- Abbott, B.P.; Abbott, R.; Abbott, T.D.; Abernathy, M.R.; Acernese, F.; Ackley, K.; Adams, C.; Adams, T.; Addesso, P.; Adhikari, R.X.; et al. Observation of Gravitational Waves from a Binary Black Hole Merger. Phys. Rev. Lett. 2016, 116, 061102. [Google Scholar] [CrossRef]
- Thorne, K.S. Gravitational Radiation. In 300 Years of Gravitation; Hawking, S., Israel, W., Eds.; Cambridge University Press: Cambridge, UK, 1987. [Google Scholar]
- Favaro, A.; Barbera, F. (Eds.) Le Opere di Galileo Galilei; Edizione Nazionale: Florence, Italy, 1966; Volume 20. [Google Scholar]
- Accadia, T.; Acernese, F.; Alshourbagy, M.; Amico, P.; Antonucci, F.; Aoudia, S.; Arnaud, N.; Arnault, C.; Arun, K.G.; Astone, P.; et al. Virgo: A laser interferometer to detect gravitational waves. J. Instrum. 2012, 7, P03012. [Google Scholar] [CrossRef]
- Schutz, B.F.; Tinto, M. Antenna patterns of interferometric detectors of gravitational waves—I. Linearly polarized waves. Mon. Not. R. Astron. Soc. 1987, 224, 131–154. [Google Scholar] [CrossRef]
- Gürsel, Y.; Tinto, M. Near optimal solution to the inverse problem for gravitational-wave bursts. Phys. Rev. D 1989, 40, 3884–3938. [Google Scholar] [CrossRef]
- Tinto, M.; Dhurandhar, S.V. Time-Delay Interferometry. Living Rev. Relativ. 2021, 24, 6. [Google Scholar] [CrossRef]
- Amaro-Seoane, P.; Audley, H.; Babak, S.; Baker, J.; Barausse, E.; Bender, P.; Berti, E.; Binetruy, P.; Born, M.; Bortoluzzi, D.; et al. Laser Interferometer Space Antenna. arXiv 2017, arXiv:1702.00786. [Google Scholar]
- Hu, W.R.; Wu, Y.L. The Taiji Program in Space for gravitational wave physics and the nature of gravity. Natl. Sci. Rev. 2017, 4, 685–686. [Google Scholar] [CrossRef]
- Tinto, M.; Armstrong, J.W.; Estabrook, F.B. Discriminating a gravitational wave background from instrumental noise in the LISA detector. Phys. Rev. D 2001, 63, 021101. [Google Scholar] [CrossRef]
- Tinto, M.; Larson, S.L. The LISA zero-signal solution. Class. Quantum Gravity 2005, 22, S531. [Google Scholar] [CrossRef][Green Version]
- Searle, A.C.; Sutton, P.J.; Tinto, M. Bayesian detection of unmodeled bursts of gravitational waves. Class. Quantum Gravity 2009, 26, 155017. [Google Scholar] [CrossRef]
- Tinto, M.; de Araujo, J.C.; Aguiar, O.D.; Alves, M.E. Searching for gravitational waves with a geostationary interferometer. Astropart. Phys. 2013, 48, 50–60. [Google Scholar] [CrossRef]
- Sesana, A. Prospects for Multiband Gravitational-Wave Astronomy after GW150914. Phys. Rev. Lett. 2016, 116, 231102. [Google Scholar] [CrossRef]
- Luo, J.; Chen, L.S.; Duan, H.Z.; Gong, Y.G.; Hu, S.; Ji, J.; Liu, Q.; Mei, J.; Milyukov, V.; Sazhin, M.; et al. TianQin: A space-borne gravitational wave detector. Class. Quantum Grav. 2016, 33, 035010. [Google Scholar] [CrossRef]
- Tinto, M.; DeBra, D.; Buchman, S.; Tilley, S. gLISA: Geosynchronous laser interferometer space antenna concepts with off-the-shelf satellites. Rev. Sci. Instrum. 2015, 86, 014501. [Google Scholar] [CrossRef]
- Tinto, M.; de Araujo, J.C.N.; Kuga, H.K.; Alves, M.E.S.; Aguiar, O.D. Orbit analysis of a geostationary gravitational wave interferometer detector array. Class. Quantum Gravity 2015, 32, 185017. [Google Scholar] [CrossRef]
- Abich, K.; Abramovici, A.; Amparan, B.; Baatzsch, A.; Okihiro, B.B.; Barr, D.C.; Bize, M.P.; Bogan, C.; Braxmaier, C.; Burke, M.J.; et al. In-Orbit Performance of the GRACE Follow-on Laser Ranging Interferometer. Phys. Rev. Lett. 2019, 123, 031101. [Google Scholar] [CrossRef]
- Cutler, C. Angular resolution of the LISA gravitational wave detector. Phys. Rev. D 1998, 57, 7089–7102. [Google Scholar] [CrossRef]
- Cutler, C.; Vecchio, A. LISA’s angular resolution for monochromatic sources. AIP Conf. Proc. 1998, 456, 95–100. [Google Scholar] [CrossRef]
- Zhang, C.; Gong, Y.; Wang, B.; Zhang, C. Accuracy of parameter estimations with a spaceborne gravitational wave observatory. Phys. Rev. D 2021, 103, 104066. [Google Scholar] [CrossRef]
- Armano, M.; Audley, H.; Auger, G.; Baird, J.T.; Bassan, M.; Binetruy, P.; Born, M.; Bortoluzzi, D.; Brandt, N.; Caleno, M.; et al. Sub-Femto-g Free Fall for Space-Based Gravitational Wave Observatories: LISA Pathfinder Results. Phys. Rev. Lett. 2016, 116, 231101. [Google Scholar] [CrossRef]
- Prince, T.A.; Tinto, M.; Larson, S.L.; Armstrong, J.W. LISA optimal sensitivity. Phys. Rev. D 2002, 66, 122002. [Google Scholar] [CrossRef]
- Meurer, A.; Smith, C.P.; Paprocki, M.; Čertík, O.; Kirpichev, S.B.; Rocklin, M.; Kumar, A.; Ivanov, S.; Moore, J.K.; Singh, S.; et al. SymPy: Symbolic computing in Python. PeerJ Comput. Sci. 2017, 3, e103. [Google Scholar]
- Shaddock, D.A. Operating LISA as a Sagnac interferometer. Phys. Rev. D 2004, 69, 022001. [Google Scholar] [CrossRef]
- Tinto, M.; Estabrook, F.B.; Armstrong, J.W. Time delay interferometry with moving spacecraft arrays. Phys. Rev. D 2004, 69, 082001. [Google Scholar] [CrossRef]
- Estabrook, F.B.; Tinto, M.; Armstrong, J.W. Time-delay analysis of LISA gravitational wave data: Elimination of spacecraft motion effects. Phys. Rev. D 2000, 62, 042002. [Google Scholar] [CrossRef]
- Tinto, M.; Estabrook, F.B.; Armstrong, J.W. Time-delay interferometry for LISA. Phys. Rev. D 2002, 65, 082003. [Google Scholar] [CrossRef]
- Armstrong, J.W.; Estabrook, F.B.; Tinto, M. Time-Delay Interferometry for Space-Based Gravitational Wave Searches. Astrophys. J. 1999, 527, 814–826. [Google Scholar] [CrossRef]
- Królak, A.; Tinto, M.; Vallisneri, M. Optimal filtering of the LISA data. Phys. Rev. D 2009, 154, 022003, Erratum in Phys. Rev. D 2007, 76, 069901. [Google Scholar] [CrossRef]
- Tinto, M.; Dhurandhar, S.; Malakar, D. Second-Generation Time-Delay Interferometry. Phys. Rev. D 2022, 107, 082001. [Google Scholar] [CrossRef]
- Cornish, N.J.; Hellings, R.W. The effects of orbital motion on LISA time delay interferometry. Class. Quantum Grav. 2003, 20, 4851–4860. [Google Scholar] [CrossRef]
- Shaddock, D.A.; Tinto, M.; Estabrook, F.B.; Armstrong, J.W. Data combinations accounting for LISA spacecraft motion. Phys. Rev. D 2003, 68, 061303. [Google Scholar] [CrossRef]
- Edlund, J.A.; Tinto, M.; Królak, A.; Nelemans, G. White-dwarf–white-dwarf galactic background in the LISA data. Phys. Rev. D 2005, 71, 122003. [Google Scholar] [CrossRef]
- Rubbo, L.J.; Cornish, N.J.; Poujade, O. Forward modeling of space-borne gravitational wave detectors. Phys. Rev. D 2004, 69, 082003. [Google Scholar] [CrossRef]
- Seto, N. Annual modulation of the galactic binary confusion noise background and LISA data analysis. Phys. Rev. D 2004, 69, 123005. [Google Scholar] [CrossRef]
- Seto, N. Long-term operation of the Laser Interferometer Space Antenna and Galactic close white dwarf binaries. Mon. Not. R. Astron. Soc. 2002, 333, 469–474. [Google Scholar] [CrossRef]
- Maggiore, M. Gravitational Waves. Volume 1: Theory and Experiments; Oxford University Press: Oxford, UK, 2007; ISBN 978-0-19-171766-6/978-0-19-852074-0. [Google Scholar] [CrossRef]
- Takahashi, R.; Seto, N. Parameter Estimation for Galactic Binaries by the Laser Interferometer Space Antenna. Astrophys. J. 2002, 575, 1030. [Google Scholar] [CrossRef]
- Bretthorst, G.L. Bayesian Spectrum Analysis and Parameter Estimation; Springer: Berlin/Heidelberg, Germany, 1988. [Google Scholar]
- Tinto, M.; de Araujo, J.C.N. Coherent observations of gravitational radiation with LISA and gLISA. Phys. Rev. D 2016, 94, 081101. [Google Scholar] [CrossRef]
Disclaimer/Publisher’s Note: The statements, opinions and data contained in all publications are solely those of the individual author(s) and contributor(s) and not of MDPI and/or the editor(s). MDPI and/or the editor(s) disclaim responsibility for any injury to people or property resulting from any ideas, methods, instructions or products referred to in the content. |
© 2025 by the authors. Licensee MDPI, Basel, Switzerland. This article is an open access article distributed under the terms and conditions of the Creative Commons Attribution (CC BY) license (https://creativecommons.org/licenses/by/4.0/).