Abstract
Studies of active region (AR) lifetimes are mostly restricted to short-lived ARs. The aim of this paper is to include recurrent ARs, which should be identified unambiguously. The first step is the algorithmic listing of possible returns; then, the candidates are visually checked using the unique HTML-feature of the Debrecen sunspot database. The final step is application of an asymmetric Gaussian function, introduced in previous articles, for short-lived ARs. This function has a surprisingly good fit to the data on correctly identified recurrent sunspot groups over several rotations enabling the reconstruction of the development on the far side of the sun. The Gnevyshev–Waldmeier rule for the area–lifetime relationship is not applicable for recurrent ARs; however, as a novel approach, a linear regression analysis extended to long lifetimes made it possible to recognize two populations of sizes for which two different area–lifetime relationships can be obtained. The lifetimes exhibit weak dependencies on the heliographic latitude and solar cycle phase. If an asymmetric Gaussian cannot be fit to the data, then they presumably belong to consecutive members of an active nest.
1. Introduction
The significance of the study of long-lived sunspot groups lies in its diagnostic possibilities for investigating the evolution of active regions (ARs). Their development phase is governed by the buoyancy, while the decay phase is governed by the turbulent erosion process. Both of these impacts may have local or other dependencies that are yet to be unveiled. The lifetimes of ARs have been studied in several investigations. While these were based on large sample sizes, most of them were restricted to short-lived sunspot groups traceable entirely on the solar disc from birth to disappearance, thereby restricting the aforementioned diagnostic possibilities. Moreover, these samples were selected typically by algorithms without visual checking, and usually did not present the lists of selected groups.
The first results were formulated in the well-known Gnevyshev–Waldmeier rule. Gnevyshev [1] analyzed about 3000 sunspot groups from the Greenwich Photoheliographic Results (GPR) for the years 1912–1934 which emerged and disappeared on the visible solar disc between −73 and +73 degrees from the central meridian. Waldmeier [2] formulated Gnevyshev’s results for the lifetime (LT) as Amax ≈ W · LT, where Amax is provided in millionths of solar hemisphere (MSH), the LT in days, and the constant (W) is about 10 MSH day−1. He also found that the lifetime depends on the heliographic latitude. Petrovay and van Driel-Gesztelyi [3] also found a linear relationship between the lifetimes and peak areas of sunspot groups using data from the Debrecen photoheliographic results. They used 128 individual sunspots that emerged and died on the visible disk, and obtained a value of W equal to 10.89 MSH day−1. Henwood et al. [4] analyzed the long-lived sunspot groups extracted from the GPR. They found that the lifetime of sunspot groups increased by a 1.4 factor within 1940 and 1950. Javaraiah [5] also pointed out that larger sunspot groups live longer, but reported an exponential relationship between Amax and LT. Namekata et al. [6] studied starspots and sunspots, concluding that the starspots have shorter lifetime than obtained from the empirical Gnevyshev–Waldmeier rule, however they found a lifetime of more or less 100 days for starspots. They also noticed that complex sunspot groups have high flare occurrence rates and short lifetimes. Yazev et al. [7] obtained similar results, finding that larger sunspot groups with higher growth and decay rates had higher flare productive. Pojoga and Cudnik [8] found a relationship between active nests and solar flare occurrences. Nagovitsyn et al. [9] analyzed 578 recurrent sunspot groups and confirmed the Gnevyshev–Waldmeier rule in the form AM = 13.1·LT based on an interval of 140 years. In a recent study, Forgács-Dajka et al. [10] investigated the lifetimes of sunspot groups and found that the relation between lifetimes and maximum areas can be described by a cubic root function instead of the Gnevyshev–Waldmeier rule. The smallest sunspot groups live for only a few days, while the majority of the studied ARs live longer. There are also ARs that return in several rotations. Nagovitsyn and Pevtsov [11] pointed out that ARs can be divided into two distinct populations: one containing small and short-lived sunspot groups, and another consisting of large and long-lived sunspot groups. The maxima of the logarithms of the areas of these populations are around 1.2 and 2.5, corresponding to about 16 MSH and 316 MSH, respectively.
The present paper aims to study the lifetimes of these long-lived recurrent sunspot groups and their possible relations to several circumstances. First, the materials, the principles of sampling, and the investigation methods are explained in Section 2. Section 3 presents the new results obtained based on the selected sample. Finally, our conclusions and future plans for research on this topic can be found in Section 4.
2. Materials and Methods
The present research uses the Debrecen photoheliographic data (hereafter DPD), which can be found at http://fenyi.solarobs.epss.hun-ren.hu/DPD/ (accessed on 4 July 2024)). This is the ground-based part of the set of Debrecen sunspot databases (Baranyi et al. [12]). Its time interval is the longest among them, covering 44 entire years, i.e., four Schwabe cycles. This database contains all ARs identified by the NOAA along with those identified by the staff of this catalog (NOAA number extended with one additional letter). It includes area and position data for each observed sunspot group as well as for individual sunspots. The area data are the projected total and umbral areas and those corrected for foreshortening. The heliographic latitude and longitude are also provided, along with the position angle, distance from the center of the solar disc, and longitudinal distance measured from the solar meridian in degrees (hereafter lcm). A helpful property of this catalog is its user-friendly HTML-presentation, which facilitates the identification of recurrent sunspot groups (see Figure 1).
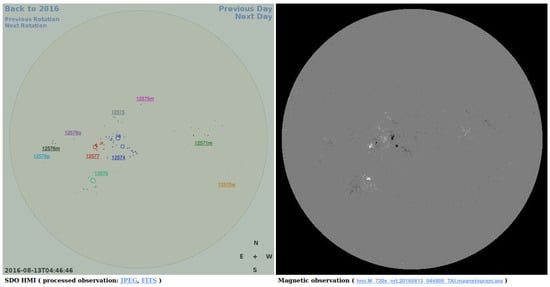
Figure 1.
HTML presentation of the data for 26 April 2016 in the DPD. The left panel is a cartoon based on the white-light observation, while the right panel shows the nearest magnetogram to the continuum image. A clickable full version of this sample is available online at http://fenyi.solarobs.epss.hun-ren.hu/DPD/2016/20160813/index.html (accessed on 4 July 2024) (Baranyi et al. [12]). Reproduced with permission from A. Ludmány, Debrecen Photoheliographic Data; published by http://fenyi.solarobs.epss.hun-ren.hu/en/databases/DPD/ (accessed on 4 July 2024).
The cartoon shows all ARs observed at that time; their numbers are taken from the NOAA. The most important feature of this presentation from the point of view of the present research is that it is easy to flip between consecutive rotations with the ’previous rotation’ and ’next rotation’ buttons. In contrast to previous studies (e.g., Nagovitsyn et al. [9], Tlatov [13,14]), this article does not use a huge dataset of recurrent sunspot groups identified by a computer program. This was our first step as well; however, during the visual check of the algorithmically suggested candidates of recurrent groups, it turned out that most were not the same group. Especially during maximum years of solar cycles (SCs), several areas on the Sun can be observed in which ARs emerge at a more frequent rate than elsewhere, sometimes with overlapping lifetimes. These are the so-called active nests. I selected recurrent sunspot groups based on the output of my computer program, which I then checked by visual inspection using the HTML-presentation of the DPD. This inspection covered the locations, morphologies, and areas of the sunspot groups to ensure that they were indeed recurring states of the same sunspot groups. Altogether, 29 recurrent sunspot groups have been selected. They can be found in the first column of Table 1, with their first observation times below. The NOAA numbers of their recurrent groups can be found in the next columns. Sunspot groups marked by asterisks have been identified as recurrent by the staff of the catalog; their original NOAA number can be found in the catalog during the second or third rotations. As some articles use the term ‘sunspot’ as an alternative to ‘sunspot group’, it may be useful to state that the present study focuses on sunspot groups, i.e., clusters of sunspots, while a single spot represents an active region only as its first or last observable member in the lifetime of the active region.

Table 1.
The entire sample of recurrent sunspot groups selected from the DPD. The first column shows the NOAA number of the active region, while rest of the columns show the NOAA numbers of recurrent ARs. Below each AR is its first observation date (FD). The date format is year-month-day according to DPD’s order. If the number of the AR is completed by a letter, this means that the AR has been identified by the staff of the Debrecen sunspot databases.
The development and decay of sunspot groups is described by tracking the variation of their total umbral areas, as the umbrae comprise the emerged magnetic flux. The areas are corrected for foreshortening. It should be admitted that the study of recurrent ARs may have some ambiguity, as certain sunspot groups may achieve their maximum phases on the far side of the Sun. This difficulty can be overcome by using the fitted asymmetric Gaussian function described by Du [15] and its somewhat modified version used in our previous articles for active regions (Muraközy et al. [16], Muraközy [17]) with entire lifetimes observable on the solar disc. The total area of the sunspot group approaches ag with the following function:
where marks the maximum height of the Gaussian curve, means the time of this maximum, a describes the asymmetry, and w characterizes the width parameter of the fitted curve. The emerging phase is usually shorter than the decay phase, i.e., the a asymmetry parameter of the fit is positive; however, certain groups exhibit a different evolution shape with a longer emerging phase. In these cases, the asymmetry parameter is negative.
This function has been fitted to the considered sets of area data using the least squares technique. To remove the center-limb variation of the area remaining after foreshortening correction, the considered data were restricted to ±40 degrees longitudinal distance from the Sun’s central meridian (lcm). The fitted parameters can be found in Table 2, with the coefficient of determination (R square) that characterizes the goodness of the fit shown below the fitting parameters.

The procedure is illustrated in Figure 2 for NOAA AR 12537 (between 26 April 2016 and 13 August 2016) and NOAA AR 9855 (between 3 March 2002 and 30 May 2002). The NOAA numbers of their recurrent states can be found in Table 1. NOAA AR 12537 emerged and disappeared on the visible disc, and can be tracked during five appearances. NOAA AR 9855 also emerged on the visible disc, but then disappeared onto the far side of the Sun. It was observed during four rotations on the solar disc. All of their observed area data are depicted by small blue dots, while observations within ±40 deg lcm are plotted by black circles with blue dots. The asymmetric Gaussian function (Equation (1)) has been fitted to the umbral area data within deg lcm, and their parameters can be found at the headlines of the panels. The first parameter () represents the height of the fitted profile, i.e., the maximum umbral area measured in MSH, while the second () shows the time of the maximum measured in days. The last two values are the width (w) and asymmetry (a) parameters. In the case of AR 12537, the time profile is almost symmetric and the distribution of the points suggests that the time of the peak area occurred on the solar far side during the second rotation. The time of the first observation is 0 in all cases. If the fitted profile extends to negative time values, this means that the AR turned to the visible disc with a certain area, i.e., it emerged on the far side. NOAA AR 9855 emerged on the visible disc and its peak area was reached on the far side before the second return. Its evolution history hints that its growing phase was more rapid than that of AR 12537, while the duration of its decay phase was higher than that of AR 12537. The rest of the figures obtained by the fitting procedure can be found in Appendix A.
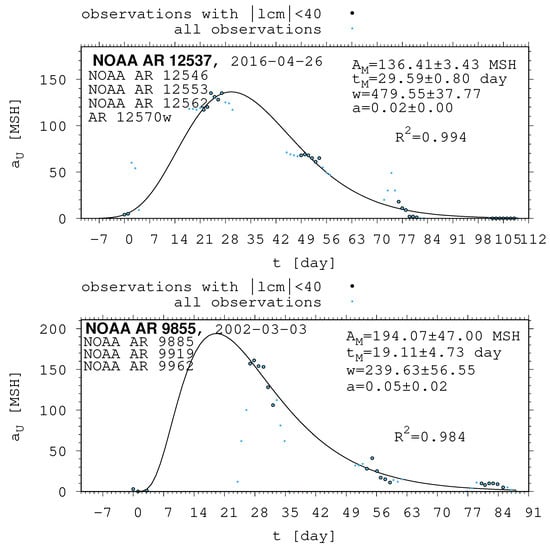
Figure 2.
NOAA AR 12537 (top panel) and NOAA AR 9855 (bottom panel), both identified as recurrent sunspot groups using the HTML presentation of the DPD. The NOAA numbers of the recurrent states of AR 12537 are 12546, 12553, 12562 and 12570w, while those of AR 9855 are 9885, 9919, and 9962. Their first observation times are 26 April 2016 and 3 March 2002, respectively. Blue dots depict all observations, while black circles filled with blue color indicate times when the groups were within ±40 degrees distance from the central meridian. The parameters of height (AM), peak time (tM), width (w), and asymmetry (a)) of the fitted Gaussian function and their errors (Equation (1)) are shown in the top right corners, with the coefficient of determination (R square) below them.
These samples show that the technique applied for short-lived ARs is fairly advantageous for multiple recurrent ARs; along with the same position, it corroborates the identity of the returning AR by demonstrating that consecutive phases of its development are observed like snapshots of its life. In almost all of these cases, the maximum phases have been reached on the far side.
3. Results
Equation (1) was fitted to the datasets of each selected and checked AR. In this section, the obtained parameters are used to study additional properties of ARs.
3.1. Recurrent Sunspot Groups
3.1.1. Lifetimes of Recurrent Sunspot Groups
To determine the lifetime, it is necessary to determine the times of emergence and disappearance. This was carried out by two methods. On the one hand, these two times can be calculated from the fitted asymmetric Gaussian. In this case, the start (t1c) and end (t2c) times belong to the area of 0.5 MSH at both ends of the curve. The calculated lifetime (LTcalc) is the difference between the start and end times. On the other hand the lifetime is calculated by taking into account the first (t1o) and the last (t2o) observation times of the sunspot group. The locations of emergence (lE) or disappearance (lD) could be on the visible disc (marked by d in Table 3) or on the far side of the Sun (marked by f). In the simplest case, the AR emerges on the earth-side of the Sun and the observation time of its first spots is the start time. If the AR emerges on the far side, then the start time is its first observation time (6 days, considering that the group’s stay on the far side is about 12 days). Thus, its error may be ±6 days. For these reasons, the time shown on the horizontal axis of Figure 2 may be negative. The end time is determined using the same method. Although the fitted functions approach the time profile of the sunspot groups, the calculated lifetime is usually longer than the observed one, which might be burdened by the uncertainty of the non-observed evolution of the groups on the far side of the Sun. Therefore, the mean values (LTavg) of the lifetime data of these two groups have also been determined (see Table 3).

Table 3.
Calculated and observed lifetimes of sunspot groups. The columns contain the NOAA number of the sunspot group (AR1), calculated first time (t1c), calculated last time (t2c), calculated lifetime (LTcalc), emergence location (lE), disappearance location (lD), first observation time (t1o), last observation time (t2o), observed lifetime (LTobs), mean lifetime (LTavg), and standard deviation of the mean lifetime (STD.LT). The letter d means disc, while the letter f means in the columns lE and lD the far side of the Sun.
For NOAA AR 12537, the calculated observed lifetimes and their mean are 116.84, 109, and 112.92 days, respectively, while for NOAA AR 9855 they are 104.00, 94, and 99 days, respectively (Figure 2). The calculated (Tcalc) and observed (Tobs) lifetimes of each sunspot group along with their first (t1o) and last (t2o) observation times in days and the locations of their emergence (lE) and disappearance (lD) are listed in Table 3.
Figure 3 shows the lifetime–area relationships of sunspot groups, with each point representing a specific sunspot group. A linear relation may not be immediately obvious; however, as a first attempt, the linear fit may be informative. It is reasonable to assume that a sunspot group with zero area would have zero lifetime. Therefore, a linear regression originating from zero should be used. This is plotted with continuous lines in each panel along with their equations in the bottom right corner. It is conspicuous in each panel that the points can be divided into two groups. Below the peak area of around 190 MSH, the bulk of the data points are above the fitted linear regression line, while those of the larger sunspot groups are below it regarding the observed lifetime (topmost panel of Figure 3). The case is the same for the calculated and averaged lifetimes. Two linear relationships can be plotted by considering these two groups of data separately, in both cases with the origin at zero.
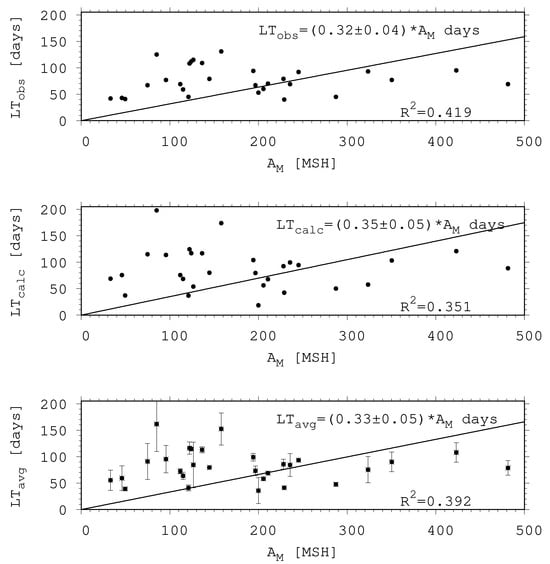
Figure 3.
Lifetime of sunspot groups as a function of peak area. The three panels show the observed and calculated lifetimes and their means. The equations of the fitted linear functions are written in the top right corners of the figures, while R squared can be found in the bottom right corners.
Two linear regression lines can be plotted for these two groups separated by the 190 MSH maximum size, both with the origin at zero. They are depicted in the panels of Figure 4 for the observed, calculated, and averaged lifetimes. The empty circles and dashed lines show the smaller groups, while the black dots and continuous lines mark the larger groups. The coefficients of equations for the smaller groups (≈0.80 day MSH−1) are about three times higher than those for the larger groups (≈0.30 day MSH−1). These coefficients are higher than the coefficient of the Gnevyshev–Waldmeier rule (≈0.1 day MSH−1), which means that the studied sunspot groups live longer than suggested by the Gnevyshev–Waldmeier rule. This difference may be due to longer lifetimes being reduced based on umbral data (Muraközy [18]). According to the diagrams, the relationship between maximum area and lifetime is not as simple as implied by the Gnevyshev–Waldmeier rule mentioned in the introduction. This and later similar results were based on short lifetimes entirely observable on the solar disc; furthermore, the considered area may have been the total umbra+penumbra area (this is not always specified). However, by extending the domains of the lifetime and maximum area and by focusing on the umbral areas, a more complex relationship can be obtained.
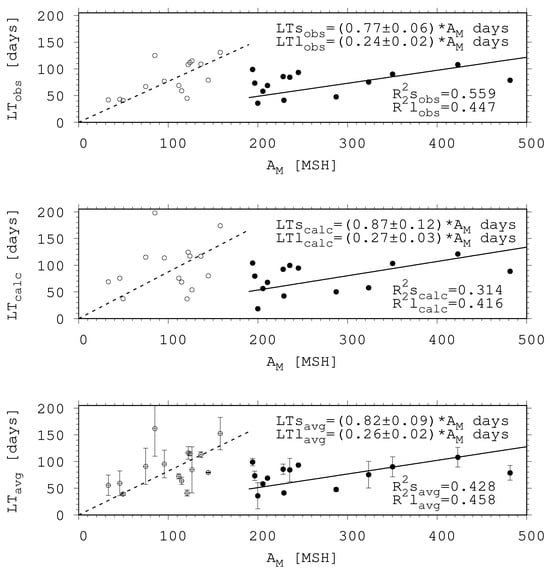
Figure 4.
Linear regression lines on the data of sunspot group lifetimes calculated with three methods (observed: top panel; calculated: middle panel; mean: bottom panel) vs. peak area below AM = 190 MSH (with empty circles and dashed lines) and above AM = 190 MSH (with black dots and solid lines). The equations of the fitted linear functions can be found in the top right corners, while the R2 values are in the bottom right corners.
This size distinction shows the advantage of choosing the linear regression line instead of some kind of nonlinear saturation growth curve. With the applied technique, two domains of different sizes can be distinguished, which may raise an unexpected conjecture, namely, possible depth dependence of the lifetimes. If the larger sunspot groups are supposed to be rooted more deeply, then they may be exposed to a more efficient disintegrating impact of the surrounding turbulent velocity field. It should be admitted that at the present state of study this is just a preliminary (though reasonable) conjecture.
3.1.2. Cycle Phase Dependence
Because several solar phenomena show cycle phase dependence, the possible dependence of the lifetimes of sunspot groups is examined as well.
Figure 5 shows the observed lifetimes of sunspot groups as a function of the absolute value of the heliographic latitude. Although the scatter is relatively large, a slight inverse relationship is plotted out. Lower the latitudes are associated with longer the lifetimes; indirectly, this figure also represents the connection between the lifetime and maximum area of the groups, i.e., the larger the active region, the longer its lifetime. This kind of relationship hints at the possible cycle phase dependence of sunspot group lifetimes. The longer timescale of the data allows us to study how the lifetime varies during the solar cycles.
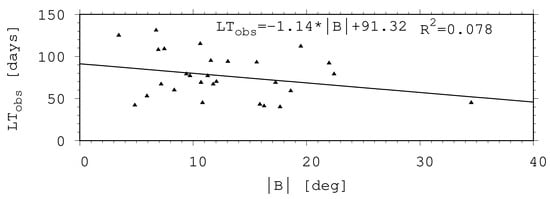
Figure 5.
Relationship between absolute values of mean heliographic latitudes of long-lived recurrent sunspot groups and their observed lifetimes. The latitude means the average latitude of those sunspot groups identified as recurrent. The equation of the fitted linear function is written at the top of the figure.
Figure 6 shows the mean latitudes (B) of the studied recurrent groups listed in Table 1, with black circles in the time–latitude diagram of SCs 21–24. The thick vertical black lines mark the minima of SCs, while the thin lines represent the times of the SCs’ maxima. Their data are taken from the table of Solar Cycles Min/Max of the Solar Influences Data Analysis Center of the Royal Observatory of Belgium. The circles’ areas are proportional to the observed lifetimes. Although several relatively short-lived ARs are observed at low latitudes, the majority of the longest living groups can be found near the solar equator in the descending phases of SCs. This figure also shows that higher mean heliographic latitude is associated with shorter lifetimes of the groups.
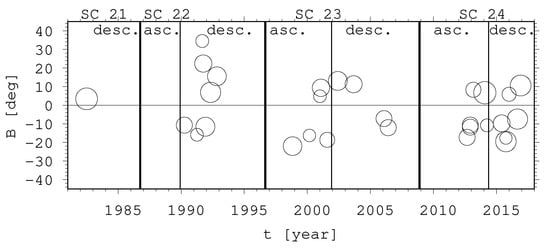
Figure 6.
Butterfly diagram of the studied sunspot groups for Solar Cycles (SC) 21–24. The black circles mark the sunspot groups, while their areas show their observed lifetimes. The SCs’ minima are depicted by thick black vertical lines, while their maxima are marked by thin vertical lines. Their data can befound at https://www.sidc.be/SILSO/cyclesminmax (accessed on 4 July 2024).
3.2. Active Nests
The longest lifetime in Figure 3 and Figure 4 is about 140 days, corresponding to about five solar rotations. This can be considered to be the maximum lifetime of a specific emerged magnetic flux rope observed as an active region. The identification of recurrent sunspot groups is difficult, as it is necessary to decide whether the AR turned in at the examined position belongs to the same magnetic flux rope ensemble turned out two weeks earlier or whether a new flux rope has emerged in the same position. If the latter is the case, then an active nest is located at the given position. The distinction between recurrent ARs and new ARs in an active nest is facilitated by the fitted asymmetric curve, as the data of the new regions typically do not match the curve in the way illustrated in Figure 2.
Figure 7 depicts this kind of active nest. The NOAA identified its first active region with NOAA 6327, which emerged on 16 October 1990. This active nest lasted for six rotations; during the last two rotations, it split into two groups. The NOAA numbers of the subsequent reappearances are (6368, 6412, 6444, 6484) and (6487, 6532, 6536), respectively. Another interesting active nest is plotted in Figure 8. This started with NOAA AR 12109, first observed on 2 July 2014; it eventually returned eleven times. The NOAA numbers of the observed groups at this position are (12130, 12153, 12172, 12173), (12192, 12209, 12235, 12259, 12262m), and (12296, 12314m, 12334, 12355). Near the peak area of the sunspot group, the fourth largest group in the DPD (NOAA AR 12192, with a peak umbral area of 556 MSH) produced by this active nest was extremely complex. It was unreasonable to fit the asymmetric Gaussian, as the multiple emergence was obvious.
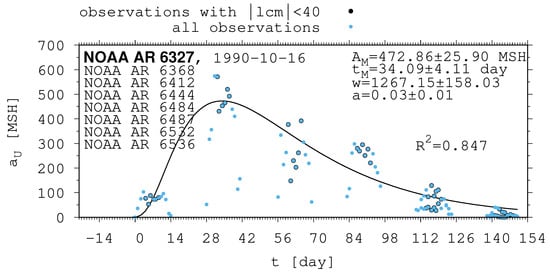
Figure 7.
An active nest (starting with NOAA AR 6327 on 16 October 1990) identified using the HTML presentation of the DPD. Blue dots depict all observations, while black circles filled by blue color indicate the time when the groups were within ±40 degrees of the central meridian. The parameters of the fitted Gaussian (Equation (1)) are listed in top right corner, with the coefficient of determination shown below. The NOAA numbers of groups belonging to the nest can be found in the top left corner.
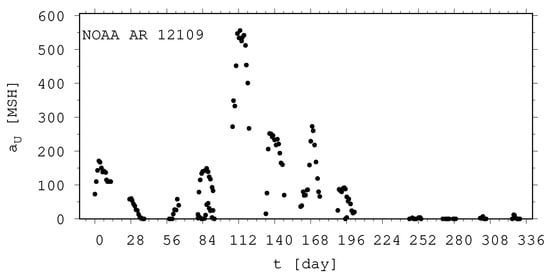
Figure 8.
Evolution of the active nest initiated by NOAA AR 12109. Its first observation date was 2 July 2014; the NOAA numbers of the consecutive ARs are (12130, 12153, 12172, 12173), (12192, 12209, 12235, 12259 and 12262m), and (12296, 12314m, 12334, 12355). This nest was also identified using the HTML presentation of the DPD.
This nest became active on the far side, and during the last few rotations it produced only small groups; however, the magnetic fields can be tracked clearly on the magnetograms.
4. Conclusions
The results of this paper are summarized as follows:
- The shape of the evolution of a long-lived recurrent sunspot group can be described by the same asymmetric Gaussian function that is suitable for the cases of short-lived active regions whose entire lifetimes are observed on the visible disc (Muraközy et al. [16], Muraközy [17]). If the returning active region is identical with that observed in the previous rotation. then its data have a surprisingly good fit to this curve (Figure 2).
- The lifetimes of sunspot groups depend on their peak area; the larger the sunspot group, the longer its lifetime. Two groups of active region sizes can be distinguished, separated by size (AM ≈ 190 MSH) (Figure 4).
- While recurrent sunspot groups live for about 4–5 solar rotations, active nests can be tracked for a longer time, even through 12–13 rotations. They can be distinguished from a single recurrent sunspot group by the asymmetric Gaussian, as the data of the active domain in consecutive rotations do not have a good fit to the curve.
As mentioned in the introduction, the relationship between the peak area and lifetime is described by the Gnevyshev–Waldmeier rule: Amax ≈ W· LT, where W is 10 MSH/day. This result, cited and corroborated by Petrovay and van Driel-Gesztelyi [3], refers to short-lived sunspot groups whose entire lifetime is observed on the visible solar disc. Nagovitsyn et al. [9] studied recurrent sunspot groups and reaffirmed the Gnevyshev–Waldmeier rule; however, it should be mentioned that their sample was gathered using a computer program without visual checking. The present results show that the validity of the Gnevyshev–Waldmeier rule cannot be simply extended to recurrent active regions, as the relationship is more complex in domains with very long lifetimes and very large areas. This is illustrated by Figure 4. Two populations of sunspot groups were found by Nagovitsyn and Pevtsov [11], who distinguished two clear peaks in the distribution of sunspot groups sizes. The peak of the largest group is around 200 MSH. In addition, they found that the lifetimes of smaller groups are shorter than those of larger groups, contrasting with the results of the present study. Forgács-Dajka et al. [10] found a cubic root proportionality between the peak areas and lifetimes. This function is also steeper in the region of smaller groups, similar to our results; however, the approach in this paper enables between two ranges of sunspot group sizes to be distinguished, allowing for the suggestion of a possible depth dependence. Iglesias et al. [19] followed a recurrent sunspot group detected in 1990. The maximum umbral area of this group in the present data was 78, making it a relatively small group. They reported that 162 solar flares were associated with this AR during its five rotations. This is an interesting example for demonstrating the statement that the Gnevyshev–Waldmeier rule is not applicable on longer time scales. Javaraiah [5]’s finding about the exponential relationship between peak area and lifetime of short-lived sunspot groups has not been corroborated on larger time intervals. However, Javaraiah [5]’s conjecture about deep-rooted active nests seems to be reasonable, and is similar to the suggestion made here. He raised the idea that larger groups might be generated near the bottom of the convection zone before fragmenting or branching into smaller groups while rising toward the surface. This phenomenon can be observed in the recent study of Wan et al. [20], who found that sunspot groups of different sizes rotate with different speeds. The latitudinal drift velocities of groups of different sizes were different as well.
To formulate the novelty of the presented procedure with respect to earlier papers, the linear approach of Gnevyshev and Waldmeier is not rejected in the range of long lifetimes; instead of a nonlinear description, a linear regression over two populations of different sizes is applied. As mentioned above, a similar distinction has already emerged in the literature. In the present case, leads to the suggestion of a depth dependence of the group lifetimes.
Because sunspot group lifetime and peak area are not strongly correlated, the investigation of a possible relationship between lifetime and magnetic flux using a larger sample size will be the subject of a future paper. A further intriguing feature for an upcoming study is the pertinent flux rope observable for a long time but with zero sunspot area (e.g., Figure A24 and Figure A27).
Funding
This research was funded by National Research, Development, and Innovation Office—NKFIH, 141895.
Institutional Review Board Statement
Not applicable.
Informed Consent Statement
Not applicable.
Data Availability Statement
The used sunspot data are available at http://fenyi.solarobs.epss.hun-ren.hu/en/databases/DPD/ (accessed on 4 July 2024).
Acknowledgments
The author thanks the three unknown reviewers for their valuable comments. The solar cycle minimum–maximum data source is WDC-SILSO, Royal Observatory of Belgium, Brussels (https://www.sidc.be/SILSO/cyclesminmax (accessed on 4 July 2024)). The author is indebted to the National Research, Development, and Innovation Office—NKFIH, 141895 for the funding of this research.
Conflicts of Interest
The author declares no conflicts of interest. The funders had no role in the design of the study, in the collection, analysis, or interpretation of data, in the writing of the manuscript, or in the decision to publish the results.
Abbreviations
The following abbreviations are used in this manuscript:
| DPD | Debrecen Photoheliographic Data |
| SC | Solar Cycle |
| AR | Active Region |
| lcm | Longitudinal distance from the Sun’s central meridian |
| MSH | Millionths of Solar Hemisphere |
Appendix A
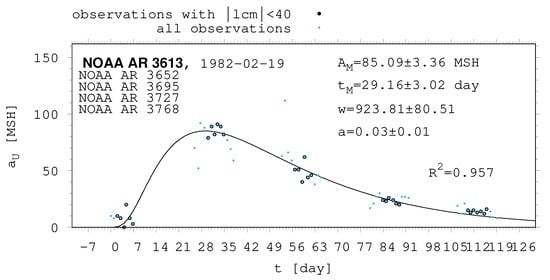
Figure A1.
Time profile of AR 3613 evolution and its fitted asymmetric Gaussian (detailed in the text).
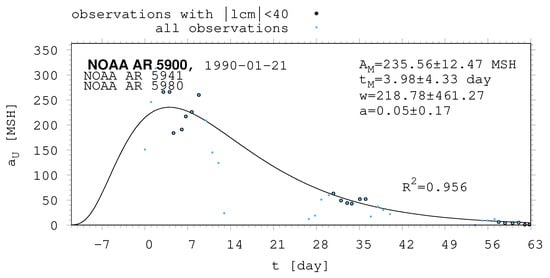
Figure A2.
Time profile of AR 5900 evolution and its fitted asymmetric Gaussian (detailed in the text).
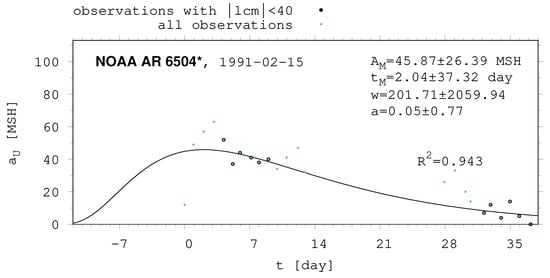
Figure A3.
Time profile of AR 6504 evolution and its fitted asymmetric Gaussian (detailed in the text).
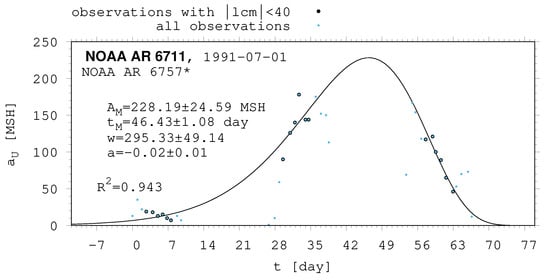
Figure A4.
Time profile of AR 6711 evolution and its fitted asymmetric Gaussian (detailed in the text).
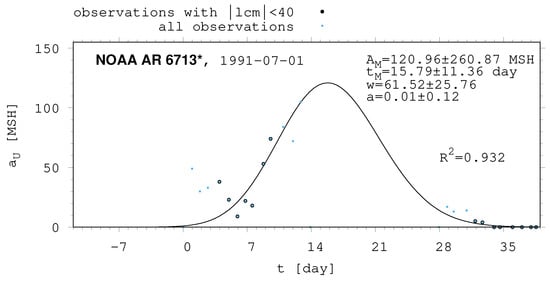
Figure A5.
Time profile of AR 5713 evolution and its fitted asymmetric Gaussian (detailed in the text).
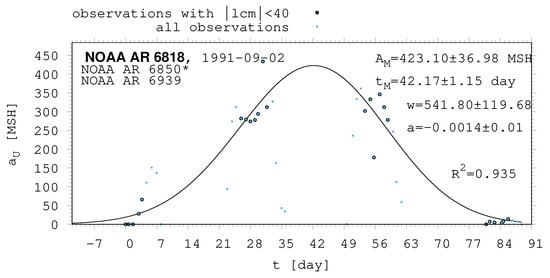
Figure A6.
Time profile of AR 6818 evolution and its fitted asymmetric Gaussian (detailed in the text).
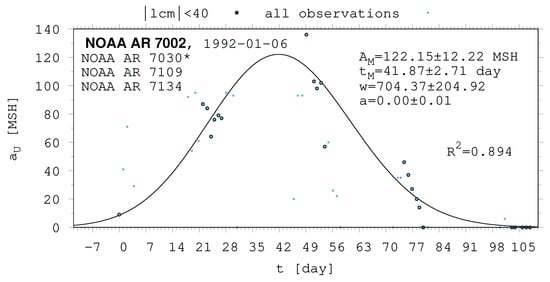
Figure A7.
Time profile of AR 7002 evolution and its fitted asymmetric Gaussian (detailed in the text).
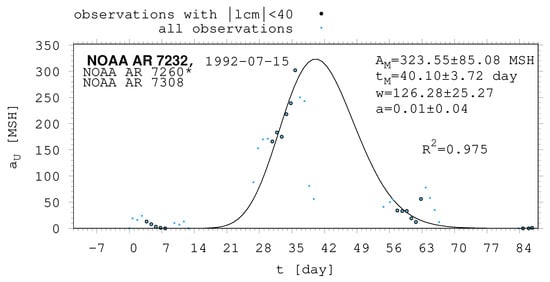
Figure A8.
Time profile of AR 7232 evolution and its fitted asymmetric Gaussian (detailed in the text).
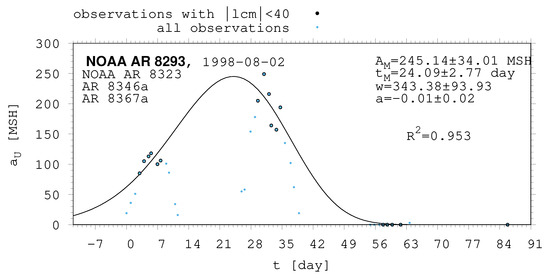
Figure A9.
Time profile of AR 8293 evolution and its fitted asymmetric Gaussian (detailed in the text).
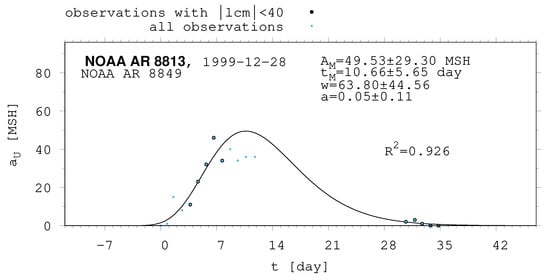
Figure A10.
Time profile of AR 8813 evolution and its fitted asymmetric Gaussian (detailed in the text).
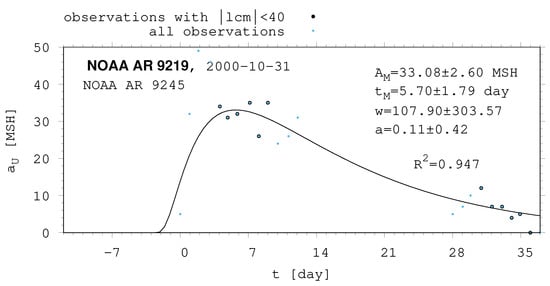
Figure A11.
Time profile of AR 9219 evolution and its fitted asymmetric Gaussian (detailed in the text).
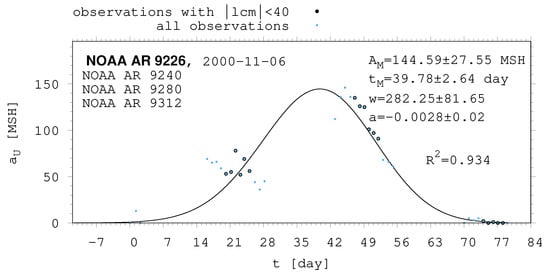
Figure A12.
Time profile of AR 9226 evolution and its fitted asymmetric Gaussian (detailed in the text).
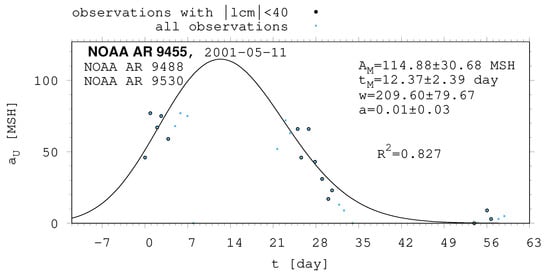
Figure A13.
Time profile of AR 9455 evolution and its fitted asymmetric Gaussian (detailed in the text).
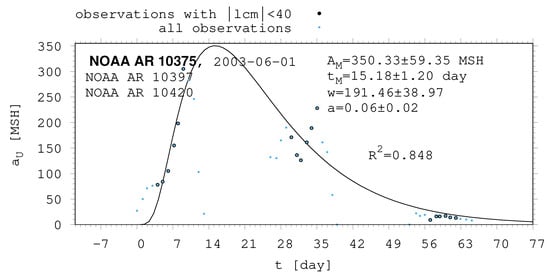
Figure A14.
Time profile of AR 10375 evolution and its fitted asymmetric Gaussian (detailed in the text).
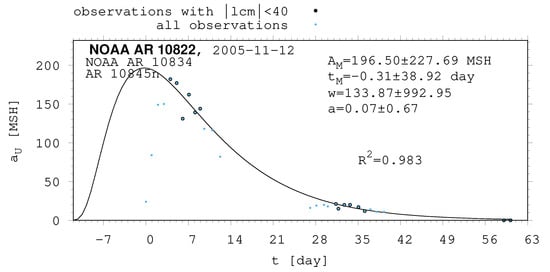
Figure A15.
Time profile of AR 10822 evolution and its fitted asymmetric Gaussian (detailed in the text).
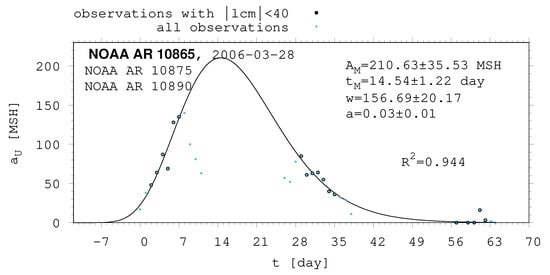
Figure A16.
Time profile of AR 10865 evolution and its fitted asymmetric Gaussian (detailed in the text).
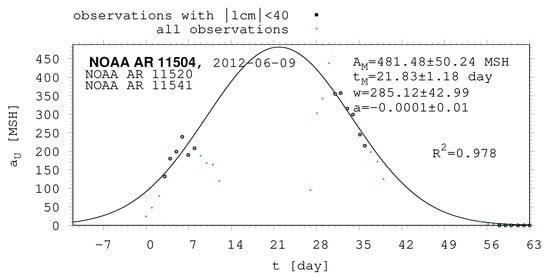
Figure A17.
Time profile of AR 11504 evolution and its fitted asymmetric Gaussian (detailed in the text).
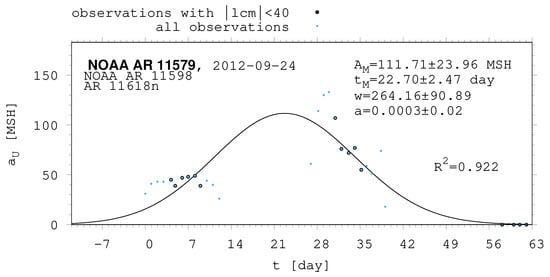
Figure A18.
Time profile of AR 11579 evolution and its fitted asymmetric Gaussian (detailed in the text).
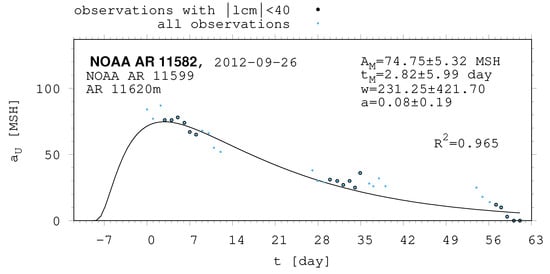
Figure A19.
Time profile of AR 11582 evolution and its fitted asymmetric Gaussian (detailed in the text).
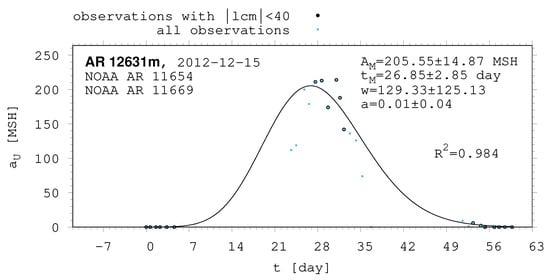
Figure A20.
Time profile of AR 11631m evolution and its fitted asymmetric Gaussian (detailed in the text).
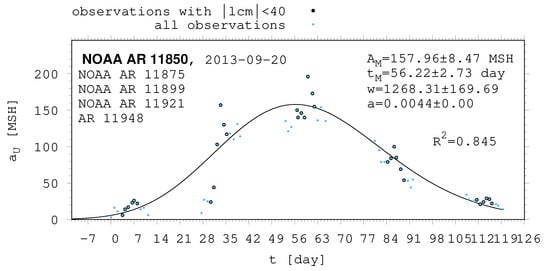
Figure A21.
Time profile of AR 11850 evolution and its fitted asymmetric Gaussian (detailed in the text).
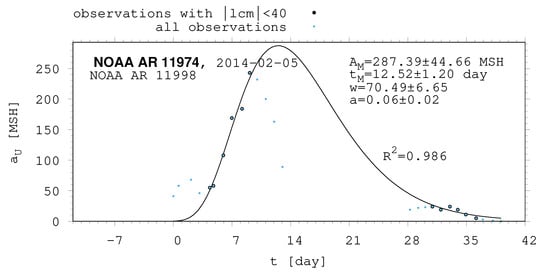
Figure A22.
Time profile of AR 11974 evolution and its fitted asymmetric Gaussian (detailed in the text).
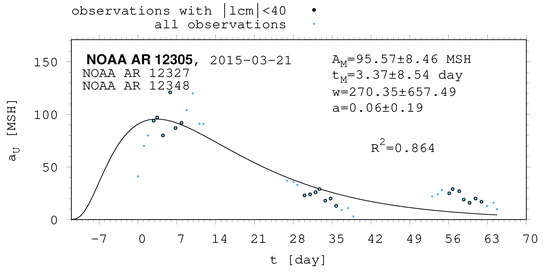
Figure A23.
Time profile of AR 12305 evolution and its fitted asymmetric Gaussian (detailed in the text).
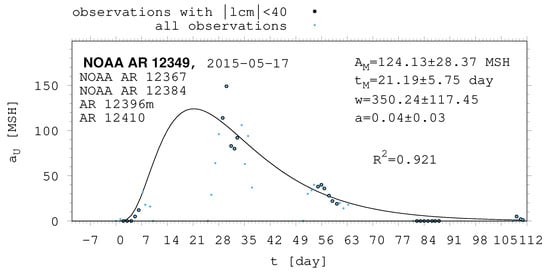
Figure A24.
Time profile of AR 12349 evolution and its fitted asymmetric Gaussian (detailed in the text).
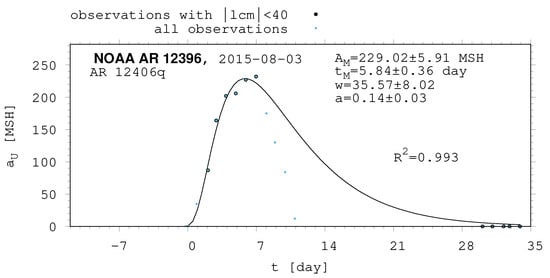
Figure A25.
Time profile of AR 12396 evolution and its fitted asymmetric Gaussian (detailed in the text).
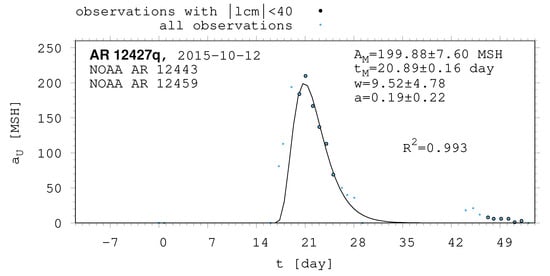
Figure A26.
Time profile of AR 12427q evolution and its fitted asymmetric Gaussian (detailed in the text).
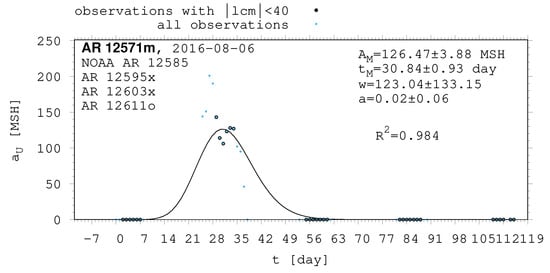
Figure A27.
Time profile of AR 12571m evolution and its fitted asymmetric Gaussian (detailed in the text).
References
- Gnevyshev, M.N. On the nature of solar activity. Izv. Gl. Astron. Obs. Pulkove 1938, 16, 36–45. [Google Scholar]
- Waldmeier, M. Ergebnisse und Probleme der Sonnenforschung. 1955. Available online: https://ui.adsabs.harvard.edu/abs/1955epds.book.....W/abstract (accessed on 4 July 2024).
- Petrovay, K.; van Driel-Gesztelyi, L. Making Sense of Sunspot Decay. I. Parabolic Decay Law and Gnevyshev-Waldmeier Relation. Sol. Phys. 1997, 176, 249–266. [Google Scholar] [CrossRef]
- Henwood, R.; Chapman, S.C.; Willis, D.M. Increasing Lifetime of Recurrent Sunspot Groups within the Greenwich Photoheliographic Results. Sol. Phys. 2010, 262, 299–313. [Google Scholar] [CrossRef]
- Javaraiah, J. Relationship between Magnetic Structures of Small and Large Sunspot Groups. In Proceedings of the Current Theoretical Models and Future High Resolution Solar Observations: Preparing for ATST; Pevtsov, A.A., Uitenbroek, H., Eds.; Astronomical Society of the Pacific Conference Series; 2003; Volume 286, p. 325. Available online: http://prints.iiap.res.in/handle/2248/4603 (accessed on 4 July 2024).
- Namekata, K.; Maehara, H.; Notsu, Y.; Toriumi, S.; Hayakawa, H.; Ikuta, K.; Notsu, S.; Honda, S.; Nogami, D.; Shibata, K. Lifetimes and Emergence/Decay Rates of Star Spots on Solar-type Stars Estimated by Kepler Data in Comparison with Those of Sunspots. Astrophys. J. 2019, 871, 187. [Google Scholar] [CrossRef]
- Yazev, S.A.; Isaeva, E.S.; Ishmukhametova, Y.V. Active Regions on the Sun with Increased Flare Activity in Cycle 24. Astron. Rep. 2021, 65, 507–517. [Google Scholar] [CrossRef]
- Pojoga, S.; Cudnik, B. The Clustering Properties of Active Regions during the First Part of Solar Cycle 23. Sol. Phys. 2002, 208, 17–32. [Google Scholar] [CrossRef]
- Nagovitsyn, Y.A.; Ivanov, V.G.; Skorbezh, N.N. Refinement of the Gnevyshev-Waldmeier Rule Based on a 140-Year Series of Observations. Astron. Lett. 2019, 45, 396–401. [Google Scholar] [CrossRef]
- Forgács-Dajka, E.; Dobos, L.; Ballai, I. Time-dependent properties of sunspot groups. I. Lifetime and asymmetric evolution. Astron. Astrophys. 2021, 653, A50. [Google Scholar] [CrossRef]
- Nagovitsyn, Y.A.; Pevtsov, A.A. On the Presence of Two Populations of Sunspots. Astrophys. J. 2016, 833, 94. [Google Scholar] [CrossRef]
- Baranyi, T.; Gyori, L.; Ludmány, A. On-line Tools for Solar Data Compiled at the Debrecen Observatory and Their Extensions with the Greenwich Sunspot Data. Sol. Phys. 2016, 291, 3081–3102. [Google Scholar] [CrossRef]
- Tlatov, A.G. Lifetime of Sunspots and Pores. Sol. Phys. 2023, 298, 93. [Google Scholar] [CrossRef]
- Tlatov, A.G. The Lifetime of Sunspot. Geomagn. Aeron. 2024, 63, 1116–1119. [Google Scholar] [CrossRef]
- Du, Z. The Shape of Solar Cycle Described by a Modified Gaussian Function. Sol. Phys. 2011, 273, 231–253. [Google Scholar] [CrossRef]
- Muraközy, J.; Baranyi, T.; Ludmány, A. Sunspot Group Development in High Temporal Resolution. Sol. Phys. 2014, 289, 563–577. [Google Scholar] [CrossRef][Green Version]
- Muraközy, J. Study of the Decay Rates of the Umbral Area of Sunspot Groups Using a High-resolution Database. Astrophys. J. 2020, 892, 107. [Google Scholar] [CrossRef]
- Muraközy, J. On the Decay of Sunspot Groups and Their Internal Parts in Detail. Astrophys. J. 2021, 908, 133. [Google Scholar] [CrossRef]
- Iglesias, F.A.; Cremades, H.; Merenda, L.A.; Mandrini, C.H.; López, F.M.; López Fuentes, M.C.; Ugarte-Urra, I. Analysis of a long-duration AR throughout five solar rotations: Magnetic properties and ejective events. Adv. Space Res. 2020, 65, 1641–1653. [Google Scholar] [CrossRef]
- Wan, M.; Gao, P.X.; Zeng, S.G.; Deng, L.H. Differential Rotation for Different-sized Sunspot Groups Early Observed by the OGAUC. Astrophys. J. 2023, 956, 53. [Google Scholar] [CrossRef]
Disclaimer/Publisher’s Note: The statements, opinions and data contained in all publications are solely those of the individual author(s) and contributor(s) and not of MDPI and/or the editor(s). MDPI and/or the editor(s) disclaim responsibility for any injury to people or property resulting from any ideas, methods, instructions or products referred to in the content. |
© 2024 by the author. Licensee MDPI, Basel, Switzerland. This article is an open access article distributed under the terms and conditions of the Creative Commons Attribution (CC BY) license (https://creativecommons.org/licenses/by/4.0/).