Abstract
Cumulants up to the sixth-order of the net-particle multiplicity distributions were measured at RHIC for the Beam Energy Scan and fixed-target program, from which we obtained some interesting hints on the phase structure of the QCD matter. In this article, we present recent experimental results on (net-)proton cumulants and discuss current interpretations on the QCD critical point and the nature of the phase transition. We will also report recent results for measurements of the bayron-strangeness correlations, which were measured with the newly developed analysis technique to remove the effect from the combinatorial backgrounds for hyperon reconstruction.
1. Introduction
One of the ultimate goals in heavy-ion collision experiments is to understand the phase structure of the matter described by Quantum ChromoDynamics (QCD) and the nature of the phase transition. Figure 1 depicts a conjectured phase diagram for the QCD matter [1] with respect to temperature T (MeV) and baryon chemical potential (MeV). In the QCD phase diagram, there are two phases of the hadronic gas and quark–gluon plasma (QGP), which are the confined and deconfined states of quarks and gluons, respectively. According to lattice QCD calculations, the phase transition between QGP and the hadronic gas is a smooth crossover [2] at vanishing baryon chemical potential, , while model calculations predict first-order phase transition at large region [3]. If the first-order phase transition exists, the connecting point to the crossover may also exist, which is a QCD-critical point.
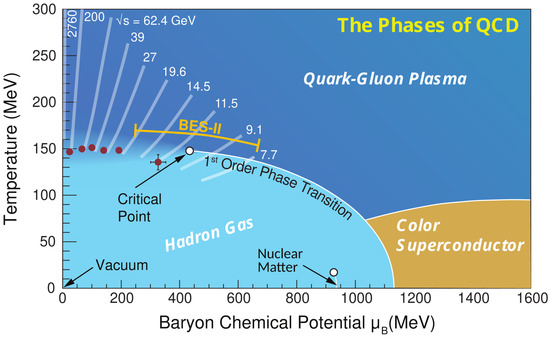
Figure 1.
The conjectured QCD phase diagram with respect to the baryon chemical potential and temperature [1]. The energies and ranges represent collision energies from the experimental programs at RHIC and LHC.
To explore the QCD phase diagram and elucidate the nature of the phase transition, the Beam Energy Scan (BES-I) program [4] was carried out at Relativistic Heavy Ion Collider (RHIC) from 2010 to 2017 for Au+Au collisions at , 11.5, 14.5, 19.6, 27, 39, 54.4, 62.4, and 200 GeV. The corresponding baryon chemical potential is around MeV, covering a wide region in the QCD phase diagram. The fixed-target (FXT) experiment was also performed for GeV Au+Au collisions with the STAR detector in 2018, where the baryon chemical potential has been extended up to 720 MeV.
Various observables were measured in BES-I, e.g., conserved charge fluctuations [5,6,7,8] to search for the QCD critical point, directed flow [9] and average transverse mass [10] to search for the first-order phase transition, elliptic flow [11,12], the nuclear modification factor [13], dynamical charge correlations [14,15], and dileptons [16] to search for the possible boundary of QGP formation. Many of these measurements exhibit interesting trend as a function of the collision energy, but their interpretations have been limited by large uncertainties at low collision energies.
In order to improve those results, the phase II of the BES program (BES-II) was performed in 2019–2021 at 7.7, 9.2, 11.5, 13.7, 14.5, 17.3, and 19.6 GeV. The FXT experiments were also carried out at 3.2, 3.5, 3.8, 3.9, 4.5, 5.2, 6.2, and 7.7 GeV to fill the gap between BES energies and 3 GeV from FXT. In the following sections, we will present the measurements of conserved charge fluctuations from BES-I and FXT 3 GeV data at RHIC.
2. Conserved Charge Fluctuations
2.1. Cumulants
Fluctuations of conserved charges are measured in terms of cumulants, or moments, of a probability distribution. The rth-order cumulant, , is defined by rth-derivatives of cumulant generating function [17], which is expressed by moments as: , , , , , , where N is the number of net-particles of a conserved charge measured within the experimental acceptance and the bracket represents the event average. Another notation, , will also be used in following sections, where the subscript represents the cumulant. Similarly, the 2nd-order mix-cumulant between two conserved quantities can be expressed as: , where X and Y represent net-particle multiplicities of two different conserved quantities or particle species. The cumulants have a volume dependence by definition. To cancel this trivial effect, we take the ratio between different orders of cumulants, e.g., and . These ratios can be directly compared with the corresponding susceptibility ratios from theoretical calculations.
2.2. Analysis Techniques
The event-by-event net-proton multiplicity distributions are shown in Figure 2 from BES-I [5]. We study the precise structures at the tail of the distributions through the measurements of various orders of cumulants. One should keep in mind that these are raw distributions which are not corrected for detector efficiency [18,19], initial volume fluctuations [20,21,22], pileup events [23,24], and other experimental artifacts.
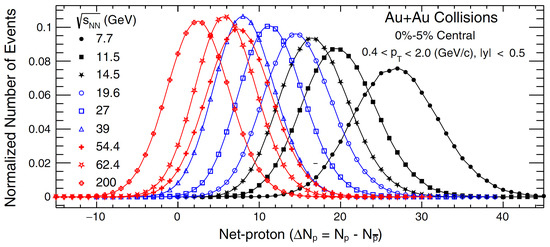
Figure 2.
Event−by−event raw net-proton multiplicity distributions for Au+Au collisions at BES-I energies [5].
The effect of the detector efficiencies were corrected by using the correction formulas, which is derived based on the assumption that detector efficiency follows the binomial distribution [19,25,26]. The possible deviation from the binomial distribution was studied in embedding simulations at Au+Au 200 GeV most central collisions, where we found that the efficiencies of the STAR detector can be well describe by the beta-binomial distribution [6]. The net-proton values corrected for the beta-binomial distribution [27] were found to be consistent with those from the binomial efficiency correction within statistical uncertainties, and therefore it was concluded that the efficiency distribution of the STAR detector was close enough to the binomial distribution within the current statistical precision.
In heavy-ion collisions, the number of participant nucleons and particle multiplicity are not one-to-one corresponding, which distorts the cumulants of net-particle distributions. This effect is referred to as initial volume fluctuations. The effect was suppressed by applying the data-driven approach of the Centrality Bin Width Correction (CBWC) [28,29], where the cumulants were calculated at each reference multiplicity bin and averaged at each centrality class. It was also confirmed that the CBWC gives consistent results with another approach to correct for initial volume fluctuation in an analytical way [30] for the BES-I data sets [6]. It should be noted that the neutrons cannot be measured by the STAR detector. Thus, we measured net-proton distributions as a proxy of net-baryon distributions.
The fraction of pileup events were much higher for 3.0 GeV data from FXT compared to the collider energies from BES-I. We first determined the pileup fraction and the reference multiplicity distributions of the single-collision events by using the unfolding approach [31]. This allowed us to determine the response matrices between single-collision multiplicity and that for the pileup events, which was used for the pileup correction of cumulants [24,32,33].
2.3. Baselines
Experimentally measured cumulant ratios of net-proton distributions are compared with the baselines. The simplest case is that the protons and antiprotons follow independent Poisson distributions, respectively. Then the resulting net-proton distribution follows the Skellam distribution, whose odd-order cumulants are while even-order cumulants are , where and denote the mean value of protons and antiprotons, respectively. As a result, the value for the Skellam distribution becomes unity for all collision energies and centralities, and therefore the deviation of the experimental results with respect to unity indicate the effects of non-statistical fluctuations. It is also important to incorporate the background effects that cannot be avoided in experiments, such as initial volume fluctuations and baryon number conservation [34]. These effects are generally simulated in the hadronic transport model, which is employed as a more realistic baseline than the Skellam baseline.
3. Net-Proton Fluctuations
3.1. for the Critical Point Search
Figure 3 shows the collision energy dependence of net-proton in Au+Au most central collisions from BES-I [5,6] and the FXT program at GeV [32,33]. The value is consistent with the Poisson baseline at GeV while it decreases with decreasing collision energy, reaching a minimal value at 19.6 GeV. The ratio seems to increase above the Poisson baseline at lower collision energies down to 7.7 GeV. The collision energy dependence was found to have nonmonotonicity of 3.1 . The observed nonmonotonic collision energy dependence is qualitatively consistent with the model calculation incorporating the QCD critical point [35], and therefore the BES-I results could indicate the existence of the critical point at GeV. The proton values from the HADES experiment at 2.4 GeV [22] and STAR-FXT at 3.0 GeV are also plotted in Figure 3. All experimental measurements are consistent within uncertainties. The STAR-FXT result can be reproduced by the UrQMD calculations [36], which indicates that the hadronic interactions are dominant at 3 GeV collisions and the QCD critical point may only exist at GeV. Further conclusions could potentially be made after the completion of the ongoing analysis for the phase II of the BES program (BES-II) and FXT at GeV [4].
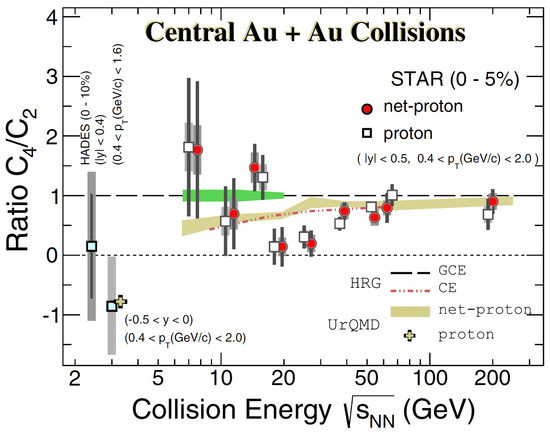
Figure 3.
Collision energy dependence of (net−)proton for Au+Au most central collisions from the BES-I and FXT [32]. The golden band and cross represent the UrQMD calculations. The green band shows the projection of statistical uncertainties for BES-II energies in the collider mode.
3.2. for the Crossover Search
The STAR experiment also measured further higher-order cumulants up to the sixth order. Theoretically, the net-baryon is expected to be more sensitive to the QCD phase structure than , as its sign changes near the phase transition temperature [37]. The left panel of Figure 4 shows the centrality dependence of net-proton in Au+Au collisions at , 54.4, and 200 GeV [38]. The values from 27 and 54.4 GeV are consistent with zero within large uncertainties, while those from 200 GeV are progressively negative systematically from peripheral to central collisions. These negative signs are qualitatively consistent with lattice QCD calculations [39]. Thus, the results from 200 GeV could indicate the experimental signature of the smooth crossover at RHIC top energy. The collision energy dependence of (net-)proton is shown in the right panel in Figure 4 for Au+Au 0–40% and 50–60% collisions. The value from 0–40% centrality decreases with decreasing collision energy down to 7.7 GeV, while it is consistent with UrQMD calculations at 3 GeV. The decreasing trend down to 7.7 GeV is qualitatively consistent with the FRG model down to 7.7 GeV [40] and lattice QCD calculations down to 39 GeV [39], where both calculations predict a smooth crossover transition.
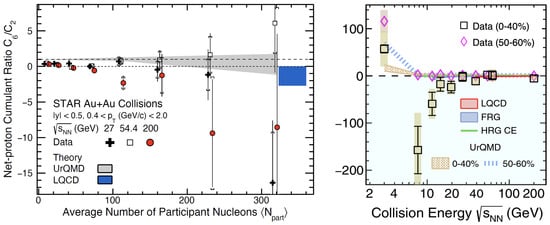
Figure 4.
(Left) Centrality dependence of net-proton at 27, 54.4, and 200 GeV Au+Au collisions [38]. The lattice QCD calculations are from Ref. [39]. (Right) Collision energy dependence of (net-)proton for Au+Au collisions at 0–40% and 50–60% centralities [41]. The values for lattice QCD and FRG calculations are from Refs. [39,40].
4. Challenge for Baryon–Strangeness Correlations
4.1. Previous Measurement
Correlations between two conserved charges are expected to carry important information on the magnetic field formed in non-central heavy-ion collisions [42] as well as the temperature of the system [43]. Observables suggested by theories consist of the second-order mix-cumulant between net-baryon and net-strangeness, which we call baryon–strangeness correlation in the rest of this article. The importance of the baryon–strangeness correlations was first proposed in Ref. [44] in terms of the correlator
where denotes the baryon–strangeness correlation and is the second-order net-strangeness cumulant. The value is expected to be unity for the ideal QGP while it strongly depends on the baryon-chemical potential for the hadronic gas. However, the values extracted from previous STAR measurements [45] are between −0.12 and 0.043 for GeV, which is much smaller than the expectations. According to the model calculations [46], the signal of the baryon–strangeness correlations vanish once the strange baryons (hyperons) are excluded from the measurements. The values were thus very small as only (anti)protons and charged kaons were taken into account as proxies of net-baryon and net-strangeness, respectively, in previous STAR measurements.
To include hyperons in the measurement of event-by-event fluctuations, one has to address the issue of the combinatorial backgrounds. As hyperons decay into daughter particles before hitting the detector, and therefore the invariant mass technique is usually employed to reconstruct hyperons [47]. One can see the signal peak of the hyperons of interest and determine the shape of the combinatorial backgrounds by optimizing the cut conditions for topological parameters for hyperon reconstructions. Then one can subtract the background from the measurement to extract the signal yield and its event average. However, it is impossible to identify signal and background particles on a candidate-by-candidate basis. Hence, the event-by-event fluctuation measurement of hyperons has proved challenging.
4.2. New Method: Purity Correction
Figure 5 shows a sketch of the invariant mass distribution for [48]. The shape of the combinatorial backgrounds is assumed to be flat for simplicity. What we can measure in the experiment is always the sum of signal and background particles, , where is the number of signal candidates, is the number of signal particles, and is the number of background particles. However, it is impossible to identify and on an event-by-event basis. The second-order cumulant of signal candidates is expressed as:
thus,
where the last two terms on the right-hand side in Equation (3) cannot be measured experimentally.
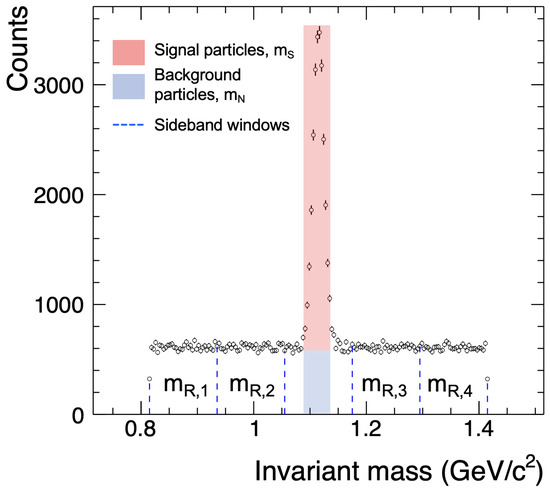
Figure 5.
Example of the invariant mass distribution for [48]. The red shaded area corresponds to the signal particles, and the blue one corresponds to the background particles. The dotted blue lines are the boundaries for the sideband windows.
Let us consider utilizing the sideband particles around the signal peak as a proxy for the number of background particles. Sideband particles, , are counted at the ith sideband windows indicated by dotted lines in Figure 5. Supposing that the probability distribution of sideband particles is consistent with that for the background particles, the following relations hold:
Next, we consider the second-order mix-cumulant between signal candidates and sideband particles:
thus,
From Equation (8) to Equation (9) we used Equation (6). By substituting Equation (10) to Equation (7), we obtain the correction formula for the second-order cumulant [48] as
Similarly, the correction formula for the second-order mix-cumulant can be derived as
where n is supposed to be the other conserved charge or particle species than m, and we utilized the following relations:
It should be noted that the sideband windows need to be determined carefully. Because of the trivial volume dependence, the values of , , and other (mix-)cumulants that include sideband particles can easily change depending on the width of the sideband windows. The purpose of utilizing the sideband windows is to use them as the proxies of the background particles under the signal peak, and therefore the width of the sideband windows have to be precisely determined so that their yields are consistent with the background particles that we want to subtract. This leads to the iterative steps as follows. First, we determine the background yields utilizing data-driven approach like rotation or event-mixing methods. Second, we divide the sideband according to the background yields. Finally, we calculate the correction parameters for each window of the sideband.
It is further suggested to check if those correction parameters including sideband particles are flat enough as a function of the invariant mass. Otherwise, one should revisit the definition of the sideband windows to check if the sideband is equally divided. The residual dependence of correction parameters on the invariant mass should be taken into account as a part of the systematic uncertainties. One can also take the average over as many sideband windows as possible to determine the correction parameters more precisely.
4.3. Measurement of and Hyperons
The and hyperons were reconstructed by using the invariant mass technique based on the following decay channels: and . The topological parameters such as the distance of the closest approach (DCA) of daughter particles, DCA between daughter particles, DCA and the decay length of hyperons, were optimized so that the signal peak becomes visible. Figure 6 shows the invariant mass () distributions for and , where the clear peaks from and are seen around GeV/c and 1.32 GeV/c, respectively. Another peak around 1.28 GeV/c in invariant mass distribution is the fake signal which appears if the bachelor are daughters from . To avoid the effect from the fake signal, sideband particles at GeV/c were not used in the purity correction for . The background shape was determined by using the rotation method, which is shown by cyan solid lines in Figure 6. The yield of the background particles were then estimated from the rotational backgrounds, where the sidebands are equally divided (sideband windows), as shown by the magenta dotted lines.
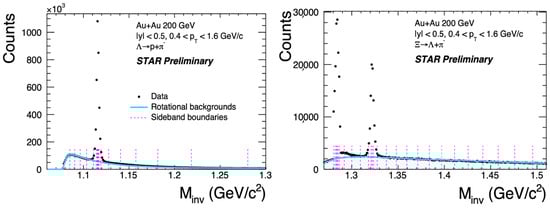
Figure 6.
Invariant mass distribution of (left) and (right) hyperons. The cyan solid lines represent the rotation backgrounds, and the magenta dotted lines are the sideband boundaries for the purity corrections.
The signal candidates for and were counted at GeV/c and GeV/c, respectively, on an event-by-event basis. Sideband particles were counted at each sideband window in Figure 6. Figure 7 shows the first- and second-order cumulants of sideband particles, and the second-order mix-cumulant between signal candidates and sideband particles, as a function of invariant mass. The first-order cumulant is flat by definition, as the sideband was equally divided based on the background yields. It is found that the second-order cumulants and mix-cumulants are flat as well, which indicates that the parameters for the purity correction do not depend on the invariant mass, and furthermore, that sideband particles can be used as proxies of the background particles under the signal peak.
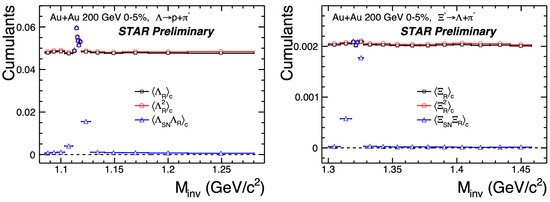
Figure 7.
The 1st- and 2nd-order cumulants of sideband particles, and (the subscript R represents the rotational backgrounds), and the 2nd-order mix-cumulants between signal candidates and sideband particles, , for (left) and (right).
The analysis of the was performed for two cases: (1) Measure and on top of p, , and ; (2) Add and on top of (1). The baryon–strangeness correlation and the second-order strangeness cumulant are given by
for case (1), and
for case (2), where represents the difference between the number of particles and antiparticles of a particle species X. The coefficients in front of -related terms come from the fact that hyperons carry two strange quarks. To obtain and , all the second-order cumulants and mix-cumulants in Equations (16)–(19) were measured with efficiency corrections. Hyperons-related terms were corrected for their purities as well.
4.4. Results
The validity of the purity correction was checked in a data-driven way by analyzing the various topological cut sets for reconstructions. Each cut set has different purity 1 and significance 2 of . The efficiency and purity corrected value of the fluctuations should be consistent among different cut sets if the purity correction works well. Figure 8 shows the 2nd-order cumulant from Au+Au most central collisions at GeV as a function of purity, where purity-uncorrected results are shown by black squares and purity-corrected results are shown by red circles. The purity-uncorrected results increase with decreasing purity because the background contribution becomes large. In this case, the result having the highest purity around 96% can only be taken as a final result which still suffers from 4% background contributions. After applying purity corrections for each cut set, the results are flat with respect to the purity. This indicate that the purity correction works well in the STAR data. More importantly, one can take any of the red circles as a final result. We finally employed the result from the cut set which yields the best significance of , leading to the smallest statistical uncertainty of purity-corrected .
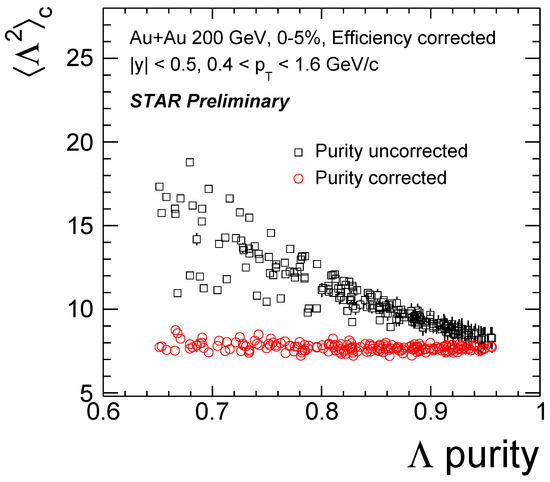
Figure 8.
The 2nd-order cumulant as a function of purity from Au+Au most central collisions at 200 GeV. Purity-uncorrected results are shown by black squares, and purity-corrected results are shown by red circles. All results are corrected for reconstruction efficiencies. The branching ratio is not taken into account.
Figure 9 shows the centrality dependence of from Au+Au 200 GeV collisions. The results are corrected for purity and reconstruction efficiency, while not being corrected for hyperons’ branching ratio. The values have been significantly enhanced compared to the previous measurement [45] by including and on top of p, , and , as shown by the blue squares. We have also tried including multi-strange baryons and as well, which is shown by the red stars. A slightly different centrality dependence is observed for both cases. The values are much closer to those from the lattice QCD calculations [49] shown by the purple band than previous measurements. The red and blue shaded bands represent the UrQMD calculations incorporating as well as the particle species in the experimental measurements. The decays into and and the daughter s are already included in our measurements. The UrQMD calculations significantly underestimate the experimental data and cannot describe the centrality dependence.
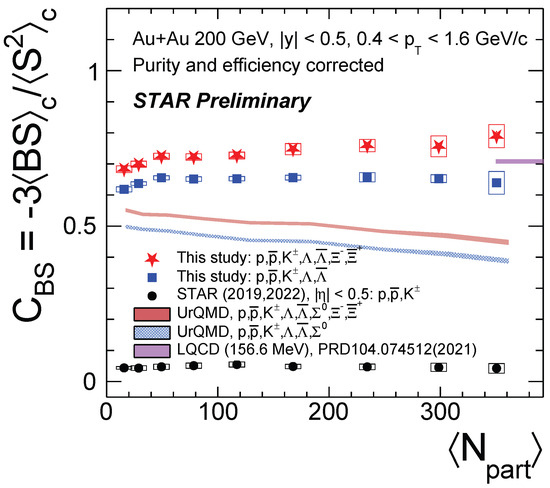
Figure 9.
Centrality dependence of from Au+Au 200 GeV collisions. The results are corrected for purity and reconstruction efficiencies for hyperons, while their branching ratios are not taken into account. The purple band represents the results from the lattice QCD calculations [49]. The UrQMD calculations are shown by red and blue shaded bands.
5. Summary
We discussed the recent results on conserved charge fluctuations from BES-I and GeV collisions from FXT program at RHIC. The nonmonotonic energy dependence of (net-)proton could hint on the existence of the QCD critical point around GeV. The negative signs observed in net-proton at 200 GeV could indicate the experimental signature of a smooth crossover at RHIC top energy. The collision energy dependence of (net-)proton could imply that the phase boundary can be probed over the wide range of the QCD phase diagram. These interpretations are currently limited due to large uncertainties, which will be significantly improved in the near future by the ongoing analysis on BES-II data having 10–20 times larger event statistics compared to BES-I. We also reported the recent attempt for measuring the baryon–strangeness correlations. The , , and their antiparticles were included in the measurement, on top of p, , and . The results were corrected for the combinatorial backgrounds by using the newly developed method for the purity correction. The validity of the correction was confirmed in a data-driven way. As a result, the values were significantly enhanced and the value is now much closer to the lattice QCD calculations.
Funding
This research was funded by JSPS KAKENHI grant number 23K13113 and 19H05598. The APC was funded by 23K13113.
Data Availability Statement
No new data were created or analyzed in this study. Data sharing is not applicable to this article.
Acknowledgments
T.N. thanks S. Esumi, H. Feng, X. Luo, and Y. Zhang for fruitful discussions.
Conflicts of Interest
The authors declare no conflicts of interest.
Notes
| 1 | The ratio of the signal to the background yields. |
| 2 | The ratio of the signal yield to the square-root of signal candidates, which is a proxy for the product of purity and reconstruction efficiency. |
References
- Bzdak, A.; Esumi, S.; Koch, V.; Liao, J.; Stephanov, M.; Xu, N. Mapping the Phases of Quantum Chromodynamics with Beam Energy Scan. Phys. Rept. 2020, 853, 1–87. [Google Scholar] [CrossRef]
- Aoki, Y.; Endrodi, G.; Fodor, Z.; Katz, S.D.; Szabo, K.K. The Order of the quantum chromodynamics transition predicted by the standard model of particle physics. Nature 2006, 443, 675–678. [Google Scholar] [CrossRef]
- Ejiri, S. Canonical partition function and finite density phase transition in lattice QCD. Phys. Rev. D 2008, 78, 074507. [Google Scholar] [CrossRef]
- Studying the Phase Diagram of QCD Matter at RHIC. Available online: https://drupal.star.bnl.gov/STAR/starnotes/public/sn0598 (accessed on 1 November 2023).
- Adam, J. et al. [STAR Collaboration] Nonmonotonic Energy Dependence of Net-Proton Number Fluctuations. Phys. Rev. Lett. 2021, 126, 092301. [Google Scholar] [CrossRef] [PubMed]
- Abdallah, M. et al. [STAR Collaboration] Cumulants and correlation functions of net-proton, proton, and antiproton multiplicity distributions in Au+Au collisions at energies available at the BNL Relativistic Heavy Ion Collider. Phys. Rev. C 2021, 104, 024902. [Google Scholar] [CrossRef]
- Adamczyk, L. et al. [STAR Collaboration] Beam energy dependence of moments of the net-charge multiplicity distributions in Au+Au collisions at RHIC. Phys. Rev. Lett. 2014, 113, 092301. [Google Scholar] [CrossRef]
- Adamczyk, L. et al. [STAR Collaboration] Collision Energy Dependence of Moments of Net-Kaon Multiplicity Distributions at RHIC. Phys. Lett. B 2018, 785, 551–560. [Google Scholar] [CrossRef]
- Adamczyk, L. et al. [STAR Collaboration] Beam-Energy Dependence of the Directed Flow of Protons, Antiprotons, and Pions in Au+Au Collisions. Phys. Rev. Lett. 2014, 112, 162301. [Google Scholar] [CrossRef]
- Adamczyk, L. et al. [STAR Collaboration] Bulk Properties of the Medium Produced in Relativistic Heavy-Ion Collisions from the Beam Energy Scan Program. Phys. Rev. C 2017, 96, 044904. [Google Scholar] [CrossRef]
- Adamczyk, L. et al. [STAR Collaboration] Observation of an Energy-Dependent Difference in Elliptic Flow between Particles and Antiparticles in Relativistic Heavy Ion Collisions. Phys. Rev. Lett. 2013, 110, 142301. [Google Scholar] [CrossRef]
- Adamczyk, L. et al. [STAR Collaboration] Elliptic flow of identified hadrons in Au+Au collisions at √sNN= 7.7-62.4 GeV. Phys. Rev. C 2013, 88, 014902. [Google Scholar] [CrossRef]
- Adamczyk, L. et al. [STAR Collaboration] Beam Energy Dependence of Jet-Quenching Effects in Au+Au Collisions at √sNN = 7.7, 11.5, 14.5, 19.6, 27, 39, and 62.4 GeV. Phys. Rev. Lett. 2018, 121, 032301. [Google Scholar] [CrossRef] [PubMed]
- Abelev, B.I. et al. [STAR Collaboration] Azimuthal Charged-Particle Correlations and Possible Local Strong Parity Violation. Phys. Rev. Lett. 2009, 103, 251601. [Google Scholar] [CrossRef] [PubMed]
- Abelev, B.I. et al. [STAR Collaboration] Observation of charge-dependent azimuthal correlations and possible local strong parity violation in heavy ion collisions. Phys. Rev. C 2010, 81, 054908. [Google Scholar] [CrossRef]
- Abdulhamid, M.I. et al. [STAR Collaboration] Measurements of dielectron production in Au+Au collisions at sNN=27, 39, and 62.4 GeV from the STAR experiment. Phys. Rev. C 2023, 107, L061901. [Google Scholar] [CrossRef]
- Asakawa, M.; Kitazawa, M. Fluctuations of conserved charges in relativistic heavy ion collisions: An introduction. Prog. Part. Nucl. Phys. 2016, 90, 299–342. [Google Scholar] [CrossRef]
- Nonaka, T.; Kitazawa, M.; Esumi, S. More efficient formulas for efficiency correction of cumulants and effect of using averaged efficiency. Phys. Rev. 2017, C95, 064912. [Google Scholar] [CrossRef]
- Luo, X.; Nonaka, T. Efficiency correction for cumulants of multiplicity distributions based on track-by-track efficiency. Phys. Rev. C 2019, 99, 044917. [Google Scholar] [CrossRef]
- Skokov, V.; Friman, B.; Redlich, K. Volume Fluctuations and Higher Order Cumulants of the Net Baryon Number. Phys. Rev. 2013, C88, 034911. [Google Scholar] [CrossRef]
- Sugiura, T.; Nonaka, T.; Esumi, S. Volume fluctuation and multiplicity correlation in higher-order cumulants. Phys. Rev. 2019, C100, 044904. [Google Scholar] [CrossRef]
- Adamczewski-Musch, J. et al. [HADES Collaboration] Proton-number fluctuations in √sNN =2.4 GeV Au + Au collisions studied with the High-Acceptance DiElectron Spectrometer (HADES). Phys. Rev. C 2020, 102, 024914. [Google Scholar] [CrossRef]
- Garg, P.; Mishra, D. Higher moments of net-proton multiplicity distributions in a heavy-ion event pile-up scenario. Phys. Rev. C 2017, 96, 044908. [Google Scholar] [CrossRef]
- Nonaka, T.; Kitazawa, M.; Esumi, S. Pileup corrections on higher-order cumulants. Nucl. Instrum. Meth. A 2020, 984, 164632. [Google Scholar] [CrossRef]
- Luo, X. Unified Description of Efficiency Correction and Error Estimation for Moments of Conserved Quantities in Heavy-Ion Collisions. Phys. Rev. 2015, C91, 034907. [Google Scholar] [CrossRef]
- Kitazawa, M.; Luo, X. Properties and uses of factorial cumulants in relativistic heavy-ion collisions. Phys. Rev. 2017, C96, 024910. [Google Scholar] [CrossRef]
- Esumi, S.; Nakagawa, K.; Nonaka, T. Reconstructing particle number distributions with convoluting volume fluctuations. Nucl. Instrum. Meth. A 2021, 987, 164802. [Google Scholar] [CrossRef]
- Luo, X.; Xu, J.; Mohanty, B.; Xu, N. Volume fluctuation and auto-correlation effects in the moment analysis of net-proton multiplicity distributions in heavy-ion collisions. J. Phys. 2013, G40, 105104. [Google Scholar] [CrossRef]
- Luo, X.; Xu, N. Search for the QCD Critical Point with Fluctuations of Conserved Quantities in Relativistic Heavy-Ion Collisions at RHIC: An Overview. Nucl. Sci. Tech. 2017, 28, 112. [Google Scholar] [CrossRef]
- Braun-Munzinger, P.; Rustamov, A.; Stachel, J. Bridging the gap between event-by-event fluctuation measurements and theory predictions in relativistic nuclear collisions. Nucl. Phys. 2017, A960, 114–130. [Google Scholar] [CrossRef]
- Zhang, Y.; Huang, Y.; Nonaka, T.; Luo, X. Pileup correction on higher-order cumulants with unfolding approach. Nucl. Instrum. Meth. A 2022, 1026, 166246. [Google Scholar] [CrossRef]
- Abdallah, M.S. et al. [STAR Collaboration] Measurements of Proton High Order Cumulants in √sNN = 3 GeV Au+Au Collisions and Implications for the QCD Critical Point. Phys. Rev. Lett. 2022, 128, 202303. [Google Scholar] [CrossRef] [PubMed]
- Abdallah, M. et al. [STAR Collaboration] Higher-order cumulants and correlation functions of proton multiplicity distributions in sNN=3 GeV Au+Au collisions at the RHIC STAR experiment. Phys. Rev. C 2023, 107, 024908. [Google Scholar] [CrossRef]
- Bzdak, A.; Koch, V.; Skokov, V. Baryon number conservation and the cumulants of the net proton distribution. Phys. Rev. C 2013, 87, 014901. [Google Scholar] [CrossRef]
- Stephanov, M.A.; Rajagopal, K.; Shuryak, E.V. Event-by-event fluctuations in heavy ion collisions and the QCD critical point. Phys. Rev. 1999, D60, 114028. [Google Scholar] [CrossRef]
- Bleicher, M.; Zabrodin, E.; Spieles, C.; Bass, S.A.; Ernst, C.; Soff, S.; Bravina, L.; Belkacem, M.; Weber, H.; Stocker, H.; et al. Relativistic hadron hadron collisions in the ultrarelativistic quantum molecular dynamics model. J. Phys. G 1999, 25, 1859–1896. [Google Scholar] [CrossRef]
- Friman, B.; Karsch, F.; Redlich, K.; Skokov, V. Fluctuations as probe of the QCD phase transition and freeze-out in heavy ion collisions at LHC and RHIC. Eur. Phys. J. 2011, C71, 1694. [Google Scholar] [CrossRef]
- Abdallah, M. et al. [STAR Collaboration] Measurement of the Sixth-Order Cumulant of Net-Proton Multiplicity Distributions in Au+Au Collisions at sNN= 27, 54.4, and 200 GeV at RHIC. Phys. Rev. Lett. 2021, 127, 262301. [Google Scholar] [CrossRef]
- Bazavov, A. et al. [HotQCD Collaboration] Skewness, kurtosis, and the fifth and sixth order cumulants of net baryon-number distributions from lattice QCD confront high-statistics STAR data. Phys. Rev. D 2020, 101, 074502. [Google Scholar] [CrossRef]
- Fu, W.j.; Luo, X.; Pawlowski, J.M.; Rennecke, F.; Wen, R.; Yin, S. Hyper-order baryon number fluctuations at finite temperature and density. Phys. Rev. D 2021, 104, 094047. [Google Scholar] [CrossRef]
- Aboona, B. et al. [STAR Collaboration] Beam Energy Dependence of Fifth and Sixth-Order Net-proton Number Fluctuations in Au+Au Collisions at RHIC. Phys. Rev. Lett. 2023, 130, 082301. [Google Scholar] [CrossRef]
- Ding, H.T.; Li, S.T.; Shi, Q.; Wang, X.D. Fluctuations and correlations of net baryon number, electric charge and strangeness in a background magnetic field. Eur. Phys. J. A 2021, 57, 202. [Google Scholar] [CrossRef]
- Bazavov, A.; Ding, H.-T.; Hegde, P.; Kaczmarek, O.; Karsch, F.; Laermann, E.; Maezawa, Y.; Mukherjee, S.; Ohno, H.; Petreczky, P.; et al. Strangeness at high temperatures: From hadrons to quarks. Phys. Rev. Lett. 2013, 111, 082301. [Google Scholar] [CrossRef] [PubMed]
- Koch, V.; Majumder, A.; Randrup, J. Baryon-strangeness correlations: A Diagnostic of strongly interacting matter. Phys. Rev. Lett. 2005, 95, 182301. [Google Scholar] [CrossRef] [PubMed]
- Adam, J. et al. [STAR Collaboration] Collision-energy dependence of second-order off-diagonal and diagonal cumulants of net-charge, net-proton, and net-kaon multiplicity distributions in Au + Au collisions. Phys. Rev. C 2019, 100, 014902, Erratum in Phys. Rev. C 2022, 105, 029901. [Google Scholar] [CrossRef]
- Yang, Z.; Luo, X.; Mohanty, B. Baryon-Strangeness Correlations in Au+Au Collisions at sNN=7.7-200 GeV from the UrQMD model. Phys. Rev. C 2017, 95, 014914. [Google Scholar] [CrossRef]
- Adam, J. et al. [STAR Collaboration] Strange hadron production in Au+Au collisions at sNN=7.7, 11.5, 19.6, 27, and 39 GeV. Phys. Rev. C 2020, 102, 034909. [Google Scholar] [CrossRef]
- Nonaka, T. Purity correction for cumulants of hyperon number distribution. Nucl. Instrum. Meth. A 2022, 1039, 167171. [Google Scholar] [CrossRef]
- Bollweg, D.; Goswami, J.; Kaczmarek, O.; Karsch, F.; Mukherjee, S.; Petreczky, P.; Schmidt, C.; Scior, P. Second order cumulants of conserved charge fluctuations revisited: Vanishing chemical potentials. Phys. Rev. D 2021, 104, 074512. [Google Scholar] [CrossRef]
Disclaimer/Publisher’s Note: The statements, opinions and data contained in all publications are solely those of the individual author(s) and contributor(s) and not of MDPI and/or the editor(s). MDPI and/or the editor(s) disclaim responsibility for any injury to people or property resulting from any ideas, methods, instructions or products referred to in the content. |
© 2024 by the author. Licensee MDPI, Basel, Switzerland. This article is an open access article distributed under the terms and conditions of the Creative Commons Attribution (CC BY) license (https://creativecommons.org/licenses/by/4.0/).