Article

Untargeted Metabolomics Toward Systematic Characterization of Antioxidant Compounds in Betulaceae Family Plant Extracts

1
Department of Bioscience and Biotechnology, Konkuk University, Seoul 05029, Korea
2
Department of Biological Resources Utilization, National Institute of Biological Resources, Environmental Research Complex, Incheon 22755, Korea
3
Research Institute for Bioactive-Metabolome Network, Konkuk University, Seoul 05029, Korea
*
Author to whom correspondence should be addressed.
These authors contributed equally to this work.
Metabolites 2019, 9(9), 186; https://doi.org/10.3390/metabo9090186
Submission received: 29 August 2019 / Revised: 10 September 2019 / Accepted: 15 September 2019 / Published: 16 September 2019
(This article belongs to the Special Issue Plant Metabolomics)

Abstract

:
Plant species have traditionally been revered for their unparalleled pharmacognostic applications. We outline a non-iterative multi-parallel metabolomic-cum-bioassay-guided methodology toward the functional characterization of ethanol extracts from the Betulaceae family plants (n = 10). We performed mass spectrometry (MS)-based multivariate analyses and bioassay-guided (ABTS antioxidant activity and cytoprotective effects against H2O2-induced cell damage) analyses of SPE fractions. A clearly distinct metabolomic pattern coupled with significantly higher bioactivities was observed for 40% methanol SPE eluate. Further, the 40% SPE eluate was subjected to preparative high-performance liquid chromatography (prep-HPLC) analysis, yielding 72 sub-fractions (1 min−1), with the highest antioxidant activities observed for the 15 min and 31 min sub-fractions. We simultaneously performed hyphenated-MS-based metabolite characterization of bioactive components for both the 40% methanol SPE fraction and its prep-HPLC sub-fraction (15 min and 31 min). Altogether, 19 candidate metabolites were mainly observed to contribute toward the observed bioactivities. In particular, ethyl gallate was mainly observed to affect the antioxidant activities of SPE and prep-HPLC fractions of Alnus firma extracts. We propose an integrated metabolomic-cum-bioassay-guided approach for the expeditious selection and characterization of discriminant metabolites with desired phenotypes or bioactivities.

1. Introduction

Plant-derived natural products, i.e., secondary metabolites, have naturally been a valuable source of various pharmacologically active compounds. The trivial functional annotations associated with plant extracts include antioxidant [1], anti-aging [2], anti-metastatic [3], anti-obesity [4], and antiparasitic [5] activities, finding applications in cosmetic and healthcare sectors. Notwithstanding the chemosystematics, the metabolomic state of a plant undergoes variations according to the transcriptome, proteome, and prevalent environmental conditions [6,7]. Additionally, plant chemodiversity is further enriched through the intricate biotransformation of metabolites into closely related derivatives, including methylated, acetylated, and/or glycosylated, generating a gamut of metabolic sub-classes [8]. Owing to the diverse metabolomes, the biochemical characterization of secondary metabolites in plants has been considered an arduous task. In the past, various extraction protocols, chromatographic systems, and spectrometric methods have provided an impetus to phytochemical studies [9,10].
Ushering in the metabolomics era, mass spectrometry (MS)-based metabolite characterization has evolved as an adept platform to discern chemotaxonomy [11], metabolic pathways [12], and phytochemical characterization [13], altogether complementing the -omics cascade of genomics and proteomics. Metabolomics enables an unbiased high-throughput screening and characterization of the overall gamut of metabolic entities through chromatographic separation, high-resolution MS, and enhanced detection sensitivity [14]. However, the subsequent functional annotation of the identified metabolites often seems difficult owing to the different titers of metabolic repertoire influencing the biological phenotypes [15]. Hence, the neoteric multi-parallel approaches need to be explored toward the expeditious screening and characterization of functional metabolites in diverse plant samples.
Historically, indigenous plants have been harnessed as food supplements, medicines, and cosmetics owing to their time-tested efficacies and traditional applications [16,17]. The family Betulaceae is a typical angiosperm distributed in the Northern hemisphere, with 6 genera and 170 species, mostly including trees or shrubs [18], and has customarily been used as plant ornaments, timbers, nut crops, and medicines [19]. Phytochemical analyses of Betulaceae plant extracts have revealed a rich composition of secondary metabolites, including terpenoids, phenolics, and flavonoids, rendering them functional properties, including anticancer [20], antioxidant [21], and antiviral [22]. Especially, the plants’ antioxidants, like vitamin C, flavonoids, and phenolic compounds, offer metabolic hotspots in ethnopharmacological studies.
Herein, we propose a metabolomic-cum-bioassay-guided approach aimed toward the systematic characterization of antioxidant metabolites from different biosystematic groups in the Betulaceae family. Further, the study aims to examine the effects of chemotaxonomic relatedness on the bioactivity phenotypes for the plant samples used in the study. We comprehensively employed MS-based metabolite profiling, solvent extraction, and preparatory-HPLC methods coupled with parallel bioassays to determine the specific metabolites conferring the desired antioxidant phenotypes.

2. Results

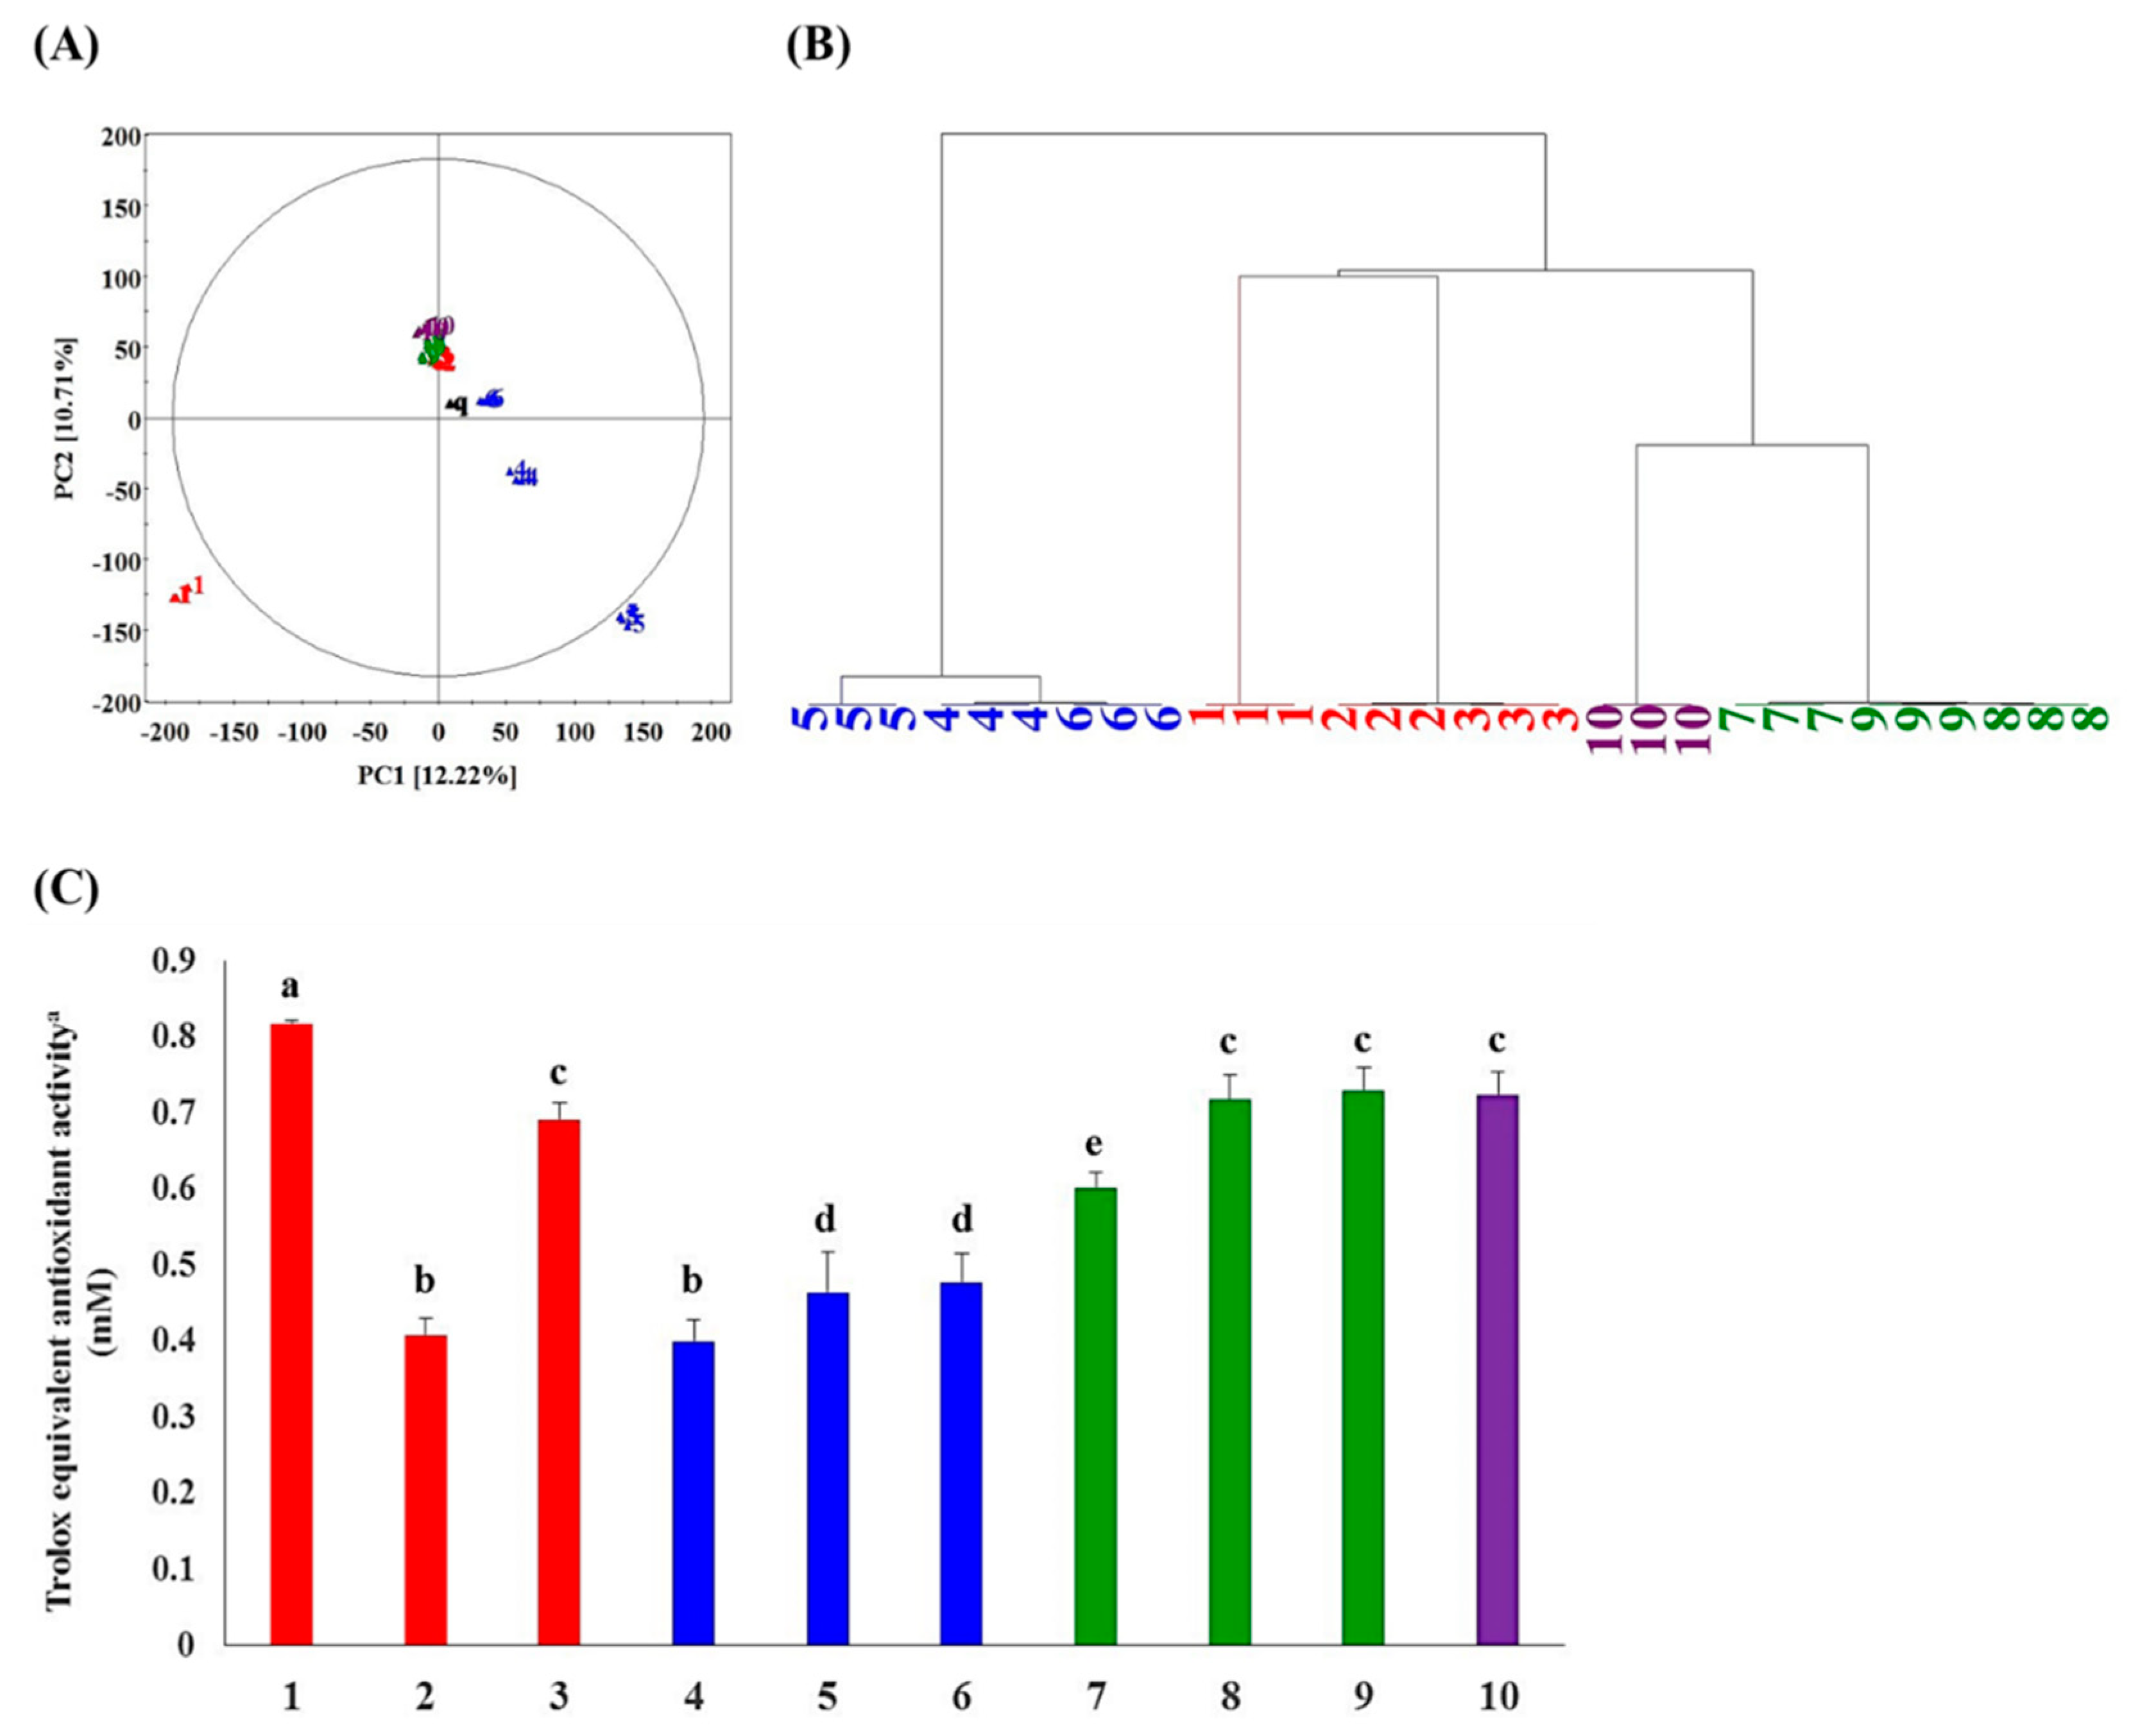
2.1. Metabolite Profiling and Antioxidant Activity Assay-Guided Screening of Plant Extracts

Metabolite profiling was performed to distinguish plants having antioxidant compounds among the 10 species of Betulaceae. Based on the principal component analysis (PCA) (Figure 1A) derived from the positive mode ultrahigh-performance liquid chromatography linear trap quadrupole-ion trap- mass spectrometry/mass spectrometry (UHPLC-LTQ-IT-MS/MS) datasets of 10 plant species, a clustered pattern depending on the plant genus was mostly observed, irrespective of their different times and areas of harvest. The analytical replicates of the spiked quality control (QC) samples were clustered at the center of the PCA score plot (Figure 1A), ensuring the normal performance of the instrument. We observed the clusters of metabolomic datasets for the genera Alnus (red color), Carpinus (green color), and Corylus (purple color) separated distinctly from the genus Betula (blue color). Notably, Alnus firma (A. firma) was separated from the cluster of the genus Alnus along PC1 (12.22%) and PC2 (10.71%). The hierarchical cluster analysis (HCA) dendrogram (Figure 1B) showed that the genus Betula and a group of other genera, Alnus, Corylus, and Carpinus, had two major branches. As the feature values used for the PCA score plot were based on the metabolomics data, the result indicated that phylogenetic factors influenced the chemical composition of samples rather than environmental factors.
The analyses of antioxidant activity (Figure 1C) for the Betulaceae family extracts show that five members, including Alnus firma (1), A. japonica (3), Carpinus turczaninwii (8), Carpinus laxiflora (9), and Corylus heterophylla (10), had significantly higher antioxidant activities compared to the rest of the members. Among them, A. firma (1) displayed the highest antioxidant activity. Considering the metabolite profiling data as well as the bioactivities, A. firma (1) extracts were screened for a further course of studies.

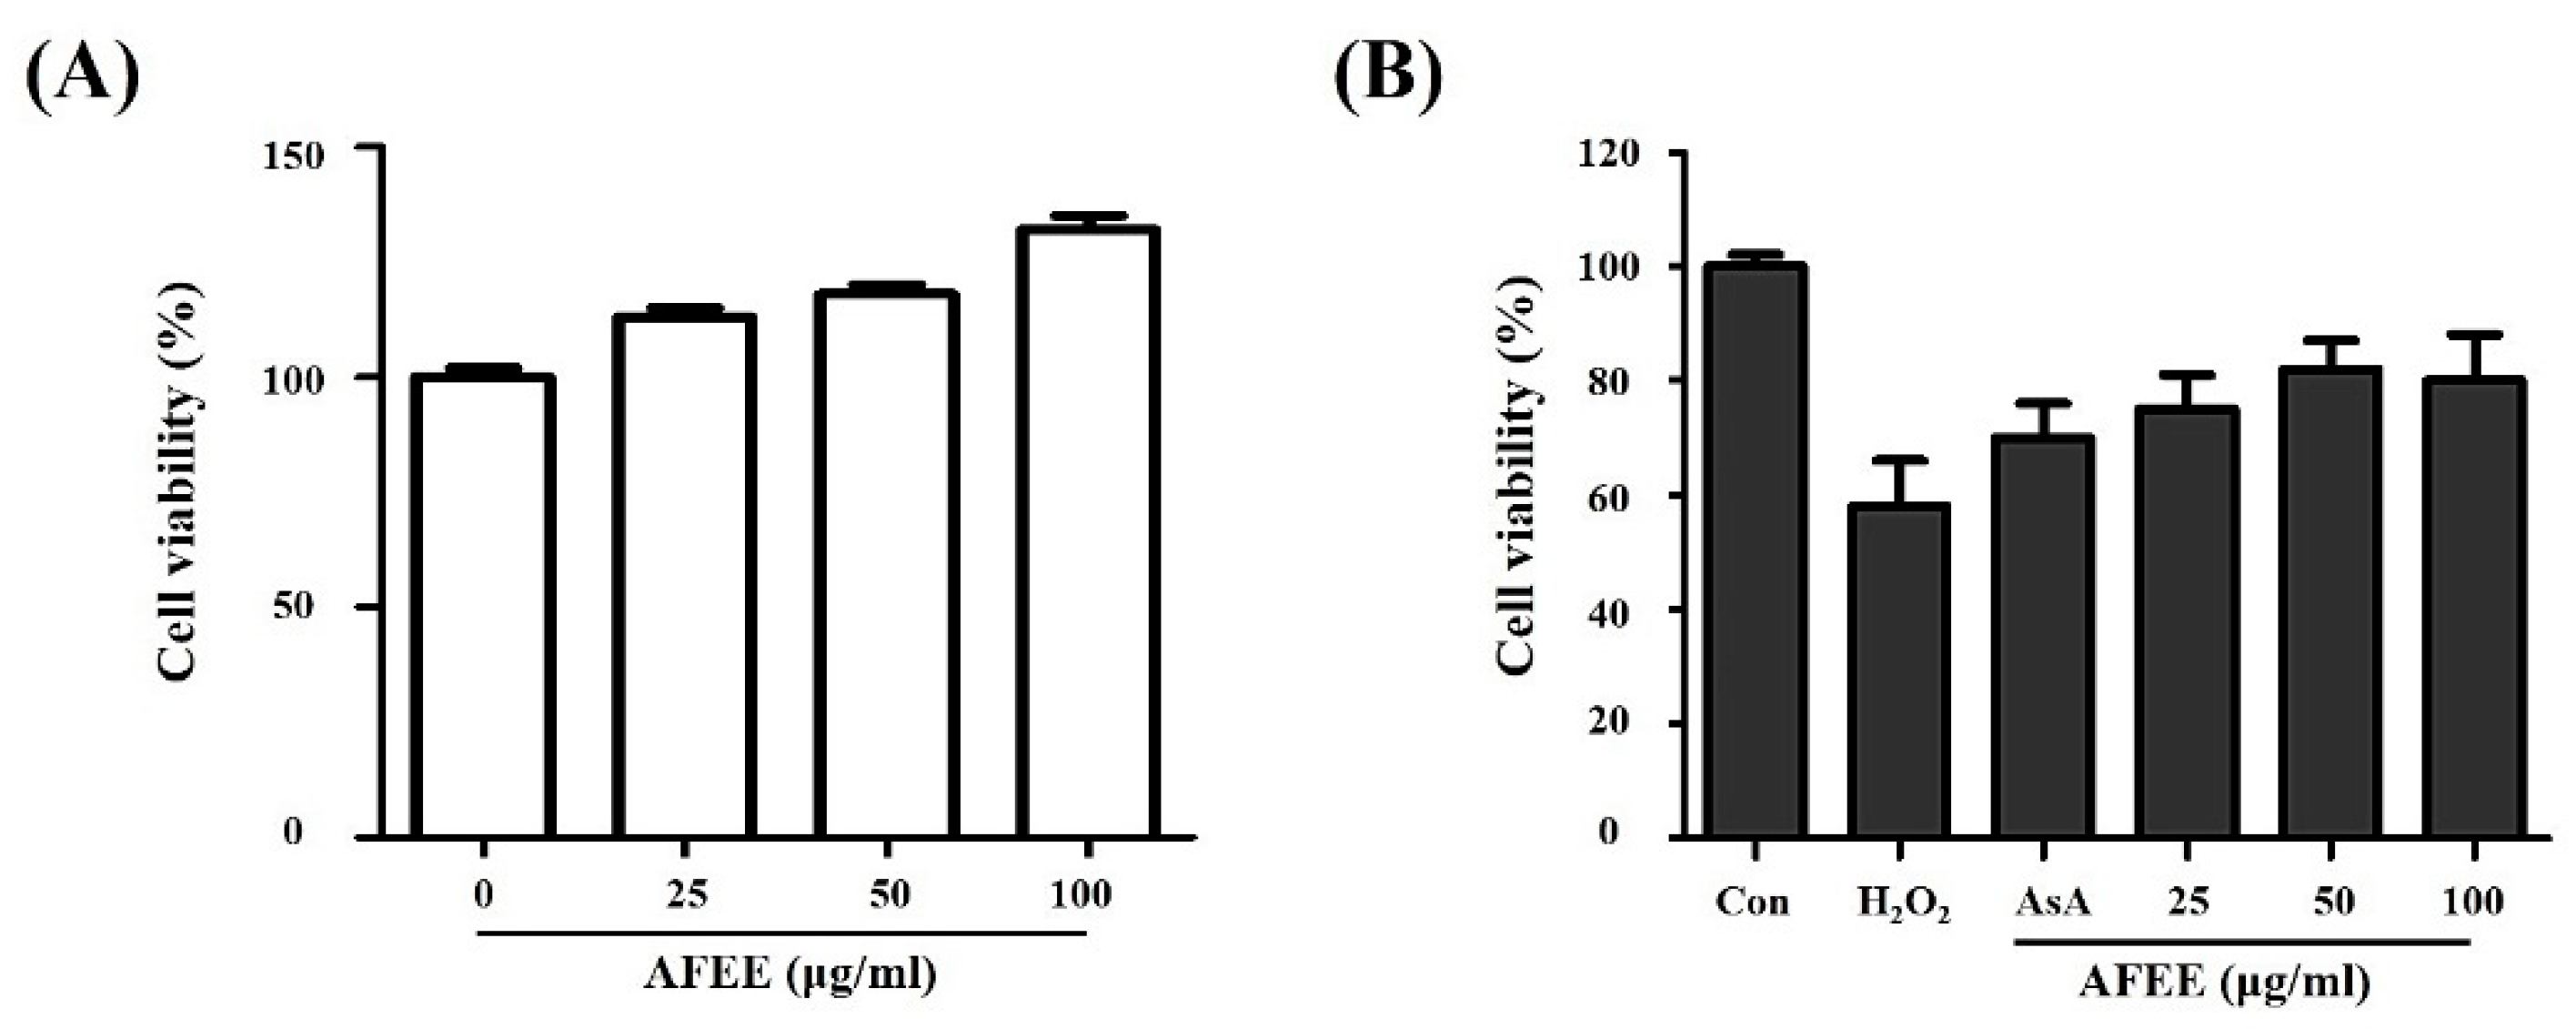
2.2. Effect of the Alnus firma Ethanol Extracts (AFEE) on H2O2-Induced HDF Cell Damage

Assessment of protective ability against H2O2-induced HDF cell damage is one of the effective methods for evaluating the in vitro antioxidant activity of plant extracts. We determined the maximum non-toxic concentration for A. firma ethanol extracts (AFEE) on HDF cells, i.e., 100 μg/mL (Figure 2A), and performed experiments using doses below this critical concentration. Treatment of 1 mM hydrogen peroxide decreased the viability of HDF cells by 60% compared to the viability in the control. Pre-treatment with 50 μM ascorbic acid, used as the positive control, restored the viability of HDF cells compared to the hydrogen peroxide group. Ascorbic acid prevents oxidative damages in HDF cells. In line with this, pretreatment with AFEE (25, 50, and 100 μg/mL) resulted in the prevention of cell death induced by hydrogen peroxide (Figure 2B).

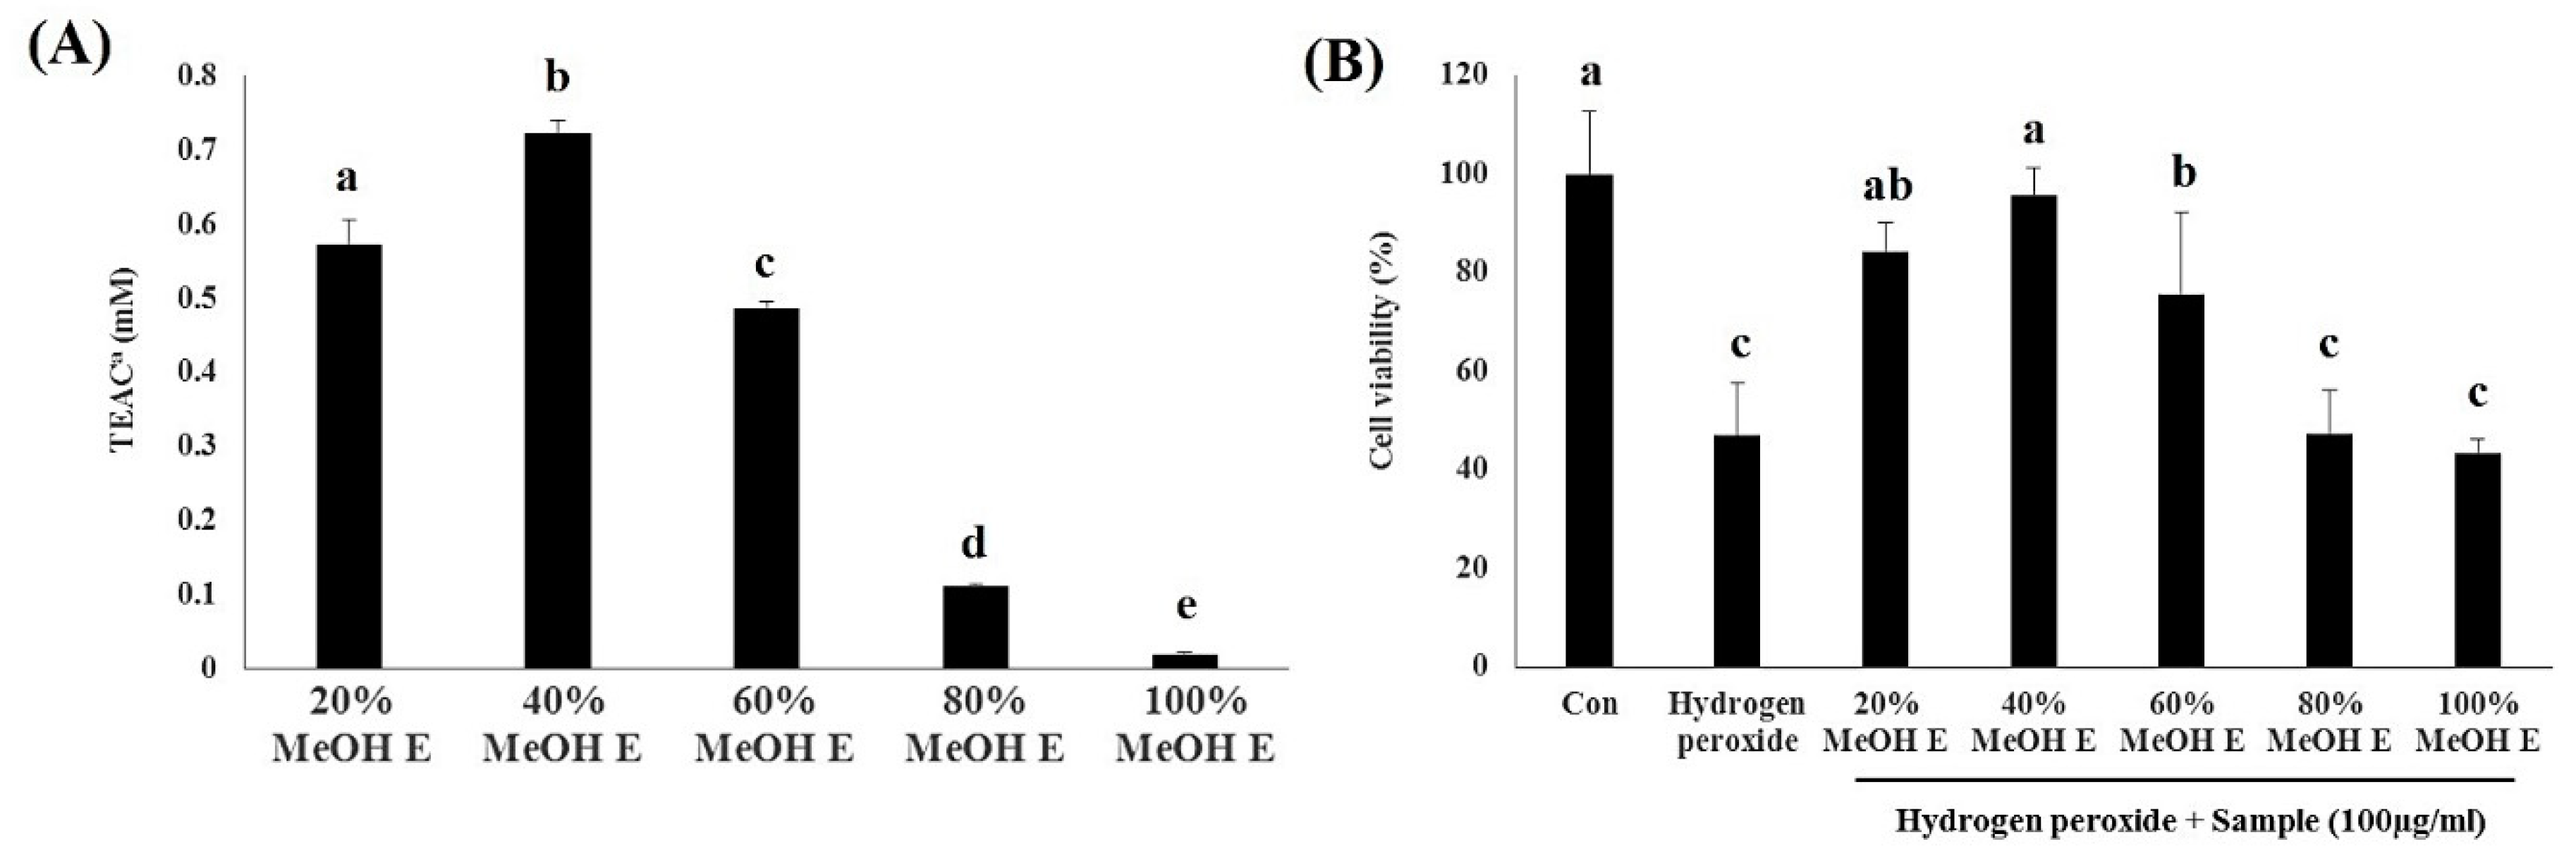
2.3. Bioactivity Assay for A. Firma SPE Fraction Eluates

SPE of A. firma with different proportions of methanol/water solvent (20%, 40%, 60%, 80%, and 100%) was performed to separate the metabolites based on their polarity. The sample dry yields for methanol SPE extracts were observed in the order of 20% > 40% > 60% > 100% > 80% (Table S1). Substances, such as carbohydrates, amino acids, and organic acids, are polar and have high molecular weights and were thought to be included in the most polar solvent (20% methanol), leading to the highest yield with 20% methanol SPE eluate (20% MeOH E). In contrast, as the solvents became non-polar, it appears that the yields were reduced because of dissolution of the non-polar and low molecular weight substances. We observed that the 40% methanol SPE eluate (40% MeOH E) exhibited the highest ABTS radical scavenging activities followed by 20% > 60% > 80% > 100% (Figure 3A). The cell viability for untreated control cells was reduced to 42% following the treatment. Conversely, pretreatment with SPE eluates, including 20%, 40%, and 60% MeOH E, significantly reversed the H2O2-induced damages to HDF cell viability. The different levels of biological activities imply that five different SPE eluates of A. firma MeOH E might contain dissimilar proportions or some components of bioactive compounds. In particular, the 40% MeOH E treatment had the highest protective effect against oxidative stress-induced cell damage, with an over 92% survival rate (Figure 3B). We presume that 40% MeOH E was abundant in antioxidant compounds, and hence reduced the H2O2-induced oxidative damage in HDF cells.

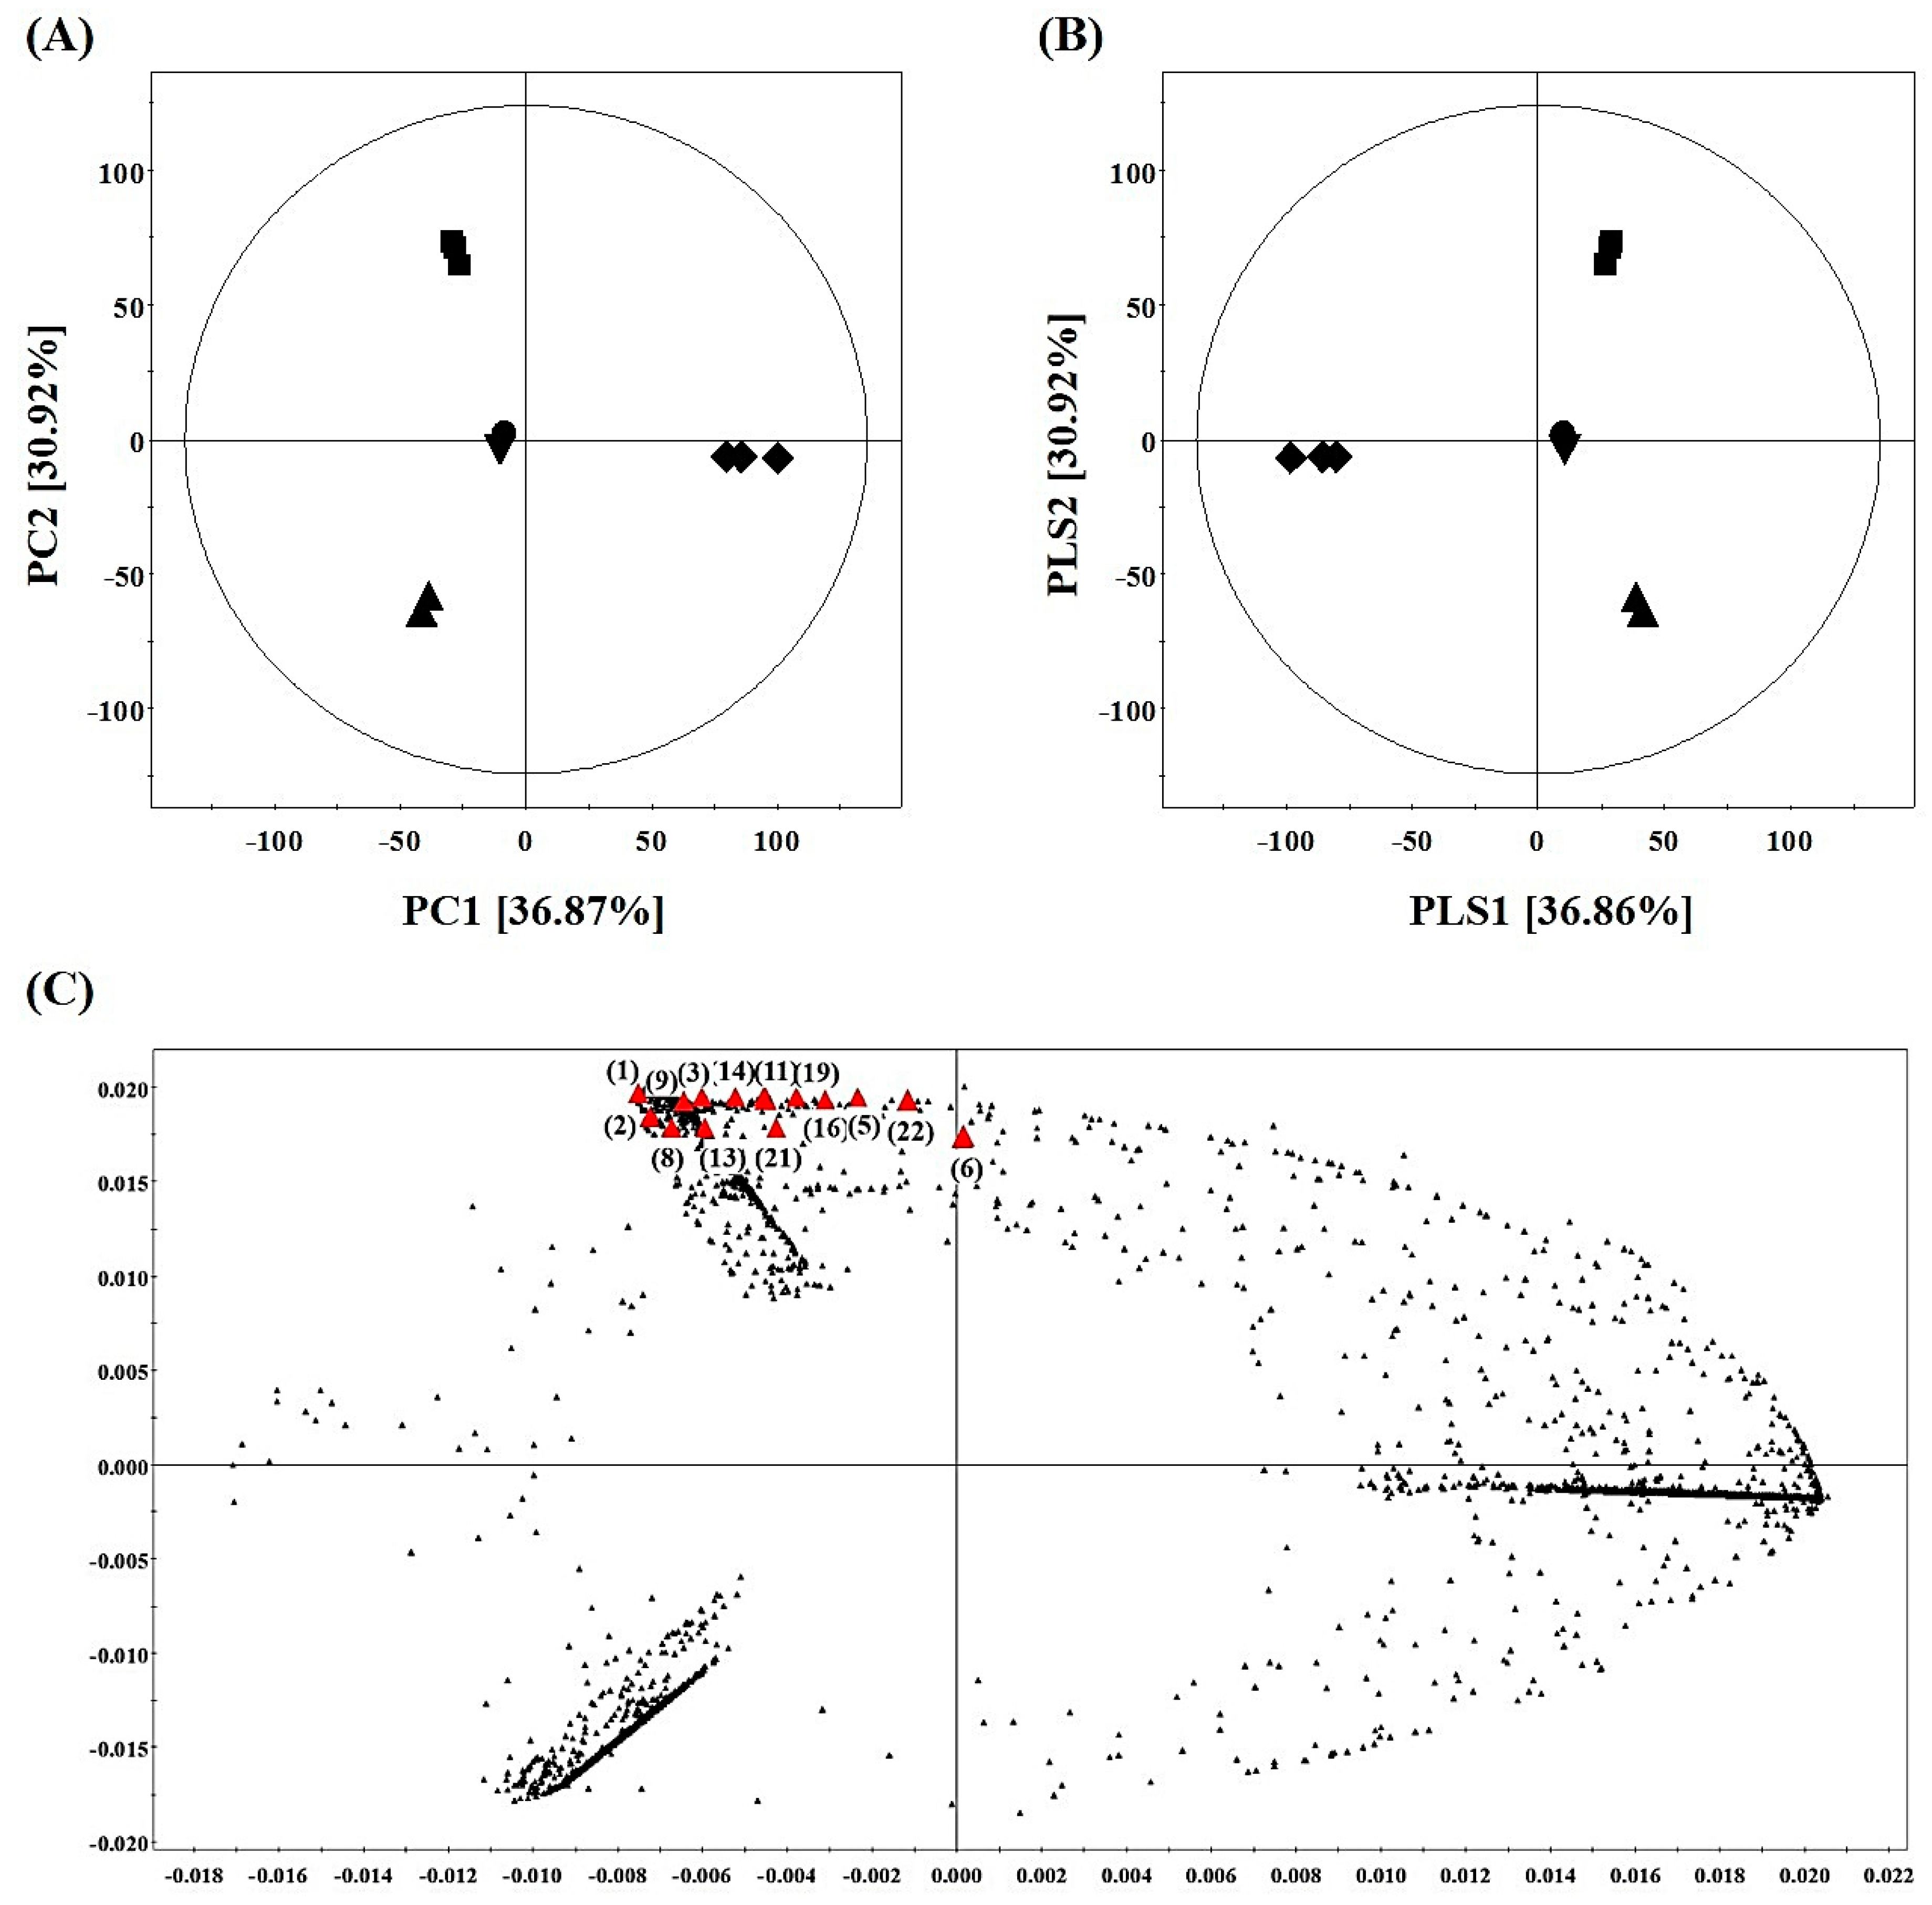
2.4. Metabolite Profiling of SPE MeOH Eluates of A. firma Extracts

Metabolite profiling using UHPLC-LTQ-IT-MS/MS combined with multivariate statistical analysis was conducted to analyze the discriminant metabolites among the five SPE MeOH eluates, including 20%, 40%, 60%, 80%, and 100%. In the PCA score plot derived from the negative mode data set (Figure 4A), the five SPE extracts were clustered separately from each other. Notably, the 40% MeOH E (■) was separated clearly from other extracts along PC2 (30.92%). The results showed that the chemical composition of each eluate was different, meaning that the complex substances in AFEE were separated according to the polarity in the SPE. Through the PLS-DA model (Figure 4B), overall, 48 variables were selected as significantly discriminant metabolites for five SPE MeOH eluates based on the variable importance in the projection (VIP) >0.7 and p-value < 0.05. Among them, 32 metabolites (19 flavonoids, 2 phenolic compounds, 8 diarylheptanoids, 2 stilbenoids, and 1 iridoid) were tentatively identified through a comparison of their mass fragmentation spectra and retention time with standard compounds, reference data, in-house library, and MassBank database (Table S2). With the PLS-DA model (Figure 4B), 14 metabolites discriminating the 40% MeOH E were determined and indicated on the loading plot derived from the PLS-DA results (Figure 4C). Among them, nine metabolites were tentatively identified and listed as follows (Table 1): (1) Ethyl gallate, (2) myricetin-3-O-galactoside, (5) myricetin-3-O-pentoside, (6) quercetin-3-O-glucoside, (9) quercetin-3-O-glucuronide, (11) hirsutoside, (14) luteolin-7-O-glucuronide, (16) pinosylvin diglucoside, and (22) platyphyllonol. Among them, (2) myricetin-3-O-galactoside has been previously reported in A. firma, while the other seven compounds have not been reported in A. firma yet, although they have been studied in other Alnus species [23]. The identified nine metabolites were classified into four categories including: (A) Flavonoids: (2) Myricetin-3-O-galactoside, (5) myricetin-3-O-pentoside, (6) quercetin-3-O-glucoside, (9) quercetin-3-O-glucuronide, and (14) luteolin-7-O-glucuronide; (B) phenolic acids: (1) Ethyl gallate; (C) stilbenoid: (16) Pinosylvin diglucoside; and (D) diarylheptanoids: (11) Hirsutoside and (22) platyphyllonol. Further, the identified flavonoids were categorized into flavonol and flavone glycosides.

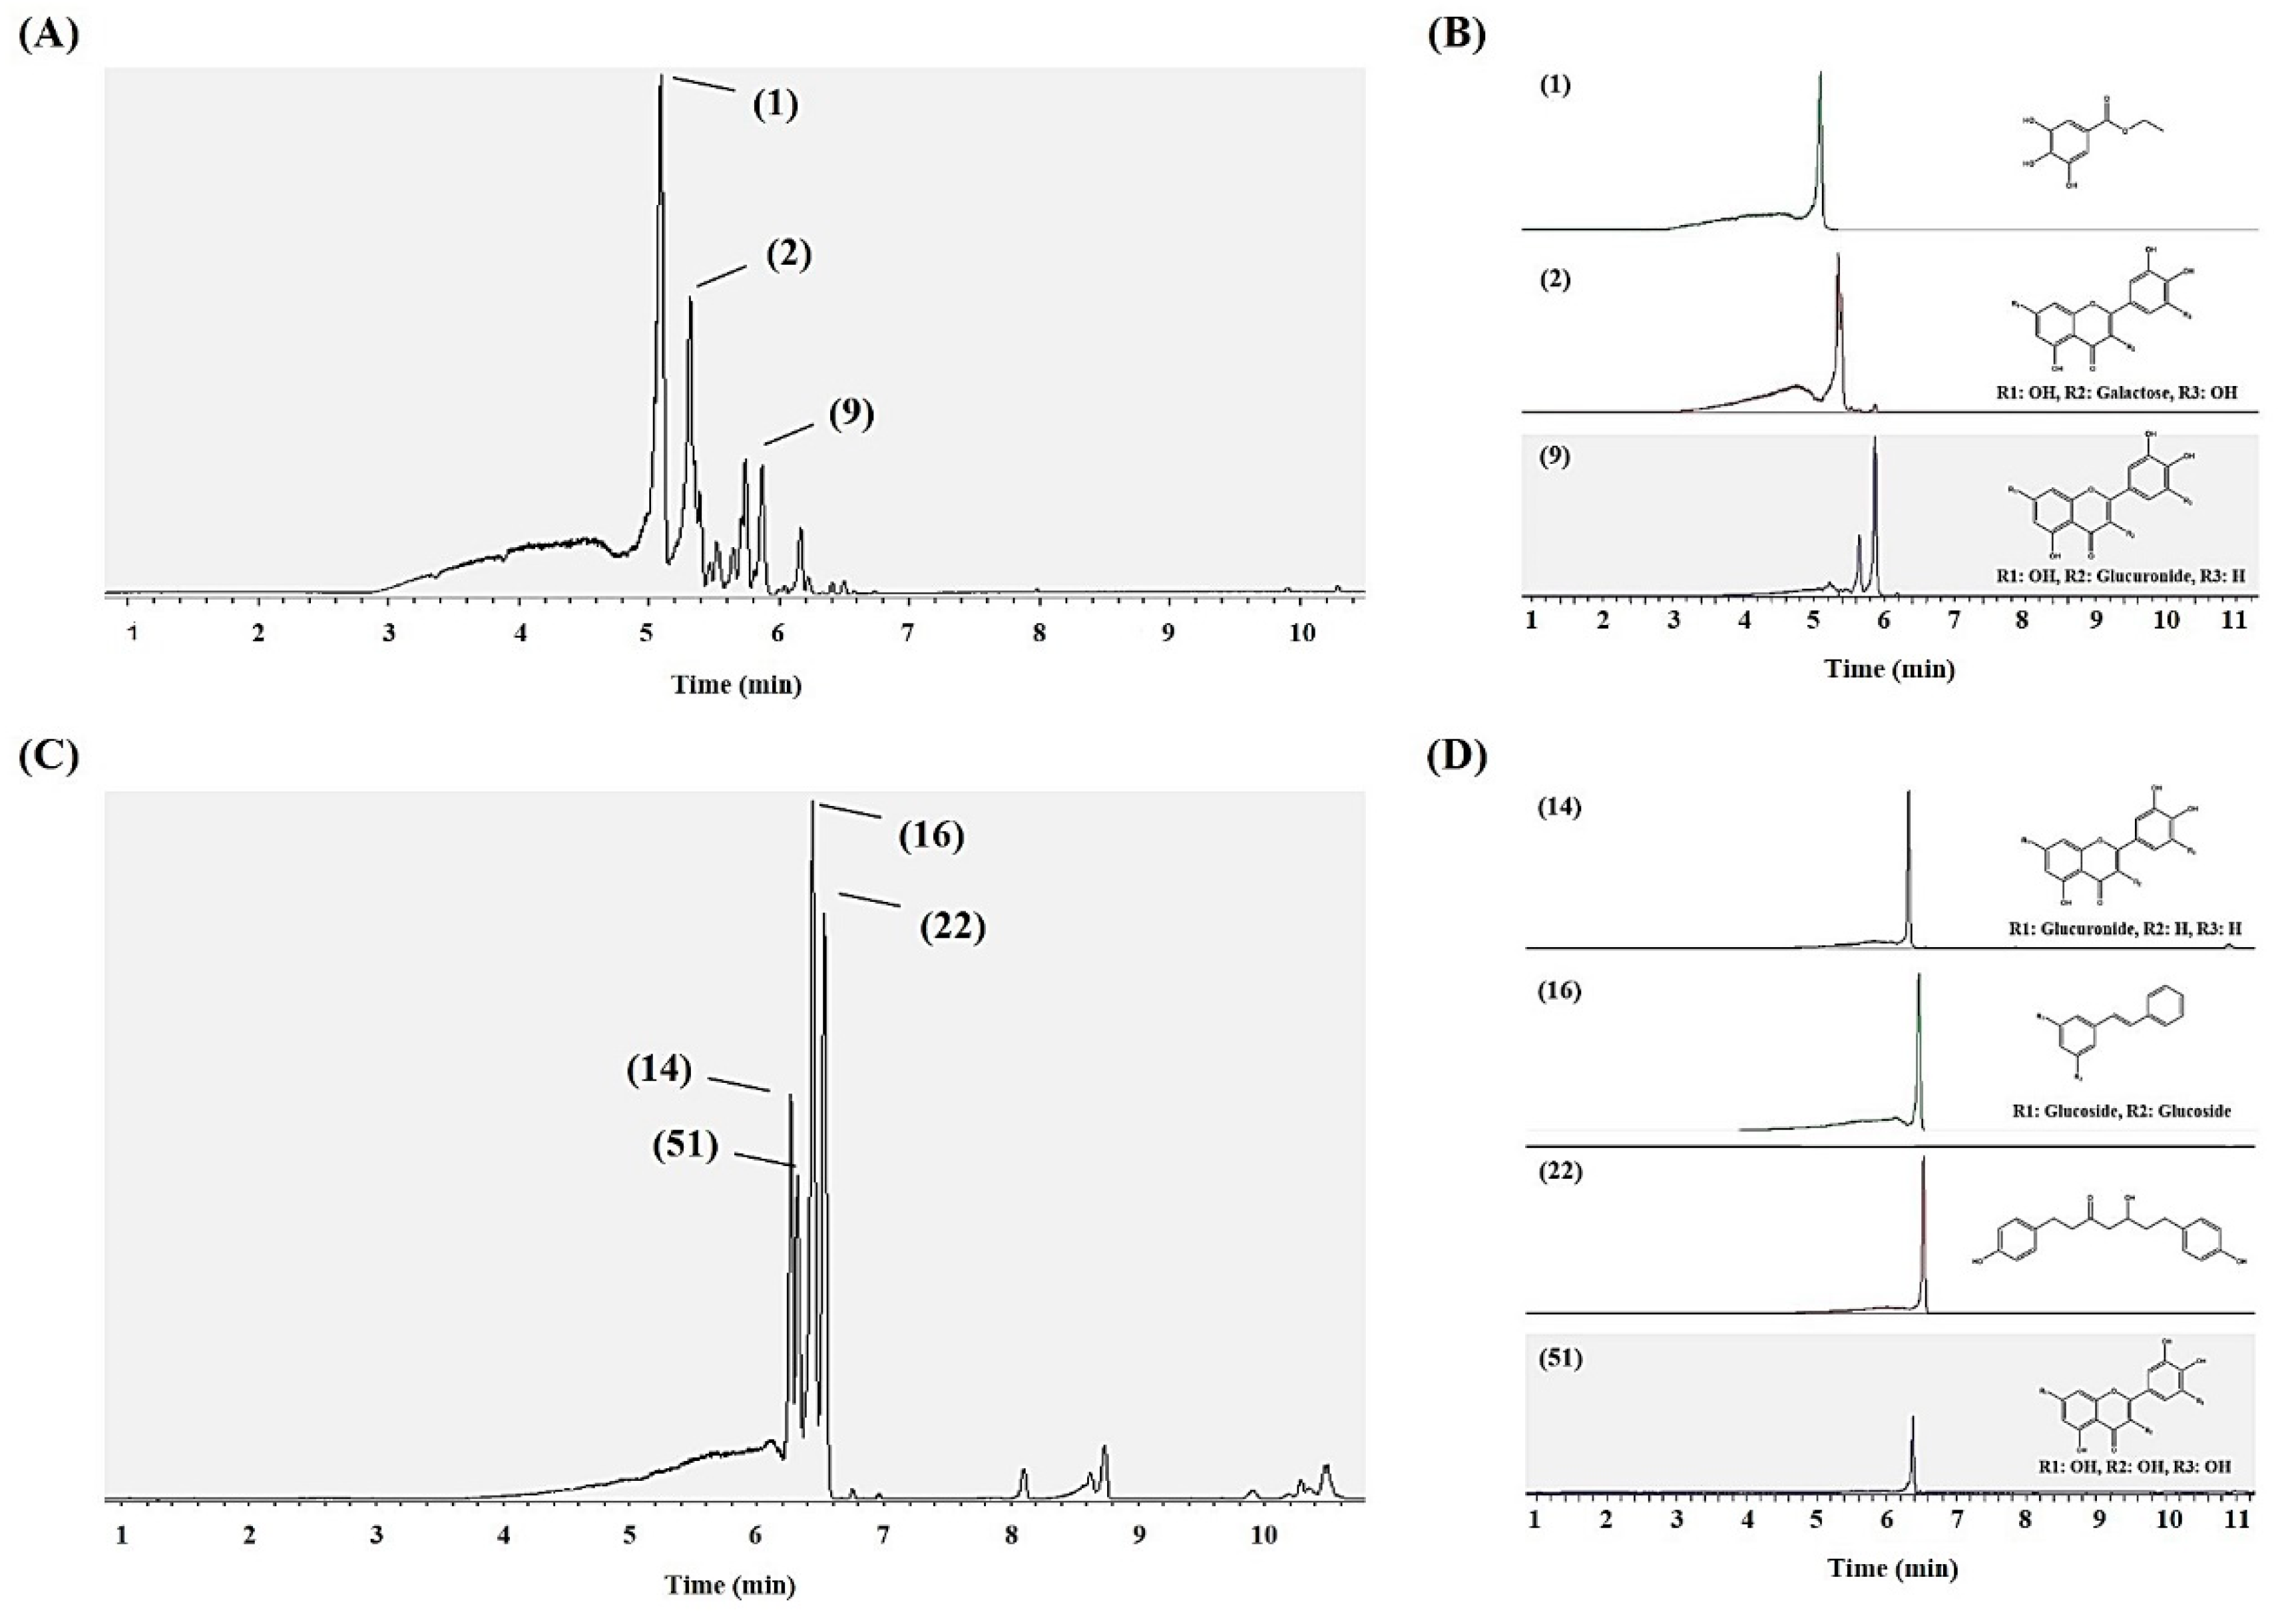
2.5. Preparative HPLC Sub-Fractionation (15 and 31 Min) of 40% MeOH SPE Eluates and Antioxidant Assays

Preparative high-performance liquid chromatography (prep-HPLC) coupled with bioactivity assays was been a standard approach for target compounds analysis in plants. The 40% MeOH E was chosen for the analysis based on its highest antioxidant activity among the five SPE extracts obtained. Prep-HPLC for the 40% MeOH E in combination with antioxidant assays was performed to analyze the antioxidant potential of the prep-HPLC sub-fraction (Figure S1). During the prep-HPLC analysis, a total of 72 fractions were collected (1 min−1) and their antioxidant activities were assayed for the odd-numbered fractions. The highest antioxidant activities were recorded for the 15-min and 31-min prep-HPLC fractions, and hence, they were further subjected to UHPLC-LTQ-IT-MS/MS and UHPLC-Q-Orbitrap-MS analyses. A total of 14 metabolites were detected in the two fractions, of which, seven metabolites were tentatively identified (Table 2) as ethyl gallate (1), myricetin-3-O-galactoside (2), and quercetin-3-O-glucuronide (9) from the 15-min fraction; while, luteolin-7-O-glucuronide (14), pinosylvin diglucoside (16), platyphyllonol (22), and myricetin (51) were identified from the 31-min fraction.
Notably, six compounds were detected in total from both 40% SPE MeOH E, as well as its prep-HPLC sub-fractions (15 and 31 min), while myricetin (51) was detected only in the 31-min prep-HPLC sub fraction. The UHPLC-Q-Orbitrap-MS chromatogram, ion extracted chromatogram, and the structure of the identified metabolites of the 15- and 31-min fractions are shown in Figure 5.

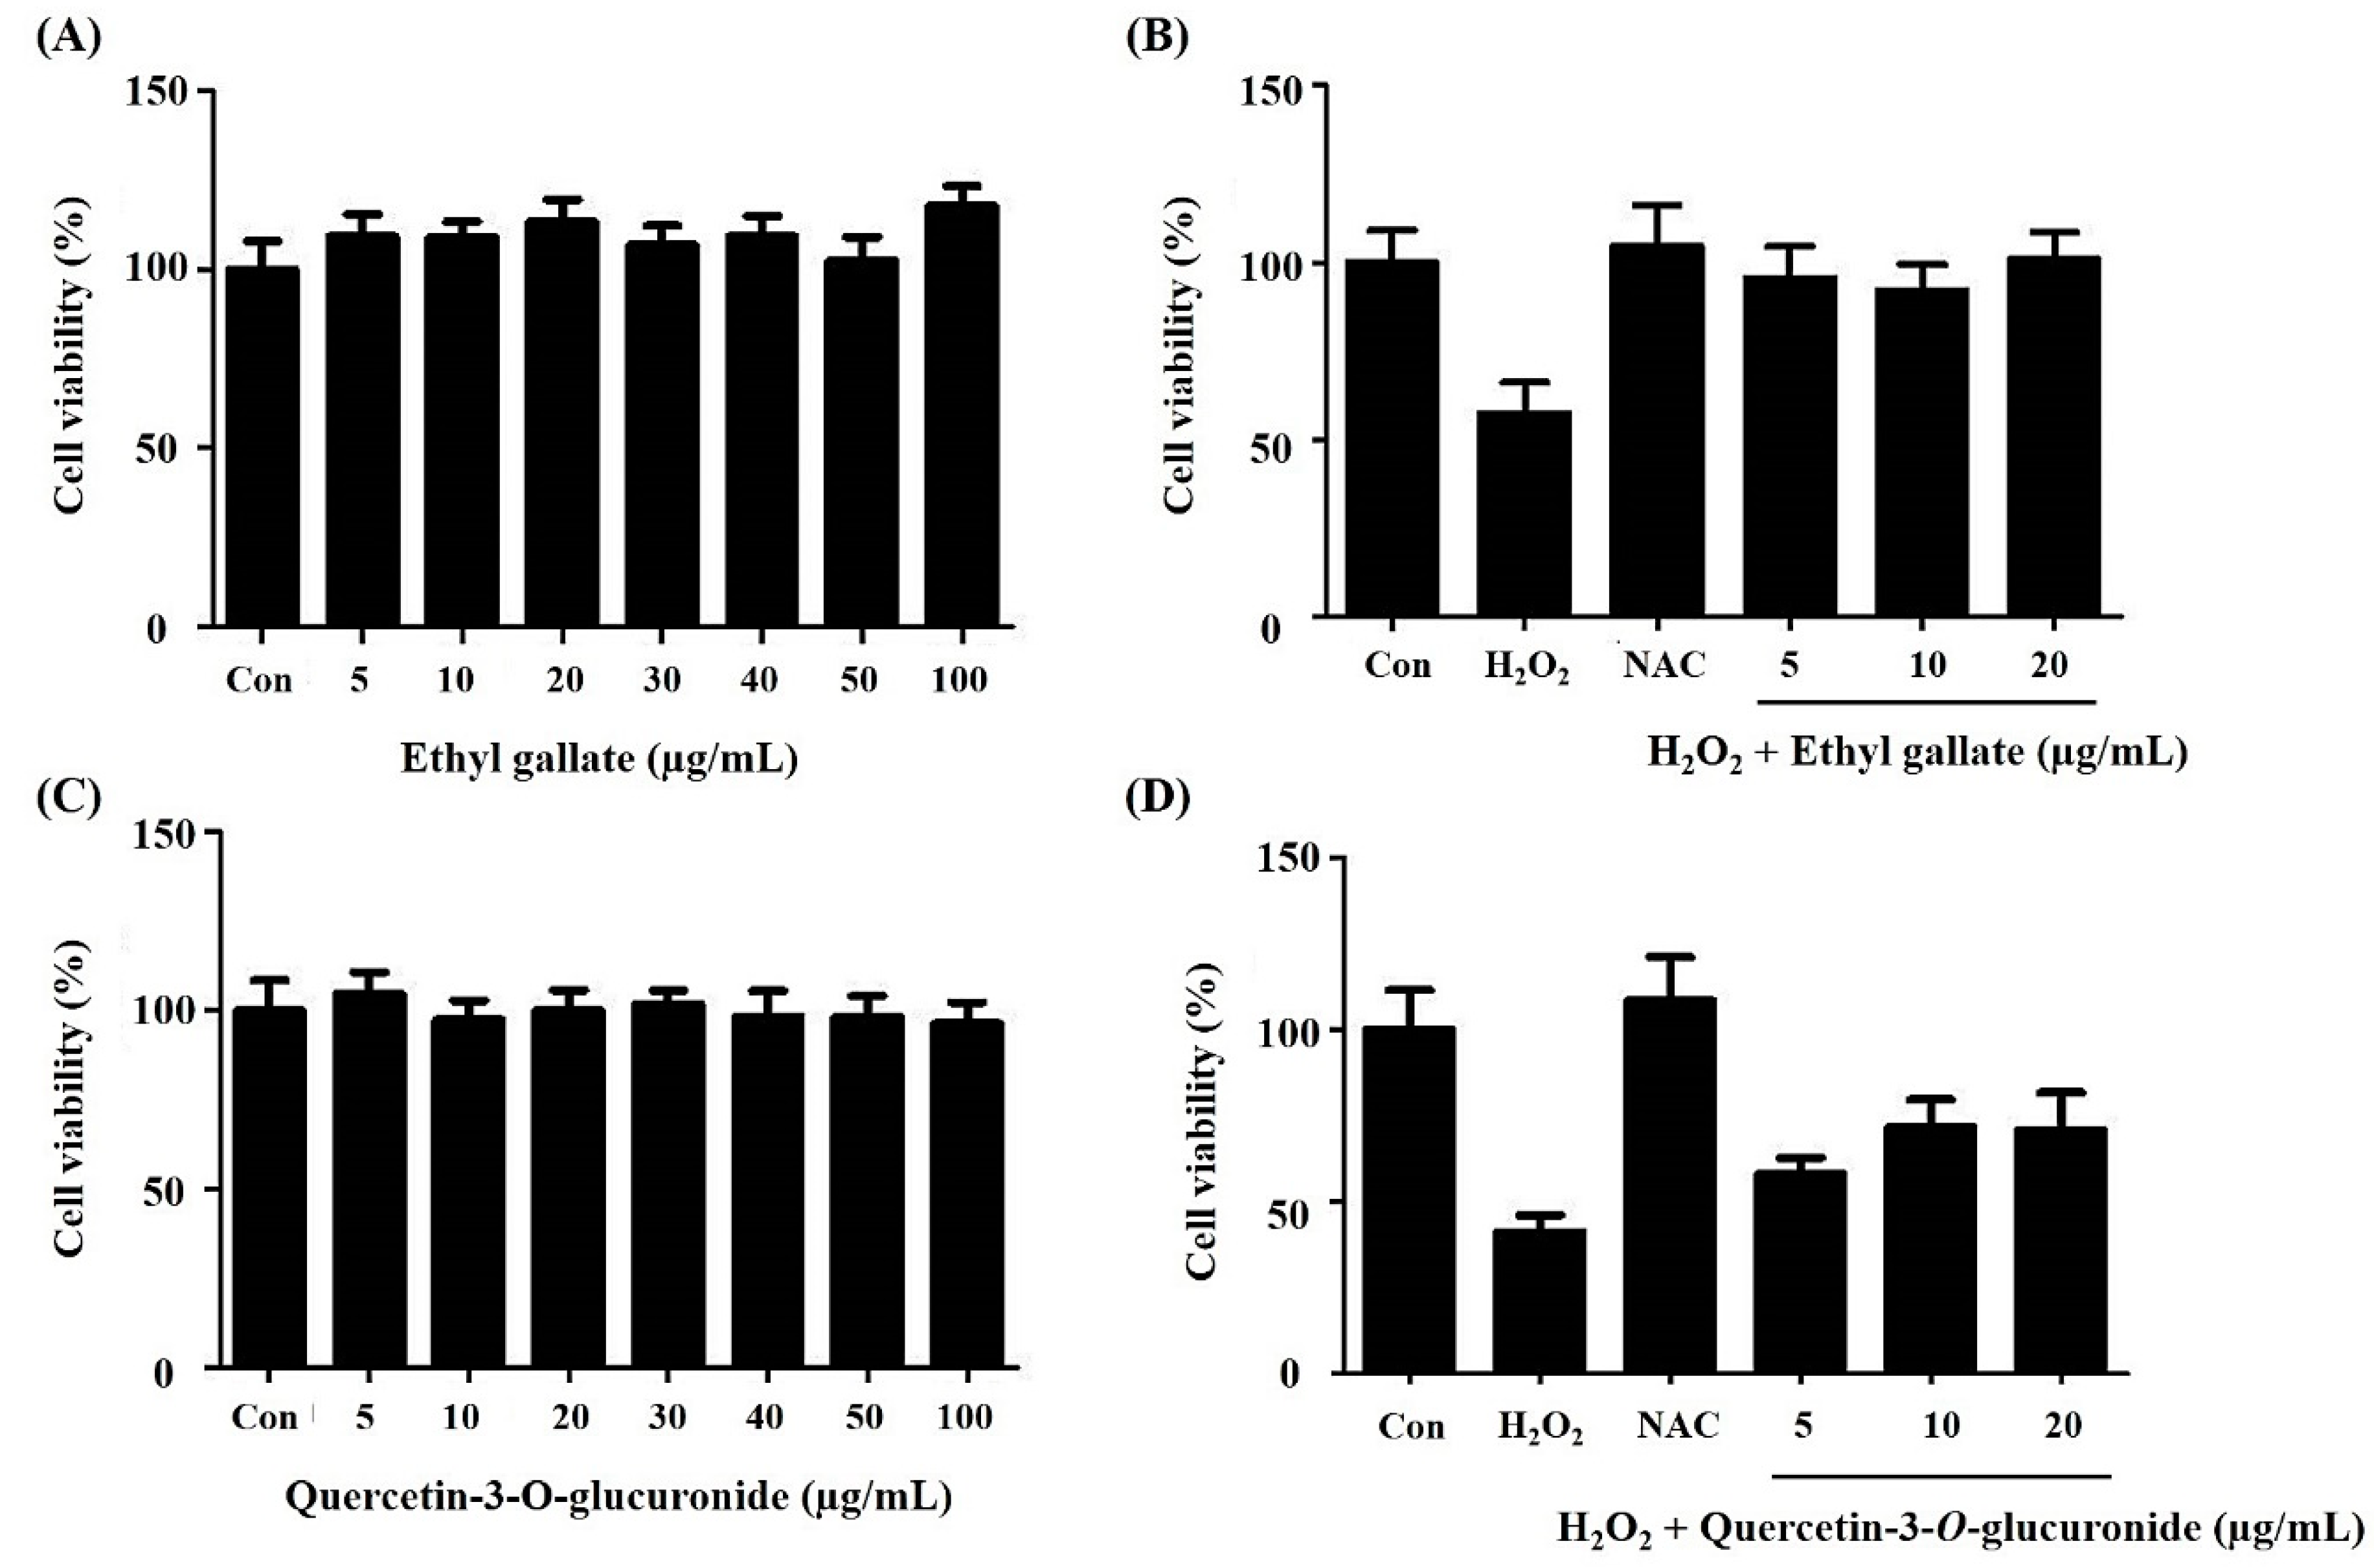
2.6. Bioactivity Validation of Proposed Metabolites

Overall, 19 metabolites, including 9 overlapping compounds, were detected and proposed as antioxidant-related compounds based on the results of metabolite profiling and prep-HPLC analyses. The results suggested that several analytical methods can be applied to natural product research to detect a plethora of compounds. Of these, 10 compounds were tentatively identified. To validate whether the proposed metabolites had antioxidant properties, six commercial standard compounds were purchased, and confirmation experiments were performed. In the case of the ABTS radical scavenging activity assay, the EC50 values of the six commercial standard compounds were determined (Table 3). The observed EC50 values in order from the lowest to highest were: (1) Ethyl gallate, (9) quercetin-3-O-glucuronide, (2) myricetin-3-O-galactoside, (6) quercetin-3-O-glucoside, (14) luteolin-7-O-glucuronide, and (51) myricetin. In particular, ethyl gallate and quercetin-3-O-glucuronide displayed relatively high antioxidant activities, with no cytotoxicity even at the 100 μg/mL concentration as compared with other compounds (Figure 6A,C). Ethyl gallate and quercetin-3-glucuronide had cytoprotective effects against hydrogen peroxide-mediated cytotoxicity (Figure 6B,D). Notably, although the two compounds had similar levels of antioxidant activity in the ABTS assay, ethyl gallate effectively mitigated the oxidative damage within the non-cytotoxic concentration range compared to quercetin-3-O-glucuronide.

3. Discussion

We applied integrated metabolomics-cum-bio-assay-guided methodology to screen valuable plant resources, i.e., antioxidant secondary metabolites, from 10 species of the Betulaceae family. In general, the chemical composition of plants is affected by multiple factors, including their phylogeny, environment, climate, and metabolic processes. By applying these experimental protocols, we were able to understand what factors influence plant chemical composition more. However, since the plant samples analyzed in this research were the plant extracts mixed with leaves and stems, further study is needed to know the difference in chemical composition according to tissues. The compositions of plant secondary metabolites were dependent more on phylogeny rather than environmental factors [24]. However, some reports indicate that the data had little similarity with taxonomic patterns based on other traits, and the chemical profiles of some plant species may differ despite belonging to the same genus [25,26].
We evaluated the untargeted metabolite profiles and antioxidant activities from 10 species of the Betulaceae family and investigated whether the tendency of clustering formation acquired from chemotaxonomy was related their metabolite compositions. In general, we observed similar antioxidant activity levels for the ethanol extracts from the plants belonging to same genus groups; however, the Alnus genera extracts displayed significantly higher antioxidant levels compared to others. The results suggested that the variations in metabolite profiles for the species belonging to the same genus could manifest their chemotaxonomy and associated bioactivity.
The A. firma (1) ethanol extract displayed the highest antioxidant activity coupled with a distant chemotaxonomic profile compared to the remaining nine species from the Betulaceae family. The antioxidant compounds in the A. firma extracts were able to mitigate the oxidative stress in the HDF cells, and thus enhance cell viability. According to the ‘free-radical theory’ [27], the cells are damaged by reactive oxygen stress (ROS), including superoxide anions, hydroxyl radicals, and hydrogen peroxide. The ROS produced via endogenous and exogenous sources damage DNA, fatty acids in lipids, and amino acids in proteins, leading to impaired physiological function and fast aging in cells. Consequently, the antioxidative defense mechanisms in live cells are the counteractions of the oxidative stress. The experimental results reveal the presence of strong antioxidants in the AFEE, which might have mitigated the oxidative stress in HDF cells, resulting in higher cell viability. As seen from the results, the tendency to scavenge free radicals and confer cyto-protection is related, suggesting that the antioxidants in the extracts were directly responsible for the reduced oxidative stress of HDF cells, as also proposed in the free-radical theory.
Although A. firma was screened as a valuable plant with remarkable antioxidant activity, various separation and analytical methods were required to characterize the antioxidant compounds owing to its complex chemical composition. Separation of active compounds based on affinity is valuable, as the solid phase extraction (SPE) method offers rapid extraction with minimal labor, and yet, has high yield concentrations, and is therefore widely used as a pretreatment process for plant chemical analysis [28].
The metabolite profiling of SPE eluates of A. firma extracts indicated flavonoids, phenolic acids, stilbenoids, and diarylheptanoids as the main metabolite classes in the 40% MeOH E. Considering the glycosidic moieties, the glycoside forms of flavonoids are more highly polar than the corresponding aglycone forms, which complicates their extraction in highly polar solvents, such as 40% methanol [29]. Flavonoids are representative compounds of plant origin and are known to possess antioxidant activities through electron transfer to free radicals [30]. Ethyl gallate is a natural phytochemical produced by plants and possesses antioxidant properties [31]. Pinosylvin, a stilbenoid derivative, acts as an antioxidant by donating and accepting electrons [32]. Diarylheptanoids are compounds found mainly in plants of the Betulaceae family and have associated antioxidant properties [33]. Hirsutoside and platyphyllonol are linear diarylheptanoids with antioxidant activities, but they have been reported from other Alnus species [23] and not in A. firma. Hence, we infer that 40% MeOH SPE eluates were primarily composed of compounds with high antioxidant activities, affecting both the ABTS radical scavenging, as well as mitigating oxidative stress in HDF cells. Metabolite profiling is a method of analyzing significantly different metabolites using statistics, based on which it was possible to list 40% MeOH E-specific metabolites in this study. However, information was insufficient to clarify which metabolites are truly involved in the antioxidant effects. Therefore, we performed a preparative high-performance liquid chromatography (prep-HPLC) for further analysis. Prep-HPLC coupled with bioactivity assays are standard methods for analyzing target compounds in plants. These methods can be useful tools in the rapid search for functional bioactives in plants.
Ethyl gallate and quercetin-3-O-glucuronide were detected using both MS-based metabolite profiling and preparatory-HPLC methods coupled with parallel antioxidant assays. This highlights a strong linkage to the antioxidant activities of compounds from A. firma. Gallic acid has strong antioxidant activity due to its hydroxyl and carboxyl groups in the aromatic ring [34]. Although one hydroxyl group is ethylated, the structural skeleton may be consistent with the antioxidant activity of ethyl gallate (1). The antioxidant activity of quercetin-3-O-glucuronide (9) may be attributed to the quercetin aglycone itself, as well as the free carboxyl group in its glucuronide moiety with high polarity [35]. Considering the ‘free radical theory’, the two strongest ABTS radical scavengers were tested for their ability to confer protection against oxidative damage in HDF cells. Few studies have investigated this in ethyl gallate and quercetin-3-O-glucuronide. Kalaivani revealed that ethyl gallate, a nonflavonoid phenolic compound, is a potent antioxidant and functions as a radical scavenger, metal ion chelator, and hydrogen donor [36]. The glycosidic moiety of flavonoids affects the bioactivities by altering the molecular size, charge, and polarity. Generally, when flavonoids are ingested and enter the circulatory system, they are presented in the glucuronide form through enterohepatic circulation [37]. Our results support the possibility that ethyl gallate and quercetin-3-O-glucuronide in A. firma may contribute to antioxidant activity observed in the in vitro systems. This research provides a platform for elucidating the useful metabolites of plants.

4. Materials and Methods

4.1. Chemicals and Reagents

Ethanol, methanol, acetonitrile, and water were purchased from Fisher Scientific (Pittsburgh, PA, USA). Potassium persulfate, 2,2″-azinobis (3-ethylbenzothiazoline-6-sulfonic acid) diammonium salt (ABTS), 6-hydroxy-2,5,7,8-tetramethylchroman-2-carboxylic acid (Trolox), hydrogen peroxide, ascorbic acid, N-acetyl-L-cysteine (NAC), 2,3-Bis-(2-Methoxy-4-Nitro-5-Sulfophenyl)-2H-Tetrazolium-5-Carboxanilide (XTT), and standard compounds were purchased from Sigma-Aldrich (St. Louis, MO, USA). Dulbecco’s modified Eagle’s medium (DMEM), fetal bovine serum (FBS), penicillin-streptomycin, phosphate-buffered saline (PBS), and trypsin-Ethylenediaminetetraacetic acid (EDTA) were purchased from Gibco (Grand Island, NY, USA).

4.2. Sample Information and Preparation

Ten plant species belonging to the Betulaceae family were used in this study (Table 4). Plant samples were harvested between July and August 2014 from six provinces, one metropolitan city, and one special self-governing province of Korea. All voucher specimens were kept in the herbarium of the National Institute of Biological Resources (NIBR, Incheon, Korea). The above-ground plant samples were dried under shade, and each sample (100 g) was extracted with 70% ethanol (1000 mL). Further, each sample was concentrated using a rotary vacuum evaporator (Eyela, Tokyo, Japan) followed by filtration using Millex® GP 0.22-μm filters (Merck Millipore, Billerica, MA, USA). The concentrated solutions were freeze-dried and stored in deep freezer (−70 °C) until analyses.

4.3. Metabolite Profiling of Plants from Betulaceae

The dried solvent extracts from 10 plant species belonging to the Betulaceae family were dissolved in 70% ethanol (20 mg/mL) and filtered through a 0.2-μm PTFE filter. The UHPLC-LTQ-IT-MS/MS analysis was performed using a Thermo Fisher Scientific LTQ XL linear ion trap mass spectrometer consisting of an electrospray interface (Thermo Fisher Scientific, San José, CA), coupled with a DIONEX UltiMate 3000 RS pump, RS autosampler, RS column compartment, and RS diode array detector (Dionex Corporation, Sunnyvale, USA). The sample analytes were separated on a Thermo Scientific Syncronis C18 UHPLC column (100 mm length × 2.1 mm i.d., 1.7-μm particle size). The mobile phase consisted of A (0.1% [v/v] formic acid in water) and B (0.1% [v/v] formic acid in acetonitrile). The solvent gradient flow was programmed as follows: 10% B for 0–1 min, 10–100% B for 1–15 min, 100% B for 15–18 min, 100–10% B for 18–19 min, and again 10% B for 19–22 min. The solvent flow rate was set at 0.3 mL/min. The sample injection volume was 10 μL. The temperature of the column was maintained at 35 °C. The detection wavelength for the photodiode array detector ranged from 200 to 600 nm. Ion trap was performed in the positive and negative full-scan ion modes within a range of 150 to 1000 m/z. The operating parameters were tuned as follows: Source voltage ± 5 kV; capillary voltage 39 V; capillary temperature 275 °C. Tandem MS analysis was performed using scan-type turbo data-dependent scanning (DDS) using the same conditions as used for MS scanning. Three spectrometric repetitions were applied to each sample. The UHPLC-LTQ-IT-MS/MS data were acquired with Xcalibur software version 2.00 (Thermo Fisher Scientific, San José, CA), and the raw data files were converted to NetCDF (*.cdf) format using Xcalibur software. After conversion, the NetCDF files were subjected to preprocessing, correction of retention time and baseline, and peak extraction using the MetAlign software package (http://www.metalign.nl). The resulting data were exported to a Microsoft Excel file (Microsoft, Redmond, WA, USA). The multivariate statistical analysis was carried out using SIMCA-P+ 12.0 software (Umetrics, Umea, Sweden). The PCA, PLS-DA, and HCA were performed to analyze the metabolomic profiles and chemotaxonomy of the plants.

4.4. Solid-Phase Extraction (SPE) for A. Firma Extracts

The freeze-dried A. firma extract (1 g) was dissolved in 70% ethanol (700 μL). The C18 Sep-Pak cartridge (Waters, Milford, MA, USA) was pre-washed with 50 mL of 20% methanol. The sample analyte was loaded on to the cartridge and extracted using 50 mL of each solvent in the following order: 20%, 40%, 60%, 80%, and 100% methanol. Each eluate from the fractionation was dried using a speed vacuum concentrator and stored in a −70 °C freezer until analyses. The dried yields of five extracts from A. firma are shown in the Table S1.

4.5. Metabolite Profiling and Multivariate Analysis of A. Firma SPE Samples

The dried SPE samples from A. firma were dissolved in 70% ethanol (5 mg/mL) and filtered using a 0.2-μm PTFE filter prior to UHPLC-LTQ-IT-MS/MS analysis. The instrumental condition and data processing methods were similar to those described in the previous section. The significantly different compounds in the SPE samples were selected based on the variable importance in the projection (VIP) > 0.7, and the analysis of variance (ANOVA), tested at p-value < 0.05. The putatively identified compounds were confirmed using authentic standard compounds through a comparison of both the mass spectra (MS) and retention time (RT) data. In cases where standard compounds were not available, tentative identification was performed based on the MS data from the National Institute of Standards and Technology (NIST, Gaithersburg, MD, USA, 2005), combined chemical dictionary (CCD) version 7.2 (Chapman & Hall/CRC), and published literature [23].

4.6. Bioactivity Assays

4.6.1. ABTS Radical Scavenging Assay of Plant Extracts Obtained from the Betulaceae Family

The antioxidant levels of plant extracts from the Betulaceae family were analyzed using a modified ABTS radical scavenging activity assay [38]. The dried extracts from each sample were dissolved in 70% ethanol (1 mg/mL). ABTS ammonium was dissolved in 2.45 mM potassium persulfate solution (7 mM). The ABTS stock solution was maintained at room temperature for one day in order to allow it to turn into a dark blue solution. Before assaying, the ABTS stock solution was diluted with distilled water until the OD 734 nm value reached 0.7. The reaction mixtures containing 10 μL of the dissolved sample and 190 μL of ABTS solution were incubated at room temperature in a 96-well microtiter plate. After 6 min, the OD 734 nm values were recorded using a microplate reader (BioTek ELx808, Winooski, VT, USA), with 6-hydroxy-2,5,7,8-tetramethylchroman-2-carboxylic acid (trolox) used as a standard compound. The concentration of trolox solution ranged from 0.0625 to 0.5 mM. The antioxidant activity of the sample extracts is represented as trolox equivalent antioxidant capacity (TEAC, mM). The significant differences were analyzed using analysis of variance (ANOVA). All experiments were carried out in triplicate.

4.6.2. ABTS Radical Scavenging Assay for SPE Eluates of Extracts from A. firma

Each dried SPE eluate from A. firma extract was dissolved in 70% ethanol (0.1 mg/mL) and subjected to ABTS radical scavenging assay in triplicate using the method described above.

4.7. Cell Culture and Maintenance

HDF cell lines were procured from the American Type Culture Collection (Manassas, VA, USA). The HDF cells were cultured in DMEM medium supplemented with 10% heat inactivated FBS, 2 mM glutamate, 100 U/mL penicillin, and 100 μg/mL streptomycin. The cells were maintained at 37 °C in a 5% CO2 incubator. The cells were cultured to approximately 80% confluence, harvested with 0.25% trypsin-EDTA, and further sub-cultured for an additional 48 h in DMEM.

XTT Cell Viability Assay using Extracts of A. firma Plants

The HDF cell proliferation rates were analyzed using 2,3-bis(2-methoxy-4-nitro-5-sulfophenyl)-2H-tetrazolium-5-carboxanilide inner salt (XTT) assay (WelGene, Seoul, Korea). The actively growing log phase HDF cells were seeded in 96-well plates (1 × 10⁴ cells/well) for 24 h. The cells were divided as control and treatment groups subjected to the concentrations indicated. After 24 h, the number of viable cells were determined using XTT assay. The protective effects of A. firma ethanol extracts (AFEE) against hydrogen peroxide-induced cell death were evaluated using seeding HDF cells (5 × 10⁴ cells/well) cells in 12-well plates. After 48 h of pre-incubation, the cells were treated with various concentrations (25, 50, and 100 μg/mL) of AFEE, followed by addition of 1 mM hydrogen peroxide to each well. After 3 h of incubation of the treated groups, the % cell viability was determined using XTT assay. To determine the effects of SPE eluates on hydrogen peroxide-induced cell death, HDF cells were seeded in 12-well plates. After 48 h of incubation, the cells were treated with 100 μg/mL of each SPE eluate, followed by addition of 1 mM hydrogen peroxide to each well. After 3 h of incubation, the number of viable cells was determined using XTT assay. The appropriate negative (solvent) and positive (50 μM ascorbic acid) controls were maintained during each bioassay. Images of the cells were collected using a light microscopy set to 40-fold magnification. Absorbance (A) was determined with an enzyme calibrator at 450 nm. The % cell viability was determined using the following formula:
Cell   viability XTT   = ( A 450   nm   Treated   groups A 450   nm   Control   groups ) × 100 %

4.8. Combined Preparative HPLC Analysis and ABTS Assay of 40% SPE Eluates of A. Firma Extracts

The 40% methanol SPE eluates (40% MeOH E) were further subjected to preparative high-performance liquid chromatography (prep-HPLC). The prep-HPLC system was fitted with a diode array detector (PDA) L-2455, a binary pump L-2130 (Hitachi, Tokyo, Japan), and a YMC-Pack pro C18 column (250 mm length × 4.6 mm i.d., 5-μm particle size). The mobile phases consisted of A (5% acetonitrile in water) and B (100% acetonitrile). The solvent gradients were programmed as follows: 100% A for 0–2 min, 0–40% B for 2–62 min, 40–100% B for 62–67 min, and 0–100% A for 67–72 min. Before performing the prep-HPLC, 1 mg/mL of 40% MeOH E was injected for HPLC profiling. The flow rate was set at 1 mL/min and the PDA was tuned to range from 220 to 600 nm. Following HPLC profiling, 40 mg/mL of 40% MeOH E was injected for prep-HPLC with a flow rate of 1 mL/min and the absorption wavelength was set at 220 nm. Overall, 72 sub-fractions were collected at a rate of 1 fraction per minute. The prep-HPLC sub-fractions were dried using a speed vacuum concentrator and stored in a freezer (−70 °C) until further analyses. The dried fractions were dissolved in 70% ethanol (0.1 mg/mL) and ABTS radical scavenging activity assays were performed as described in the previous section.

4.9. Analysis of Bioactive Prep-HPLC Sub-Fractions Using UHPLC-LTQ-IT-MS/MS and UHPLC-Q-Orbitrap-MS

The selected bioactive sub-fractions from prep-HPLC were further subjected to UHPLC-LTQ-IT-MS/MS and UHPLC-quadrupole-orbitrap MS (Q-Orbitrap-MS) analyses. In the case of UHPLC-LTQ-IT-MS/MS, the instrument operating conditions were similar to those described in the previous section. In case of UHPLC-Q-Orbitrap-MS, a Dionex Ultimate 3000 UHPLC system (Thermo Fisher Scientific, Bremen, Germany) coupled to the Q-Exactive Orbitrap MS (Thermo Fisher Scientific, Bremen, Germany) was used. The UHPLC system was equipped with an Ultimate 3000 RS pump, Ultimate 3000 RS column compartment, and an Ultimate 3000 RS autosampler, all operated using Dionex Chromeleon software (Version 6.8, Dionex, Sunnyvale, CA, USA). The Hypersil Gold C18 selectivity LC column (50 mm length × 2.1 mm i.d., 1.9 μm particle size; Thermo Fisher scientific, Waltham, MA, USA) was used with acetonitrile (mobile phase A), water (mobile phase B) containing 0.1% formic acid, and at a flow rate of 0.3 mL/min. The gradient program was run as follows: 100% B for 20 min, then to 100% A in 0.5 min. The column was re-equilibrated at 100% B for 2.5 min prior to the next injection. The total run time for each injection was 23 min. The injection volume was 10 µL. The column oven temperature and autosampler temperature were set to 25 and 4 °C, respectively.
The Q-Exactive Orbitrap MS equipped with a heated electrospray ionization source (HESI) was operated in the negative ion mode. MS was operated in the full-scan mode. The spray voltage (negative mode), capillary temperature, probe heater temperature, and S-lens RF level were set to 3.3 kV, 320 °C, 300 °C, and 60, respectively. The sheath gas and auxiliary gas flow rates were set to 30 and 10 L/min, respectively. Nitrogen was used for spray stabilization, for collision-induced dissociation in HCD cells, and damping gas in the C-trap. The following parameters were used in full MS scan mode: Resolution 35,000 FWHM, scan range 100–1000 m/z, and the automatic gain control (AGC) target was set at 1e6 with a maximum injection time (IT) of 100 ms. The instrumental device was calibrated in the negative and positive mode once a week using the manufacturer’s calibration solutions.

5. Conclusions

In this study, we proposed a strategy for screening useful plant resources and identifying bioactive compounds based on metabolomics involving a combination of two analytical methods. Our results reveal that the two analytical approaches may cover a wide range of detected metabolites. Through this analysis, we were able to select useful plant species, track their bioactive compounds, and isolate ethyl gallate and quercetin-3-O-glucuronide as antioxidant compounds in A. firma. This research provides a metabolomic-cum-bioassay-guided methodology toward the comprehensive analyses and characterization of bioactive plant metabolites.

Supplementary Materials

The following are available online at https://www.mdpi.com/2218-1989/9/9/186/s1, Figure S1: (A) HPLC profiling chromatogram of 40% MeOH extract and (B) ABTS radical scavenging activities of odd-numbered preparative HPLC fractions. a Trolox equivalent antioxidant capacity. Table S1: The dried yields of five extracts from A. firma, Table S2: Tentatively identified metabolites in five SPE extracts based on metabolite profiling combined with multivariate statistical analysis.

Author Contributions

C.H.L. conceived and designed this research. S.L. (Sunmin Lee) and D.-G.O. performed the majority of the experiments and data analysis. H.J.L., G.R.K., Sarah Lee, and J.S.L. provided resources and analyzed the data and interpreted. S.L. (Sarah Lee) and D.-G.O. wrote original draft preparation. D.S. and C.H.L. reviewed and editing the manuscript. All authors read and approved the final manuscript.

Funding

This work was supported by a grant from the National Institute of Biological Resources (NIBR), funded by the Ministry of Environment (MOE) of the Republic of Korea (NIBR201912102) and by Traditional Culture Convergence Research Program through the National Research Foundation of Korea (NRF) funded by the Ministry of Science, ICT & Future Planning (NRF-2017M3C1B5019303).

Conflicts of Interest

The authors declare no conflict of interest. The funders had no role in the design of the study; in the collection, analyses, or interpretation of data; in the writing of the manuscript, or in the decision to publish the results.

References

  1. Chanwitheesuk, A.; Teerawutgulrag, A.; Rakariyatham, N. Screening of antioxidant activity and antioxidant compounds of some edible plants of Thailand. Food Chem. 2005, 92, 491–497. [Google Scholar] [CrossRef]
  2. Kasiotis, K.M.; Pratsinis, H.; Kletsas, D.; Haroutounian, S.A. Resveratrol and related stilbenes: Their anti-aging and anti-angiogenic properties. Food Chem. Toxicol. 2013, 61, 112–120. [Google Scholar] [CrossRef] [PubMed]
  3. Lu, J.J.; Bao, J.L.; Wu, G.S.; Xu, W.S.; Huang, M.Q.; Chen, X.P.; Wang, Y.T. Quinones derived from plant secondary metabolites as anti-cancer agents. Anticancer Agents Med. Chem. 2013, 13, 456–463. [Google Scholar]
  4. Suh, D.H.; Lee, H.W.; Jung, E.S.; Singh, D.; Kim, S.H.; Lee, C.H. In vivo metabolomic interpretation of the anti-obesity effects of hyacinth bean (Dolichos lablab L.) administration in high-fat diet mice. Mol. Nutr. Food Res. 2017, 61, 1–9. [Google Scholar] [CrossRef] [PubMed]
  5. Tagboto, S.; Townson, S. Antiparasitic properties of medicinal plants and other naturally occurring products. Adv. Parasitol. 2001, 50, 199–295. [Google Scholar] [PubMed]
  6. Han, J.S.; Lee, S.; Kim, H.Y.; Lee, C.H. MS-based metabolite profiling of aboveground and root components of Zingiber mioga and Officinale. Molecules 2015, 20, 16170–16185. [Google Scholar] [CrossRef]
  7. Kim, N.K.; Park, H.M.; Lee, J.; Ku, K.; Lee, C.H. Seasonal variations of metabolome and tyrosinase inhibitory activity of Lespedeza maximowiczii during growth periods. J. Agric. Food Chem. 2015, 63, 8631–8639. [Google Scholar] [CrossRef]
  8. Cuyckens, F.; Claeys, M. Mass spectrometry in the structural analysis of flavonoids. J. Mass Spectrom. 2004, 39, 1–15. [Google Scholar] [CrossRef] [PubMed]
  9. Yang, Z.; Yang, W.; Peng, Q.; He, Q.; Feng, Y.; Luo, S.; Yu, Z. Volatile phytochemical composition of rhizome of ginger after extraction by headspace solid-phase microextraction, petroleum ether extraction and steam distillation extraction. BDPS 2009, 4, 136–143. [Google Scholar]
  10. He, X.G.; Lin, L.Z.; Lian, L.Z. Electrospray High Performance Liquid Chromatography-Mass Spectrometry in Phytochemical Analysis of Kava (Piper methysticum) Extract. Planta Med. 1997, 63, 70–74. [Google Scholar] [CrossRef]
  11. Lee, S.; Oh, D.G.; Lee, S.; Kim, G.R.; Lee, J.S.; Son, Y.K.; Bae, C.H.; Yeo, J.; Lee, C.H. Chemotaxonomic metabolite profiling of 62 indigenous plant species and its correlation with bioactivities. Molecules 2015, 20, 19719–19734. [Google Scholar] [CrossRef] [PubMed]
  12. Son, S.Y.; Kim, N.K.; Lee, S.; Singh, D.; Kim, G.R.; Lee, J.S.; Yang, H.S.; Yeo, J.; Lee, S.; Lee, C.H. Metabolite fingerprinting, pathway analyses, and bioactivity correlations for plant species belonging to the Cornaceae, Fabaceae, and Rosaceae families. Plant Cell Rep. 2016, 35, 1917–1931. [Google Scholar] [CrossRef] [PubMed]
  13. He, X.G.; Lian, L.Z.; Lin, L.Z.; Bernart, M.W. High-performance liquid chromatography-electrospray mass spectrometry in phytochemical analysis of sour orange (Citrus aurantium L.). J. Chromatogr. A 1997, 791, 127–134. [Google Scholar] [CrossRef]
  14. Torre-Carbot, K.D.L.; Jauregui, O.; Gimeno, E.; Castellote, A.I.; Lamuela-Raventos, R.M.; Lopez-Sabater, M.C. Characterization and quantification of phenolic compounds in olive oils by solid-phase extraction, HPLC-DAD, and HPLC-MS/MS. J. Agric. Food Chem. 2005, 53, 4331–4340. [Google Scholar] [CrossRef] [PubMed]
  15. Kongstad, K.T.; Ozdemir, C.; Barzak, A.; Wubshet, S.G.; Staerk, D. Combined use of high-resolution α-glucosidase inhibition profiling and high-performance liquid chromatography-high-resolution mass spectrometry-solid-phase extraction-nuclear magnetic resonance spectroscopy for investigation of antidiabetic principles in crude plant extracts. J. Agric. Food Chem. 2015, 63, 2257–2263. [Google Scholar]
  16. Qureshi, R.A.; Ghufran, M.A.; Gilani, S.A.; Yousaf, Z.; Abbas, G.; Batool, A. Indigenous medicinal plants used by local women in southern Himalayan regions of Pakistan. Pak. J. Bot. 2009, 41, 19–25. [Google Scholar]
  17. Mariod, A.A.; Mohammed, N.M.F.; Nabag, F.O.; Hassan, A.A. Ethnobotanical study of three trees: Indigenous knowledge on trees used as cosmetic in Khartoum state, Sudan. AJPS 2014, 4, 178–182. [Google Scholar]
  18. Christenhusz, M.J.M.; Byng, J.W. The number of known plants species in the world and its annual increase. Phytotaxa 2016, 261, 201–217. [Google Scholar] [CrossRef] [Green Version]
  19. Rastogi, S.; Pandey, M.M.; Rawat, A.K.S. Medicinal plants of the genus Betula-Traditional uses and a phytochemical-pharmacological review. J. Ethnopharmacol. 2015, 159, 62–83. [Google Scholar] [CrossRef]
  20. Ludwiczuk, A.; Saha, A.; Kuzuhara, T.; Asakawa, Y. Bioactivity guided isolation of anticancer constituents from leaves of Alnus sieboldiana (Betulaceae). Phytomedicine 2011, 18, 491–498. [Google Scholar] [CrossRef]
  21. Eom, H.J.; Kang, H.R.; Kim, H.K.; Jung, E.B.; Park, H.B.; Kang, K.S.; Kim, K.H. Bioactivity-guided isolation of antioxidant triterpenoids from Betula platyphylla var. japonica bark. Bioorg. Chem. 2016, 66, 97–101. [Google Scholar] [CrossRef] [PubMed]
  22. Yu, Y.B.; Miyashiro, H.; Nakamura, N.; Hattori, M.; Park, J.C. Effects of triterpenoids and flavonoids isolated from Alnus firma on HIV-1 viral enzymes. Arch. Pharm. Res. 2006, 30, 820–826. [Google Scholar] [CrossRef]
  23. Sati, S.C.; Sati, N.; Sati, O.P. Bioactive constituents and medicinal importance of genus Alnus. Pharmacogn. Rev. 2011, 5, 174–183. [Google Scholar] [CrossRef] [PubMed]
  24. Lee, J.; Jung, Y.; Shin, J.H.; Kim, H.K.; Moon, B.C.; Ryu, D.H.; Hwang, G.S. Secondary metabolite profiling of Curcuma species grown at different locations using GC/TOF and UPLC/Q-TOF MS. Molecules 2014, 19, 9535–9551. [Google Scholar] [CrossRef] [PubMed]
  25. Chen, Z.D.; Manchester, S.R.; Sun, H.Y. Phylogeny and evolution of the Betulaceae as inferred from DNA sequences, morphology, and paleobotany. Am. Bot. 1999, 86, 1168–1181. [Google Scholar] [CrossRef]
  26. Yoo, K.O.; Wen, J. Phylogeny and biogeography of Carpinus and subfamily Coryloideae (Betulaceae). Int. J. Plant Sci. 2002, 163, 641–650. [Google Scholar] [CrossRef]
  27. del Rio, L.A. ROS and RNS in plant physiology: An overview. J. Exp. Bot. 2015, 66, 2827–2837. [Google Scholar] [CrossRef] [PubMed]
  28. Roselló-Soto, E.; Galanakis, C.M.; Brnčić, M.; Orlien, V.; Trujillo, F.J.; Mawson, R.; Knoerzer, K.; Tiwari, B.K.; Barba, F.J. Clean recovery of antioxidant compounds from plant foods, by-products and algae assisted by ultrasounds processing. Modeling approaches to optimize processing conditions. Trends Food Sci. Tech. 2015, 42, 134–149. [Google Scholar] [CrossRef]
  29. Romanik, G.; Gilgenast, E.; Przyjazny, A.; Kaminski, M. Techniques of preparing plant material for chromatographic separation and analysis. J. Biochem. Biophys. Methods 2007, 70, 253–261. [Google Scholar] [CrossRef] [PubMed]
  30. Leopoldini, M.; Marino, T.; Russo, M.; Toscano, M. Antioxidant properties of phenolic compounds: H-atom versus electron transfer mechanism. J. Phys. Chem. 2004, 108, 4916–4922. [Google Scholar] [CrossRef]
  31. Badhani, B.; Sharma, N.; Kakkar, R. Gallic acid: A versatile antioxidant with promising therapeutic and industrial applications. RSC Adv. 2015, 5, 27540–27557. [Google Scholar] [CrossRef]
  32. Stojanovic, S.; Brede, O. Elementary reactions of the antioxidant actions of trans-stilbene derivatives: Resveratrol, pinosylvin and 4-hydroxystilbene. Phys. Chem. Chem. Phys. 2002, 4, 757–764. [Google Scholar] [CrossRef]
  33. Kuroyanagi, M.; Shimomae, M.; Nagashima, Y.; Muto, N.; Okuda, T.; Kawahara, N.; Nakane, T.; Sano, T. New diarylheptanoids from Alnus japonica and their antioxidative activity. Chem. Pharm. Bull. 2005, 53, 1519–1523. [Google Scholar] [CrossRef] [PubMed]
  34. Biskup, I.; Golonka, I.; Gamian, A.; Sroka, Z. Antioxidant activity of selected phenols estimated by ABTS and FRAP methods. Postepy Hig. Med. Dosw. 2013, 67, 958–963. [Google Scholar] [CrossRef] [PubMed]
  35. Moon, J.H.; Tsushida, T.; Nakahara, K.; Terao, J. Identification of quercetin 3-O-β-d-glucuronide as an antioxidative metabolite in rat plasma after oral administration of quercetin. Free Radic. Biol. Med. 2001, 30, 1274–1285. [Google Scholar] [CrossRef]
  36. Kalaivani, T.; Rajasekaran, C.; Mathew, L. Free radical scavenging, cytotoxic, and hemolytic activities of an active antioxidant compound ethyl gallate from leaves of Acacia nilotica (L.) wild. Ex. Delile subsp. Indica (Benth.) Brenan. J. Food Sci. 2011, 76, 144–149. [Google Scholar] [CrossRef] [PubMed]
  37. Zhang, L.; Zuo, Z.; Lin, G. Intestinal and hepatic glucuronidation of flavonoids. Mol. Pharm. 2007, 4, 833–845. [Google Scholar] [CrossRef] [PubMed]
  38. Re, R.; Pellegrini, N.; Proteggente, A.; Pannala, A.; Yang, M.; Rice-Evans, C. Antioxidant activity applying an improved ABTS radical cation decolorization assay. Free Radic. Biol. Med. 1999, 26, 1231–1237. [Google Scholar] [CrossRef]
Figure 1. (A) Principal component analysis (PCA) score plot, (B) Hierarchical cluster analysis (HCA) dendrogram derived from the partial least squares discriminant analysis (PLS-DA) result, derived from positive mode data set of ultrahigh-performance liquid chromatography linear trap quadrupole-ion trap- mass spectrometry/mass spectrometry (UHPLC-LTQ-IT-MS/MS) of Betulaceae family plant extracts. (C) Antioxidant activities of 10 Betulaceae family plant extracts. Red color represents species belonging to the genus Alnus (1: Alnus firma, 2: Alnus hirsuta, and 3: Alnus japonica). Blue color represents species belonging to the genus Betula (4: Betula schmidtii, 5: Betula dahurica, and 6: Betula pendula). Green color represents species belonging to the genus Carpinus (7: Carpinus cordata, 8: Carpinus turczaninowii, and 9: Carpinus laxiflora). Purple color represents species belonging to the genus Corylus (10: Corylus heterophylla). The small letter on the bar graphs (a, b, c, d, and e) indicates significant differences from other values.
Metabolites 09 00186 g001
Figure 2. Assessment of protective ability against H2O2-induced Human Dermal Fibroblasts (HDF) cell damage by A. firma ethanol extract (AFEE). (A) Effect of AFEE on the viability of HDF cells. Cells incubated with different concentrations of AFEE for 24 h. Cell viability was measured by XTT assay. (B) Effect of AFEE on hydrogen peroxide-induced death of HDF cells. Con, negative control; AsA, ascorbic acid as positive control.
Metabolites 09 00186 g002
Figure 3. Bioassays for SPE MeOH eluates. (A) The ABTS radical scavenging activities. (B) Protective effects against H2O2-induced damage in HDF cells. The observed values were statistically tested using one-way analysis of variance (ANOVA). a Trolox equivalent antioxidant activity. The same letters (a, b, c, d, e) indicate values that are not significantly different by Duncan’s test.
Metabolites 09 00186 g003
Figure 4. Multivariate analyses of the five SPE MeOH extracts of AFEE. (A) PCA score plot (R2X (0.812) and Q2 (0.698)) derived from the negative mode dataset of UHPLC-LTQ-IT-MS/MS. (B) PLS-DA score plot (R2X (0.825), R2Y (0.995), and Q2 (0.981)) derived from the negative mode dataset of UHPLC-LTQ-IT-MS/MS. Extracted by ● 20% MeOH, ■ 40% MeOH, ♦ 60% MeOH, ▲ 80% MeOH, and ▼ 100% MeOH. (C) The discriminant metabolites (red triangle) for 40% MeOH E are indicated in the loading plot, which were derived from the PLS-DA results. The numbers shown in the loading plot are as per Table 1.
Metabolites 09 00186 g004
Figure 5. UHPLC-Q-Orbitrap-MS chromatograms. (A) 15-min and (C) 31-min, fractions. The ion-extracted chromatograms of identified metabolites of: (B) 15-min and (D) 31-min fractions, with structures of the putatively identified compounds.
Metabolites 09 00186 g005
Figure 6. Effect of (A) ethyl gallate and (C) quercetin-3-O-glucuronide on HDF cell viability. Cells were incubated with different concentrations of ethyl gallate or quercetin-3-O-glucuronide for 24 h. Cell viability was measured using the XTT assay. Effect of (B) ethyl gallate and (D) quercetin-3-O-glucuronide on hydrogen peroxide-induced cell death in HDF cells. Con, negative control; NAC, n-acetylamine was used as the positive control.
Metabolites 09 00186 g006
Table 1. Tentatively identified metabolites in a 40% MeOH SPE eluate (40% MeOH E) based on metabolite profiling and multivariate statistical analysis.
No. aPutative Identification bUHPLC-LTQ-IT-MS/MS
RT c (min)m/z Nega dm/z Posi eM.W. fMSn Fragment PatternUV(nm)
1Ethyl gallate6.72197199198159 [posi] g217
2Myricetin-3-O-galactoside7.04479481480319 [posi]215,357
3N.I. 17.24343345344269247
5Myricetin-3-O-pentoside7.44449451450319 [posi]218,355
6Quercetin-3-O-glucoside7.57463465464301 > 179, 151207,255
8N.I. 27.72413415414311-
9Quercetin-3-O-glucuronide7.73477479478301-
11Hirsutoside8.02491493492311-
13N.I. 38.03537----
14Luteolin-7-O-glucuronide8.22461463462285, 267-
16Pinosylvin diglucoside8.27581[M+FA]537536375 > 213 [posi]214,274
19N.I. 68.47325[M+FA]303[M + Na]+280113-
21N.I. 78.74327329328--
22Platyphyllonol8.79313315314297 [posi]205,366
a Number is based on the Table S2. b Putative metabolites based on VIP > 0.7 and p-value < 0.05. c Retention time. d Ion detected in negative mode. e Ion detected in positive mode. f Molecular weight. g MSn fragment patterns detected in positive mode. N.I: Non-identified metabolite.
Table 2. Tentatively identified metabolites from 15-min and 31-min prep-HPLC sub-fractions of the 40% MeOH SPE eluate.
FractionsNo aPutative IdentificationUHPLC-LTQ-IT-MS/MSUHPLC-Q-Orbitrap-MS ID h
RT b (min)m/z Nega cm/z Posi dM.W. eMSn Fragment PatternUV (nm)RT (min)m/z NegaM.F.b gΔppm
15 min1Ethyl gallate6.59 197199198159 [posi] f2175.10197.0449C9H10O52.2STD
2Myricetin-3-O-galactoside6.95 479481480319 [posi]215,3575.34479.0837C21H20O13–0.3STD
3N.I. 17.17 343345344269247-----
8N.I. 27.60 413415414311------
9Quercetin-3-O-glucuronide7.60 477479478301-5.87477.0685C21H18O13–0.2STD
31 min14Luteolin-7-O-glucuronide8.08 461463462285, 267-6.32461.0734C21H18O120.2STD
16Pinosylvin diglucoside8.13 581
[M+COOH]
537536375 > 213 [posi]214,2746.44581.1887C26H32O12–0.8CCD
21N.I. 78.61 327329328-------
22Platyphyllonol8.64 313315314297 [posi]205,3666.53313.1449C19H22O40.5CCD
49N.I. 178.36 447449448317------
50N.I. 188.53405407406303295-----
51Myricetin8.97317319318289-6.38317.0669C15H10O8–0.2STD
52N.I. 198.97287289288153 [posi]------
53N.I. 207.94542--466215,247,362-----
a Number is based on Table S2. Newly detected metabolites are numbered from 49 to 53. b Retention time. c Ion detected in negative mode. d Ion detected in positive mode. e Molecular weight. f MSn fragment patterns detected in positive mode. g Molecular formula. h Identification.
Table 3. Assessment of antioxidant activity of the proposed metabolites.
CompoundsEC50 (µg/mL)Regression CurveR2
Ethyl gallate (1)61.6y = –0.0048x + 0.67450.9872
Quercetin-3-O-glucuronoide (9)64.6y = −0.0048x + 0.67450.9872
Myricein-3-O-galactoside (2)144.9y = −0.0024x + 0.71200.9933
Quercetin-3-O-glucoside (6)176.1y = −0.0019x + 0.69580.9953
Luteolin-7-O-glucuronide (14)215.3y = −0.0016x + 0.69130.9959
Myricetin (51)221.3y = −0.0016x + 0.71540.9997
Table 4. Sample information of plants from the Betulaceae family used in the study.
No.FamilyGenusSpeciesCollection AreaCollection Date
1BetulaceaeAlnusfirmaSin-ri, Goryeong-eup, Goryeong-gun, Gyeongsangbuk-do2014-07-23
2BetulaceaeAlnushirsutaSangjung-ri, Geumgwang-myeon, Anseong-si, Gyeonggi-do2014-07-25
3BetulaceaeAlnusjaponicaYonggi-ri, Gibuk-myeon, Buk-gu, Pohang-si, Gyeongsangbuk-do2014-07-30
4BetulaceaeBetulaschmidtiiIcheon-ri, Sangbuk-myeon, Ulju-gun, Ulsan2014-08-01
5BetulaceaeBetuladahuricaUngyo-ri, Bangnim-myeon, Pyeongchang-gun, Gangwon-do2014-08-08
6BetulaceaeBetulapendulaSogye-ri, Hwanggan-myeon, Yeongdong-gun, Chungcheongbuk-do2014-08-14
7BetulaceaeCarpinuscordataApgok-ri, Bongsan-myeon, Hapcheon-gun, Gyeongsangnam-do2014-07-24
8BetulaceaeCarpinusturczaninowiiJiro-ri, Byeongyeong-myeon, Gangjin-gun, Jeollanam-do2014-08-12
9BetulaceaeCarpinuslaxifloraSeonheul-ri, Jocheon-eup, Jeju-si, Jeju special self-governing province2014-08-24
10BetulaceaeCorylusheterophyllaApgok-ri, Bongsan-myeon, Hapcheon-gun, Gyeongsangnam-do2014-07-24

