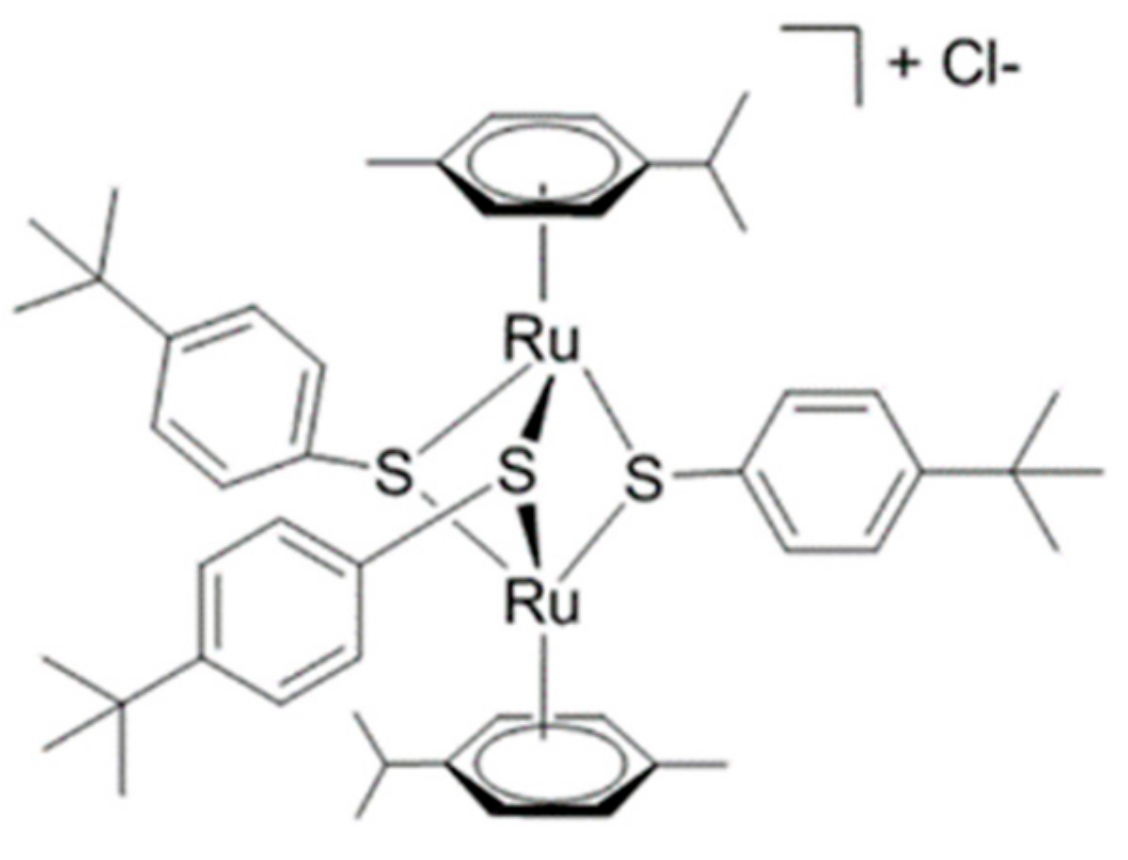
1H HR-MAS NMR-Based Metabolomics of Cancer Cells in Response to Treatment with the Diruthenium Trithiolato Complex [(p-MeC6H4iPr)2Ru2(SC6H4-p-But)3]+ (DiRu-1)


Abstract
1. Introduction
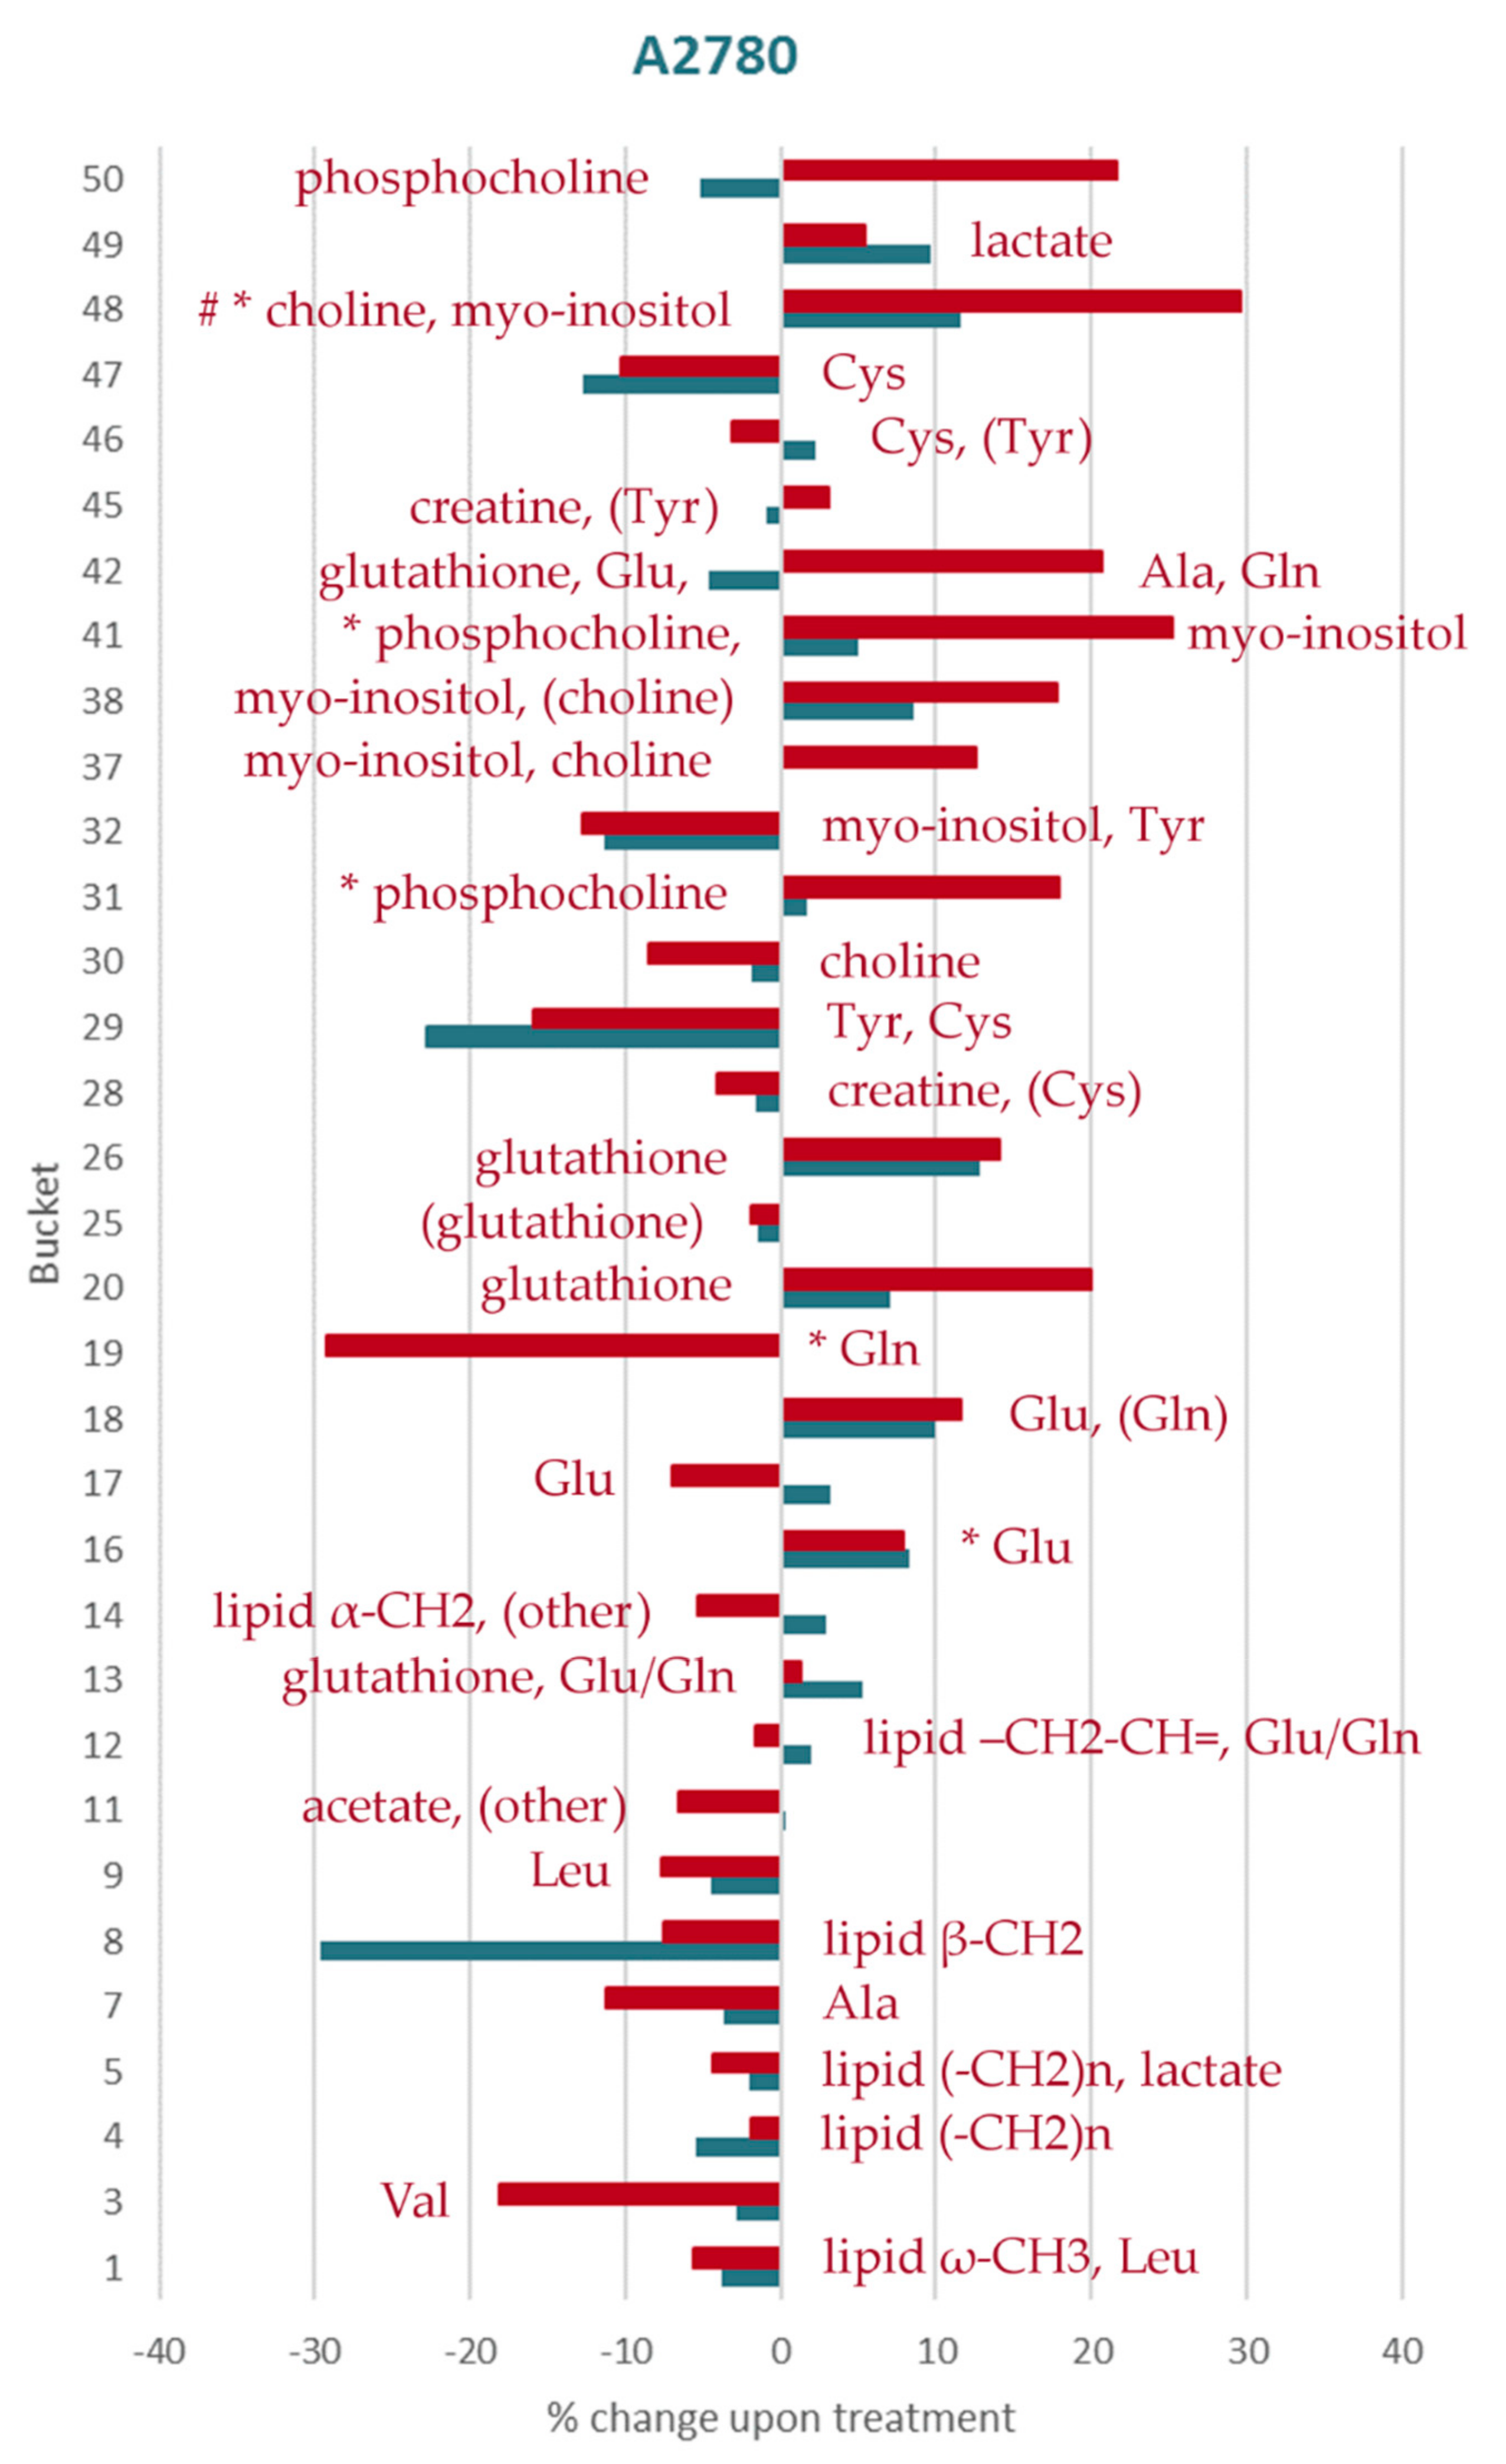
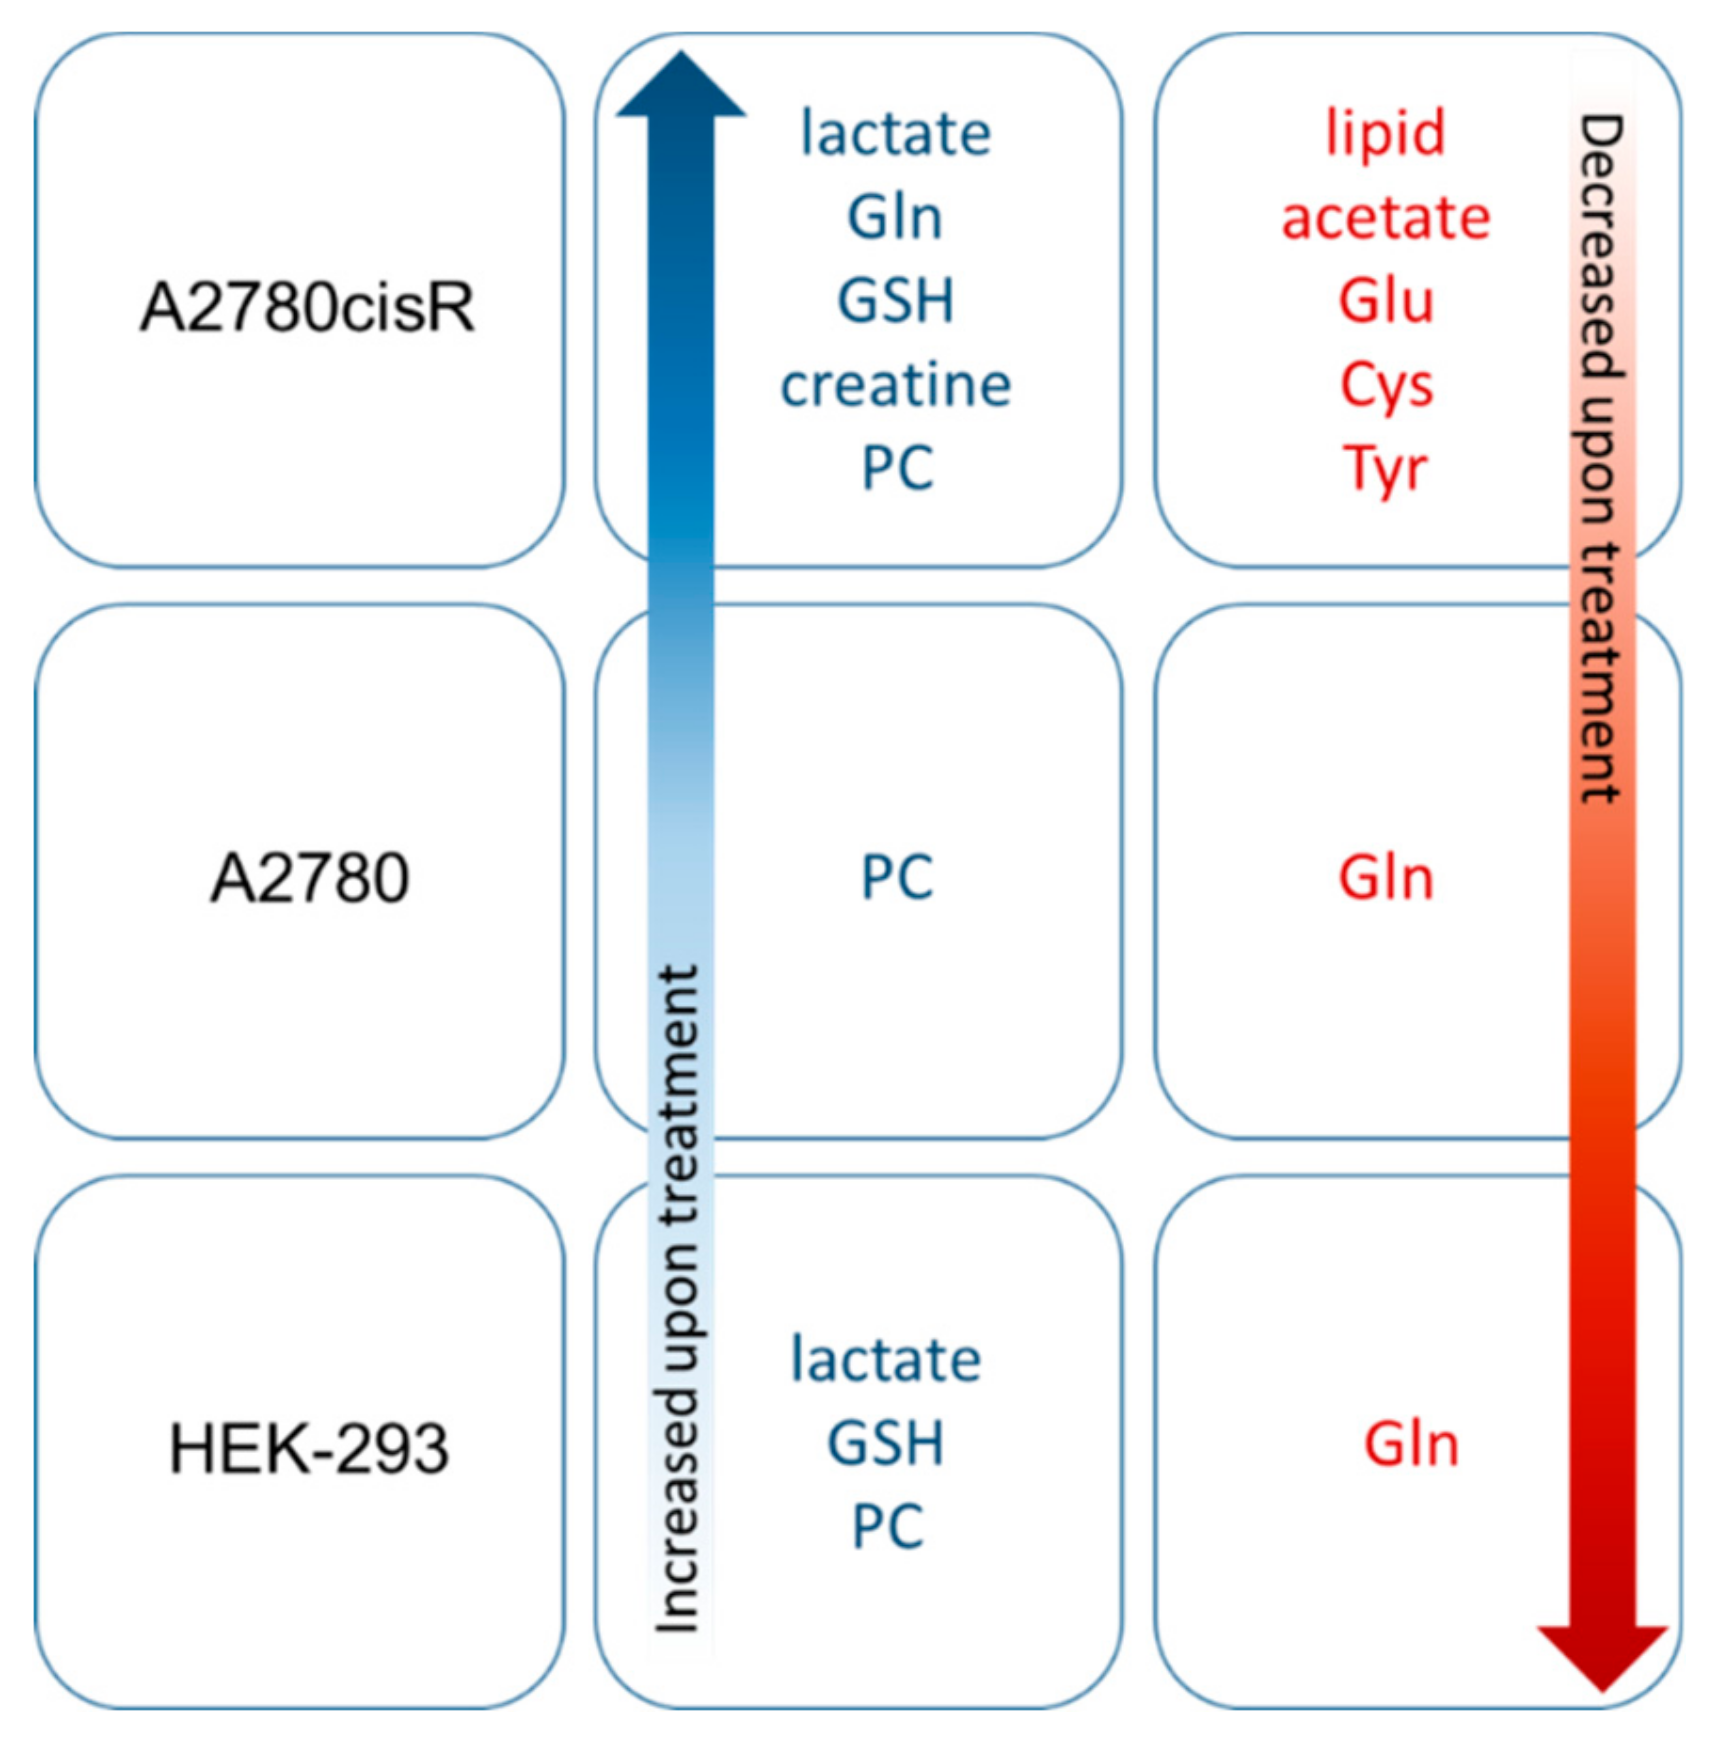
2. Results
2.1. Lipid Metabolism
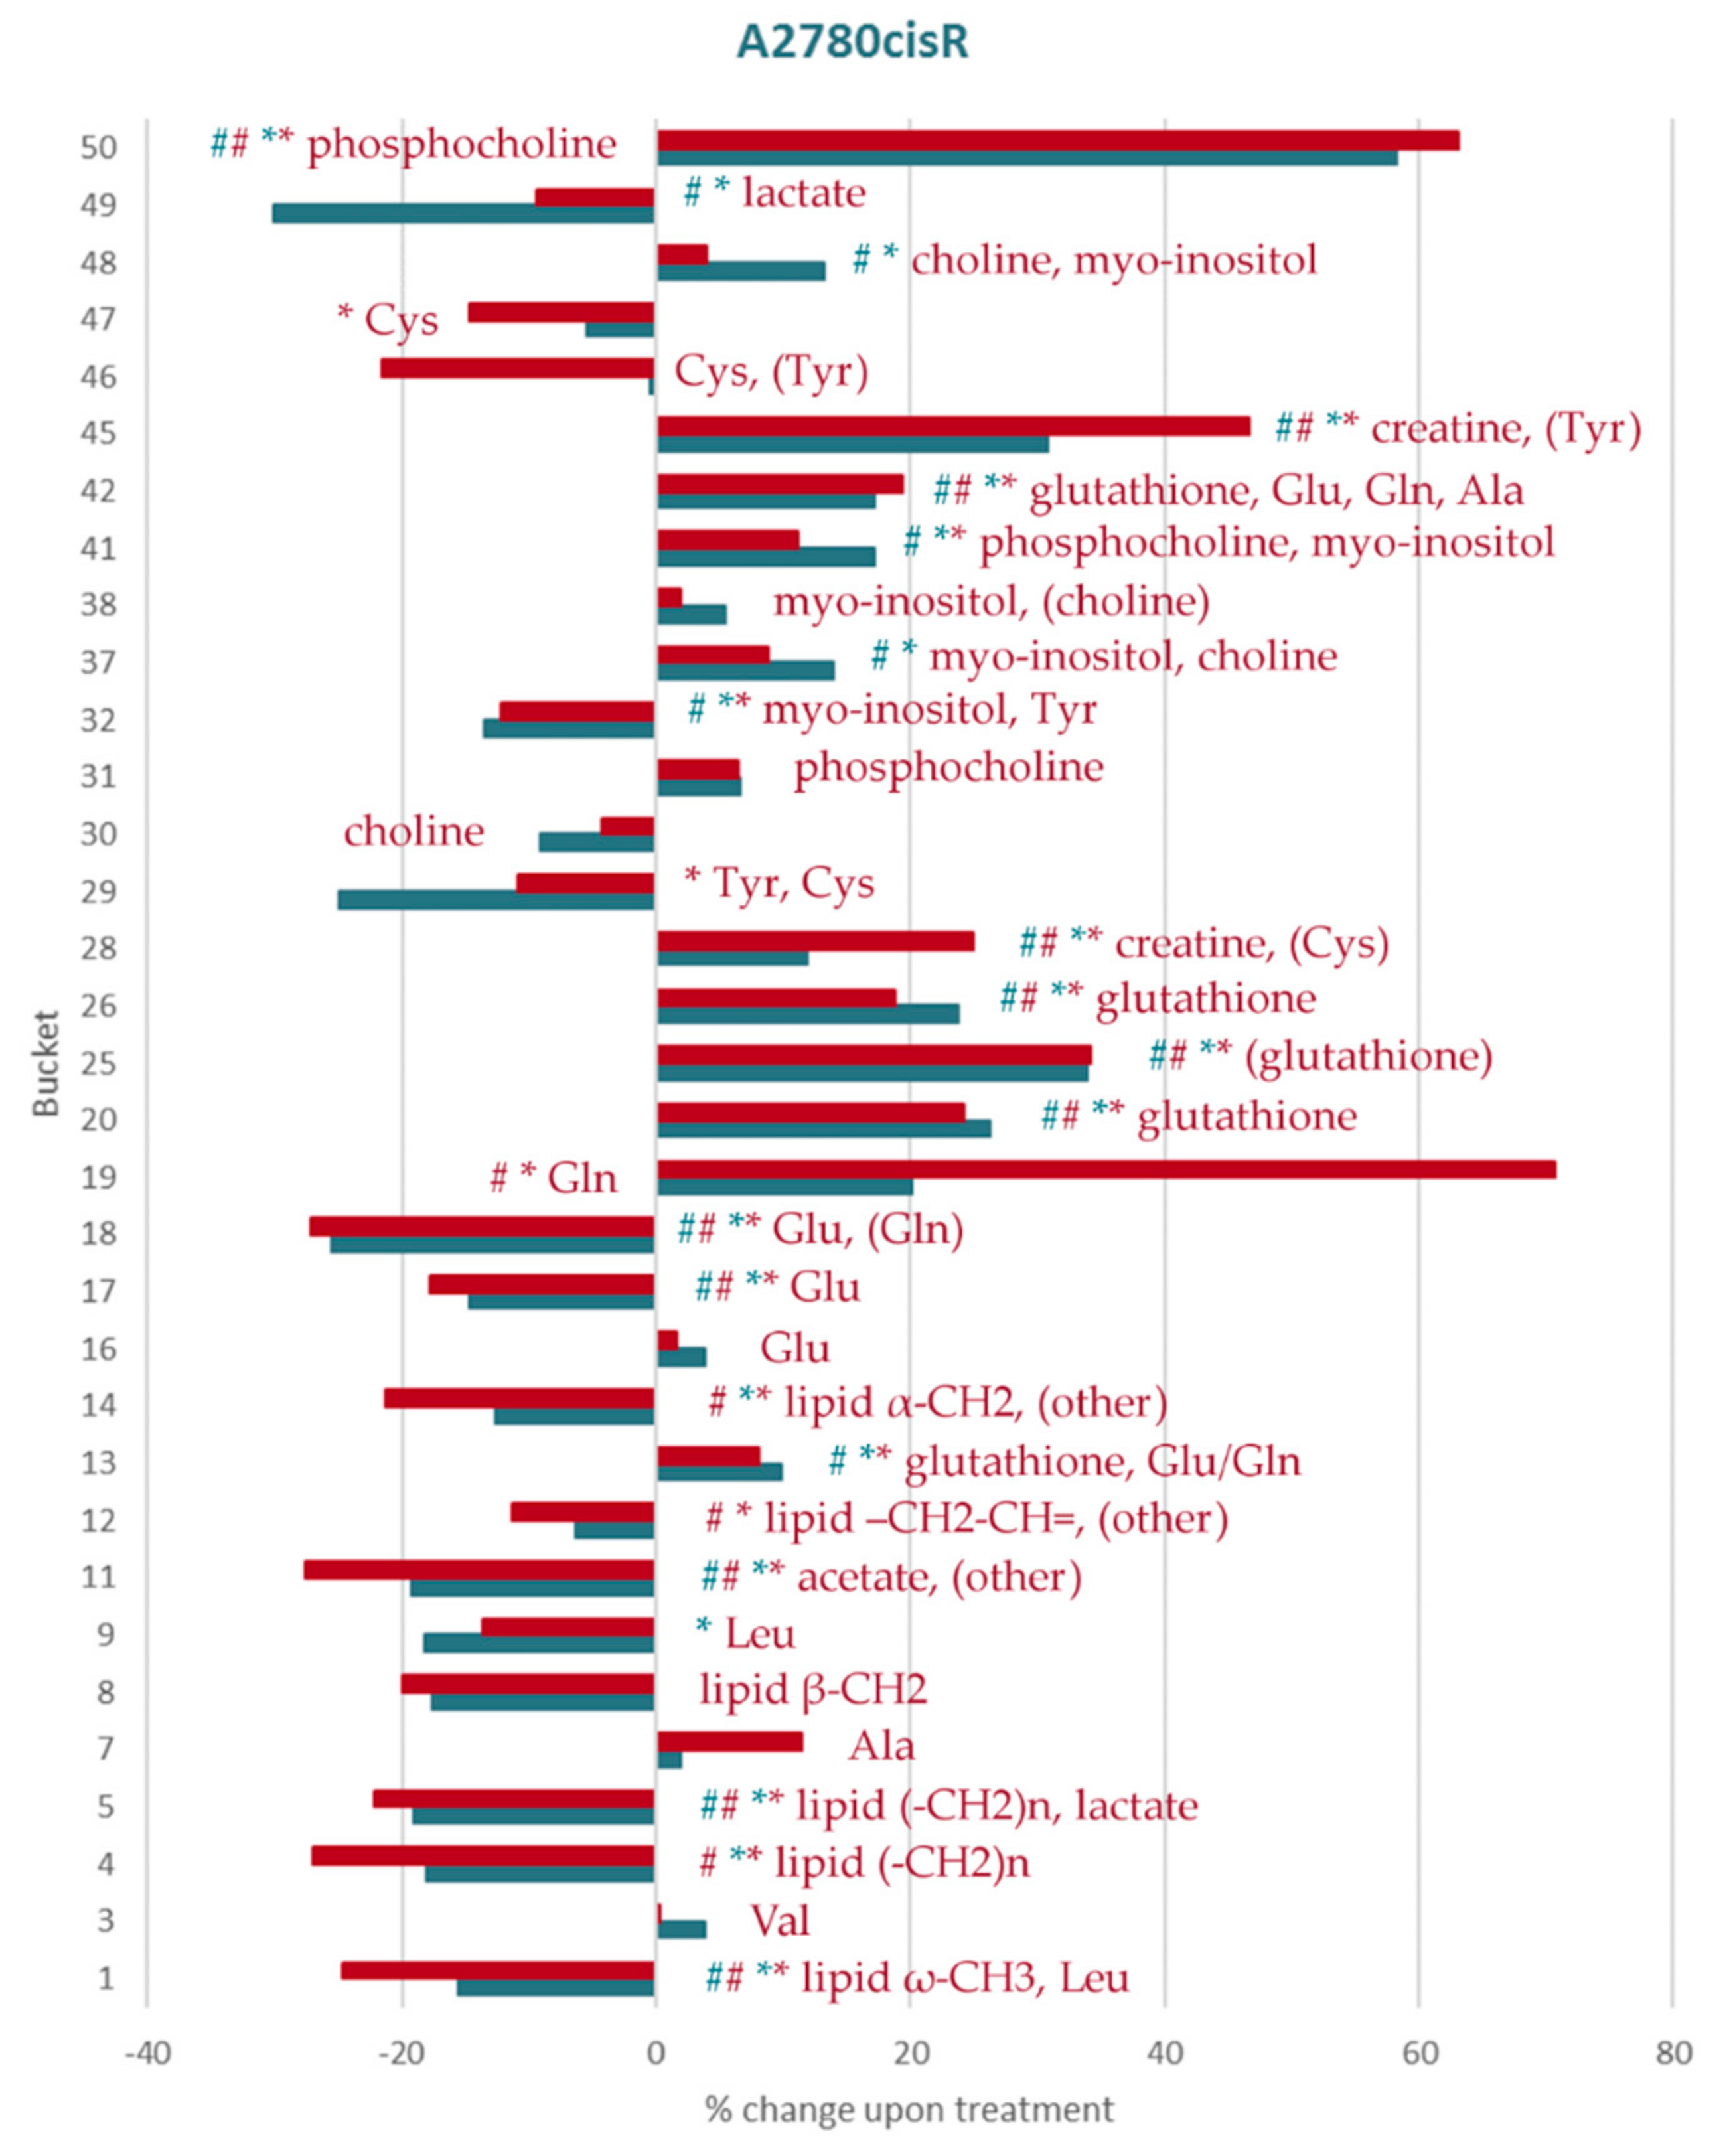
2.2. Amino Acid and GSH Metabolism
2.3. Sugar-Containing Compounds
2.4. Other Metabolites
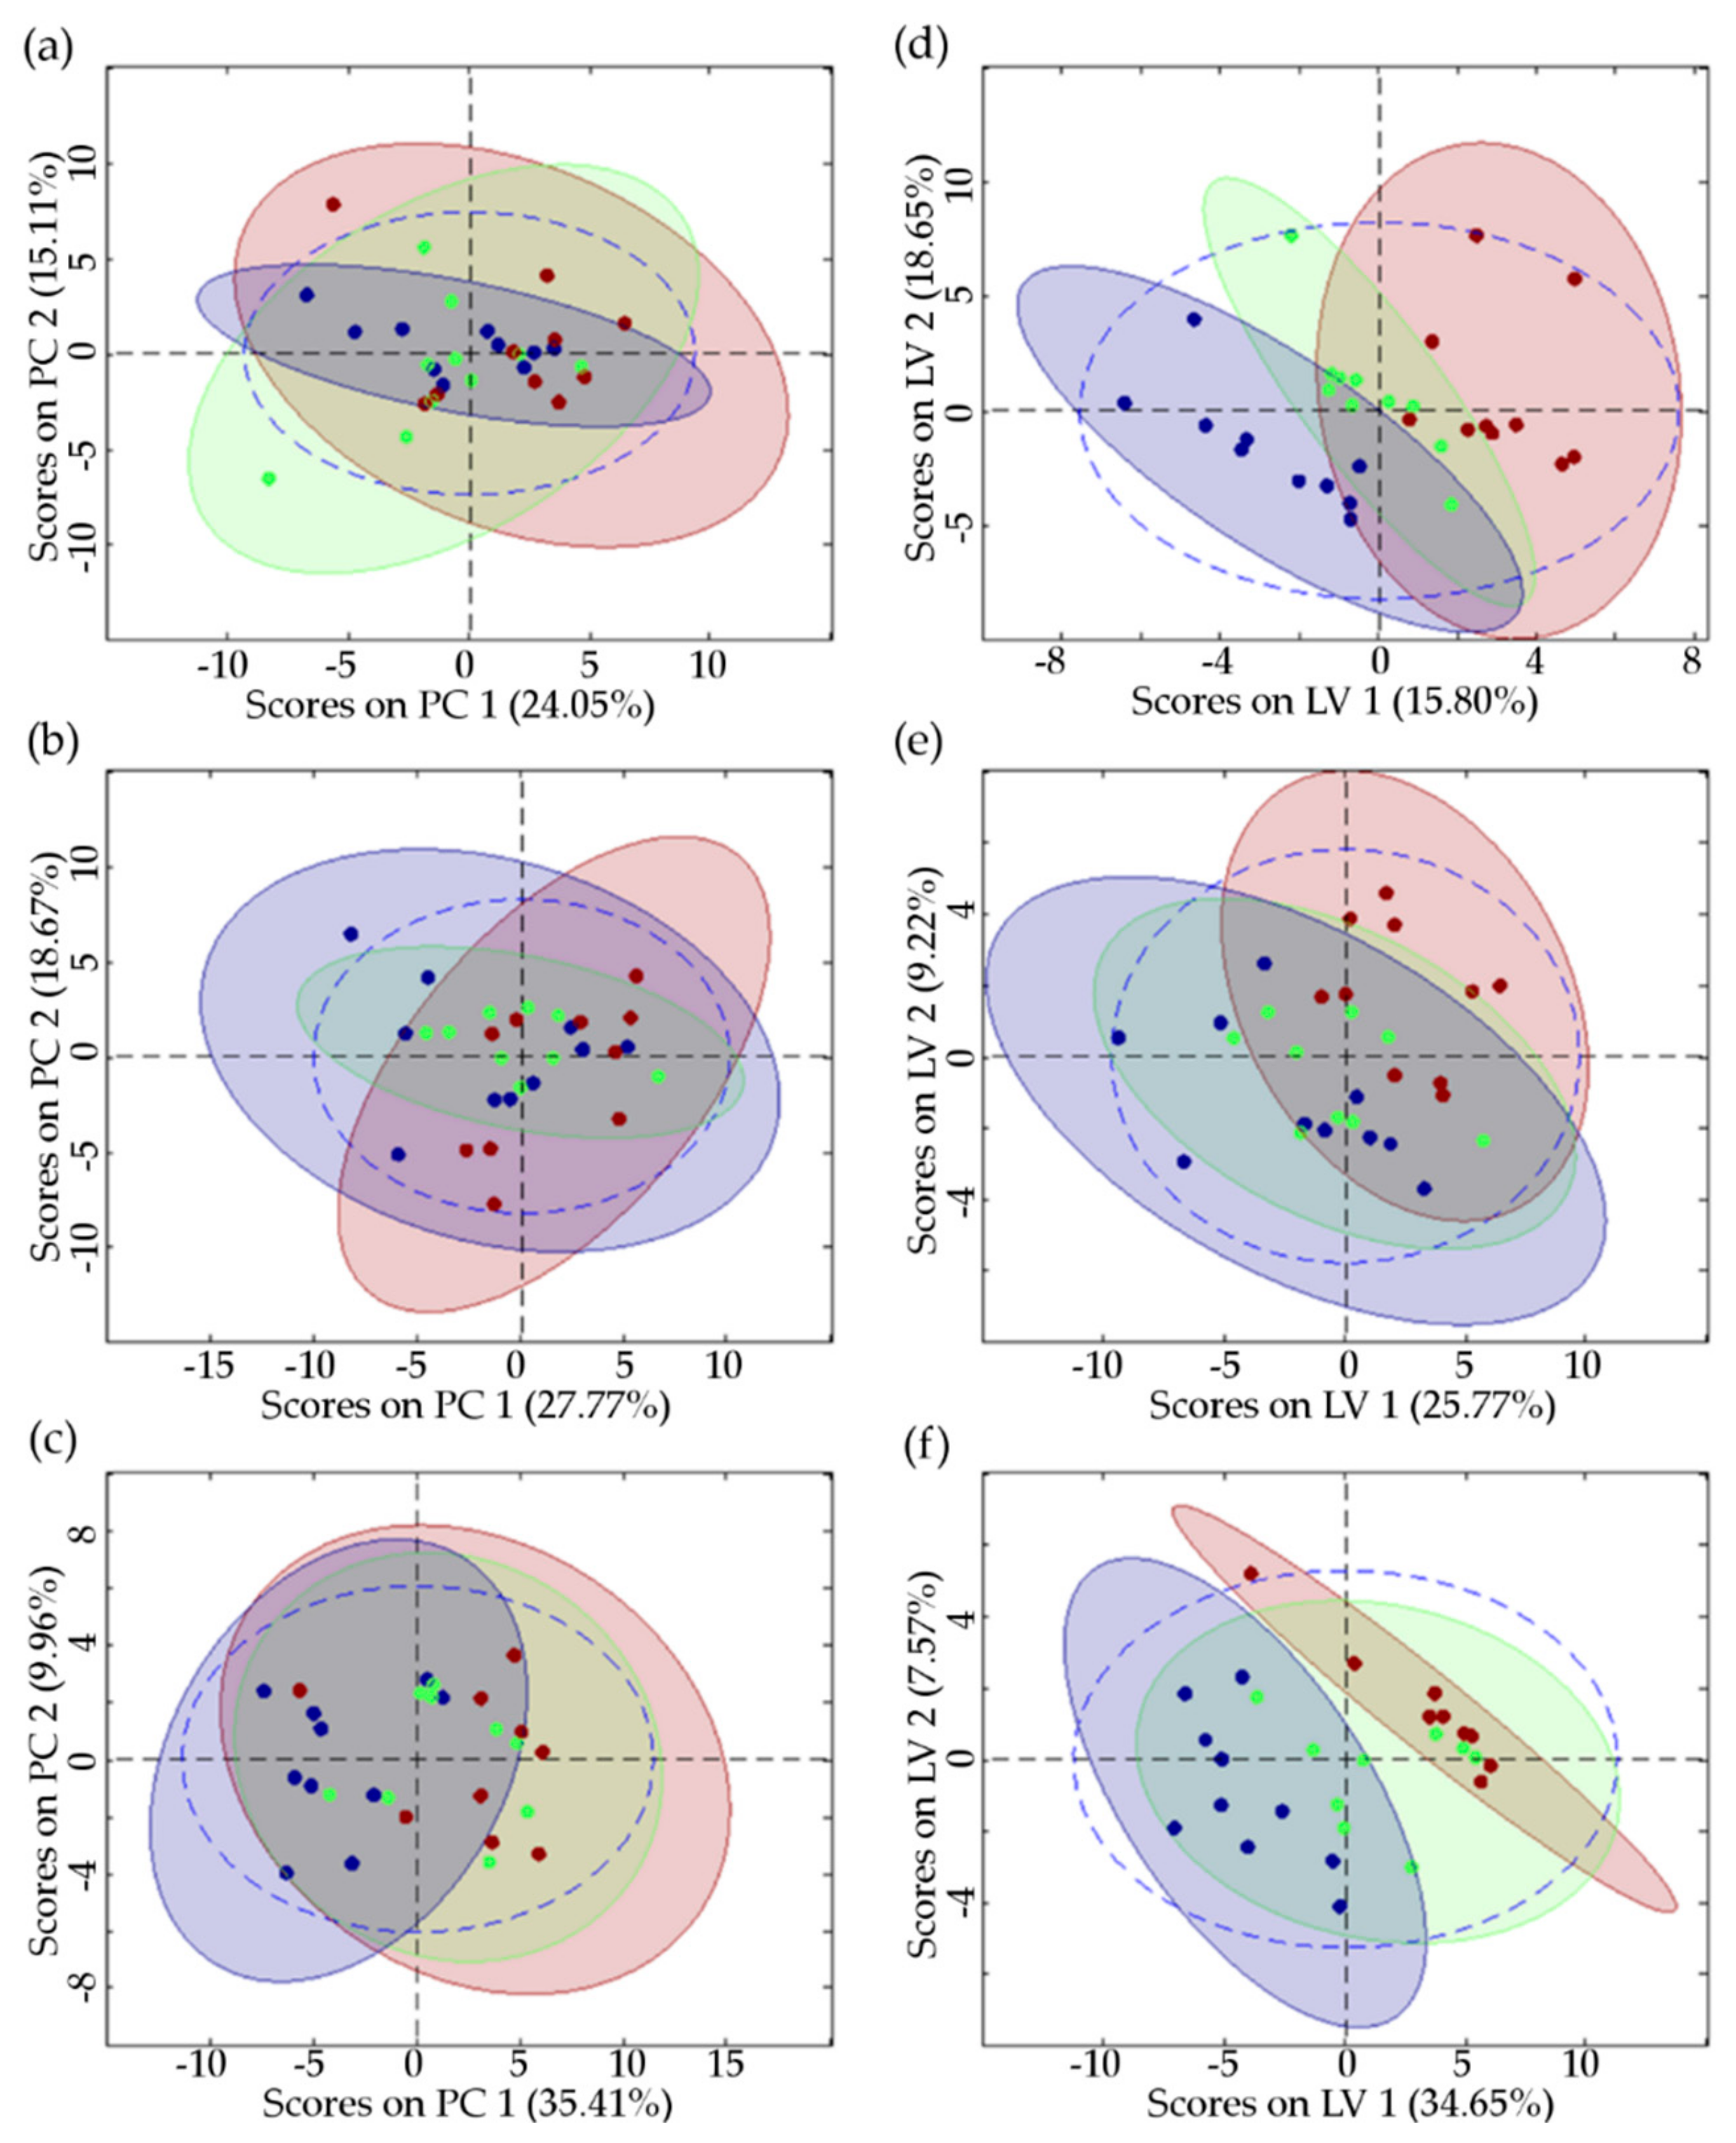
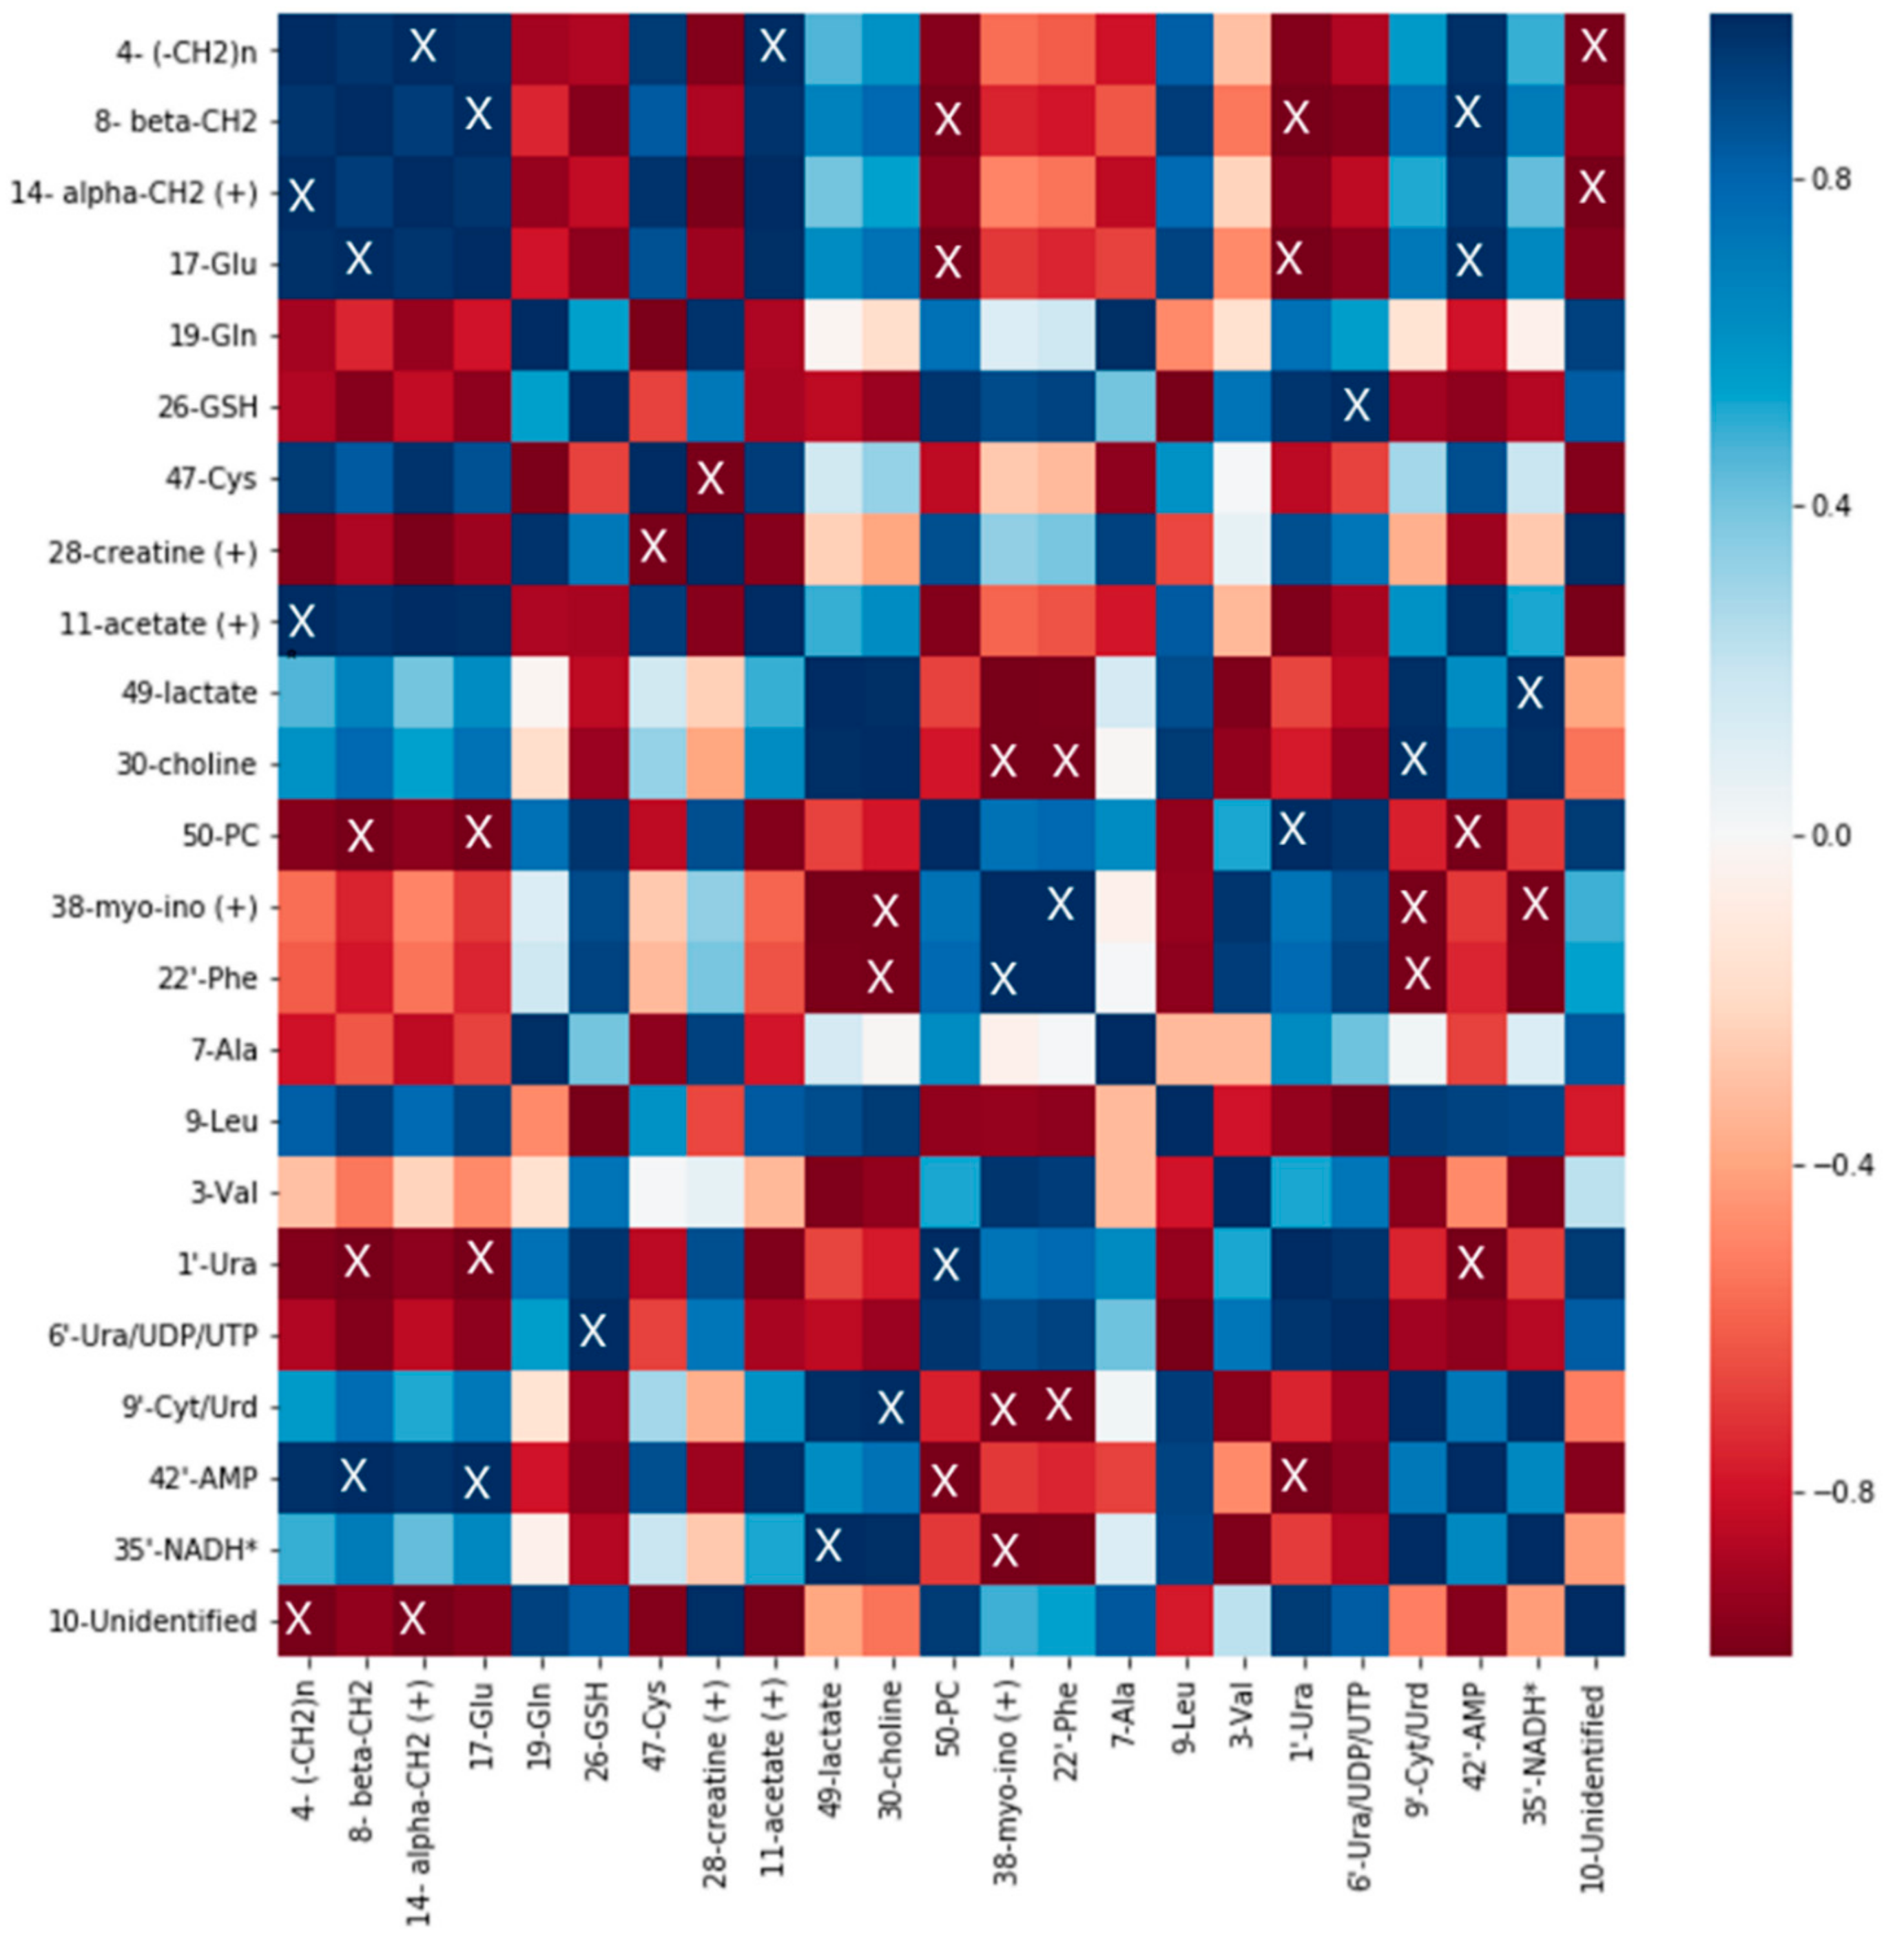
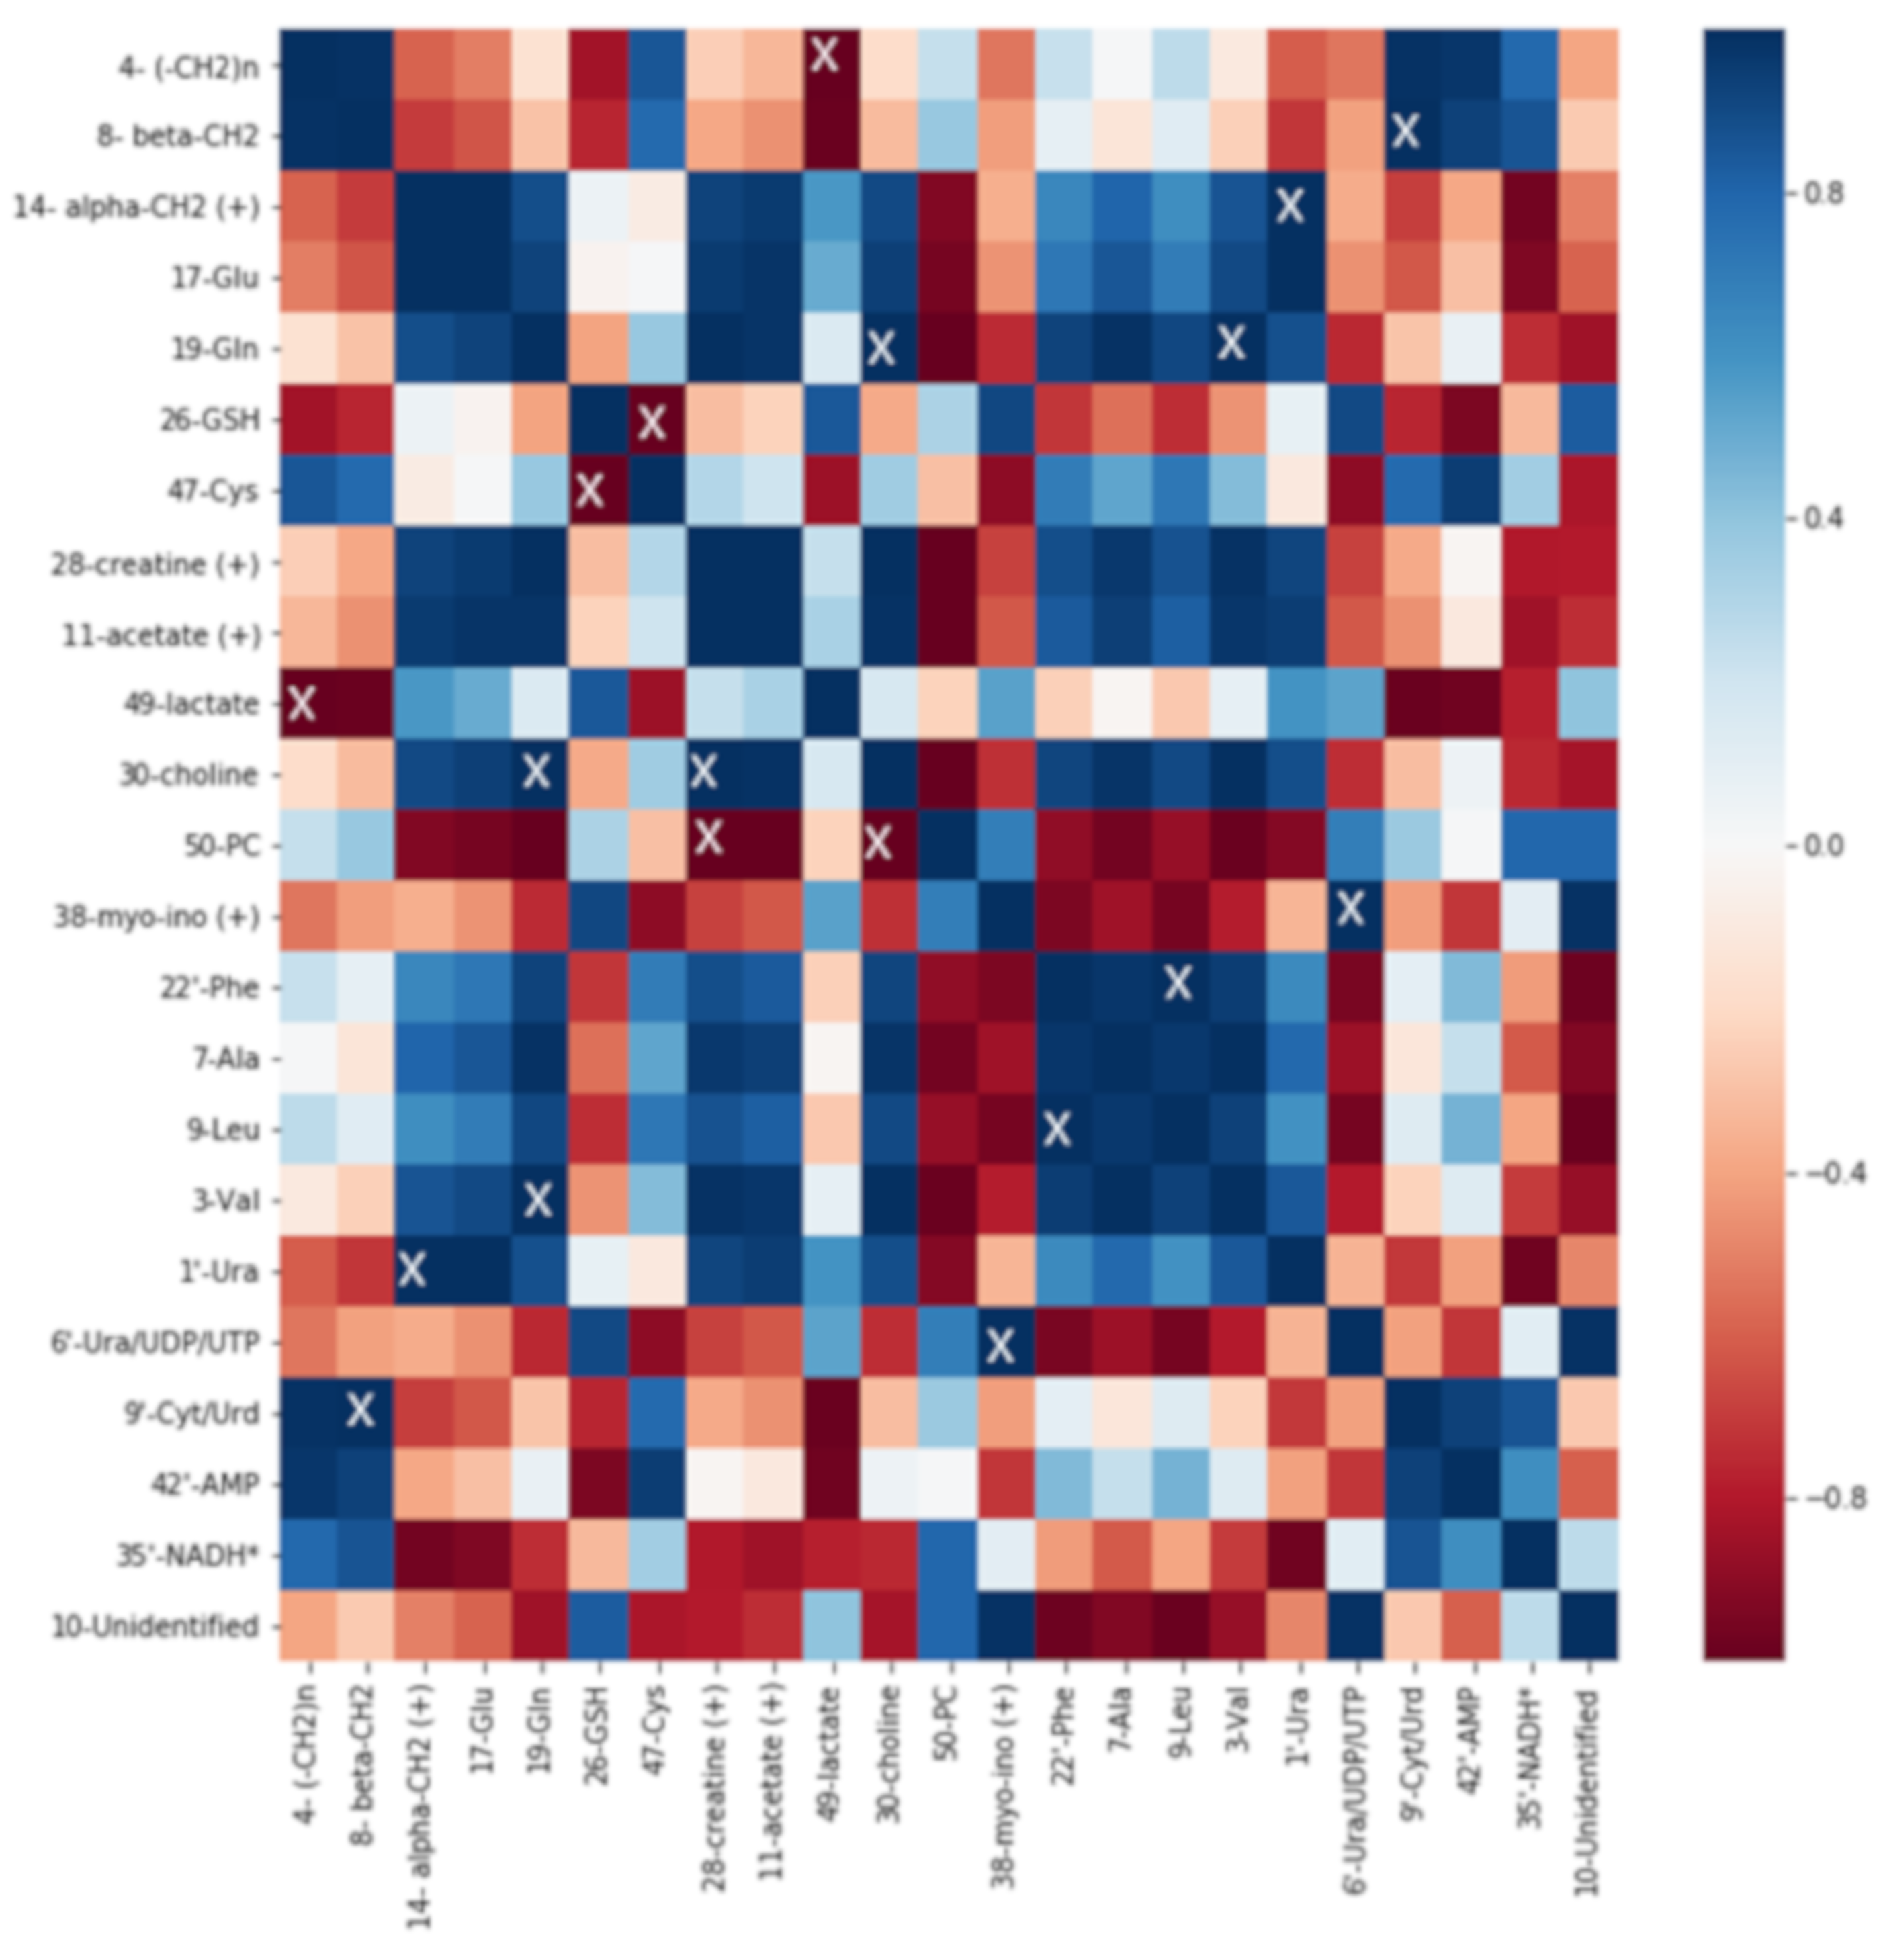
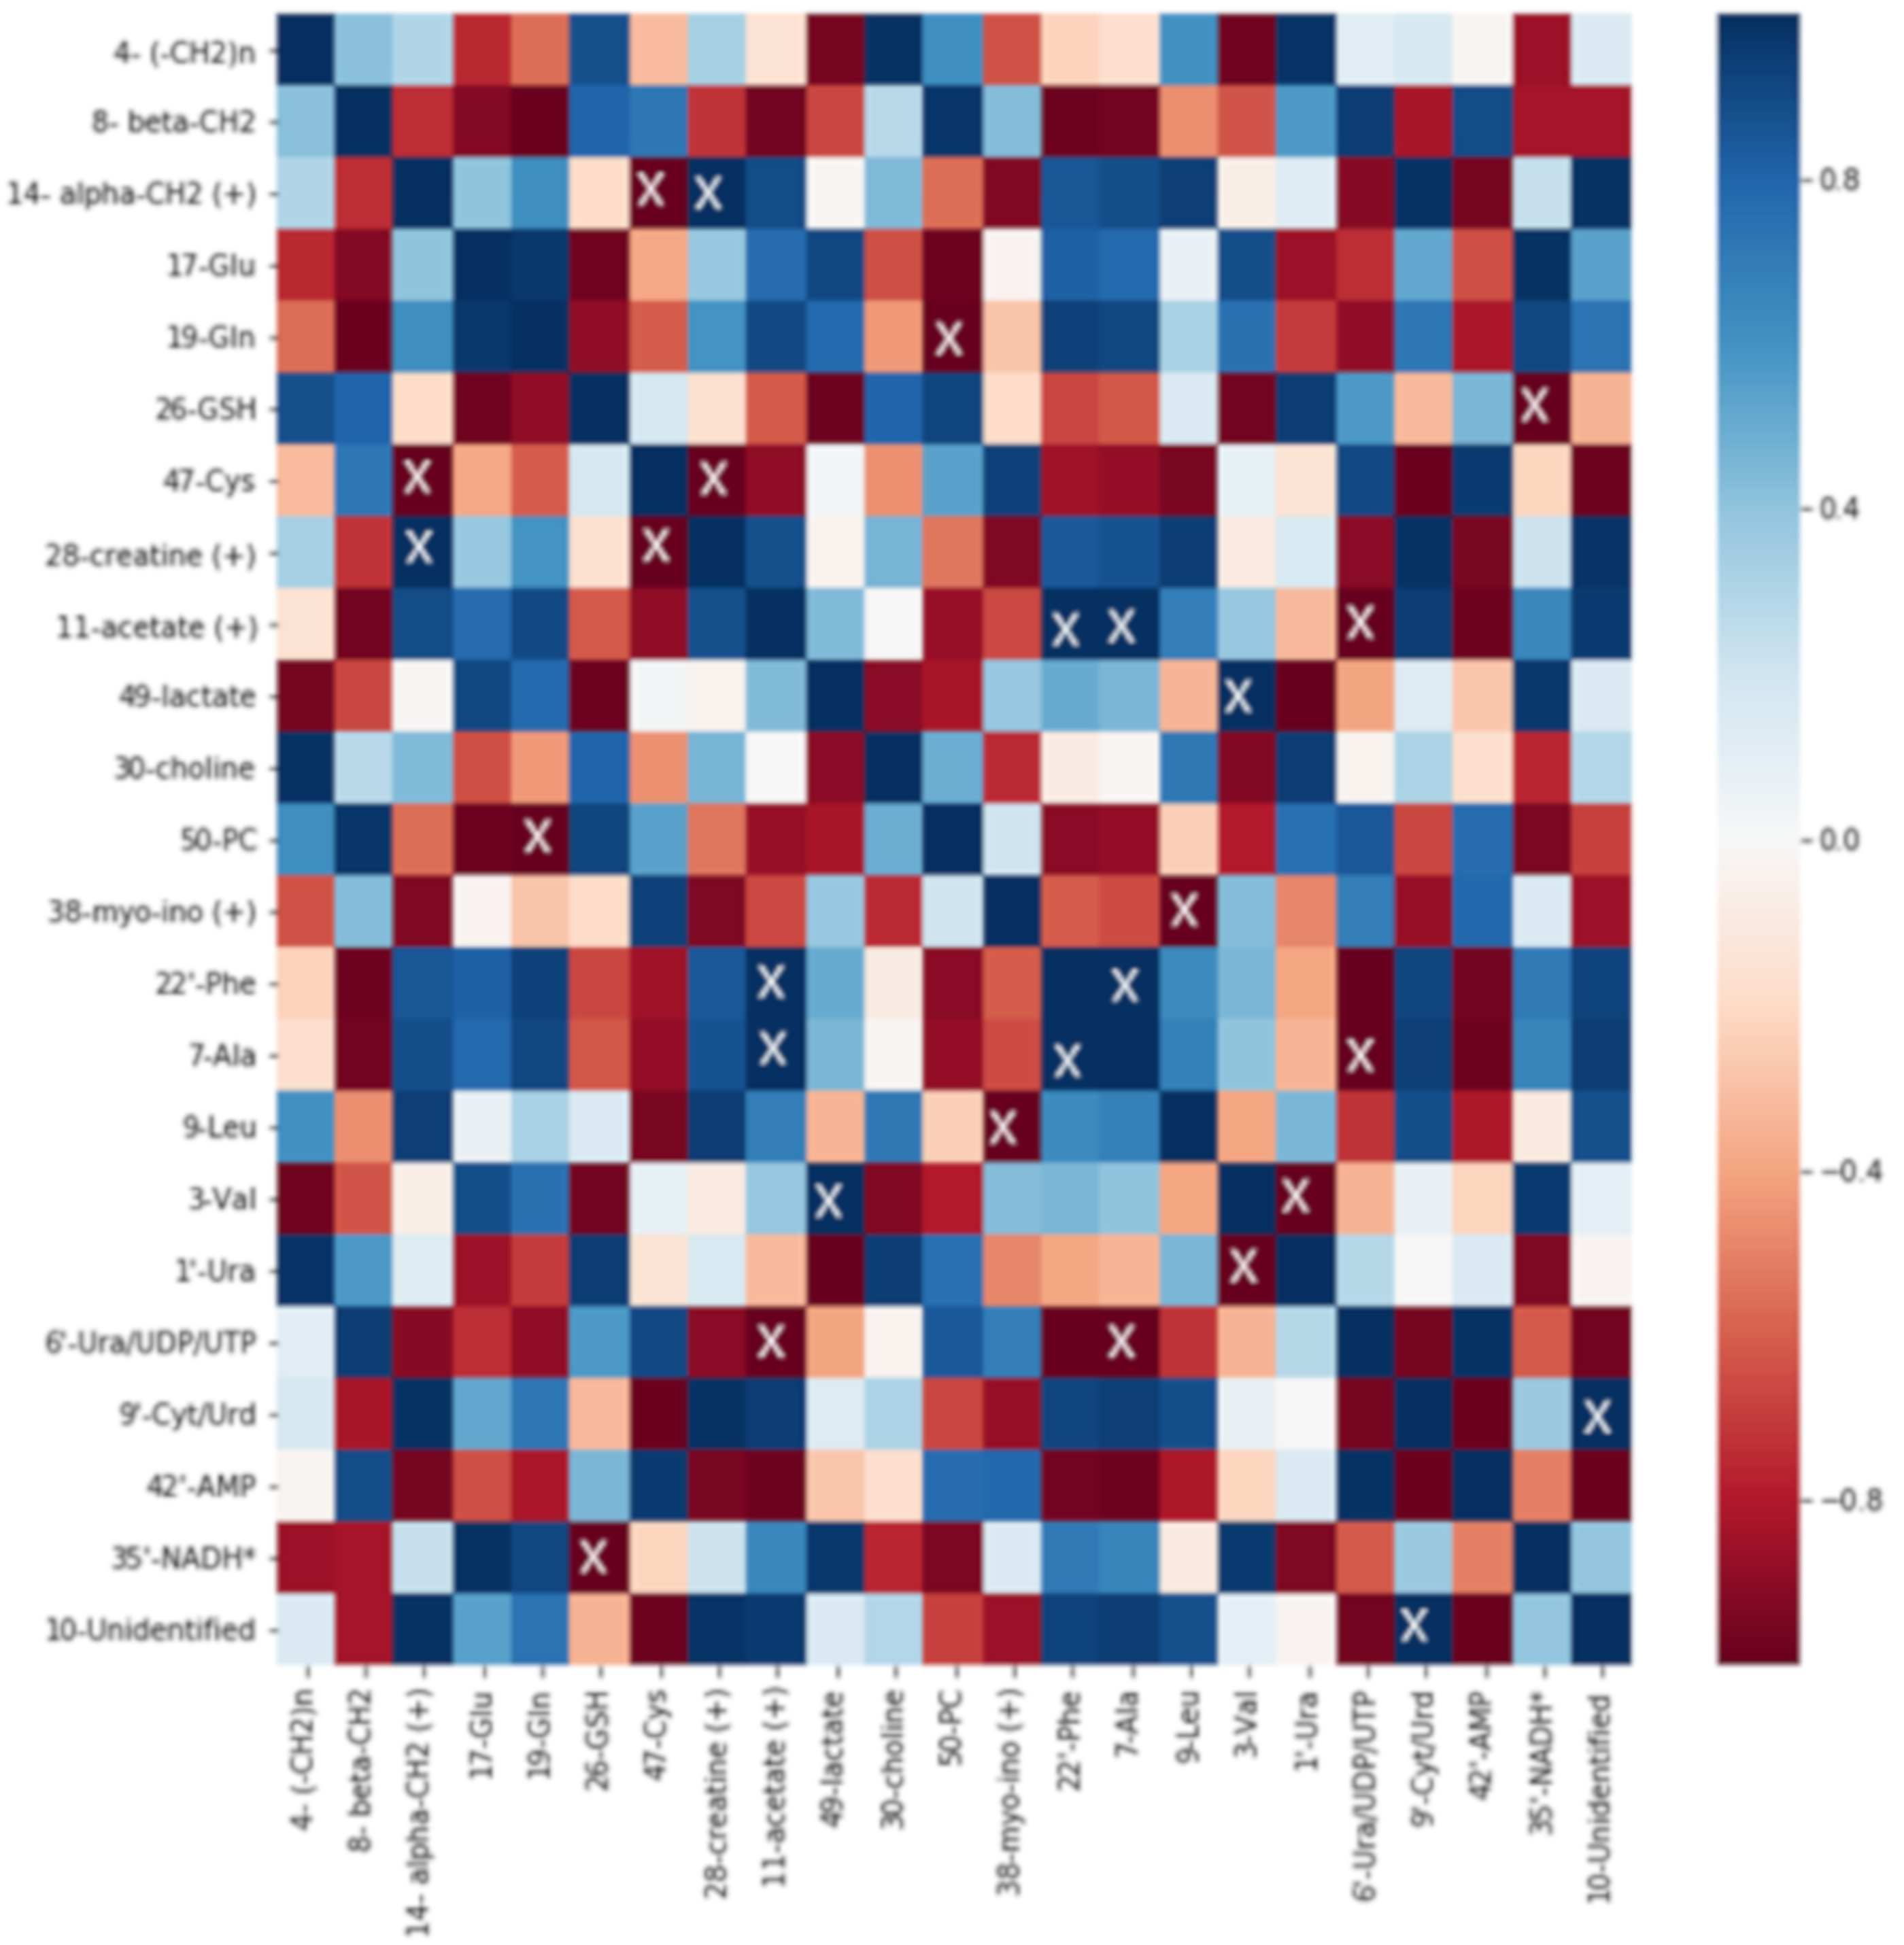
2.5. Correlation Analysis
3. Discussion
4. Materials and Methods
4.1. Synthesis
4.2. Cell Culture and Treatment
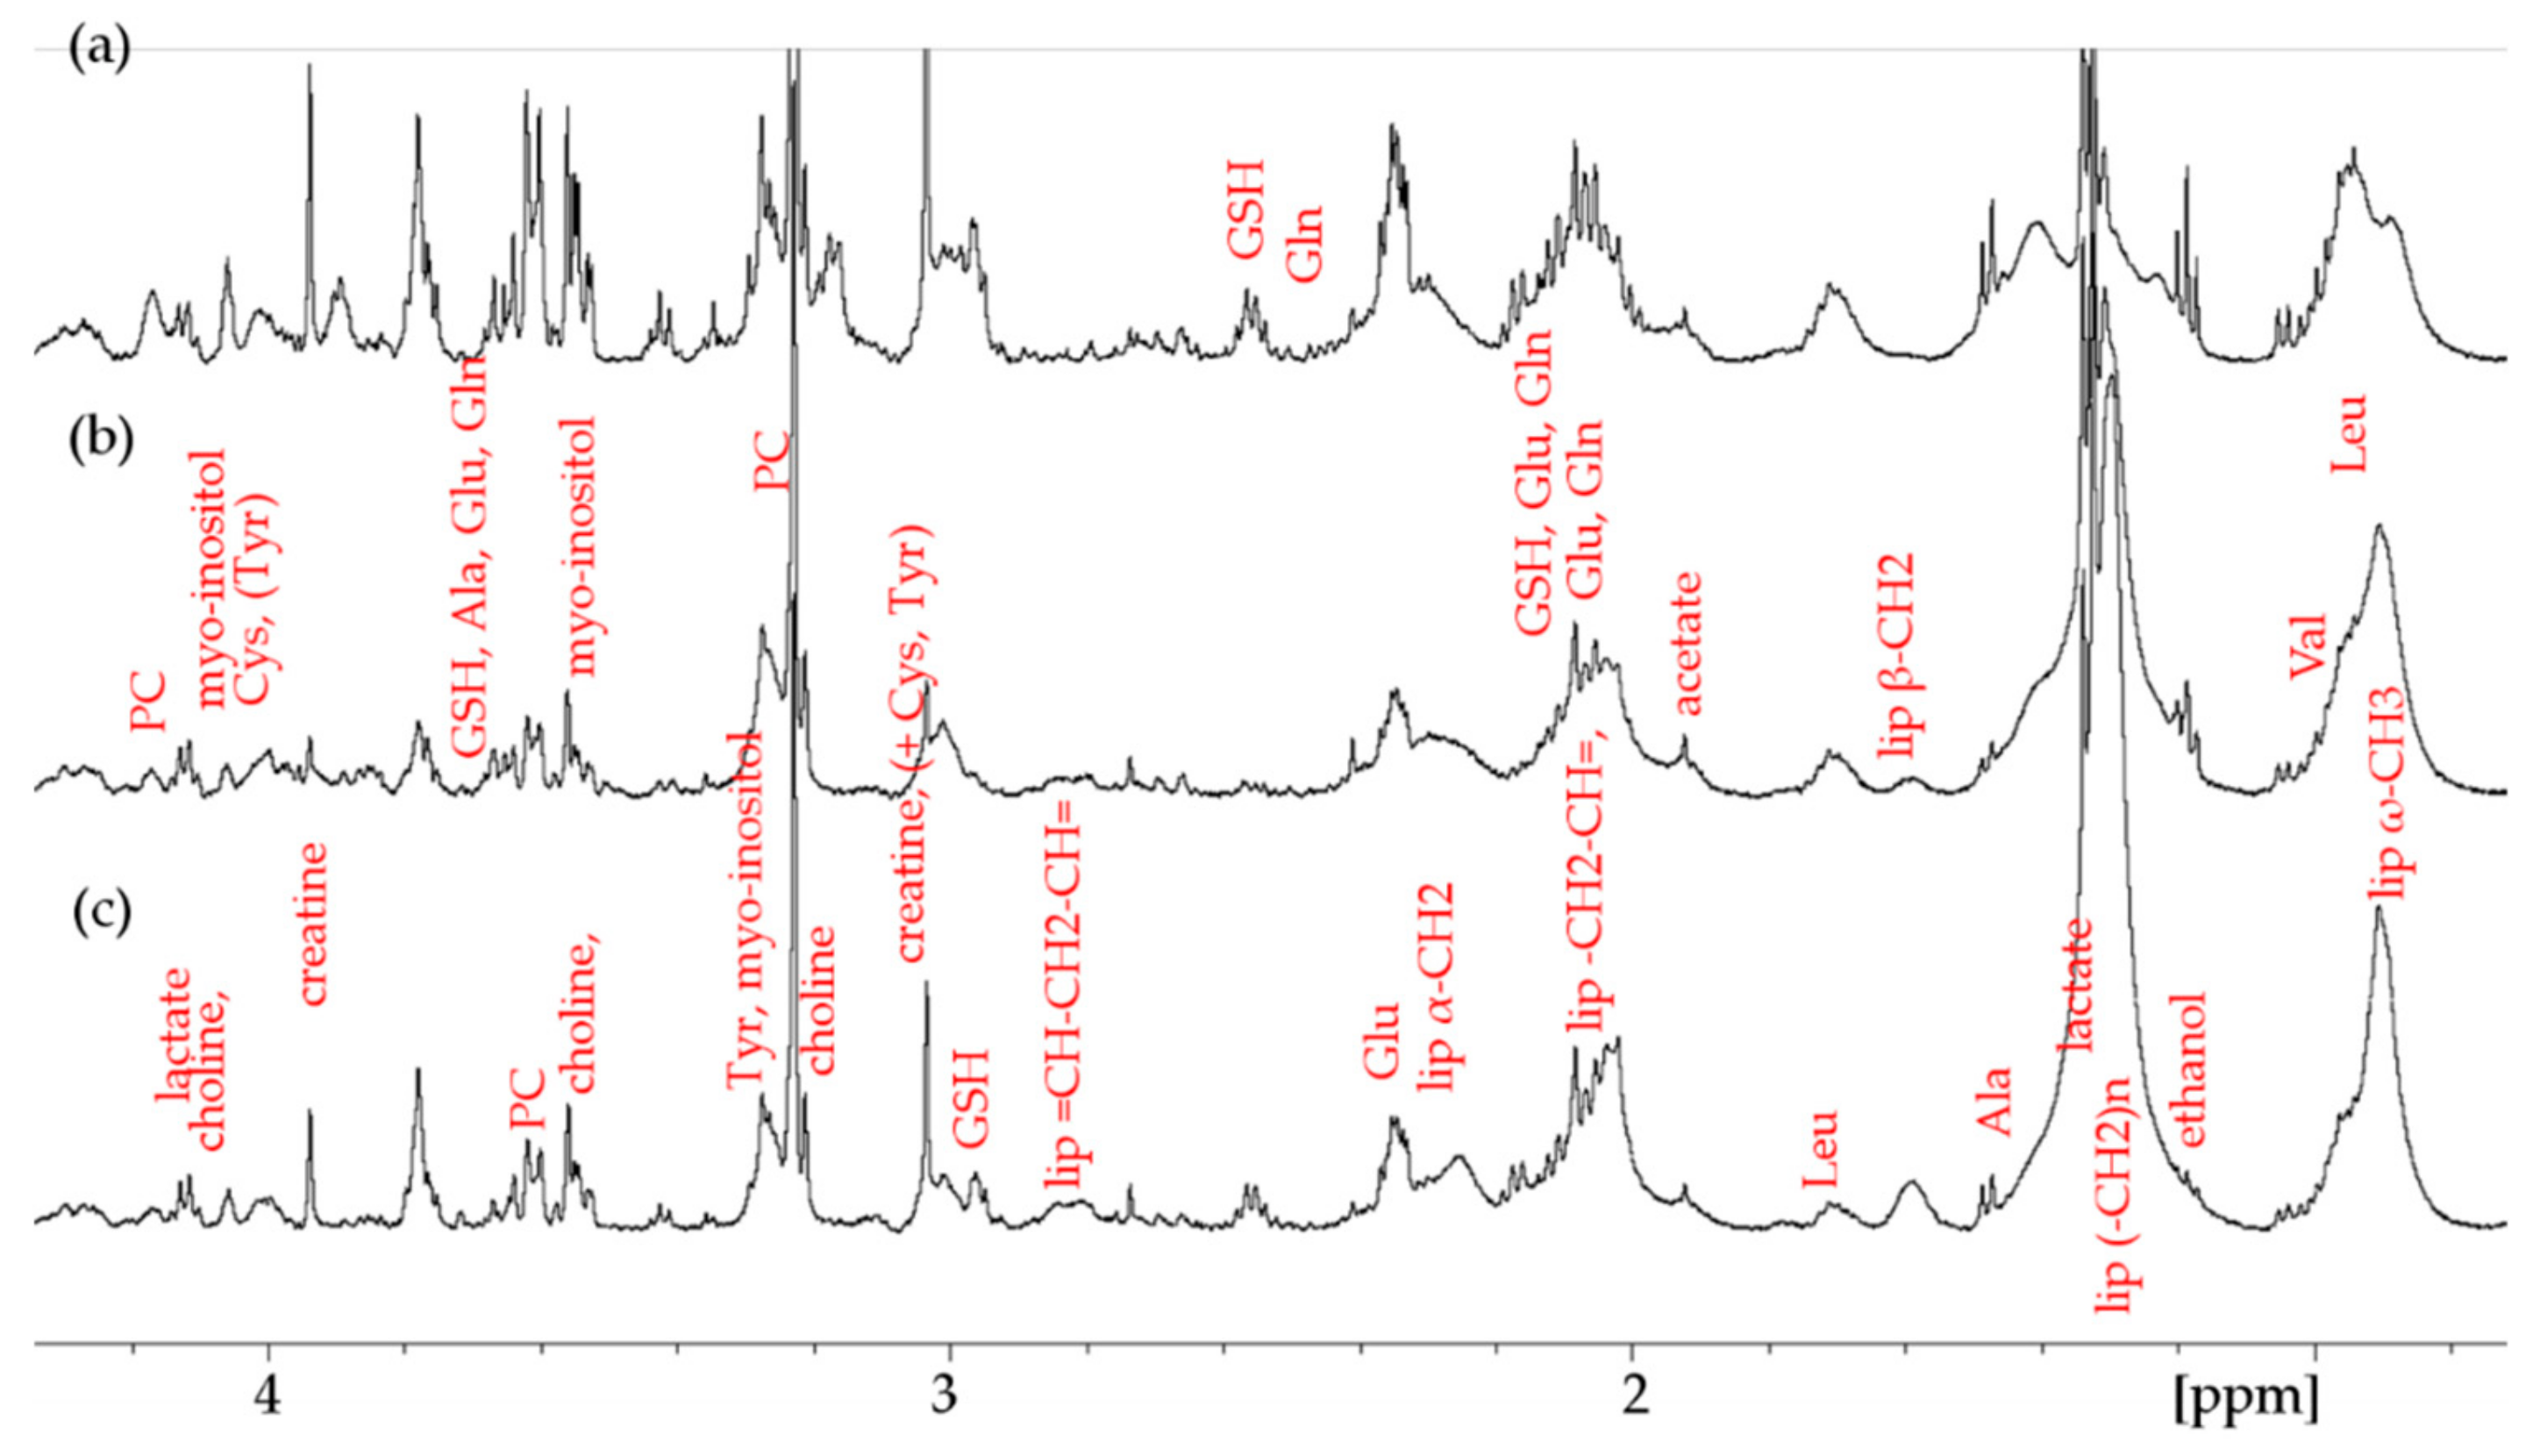
4.3. HR-MAS NMR
4.4. Statistics and Data Analysis
5. Conclusions
Supplementary Materials
Author Contributions
Funding
Acknowledgments
Conflicts of Interest
References
- Wheate, N.J.; Walker, S.; Craig, G.E.; Oun, R. The status of platinum anticancer drugs in the clinic and in clinical trials. Dalton Trans. 2010, 39, 8113–8127. [Google Scholar] [CrossRef] [PubMed]
- Dasari, S.; Tchounwou, P.B. Cisplatin in cancer therapy: Molecular mechanisms of action. Eur. J. Pharmacol. 2015, 740, 364–378. [Google Scholar] [CrossRef] [PubMed]
- Trondl, R.; Heffeter, P.; Kowol, C.R.; Jakupec, M.A.; Berger, W.; Keppler, B.K. NKP-1339, the first ruthenium-based anticancer drug on the edge to clinical application. Chem. Sci. 2014, 5, 2925–2932. [Google Scholar] [CrossRef]
- Dale, L.D.; Tocher, J.H.; Dyson, T.M.; Edwards, D.I.; Tocher, D.A. Studies on DNA damage and induction of SOS repair by novel multifunctional bioreducible compounds. II. A metronidazole adduct of a ruthenium-arene compound. Anti Cancer Drug Des. 1992, 7, 3–14. [Google Scholar]
- Furrer, J.; Süss-Fink, G. Thiolato-bridged dinuclear arene ruthenium complexes and their potential as anticancer drugs. Coord. Chem. Rev. 2016, 309, 36–50. [Google Scholar] [CrossRef]
- Allardyce, B.C.S.; Dyson, P.J. Ruthenium in Medicine: Current Clinical Uses and Future Prospects. Platin. Met. Rev. 2001, 45, 62–69. [Google Scholar]
- Morris, R.E.; Aird, R.E.; del Socorro Murdoch, P.; Chen, H.; Cummings, J.; Hughes, N.D.; Parsons, S.; Parkin, A.; Boyd, G.; Jodrell, D.I.; et al. Inhibition of cancer cell growth by ruthenium (II) arene complexes. J. Med. Chem. 2001, 44, 3616–3621. [Google Scholar] [CrossRef]
- Tomšík, P.; Muthná, D.; Řezáčová, M.; Mičuda, S.; Ćmielová, J.; Hroch, M.; Endlicher, R.; Červinková, Z.; Rudolf, E.; Hann, S.; et al. [(p-MeC6H4Pri)2Ru2(SC6H4-p-But)3]Cl (diruthenium-1), a dinuclear arene ruthenium compound with very high anticancer activity: An in vitro and in vivo study. J. Organomet. Chem. 2015, 782, 42–51. [Google Scholar] [CrossRef]
- Koceva-Chyła, A.; Matczak, K.; Hikisz, M.P.; Durka, M.K.; Kochel, M.K.; Süss-Fink, G.; Furrer, J.; Kowalski, K. Insights into the in vitro Anticancer Effects of Diruthenium-1. ChemMedChem 2016, 2, 2171–2187. [Google Scholar] [CrossRef]
- Giannini, F.; Furrer, J.; Ibao, A.F.; Süss-Fink, G.; Therrien, B.; Zava, O.; Baquie, M.; Dyson, P.J.; Štěpnička, P. Highly cytotoxic trithiophenolatodiruthenium complexes of the type [(η6-p-MeC6H4Pr i ) 2Ru2(SC6H4-p-X)3] +: Synthesis, molecular structure, electrochemistry, cytotoxicity, and glutathione oxidation potential. J. Biol. Inorg. Chem. 2012, 17, 951–960. [Google Scholar] [CrossRef]
- Basto, A.P.; Anghel, N.; Rubbiani, R.; Müller, J.; Stibal, D.; Giannini, F.; Süss-Fink, G.; Balmer, V.; Gasser, G.; Furrer, J.; et al. Targeting of the mitochondrion by dinuclear thiolato-bridged arene ruthenium complexes in cancer cells and in the apicomplexan parasite Neospora caninum. Metallomics 2019, 11, 462–474. [Google Scholar] [CrossRef] [PubMed]
- Warburg, O.; Wind, F.; Negelein, E. The Metabolism of Tumors in The Body. J. Gen. Physiol. 1927, 8, 519–530. [Google Scholar] [CrossRef] [PubMed]
- Warburg, O. On the Origin of Cancer Cells. Science 1956, 123, 309–314. [Google Scholar] [CrossRef] [PubMed]
- Liberti, M.V.; Locasale, J.W. The Warburg Effect: How Does it Benefit Cancer Cells? Trends Biochem. Sci. 2016, 41, 211–218. [Google Scholar] [CrossRef] [PubMed]
- Vander Heiden, M.G.; Cantley, L.C.; Thompson, C.B.; Mammalian, P.; Exhibit, C.; Metabolism, A. Understanding the Warburg Effect: Cell Proliferation. Science 2009, 324, 1029–1034. [Google Scholar] [CrossRef] [PubMed]
- Fong, M.Y.; McDunn, J.; Kakar, S.S. Identification of metabolites in the normal ovary and their transformation in primary and metastatic ovarian cancer. PLoS ONE 2011, 6, e19963. [Google Scholar] [CrossRef] [PubMed]
- Vermeersch, K.A.; Styczynski, M.P. Applications of metabolomics in cancer research. J. Carcinog. 2013, 12, 9. [Google Scholar] [CrossRef]
- Hsu, M.C.; Hung, W.C. Pyruvate kinase M2 fuels multiple aspects of cancer cells: From cellular metabolism, transcriptional regulation to extracellular signaling. Mol. Cancer 2018, 17, 35. [Google Scholar] [CrossRef]
- Wise, D.R.; DeBerardinis, R.J.; Mancuso, A.; Sayed, N.; Zhang, X.-Y.; Pfeiffer, H.K.; Nissim, I.; Daikhin, E.; Yudkoff, M.; McMahon, S.B.; et al. Myc regulates a transcriptional program that stimulates mitochondrial glutaminolysis and leads to glutamine addiction. Proc. Natl. Acad. Sci. USA 2008, 105, 18782–18787. [Google Scholar] [CrossRef]
- Yang, L.; Venneti, S.; Nagrath, D. Glutaminolysis: A Hallmark of Cancer Metabolism. Annu. Rev. Biomed. Eng. 2017, 19, 163–194. [Google Scholar] [CrossRef]
- Long, J.; Zhang, C.-J.; Zhu, N.; Du, K.; Yin, Y.-F.; Tan, X.; Liao, D.-F.; Qin, L. Lipid metabolism and carcinogenesis, cancer development. Am. J. Cancer Res. 2018, 8, 778–791. [Google Scholar]
- Diserens, G.; Hertig, D.; Vermathen, M.; Legeza, B.; Flück, C.E.; Nuoffer, J.M.; Vermathen, P. Metabolic stability of cells for extended metabolomical measurements using NMR. A comparison between lysed and additionally heat inactivated cells. Analyst 2017, 142, 465–471. [Google Scholar] [CrossRef]
- Aguilar, J.A.; Nilsson, M.; Bodenhausen, G.; Morris, G.A. Spin echo NMR spectra without J modulation. Chem. Commun. 2012, 48, 811–813. [Google Scholar] [CrossRef]
- Biological Magnetic Resonance Data Bank. Available online: http://www.bmrb.wisc.edu/ (accessed on 27 February 2019).
- The Human Metabolome Database. Available online: http://www.hmdb.ca/ (accessed on 27 February 2019).
- Vermathen, M.; Paul, L.E.H.; Diserens, G.; Vermathen, P.; Furrer, J. 1H HR-MAS NMR based metabolic profiling of cells in response to treatment with a hexacationic ruthenium metallaprism as potential anticancer drug. PLoS ONE 2015, 10, e0128478. [Google Scholar] [CrossRef]
- Bansal, A.; Celeste Simon, M. Glutathione metabolism in cancer progression and treatment resistance. J. Cell Biol. 2018, 217, 2291–2298. [Google Scholar] [CrossRef]
- Duarte, I.F.; Lamego, I.; Marques, J.; Marques, M.P.M.; Blaise, B.J.; Gil, A.M. Nuclear magnetic resonance (NMR) study of the effect of cisplatin on the metabolic profile of MG-63 osteosarcoma cells. J. Proteome Res. 2010, 9, 5877–5886. [Google Scholar] [CrossRef]
- Cluntun, A.A.; Lukey, M.J.; Cerione, R.A.; Locasale, J.W. Glutamine Metabolism in Cancer: Understanding the Heterogeneity. Trends Cancer 2017, 3, 169–180. [Google Scholar] [CrossRef]
- Yang, L.; Achreja, A.; Yeung, T.L.; Mangala, L.S.; Jiang, D.; Han, C.; Baddour, J.; Marini, J.C.; Ni, J.; Nakahara, R.; et al. Targeting Stromal Glutamine Synthetase in Tumors Disrupts Tumor Microenvironment-Regulated Cancer Cell Growth. Cell Metab. 2016, 24, 685–700. [Google Scholar] [CrossRef]
- Altman, B.J.; Stine, Z.E.; Dang, C.V. Dang From Krebs to clinic: Glutamine metabolism to cancer therapy. Nat. Rev. Cancer 2016, 16, 619–634. [Google Scholar] [CrossRef]
- Turkoglu, O.; Zeb, A.; Graham, S.; Szyperski, T.; Szender, J.B.; Odunsi, K.; Bahado-Singh, R. Metabolomics of biomarker discovery in ovarian cancer: A systematic review of the current literature. Metabolomics 2016, 12, 60. [Google Scholar] [CrossRef]
- Lu, S.C. Glutathione Synthesis. Biochim. Biophys. Acta 2014, 1830, 3143–3153. [Google Scholar] [CrossRef]
- Nunes, S.C.; Ramos, C.; Lopes-Coelho, F.; Sequeira, C.O.; Silva, F.; Gouveia-Fernandes, S.; Rodrigues, A.; Guimarães, A.; Silveira, M.; Abreu, S.; et al. Cysteine allows ovarian cancer cells to adapt to hypoxia and to escape from carboplatin cytotoxicity. Sci. Rep. 2018, 8, 9513. [Google Scholar] [CrossRef]
- Cramer, S.L.; Saha, A.; Liu, J.; Tadi, S.; Tiziani, S.; Yan, W.; Triplett, K.; Lamb, C.; Alters, S.E.; Rowlinson, S.; et al. Systemic depletion of L-cyst(e)ine with cyst(e)inase increases reactive oxygen species and suppresses tumor growth. Nat. Med. 2017, 23, 120–127. [Google Scholar] [CrossRef]
- Wyss, M.; Kaddurah-Daouk, R. Creatine and Creatinine Metabolism. Physiol. Rev. 2017, 80, 1107–1213. [Google Scholar] [CrossRef]
- Sestili, P.; Martinelli, C.; Colombo, E.; Barbieri, E.; Potenza, L.; Sartini, S.; Fimognari, C. Creatine as an antioxidant. Amino Acids 2011, 40, 1385–1396. [Google Scholar] [CrossRef]
- Patra, S.; Ghosh, A.; Roy, S.S.; Bera, S.; Das, M.; Talukdar, D.; Ray, S.; Wallimann, T.; Ray, M. A short review on creatine-creatine kinase system in relation to cancer and some experimental results on creatine as adjuvant in cancer therapy. Amino Acids 2012, 42, 2319–2330. [Google Scholar] [CrossRef]
- Miller, E.E.; Evans, A.E.; Cohn, M. Inhibition of rate of tumor growth by creatine and cyclocreatine. Proc. Natl. Acad. Sci. USA 2006, 90, 3304–3308. [Google Scholar] [CrossRef]
- Pan, H.; Xia, K.; Zhou, W.; Xue, J.; Liang, X.; Cheng, L.; Wu, N.; Liang, M.; Wu, D.; Ling, L.; et al. Low Serum Creatine Kinase Levels in Breast Cancer Patients: A Case-Control Study. PLoS ONE 2013, 8, e62112. [Google Scholar] [CrossRef]
- Liu, Q.; Luo, Q.; Halim, A.; Song, G. Targeting lipid metabolism of cancer cells: A promising therapeutic strategy for cancer. Cancer Lett. 2017, 401, 39–45. [Google Scholar] [CrossRef]
- Petan, T.; Jarc, E.; Jusović, M. Lipid Droplets in Cancer: Guardians of Fat in a Stressful World. Molecules 2018, 23, 1941. [Google Scholar] [CrossRef]
- Santos, C.R.; Schulze, A. Lipid metabolism in cancer. FEBS J. 2012, 279, 2610–2623. [Google Scholar] [CrossRef]
- San-Millán, I.; Brooks, G.A. Reexamining cancer metabolism: Lactate production for carcinogenesis could be the purpose and explanation of the Warburg Effect. Carcinogenesis 2017, 38, 119–133. [Google Scholar] [CrossRef]
- Wang, B.; Cao, J.; Wang, Z.; Liu, R.; Gao, X.; Hu, X.; Zhang, J.; Wang, L.; Guo, L. Overall survival of cancer patients with serum lactate dehydrogenase greater than 1000 IU/L. Tumor Biol. 2016, 37, 14083–14088. [Google Scholar]
- Doherty, J.R.; Cleveland, J.L.; Doherty, J.R.; Cleveland, J.L. Targeting lactate metabolism for cancer therapeutics Find the latest version: Review series Targeting lactate metabolism for cancer therapeutics. J. Clin. Investig. 2013, 123, 3685–3692. [Google Scholar] [CrossRef]
- Stepanenko, A.A.; Dmitrenko, V.V. HEK293 in cell biology and cancer research: Phenotype, karyotype, tumorigenicity, and stress-induced genome-phenotype evolution. Gene 2015, 569, 182–190. [Google Scholar] [CrossRef]
- Giannini, F.; Geiser, L.; Paul, L.E.H.; Roder, T.; Therrien, B.; Süss-Fink, G.; Furrer, J. Tuning the in vitro cell cytotoxicity of dinuclear arene ruthenium trithiolato complexes: Influence of the arene ligand. J. Organomet. Chem. 2015, 783, 40–45. [Google Scholar] [CrossRef]
- Giannini, F.; Bartoloni, M.; Paul, L.E.H.; Süss-Fink, G.; Reymond, J.L.; Furrer, J. Cytotoxic peptide conjugates of dinuclear arene ruthenium trithiolato complexes. MedChemComm 2015, 6, 347–350. [Google Scholar] [CrossRef]
- Ellinger, J.J.; Chylla, R.; Ulrich, E.L.; Markley, J.L. Databases and Software for NMR-Based Metabolomics. Curr. Metab. 2013, 1, 28–40. [Google Scholar]
- Benjamini, Y.; Hochberg, Y. Controlling the false discovery rate: A practical and powerful approach to multiple testing. J. R. Stat. Soc. Ser. B 1995, 57, 289–300. [Google Scholar] [CrossRef]
- Kale, N.S.; Haug, K.; Conesa, P.; Jayseelan, K.; Moreno, P.; Rocca-Serra, P.; Nainala, V.C.; Spicer, R.A.; Williams, M.; Li, X.; et al. MetaboLights: An Open-Access Database Repository for Metabolomics Data. Curr. Protoc. Bioinform. 2016, 53, 14.13.1–14.13.18. [Google Scholar]


| Cell Line | A2780 | A2780cisR | MCF-7 | MDA-MB-231 | HepG2 |
|---|---|---|---|---|---|
| IC50 | 0.03 | 0.03 | 0.077 | 0.228 | 0.268 |
| Groups | HEK-293 | A2780 | A2780cisR |
|---|---|---|---|
| Included samples | (1–30) (1–52) | (1–17 19-30) (1–52) | (1–19 21–23 25-30) (1–52) |
| Preprocessing * | mean center, UVS | ||
| Cross validation | Venetian blinds 5 splits, 1 sample/split | ||
| X-block | 30 × 52 | 29 × 52 | 28 × 52 |
| PCA | |||
| Components | 4 | 2 | 2 |
| Algorithm | SVD | SVD | SVD |
| RMSEC | 0.599 | 0.719 | 0.726 |
| RMSECV | 0.969 | 0.962 | 0.976 |
| Total variance captured | 62.94% | 46.45% | 45.37% |
| PC 1 | 24.05% | 27.77% | 35.41% |
| PC2 | 15.11% | 18.67% | 9.96% |
| PC3 | 12.60% | - | - |
| PC4 | 11.18% | - | - |
| PLS | |||
| Number of LVs | 2 | 4 | 2 |
| Algorithm | SIMPLS | SIMPLS | SIMPLS |
| RMSEC | 0.354 | 0.337 | 0.385 |
| RMSECV | 0.533 | 0.904 | 0.571 |
| R2Cal | 0.812 | 0.835 | 0.781 |
| R2CV | 0.576 | 0.096 | 0.524 |
| Wilcoxon (self-pred.) ** | 0.010 | 0.113 | 0.069 |
| Wilcoxon (cross-val.) ** | 0.004 | 0.085 | 0.014 |
| Sign test (self-pred.) ** | 0.068 | 0.254 | 0.197 |
| Sign test (cross-val.) ** | 0.031 | 0.140 | 0.067 |
| Rand t-test (self-pred.) ** | 0.014 | 0.194 | 0.066 |
| Rand t-test (cross-val.) ** | 0.006 | 0.190 | 0.016 |
| Total variance captured | 34.45% | 54.83% | 42.22% |
| LV 1 | 15.80% | 25.77% | 34.65% |
| LV 2 | 18.65% | 9.22% | 7.57% |
| LV 3 | - | 14.28% | - |
| LV 4 | - | 5.56% | - |
| HEK-293 | A2780 | A2780cisR | ||||
|---|---|---|---|---|---|---|
| DiRu-1 (µM) | DiRu-1 (µM) | DiRu-1 (µM) | ||||
| Metabolite (bucket) | 0.015 | 0.03 | 0.015 | 0.03 | 0.015 | 0.03 |
| lipid ω-CH3 (+Leu) (1) | 0 | ↑ | ↓ | ↓ | ↓ * # | ↓ * # |
| lipid (–CH2)n (4) | ↑ | ↑ | ↓ | ↓ | ↓ * | ↓ * # |
| lipid (–CH2)n, Lac (5) | ↓ | ↓ | ↓ | ↓ | ↓ * # | ↓ * # |
| lipid β-CH2 (8) | ↑ | ↑ | ↓ | ↓ | ↓ | ↓ |
| lipid –CH2–CH=, Glu/Gln (12) | 0 | 0 | 0 | ↓ | ↓ | ↓ * # |
| lipid α-CH2 + other (14) | 0 | 0 | 0 | ↓ | ↓ * | ↓ * # |
| Lac, lipid (–CH2)n (5) | ↓ | ↓ | ↓ | ↓ | ↓ * # | ↓ * # |
| Lac (49) | ↓ * # | ↓ * | ↑ | ↑ | ↓ * # | ↓ |
| Ala (7) | ↓ | ↓ | ↓ | ↓ | ↑ | ↑ |
| Leu (9) | ↑ | ↓ | ↓ | ↓ | ↓ | ↓ * |
| Ac (+other) (11) | ↓ | ↓ | 0 | ↓ | ↓ * # | ↓ * # |
| Glu/Gln, lipid –CH2–CH= (12) | 0 | 0 | x | x | ↓ | ↓ * # |
| Glu (16) | 0 | 0 | ↑ * | ↑ | 0 | 0 |
| Glu (17) | ↓ | 0 | ↑ | ↓ | ↓ * # | ↓ * # |
| Glu, Gln (18) | ↓ * | ↓ | ↑ | ↑ | ↓ * # | ↓ * # |
| Gln (19) | ↓ | ↓ * | 0 | ↓ * | ↑ | ↑ * # |
| GSH, Glu, Gln (13) | 0 | ↑ * | 0 | ↑ | ↑ * # | ↑ * |
| GSH (20) | ↑ * | ↑ * # | ↑ | ↑ | ↑ * # | ↑ * # |
| (GSH) (25) | ↑ | ↑ | 0 | 0 | ↑ * # | ↑ * # |
| GSH (26) | ↑ | ↑ * | ↑ | ↑ | ↑ * # | ↑ * # |
| Cre (+Cys?) (28) | 0 | 0 | 0 | ↓ | ↑ * # | ↑ * # |
| Cre (+Tyr) (45) | 0 | ↓ | 0 | 0 | ↑ * # | ↑ * # |
| Cys, Tyr (29) | ↑ | ↑ | ↓ | ↓ | ↓ | ↓ * |
| Cys (+Tyr) (46) | ↓ | ↓ | 0 | 0 | 0 | ↓ |
| Cys (47) | 0 | ↑ | ↓ | ↓ | ↓ | ↓ * |
| Tyr, Cys (29) | ↑ | ↑ | ↓ | ↓ | ↓ | ↓ * |
| Tyr, myo-Ino (32) | ↑ | ↑ | ↓ | ↓ | ↓ | ↓ * # |
| (Tyr), Cys (46) | 0 | ↓ | 0 | 0 | 0 | ↓ |
| Chol (30) | ↑ | ↑ | 0 | ↓ | ↓ | 0 |
| PC (31) | ↑ * | ↑ * # | 0 | ↑ * | ↑ | ↑ |
| Chol, myo-Ino (37) | ↓ | ↑ * | 0 | ↑ | ↑ * # | ↑ |
| (Chol), myo-Ino (38) | ↓ * # | ↑ | ↑ | ↑ | ↑ | ↑ |
| Chol, myo-Ino (48) | ↓ * | ↑ * | ↑ | ↑ * # | ↑ * # | ↑ |
| myo-Ino, Tyr (32) | ↑ | ↑ | ↓ | ↓ | ↓ * # | ↓ * |
| myo-Ino, Chol (37) | ↓ | ↑ * | 0 | ↑ | ↑ * # | ↑ |
| myo-ino, PC (41) | 0 | ↑ * # | 0 | ↑ * | ↑ * # | ↑ * |
| GSH, Glu, Gln, Ala (42) | 0 | ↑ | ↓ | ↑ | ↑ * # | ↑ * # |
| PC (50) | ↑ * | ↑ * # | ↓ | ↑ | ↑ * # | ↑ * # |
| Ura (1 ar) | ↑ | ↑ | ↑ | ↓ | ↑ | ↑ |
| Ura (23 ar) | ↓ | ↓ | ↑ | ↓ | ↑ | ↑ |
| Ura (24 ar) | 0 | ↓ | ↑ | 0 | ↑ | ↑ |
| Ura/UDP/UTP (5 ar) | ↑ | ↑ | ↑ | ↑ | ↑ | ↑ |
| Ura/UDP/UTP (6 ar) | 0 | ↑ | ↑ | ↑ * | ↑ | ↑ |
| Ura/UDP/UTP (7 ar) | ↓ | 0 | 0 | ↑ * | ↑ | ↑ |
| Ura/UDP/UTP (8 ar) | ↓ | ↓ | ↓ | ↑ | 0 | ↓ |
| Cyd/Urd (3 ar) | ↑ | ↑ | 0 | ↓ | ↓ | 0 |
| Cyd/Urd (9 ar) | 0 | ↓ | ↓ | 0 | ↓ * | ↓ |
| Tyr (14 ar) | 0 | 0 | 0 | ↑ | ↓ | ↓ |
| Tyr (15 ar) | ↑ | ↑ | 0 | ↓ | ↓ | ↓ * |
| Tyr (18 ar) | 0 | ↓ | ↓ | ↓ | ↓ * | ↓ |
| Phe (20 ar) | ↑ | 0 | ↓ | ↓ | 0 | ↓ |
| Phe (22 ar) | ↓ | ↓ | ↓ | ↓ * | ↑ | ↑ |
| UDP (32 ar) | ↑ | ↑ | ↑ | ↑ | ↑ | ↓ |
| UDP/UTP (31 ar) | 0 | ↑ | ↑ | ↑ | ↑ | ↑ |
| AMP (37 ar) | ↓ | ↑ | 0 | 0 | 0 | ↑ |
| AMP (42 ar) | 0 | ↑ | ↓ | ↓ * | 0 | 0 |
| Fum? (13 ar) | 0 | ↑ | 0 | ↑ | ↑ | 0 |
| NADH? (12 ar) | ↓ | ↑ | 0 | ↑ | ↓ | 0 |
| NADH? (35 ar) | ↓ | ↓ | ↓ | ↑ | ↓ * | ↓ |
| NADH? (36 ar) | ↓ | 0 | ↓ | ↓ | ↓ | ↓ |
| NADH? (40 ar) | 0 | ↑ | 0 | ↑ | ↑ | ↑ |
© 2019 by the authors. Licensee MDPI, Basel, Switzerland. This article is an open access article distributed under the terms and conditions of the Creative Commons Attribution (CC BY) license (http://creativecommons.org/licenses/by/4.0/).
Share and Cite
Primasová, H.; Paul, L.E.H.; Diserens, G.; Primasová, E.; Vermathen, P.; Vermathen, M.; Furrer, J. 1H HR-MAS NMR-Based Metabolomics of Cancer Cells in Response to Treatment with the Diruthenium Trithiolato Complex [(p-MeC6H4iPr)2Ru2(SC6H4-p-But)3]+ (DiRu-1). Metabolites 2019, 9, 146. https://doi.org/10.3390/metabo9070146
Primasová H, Paul LEH, Diserens G, Primasová E, Vermathen P, Vermathen M, Furrer J. 1H HR-MAS NMR-Based Metabolomics of Cancer Cells in Response to Treatment with the Diruthenium Trithiolato Complex [(p-MeC6H4iPr)2Ru2(SC6H4-p-But)3]+ (DiRu-1). Metabolites. 2019; 9(7):146. https://doi.org/10.3390/metabo9070146
Chicago/Turabian StylePrimasová, Hedvika, Lydia E. H. Paul, Gaëlle Diserens, Ester Primasová, Peter Vermathen, Martina Vermathen, and Julien Furrer. 2019. "1H HR-MAS NMR-Based Metabolomics of Cancer Cells in Response to Treatment with the Diruthenium Trithiolato Complex [(p-MeC6H4iPr)2Ru2(SC6H4-p-But)3]+ (DiRu-1)" Metabolites 9, no. 7: 146. https://doi.org/10.3390/metabo9070146
APA StylePrimasová, H., Paul, L. E. H., Diserens, G., Primasová, E., Vermathen, P., Vermathen, M., & Furrer, J. (2019). 1H HR-MAS NMR-Based Metabolomics of Cancer Cells in Response to Treatment with the Diruthenium Trithiolato Complex [(p-MeC6H4iPr)2Ru2(SC6H4-p-But)3]+ (DiRu-1). Metabolites, 9(7), 146. https://doi.org/10.3390/metabo9070146