Cerebral Vitamin B5 (D-Pantothenic Acid) Deficiency as a Potential Cause of Metabolic Perturbation and Neurodegeneration in Huntington’s Disease

 , and
, and
Abstract
1. Introduction
2. Results
3. Discussion
4. Materials and Methods
4.1. Acquisition of Human Brains
4.2. Human Brain Tissue
4.3. Tissue Extraction for GC-MS
4.4. GC-MS and Data Analysis
4.5. Tissue Extraction for Inductively Coupled Plasma Mass Spectrometry (ICP-MS)
4.6. ICP-MS and Data Analysis
4.7. Vitamin B5 Concentration Measured by Targeted GC-MS Assay
4.8. Data Analysis and Statistics
Supplementary Materials
Author Contributions
Funding
Acknowledgments
Conflicts of Interest
References
- Walker, F.O. Huntington’s disease. Lancet 2007, 369, 218–228. [Google Scholar] [CrossRef]
- Tabrizi, S.J.; Langbehn, D.R.; Leavitt, B.R.; Roos, R.A.C.; Durr, A.; Craufurd, D.; Kennard, C.; Hicks, S.L.; Fox, N.C.; I Scahill, R.; et al. Biological and clinical manifestations of Huntington’s disease in the longitudinal TRACK-HD study: cross-sectional analysis of baseline data. Lancet Neurol. 2009, 8, 791–801. [Google Scholar] [CrossRef]
- MacDonald, M.E.; Ambrose, C.M.; Duyao, M.P.; Myers, R.H.; Lin, C.; Srinidhi, L.; Barnes, G.; Taylor, S.A.; James, M.; Groot, N.; et al. A novel gene containing a trinucleotide repeat that is expanded and unstable on Huntington’s disease chromosomes. Cell 1993, 72, 971–983. [Google Scholar] [CrossRef]
- Snell, R.G.; Macmillan, J.C.; Cheadle, J.P.; Fenton, I.; Lazarou, L.P.; Davies, P.; Macdonald, M.E.; Gusella, J.F.; Harper, P.S.; Shaw, D.J. Relationship between trinucleotide repeat expansion and phenotypic variation in Huntington’s disease. Nat. Genet. 1993, 4, 393–397. [Google Scholar] [CrossRef]
- Andrew, S.E.; Telenius, H.; Zeisler, J.; Bassett, A.; Almqvist, E.; Bird, T.D.; Lin, B.; Kremer, B.; Goldberg, P.; Theilmann, J.; et al. A worldwide study of the Huntington’s disease mutation: The sensitivity and specificity of measuring CAG repeats. New Engl. J. Med. 1994, 330, 1401–1406. [Google Scholar]
- Soudou, F.; Humbert, S. The biology of huntingtin. Neuron 2016, 89, 910–926. [Google Scholar] [CrossRef]
- Jones, C.; Busse, M.; Quinn, L.; Dawes, H.; Drew, C.; Kelson, M.; Hood, K.; Rosser, A.; Edwards, R.T. The societal cost of Huntington’s disease: Are we underestimating the burden? Eur. J. Neurol. 2016, 23, 1588–1590. [Google Scholar] [CrossRef] [PubMed]
- Vonsattel, J.-P.G.; Keller, C.; Ramirez, E.P.C. Huntington’s disease—Neuropathology. In Hyperkinetic Movement Disorders; Weiner, W.J., Tolosa, E., Eds.; Elsevier B.V.: Philadelphia, The Netherlands, 2011; Volume 100, pp. 83–100. [Google Scholar]
- Patassini, S.; Begley, P.; Xu, J.; Church, S.J.; Reid, S.J.; Kim, E.H.; Curtis, M.A.; Dragunow, M.; Waldvogel, H.J.; Snell, R.G.; et al. Metabolite mapping reveals severe widespread perturbation of multiple metabolic processes in Huntington’s disease human brain. Biochim. Biophys. Acta. 2016, 1862, 1650–1662. [Google Scholar] [CrossRef] [PubMed]
- Xu, J.; Begley, P.; Church, S.J.; Patassini, S.; Hollywood, K.A.; Jüllig, M.; Curtis, M.A.; Waldvogel, H.J.; Faull, R.L.M.; Unwin, R.D.; et al. Graded perturbations of metabolism in multiple regions of human brain in Alzheimer’s disease: Snapshot of a pervasive metabolic disorder. Biochim. Biophys. Acta 2016, 1862, 1084–1092. [Google Scholar] [CrossRef]
- Waldvogel, H.J.; Kim, E.H.; Tippett, L.J.; Vonsattel, J.-P.G.; Faull, R.L.M. The neuropathology of Huntington’s disease. In Behavioral Neurobiology Of Huntington’S Disease and Parkinson’S Disease; Nguyen, H.H.P., Cenci, M.A., Eds.; Springer: Berlin, Germany, 2014; Volume 22, pp. 33–80. [Google Scholar]
- Ciarmiello, A.; Cannella, M.; Lastoria, S.; Simonelli, M.; Frati, L.; Rubinsztein, D.C.; Squitieri, F. Brain white-matter volume loss and glucose hypometabolism precede the clinical symptoms of Huntington’s disease. J. Nucl. Med. 2006, 47, 215–222. [Google Scholar]
- Pagano, G.; Niccolini, F.; Politis, M. Current status of PET imaging in Huntington’s disease. Eur. J. Pediatr. 2016, 43, 1171–1182. [Google Scholar] [CrossRef]
- Carroll, J.B.; Bates, G.P.; Steffan, J.; Saft, C.; Tabrizi, S.J. Treating the whole body in Huntington’s disease. Lancet Neurol. 2015, 14, 1135–1142. [Google Scholar] [CrossRef]
- Tang, C.C.; Feigin, A.; Ma, Y.; Habeck, C.; Paulsen, J.S.; Leenders, K.L.; Teune, L.K.; Van Oostrom, J.C.; Guttman, M.; Dhawan, V.; et al. Metabolic network as a progression biomarker of premanifest Huntington’s disease. J. Clin. Investig. 2013, 123, 4076–4088. [Google Scholar] [CrossRef]
- Gonzalez-Riano, C.; Garcia, A.; Barbas, C. Metabolomics studies in brain tissue: A review. J. Pharm. Biomed. Anal. 2016, 130, 141–168. [Google Scholar] [CrossRef]
- Yin, P.; Peter, A.; Franken, H.; Zhao, X.; Neukamm, S.S.; Rosenbaum, L.; Lucio, M.; Zell, A.; Haring, H.-U.; Xu, G.; et al. Preanalytical aspects and sample quality assessment in metabolomics studies of human blood. Clin. Chem. 2013, 59, 833–845. [Google Scholar] [CrossRef]
- Wood, J.T.; Williams, J.S.; Pandarinathan, L.; Courville, A.; Keplinger, M.R.; Janero, D.R.; Vouros, P.; Makriyannis, A.; Lammi-Keefe, C.J. Comprehensive profiling of the human circulating endocannabinoid metabolome: Clinical sampling and sample storage parameters. Clin. Chem. Lab. Med. (CCLM) 2008, 46, 1289–1295. [Google Scholar] [CrossRef]
- Patassini, S.; Begley, P.; Reid, S.J.; Xu, J.; Church, S.J.; Curtis, M.; Dragunow, M.; Waldvogel, H.J.; Unwin, R.D.; Snell, R.G.; et al. Identification of elevated urea as a severe, ubiquitous metabolic defect in the brain of patients with Huntington’s disease. Biochem. Biophys. Res. Commun. 2015, 468, 161–166. [Google Scholar] [CrossRef]
- Handley, R.R.; Reid, S.J.; Brauning, R.; MacLean, P.; Mears, E.R.; Fourie, I.; Patassini, S.; Cooper, G.J.S.; Rudiger, S.R.; McLaughlan, C.J.; et al. Brain urea increase is an early Huntington’s disease pathogenic event observed in a prodromal transgenic sheep model and HD cases. Proc. Natl. Acad. Sci. USA 2017, 114, E11293–E11302. [Google Scholar] [CrossRef]
- Mischak, H.; Allmaier, G.; Apweiler, R.; Attwood, T.; Baumann, M.; Benigni, A.; Bennett, S.E.; Bischoff, R.; Bongcam-Rudloff, E.; Capasso, G.; et al. Recommendations for biomarker identification and qualification in clinical proteomics. Sci. Transl. Med. 2010, 2, 46ps42. [Google Scholar] [CrossRef]
- Uchida, Y.; Ito, K.; Ohtsuki, S.; Kubo, Y.; Suzuki, T.; Terasaki, T. Major involvement of Na(+)-dependent multivitamin transporter (SLC5A6/SMVT) in uptake of biotin and pantothenic acid by human brain capillary endothelial cells. J. Neurochem. 2015, 134, 97–112. [Google Scholar] [CrossRef]
- Hayflick, S.J. Defective pantothenate metabolism and neurodegeneration. Biochem. Soc. Trans. 2014, 42, 1063–1068. [Google Scholar] [CrossRef]
- Ching, K.H.; Westaway, S.K.; Gitschier, J.; Higgins, J.J.; Hayflick, S.J. HARP syndrome is allelic with pantothenate kinase-associated neurodegeneration. Neurology 2002, 58, 1673–1674. [Google Scholar] [CrossRef]
- Hayflick, S.J.; Westaway, S.K.; Levinson, B.; Zhou, B.; Johnson, M.A.; Ching, K.H.; Gitschier, J. Genetic, clinical, and radiographic delineation of Hallervorden–Spatz syndrome. New Engl. J. Med. 2003, 348, 33–40. [Google Scholar] [CrossRef]
- Kennedy, D.O. B Vitamins and the brain: mechanisms, dose and efficacy—A review. Nutrients 2016, 8, 68. [Google Scholar] [CrossRef]
- Zhou, Z.H.; McCarthy, D.B.; O’Connor, C.M.; Reed, L.J.; Stoops, J.K. The remarkable structural and functional organization of the eukaryotic pyruvate dehydrogenase complexes. Proc. Acad. Sci. 2001, 98, 14802–14807. [Google Scholar] [CrossRef]
- Daugherty, M. Complete reconstitution of the human coenzyme A biosynthetic pathway via comparative genomics. J. Biol. Chem. 2002, 277, 21431–21439. [Google Scholar] [CrossRef]
- Venco, P.; Dusi, S.; Valletta, L.; Tiranti, V. Alteration of the coenzyme A biosynthetic pathway in neurodegeneration with brain iron accumulation syndromes. Biochem. Soc. Trans. 2014, 42, 1069–1074. [Google Scholar] [CrossRef]
- Ferri, C.P.; Prince, M.; Brayne, C.; Brodaty, H.; Fratiglioni, L.; Ganguli, M.; Hall, K.; Hasegawa, K.; Hendrie, H.; Huang, Y.; et al. Global prevalence of dementia: A Delphi consensus study. Lancet 2005, 366, 2112–2117. [Google Scholar] [CrossRef]
- Cummings, J.L.; Morstorf, T.; Zhong, K. Alzheimer’s disease drug-development pipeline: Few candidates, frequent failures. Alzheimer’s Ther. 2014, 6, 37. [Google Scholar] [CrossRef]
- Gibson, G.E.; Hirsch, J.A.; Fonzetti, P.; Jordon, B.D.; Cirio, R.T.; Elder, J. Vitamin B1 (thiamine) and dementia. Ann. N. Y. Acad. Sci. 2016, 1367, 21–30. [Google Scholar] [CrossRef]
- Morris, M.C.; Evans, D.A.; Bienias, J.L.; Scherr, P.A.; Tangney, C.C.; Hebert, L.E.; Bennett, D.A.; Wilson, R.S.; Aggarwal, N. Dietary niacin and the risk of incident Alzheimer’s disease and of cognitive decline. J. Neurol. Neurosurg. Psychiatry 2004, 75, 1093–1099. [Google Scholar] [CrossRef]
- Malouf, R.; Grimley Evans, J. Folic acid with or without vitamin B12 for the prevention and treatment of healthy elderly and demented people. Cochrane Database Syst. Rev. 2008, 8, CD004514. [Google Scholar] [CrossRef]
- Reynolds, E.H. Folic acid, ageing, depression, and dementia. Br. Med. J. 2002, 324, 1512–1515. [Google Scholar] [CrossRef]
- Burr, G.O.; Burr, M.M. On the nature and role of the fatty acids essential in nutrition. J. Biol. Chem. 1930, 86, 587–621. [Google Scholar] [CrossRef]
- Spector, A.A.; Kim, H.-Y. Discovery of essential fatty acids. J. Lipid. Res. 2015, 56, 11–21. [Google Scholar] [CrossRef]
- Bourre, J.M.; Francois, M.; Youyou, A.; Dumont, O.; Piciotti, M.; Pascal, G.; Durand, G. The effects of dietary alpha-linolenic acid on the composition of nerve membranes, enzymatic activity, amplitude of electrophysiological parameters, resistance to poisons and performance of learning tasks in rats. J. Nutr. 1989, 119, 1880–1892. [Google Scholar] [CrossRef]
- Clarke, R.; Bennett, D.; Parish, S.; Lewington, S.; Skeaff, M.; Eussen, S.J.P.M.; Lewerin, C.; Stott, D.J.; Armitage, J.; Hankey, G.J.; et al. Effects of homocysteine lowering with B vitamins on cognitive aging: Meta-analysis of 11 trials with cognitive data on 22,000 individuals. Am. J. Clin. Nutr. 2014, 100, 657–666. [Google Scholar] [CrossRef]
- Tiwari, R.; Tiwari, G. Bioanalytical method validation: An updated review. Pharm. Methods 2010, 1, 25–38. [Google Scholar] [CrossRef]
- T’Kindt, R.; Jankevics, A.; Scheltema, R.A.; Zheng, L.; Watson, D.G.; Dujardin, J.-C.; Breitling, R.; Coombs, G.H.; Decuypere, S. Towards an unbiased metabolic profiling of protozoan parasites: Optimisation of a Leishmania sampling protocol for HILIC-orbitrap analysis. Anal. Bioanal. Chem. 2010, 398, 2059–2069. [Google Scholar] [CrossRef]
- Draghici, S.; Khatri, P.; Eklund, A.C.; Szallasi, Z. Reliability and reproducibility issues in DNA microarray measurements. Nat. Genet. 2006, 22, 101–109. [Google Scholar] [CrossRef]
- Wiesel, F.A.; Sedvall, G. Post-mortal changes of dopamine and homovanillic acid levels in rat striatum as measured by mass fragmentography. Brain Res. 1974, 65, 547–550. [Google Scholar] [CrossRef]
- Moleman, P.; Bruinvels, J.; Westerink, B.H.C. Rapid post mortem changes in 3,4-dihydroxyphenylacetic acid (DOPAC), a dopamine metabolite, in rat striatum. J. Neurochem. 1977, 29, 175–177. [Google Scholar] [CrossRef]
- Roubein, I.F.; Embree, L.J. Post mortem stability of catecholamines in discrete regions of rat brain. Commun. Chem. Pathol. Pharmacol. 1979, 23, 143–153. [Google Scholar]
- McIntyre, I.M.; Stanley, M. Postmortem and Regional Changes of Serotonin, 5-Hydroxyindoleacetic Acid, and Tryptophan in Brain. J. Neurochem. 1984, 42, 1588–1592. [Google Scholar] [CrossRef]
- Miller, J.A.; Guillozet-Bongaarts, A.; Gibbons, L.E.; Postupna, N.; Renz, A.; Beller, A.E.; Sunkin, S.M.; Ng, L.; Rose, S.E.; Smith, K.A.; et al. Neuropathological and transcriptomic characteristics of the aged brain. Elife 2017, 6, e31126. [Google Scholar] [CrossRef]
- Labadorf, A.T.; Myers, R.H. Evidence of extensive alternative splicing in post mortem human brain HTT transcription by mRNA sequencing. PLOS ONE 2015, 10, e0141298. [Google Scholar] [CrossRef]
- Cheng, L.L.; Chang, I.W.; Louis, D.N.; Gonzalez, R.G. Correlation of high-resolution magic angle spinning proton magnetic resonance spectroscopy with histopathology of intact human brain tumor specimens. Cancer Res. 1998, 58, 1825–1832. [Google Scholar]
- Opstad, K.S.; Bell, B.A.; Griffiths, J.R.; Howe, F.A. An assessment of the effects of sample ischaemia and spinning time on the metabolic profile of brain tumour biopsy specimens as determined by high-resolution magic angle spinning [1H]NMR. NMR Biomed. 2008, 21, 1138–1147. [Google Scholar] [CrossRef]
- Fu, X.; Giavalisco, P.; Liu, X.; Catchpole, G.; Fu, N.; Ning, Z.-B.; Guo, S.; Yan, Z.; Somel, M.; Pääbo, S.; et al. Rapid metabolic evolution in human prefrontal cortex. Proc. Natl. Acad. Sci. USA 2011, 108, 6181–6186. [Google Scholar] [CrossRef]
- Ivanisevic, J.; Epstein, A.A.; Kurczy, M.E.; Benton, P.H.; Uritboonthai, W.; Fox, H.S.; Boska, M.D.; Gendelman, H.E.; Siuzdak, G.; Benton, H.P. Brain region mapping using global metabolomics. Chem. Biol. 2014, 21, 1575–1584. [Google Scholar] [CrossRef]
- Kao, C.-Y.; Anderzhanova, E.; Asara, J.M.; Wotjak, C.T.; Turck, C.W. NextGen Brain Microdialysis: Applying modern metabolomics technology to the analysis of extracellular fluid in the central nervous system. Mol. Neuropsychiatry 2015, 1, 60–67. [Google Scholar] [CrossRef]
- Gaura, V.; Lavisse, S.; Payoux, P.; Goldman, S.; Verny, C.; Krystkowiak, P.; Damier, P.; Supiot, F.; Bachoud-Levi, A.-C.; Remy, P. Association between motor symptoms and brain metabolism in early Huntington disease. JAMA Neurol. 2017, 74, 1088–1096. [Google Scholar] [CrossRef]
- Kreilaus, F.; Spiro, A.S.; Hannan, A.J.; Garner, B.; Jenner, A.M. Brain cholesterol synthesis and metabolism is progressively disturbed in the R6/1 mouse model of Huntington’s disease: A targeted GC-MS/MS sterol analysis. J. Huntington’s Dis. 2015, 4, 305–318. [Google Scholar] [CrossRef]
- Naseri, N.N.; Xu, H.; Bonica, J.; Vonsattel, J.P.G.; Cortes, E.P.; Park, L.C.; Arjomand, J.; Gibson, G.E. Abnormalities in the tricarboxylic acid cycle in Huntington disease and in a Huntington disease mouse model. J. Neuropathol. Exp. Neurol. 2015, 74, 527–537. [Google Scholar] [CrossRef]
- Naseri, N.N.; Bonica, J.; Xu, H.; Park, L.C.; Arjomand, J.; Chen, Z.; Gibson, G.E. Novel metabolic abnormalities in the tricarboxylic acid cycle in peripheral cells form Huntington’s disease patients. PLoS ONE 2016, 11, e0160384. [Google Scholar] [CrossRef]
- Houlden, H.; Lincoln, S.; Farrer, M.; Cleland, P.; Hardy, J.; Orrell, R. Compound heterozygous PANK2 mutations confirm HARP and Hallervorden-Spatz syndromes are allelic. Neurology 2003, 61, 1423–1426. [Google Scholar] [CrossRef]
- Jung, H.H.; Danek, A.; Walker, R.H. Neuroacanthocytosis syndromes. Orphanet J. Rare Dis. 2011, 6, 68. [Google Scholar] [CrossRef]
- Bartzokis, G.; Cummings, J.; Perlman, S.; Hance, D.B.; Mintz, J. Increased basal ganglia iron levels in Huntington disease. Arch. Neurol. 1999, 56, 569. [Google Scholar] [CrossRef]
- Schipper, H.M. Neurodegeneration with brain iron accumulation—Clinical symptoms and neuroimaging. Biochim. Biophys. Acta 2012, 1822, 350–360. [Google Scholar]
- Shurubor, Y.I.; D’Aurelio, M.; Clark-Matott, J.; Isakova, E.P.; Deryabina, Y.I.; Beal, M.F.; Cooper, A.J.L.; Krasnikov, B.F. Determination of coenzyme A and acetyl-coenzyme A in biological samples using HPLC with UV detection. Molecules 2017, 22, 1388. [Google Scholar] [CrossRef]
- Meijer, A.J.; Lamers, W.H.; Chamuleau, R.A. Nitrogen metabolism and ornithine cycle function. Physiol. Rev. 1990, 70, 701–748. [Google Scholar] [CrossRef]
- Anand, U.; Anand, C. Connecting links between the urea cycle and the TCA cycle: A Tutorial exercise. Biochem. Educ. 1999, 27, 153–154. [Google Scholar] [CrossRef]
- Alexander, G.E.; Delong, M.R.; Strick, P.L. Parallel organization of functionally segregated circuits linking basal ganglia and cortex. Annu. Rev. Neurosci. 1986, 9, 357–381. [Google Scholar] [CrossRef]
- Tippett, L.J.; Waldvogel, H.J.; Snell, R.G.; Vonsattel, J.P.; Young, A.B.; Faull, R.L.M. The complexity of clinical Huntington’s disease: Developments in molecular genetics, neuropathology and neuroimaging biomarkers. Adv. Neurobiol. 2017, 15, 129–161. [Google Scholar]
- Tabrizi, S.J.; Reilmann, R.; Roos, R.A.; Durr, A.; Leavitt, B.; Owen, G.; Jones, R.; Johnson, H.; Craufurd, D.; Hicks, S.L.; et al. Potential endpoints for clinical trials in premanifest and early Huntington’s disease in the TRACK-HD study: Analysis of 24 month observational data. Lancet Neurol. 2012, 11, 42–53. [Google Scholar] [CrossRef]
- Vishwanath, V.A. Fatty acid beta-oxidation disorders: A Brief review. Ann. Neurosci. 2016, 23, 51–55. [Google Scholar] [CrossRef]
- Hodges, R.E.; Ohlson, M.A.; Bean, W.B. Pantothenic acid deficiency in man. J. Clin. Investig. 1958, 37, 1642–1657. [Google Scholar] [CrossRef]
- Quick, M.; Shi, L. The sodium/multivitamin transporter (SMVT): A multipotent system with therapeutic implications. Vitam. Horm. 2015, 98, 63–100. [Google Scholar]
- Spector, R.; Sivesind, C.; Kinzenbaw, D. Pantothenic acid transport through the blood-brain barrier. J. Neurochem. 1986, 47, 966–971. [Google Scholar] [CrossRef]
- Ghosal, A.; Lambrecht, N.; Subramanya, S.B.; Kapadia, R.; Said, H.M. Conditional knockout of the Slc5a6 gene in mouse intestine impairs biotin absorption. Am. J. Physiol. Gastrointest. Liver Physiol. 2013, 304, G64–G71. [Google Scholar] [CrossRef]
- Subramanian, V.S.; Constantinescu, A.R.; Benke, P.J.; Said, H.M. Mutations in SLC5A6 associated with brain, immune, bone and intestinal dysfunction in a young child. Hum. Genet. 2017, 136, 253–261. [Google Scholar] [CrossRef]
- Roskoski, R.J. Choline acetyltransferase. Inhibition by thiol reagents. J. Biol. Chem. 1973, 249, 2156–2159. [Google Scholar]
- Crossland, J.; Slater, P. The effect of some drugs on the “free” and “bound” acetylcholine content of rat brain. Br. J. Pharmacol. Chemother. 1968, 33, 42–47. [Google Scholar] [CrossRef]
- Weihe, E.; Tao-Cheng, J.H.; Schafer, M.K.; Erickson, J.D.; Eiden, L.E. Visualization of the vesicular acetylcholine transporter in cholinergic nerve terminals and its targeting to a specific population of small synaptic vesicles. Proc. Natl. Acad. Sci. USA 1996, 93, 3547–3552. [Google Scholar] [CrossRef]
- Mariño, G.; Pietrocola, F.; Eisenberg, T.; Kong, Y.; Malik, S.A.; Andryushkova, A.; Schroeder, S.; Pendl, T.; Harger, A.; Niso-Santano, M.; et al. Regulation of autophagy by cytosolic acetyl-coenzyme A. Mol. Cell 2014, 53, 710–725. [Google Scholar] [CrossRef]
- McDonnell, E.; Crown, S.B.; Fox, D.B.; Kitir, B.; Ilkayeva, O.R.; Olsen, C.A.; Grimsrud, P.A.; Hirschey, M.D. Lipids reprogram metabolism to become a major carbon source for histone acetylation. Cell Rep. 2016, 17, 1463–1472. [Google Scholar] [CrossRef]
- Dunn, W.B.; The Human Serum Metabolome (HUSERMET) Consortium; Broadhurst, D.; Begley, P.; Zelená, E.; Francis-McIntyre, S.; Anderson, N.; Brown, M.; Knowles, J.D.; Halsall, A.; et al. Procedures for large-scale metabolic profiling of serum and plasma using gas chromatography and liquid chromatography coupled to mass spectrometry. Nat. Protoc. 2011, 6, 1060–1083. [Google Scholar]
- Ioannidis, J.P.A. Why most published research findings are false. PLoS Med. 2005, 2, e124. [Google Scholar] [CrossRef]
- Button, K.S.; Ioannidis, J.P.A.; Mokrysz, C.; Nosek, B.A.; Flint, J.; Robinson, E.S.J.; Munafò, M.R. Power failure: Why small sample size undermines the reliability of neuroscience. Nat. Rev. Neurosci. 2013, 14, 365–376. [Google Scholar] [CrossRef]
- Di Meo, I.; Carecchio, M.; Tiranti, V. Inborn errors of coenzyme A metabolism and neurodegeneration. J. Inherit. Metab. 2018, 1–7. [Google Scholar] [CrossRef]
- Begley, P.; Francis-McIntyre, S.; Dunn, W.B.; Broadhurst, D.I.; Halsall, A.; Tseng, A.; Knowles, J.; Goodacre, R.; Kell, D.B. Development and performance of a gas chromatography–time-of-flight mass spectrometry analysis for large-scale nontargeted metabolomic studies of human serum. Anal. Chem. 2009, 81, 7038–7046. [Google Scholar] [CrossRef]
- Poole, C.F. Alkylsilyl derivatives for gas chromatography. J. Chromatogr. A 2013, 1296, 2–14. [Google Scholar] [CrossRef]
- Xu, J.; Church, S.J.; Patassini, S.; Begley, P.; Waldvogel, H.J.; Curtis, M.A.; Faull, R.L.M.; Unwin, R.D.; Cooper, G.J.S. Evidence for widespread, severe brain copper deficiency in Alzheimer’s dementia. Metallomics 2017, 9, 1106–1119. [Google Scholar] [CrossRef] [PubMed]
- Benjamini, Y.; Hochberg, Y. Controlling the False Discovery Rate: A practical and powerful approach to multiple testing. J. Stat. Soc. Ser. B (Stat. Methodol.) 1995, 57, 289–300. [Google Scholar] [CrossRef]


| Variable | Controls | HD |
|---|---|---|
| Number | 19 | 30 |
| Age (y; ±95% CI) | 61.1 (54.1–68.0) | 58.9 (54.8–63.1) |
| PMD (h; ±95% CI) | 17.7 (14.8–20.7) | 14.7 (11.8–17.5) |
| Brain-weight (g; ±95% CI) | 1327.4 (1283.5–1371.3) | 1091.4 (1032.2–1150.7) * |
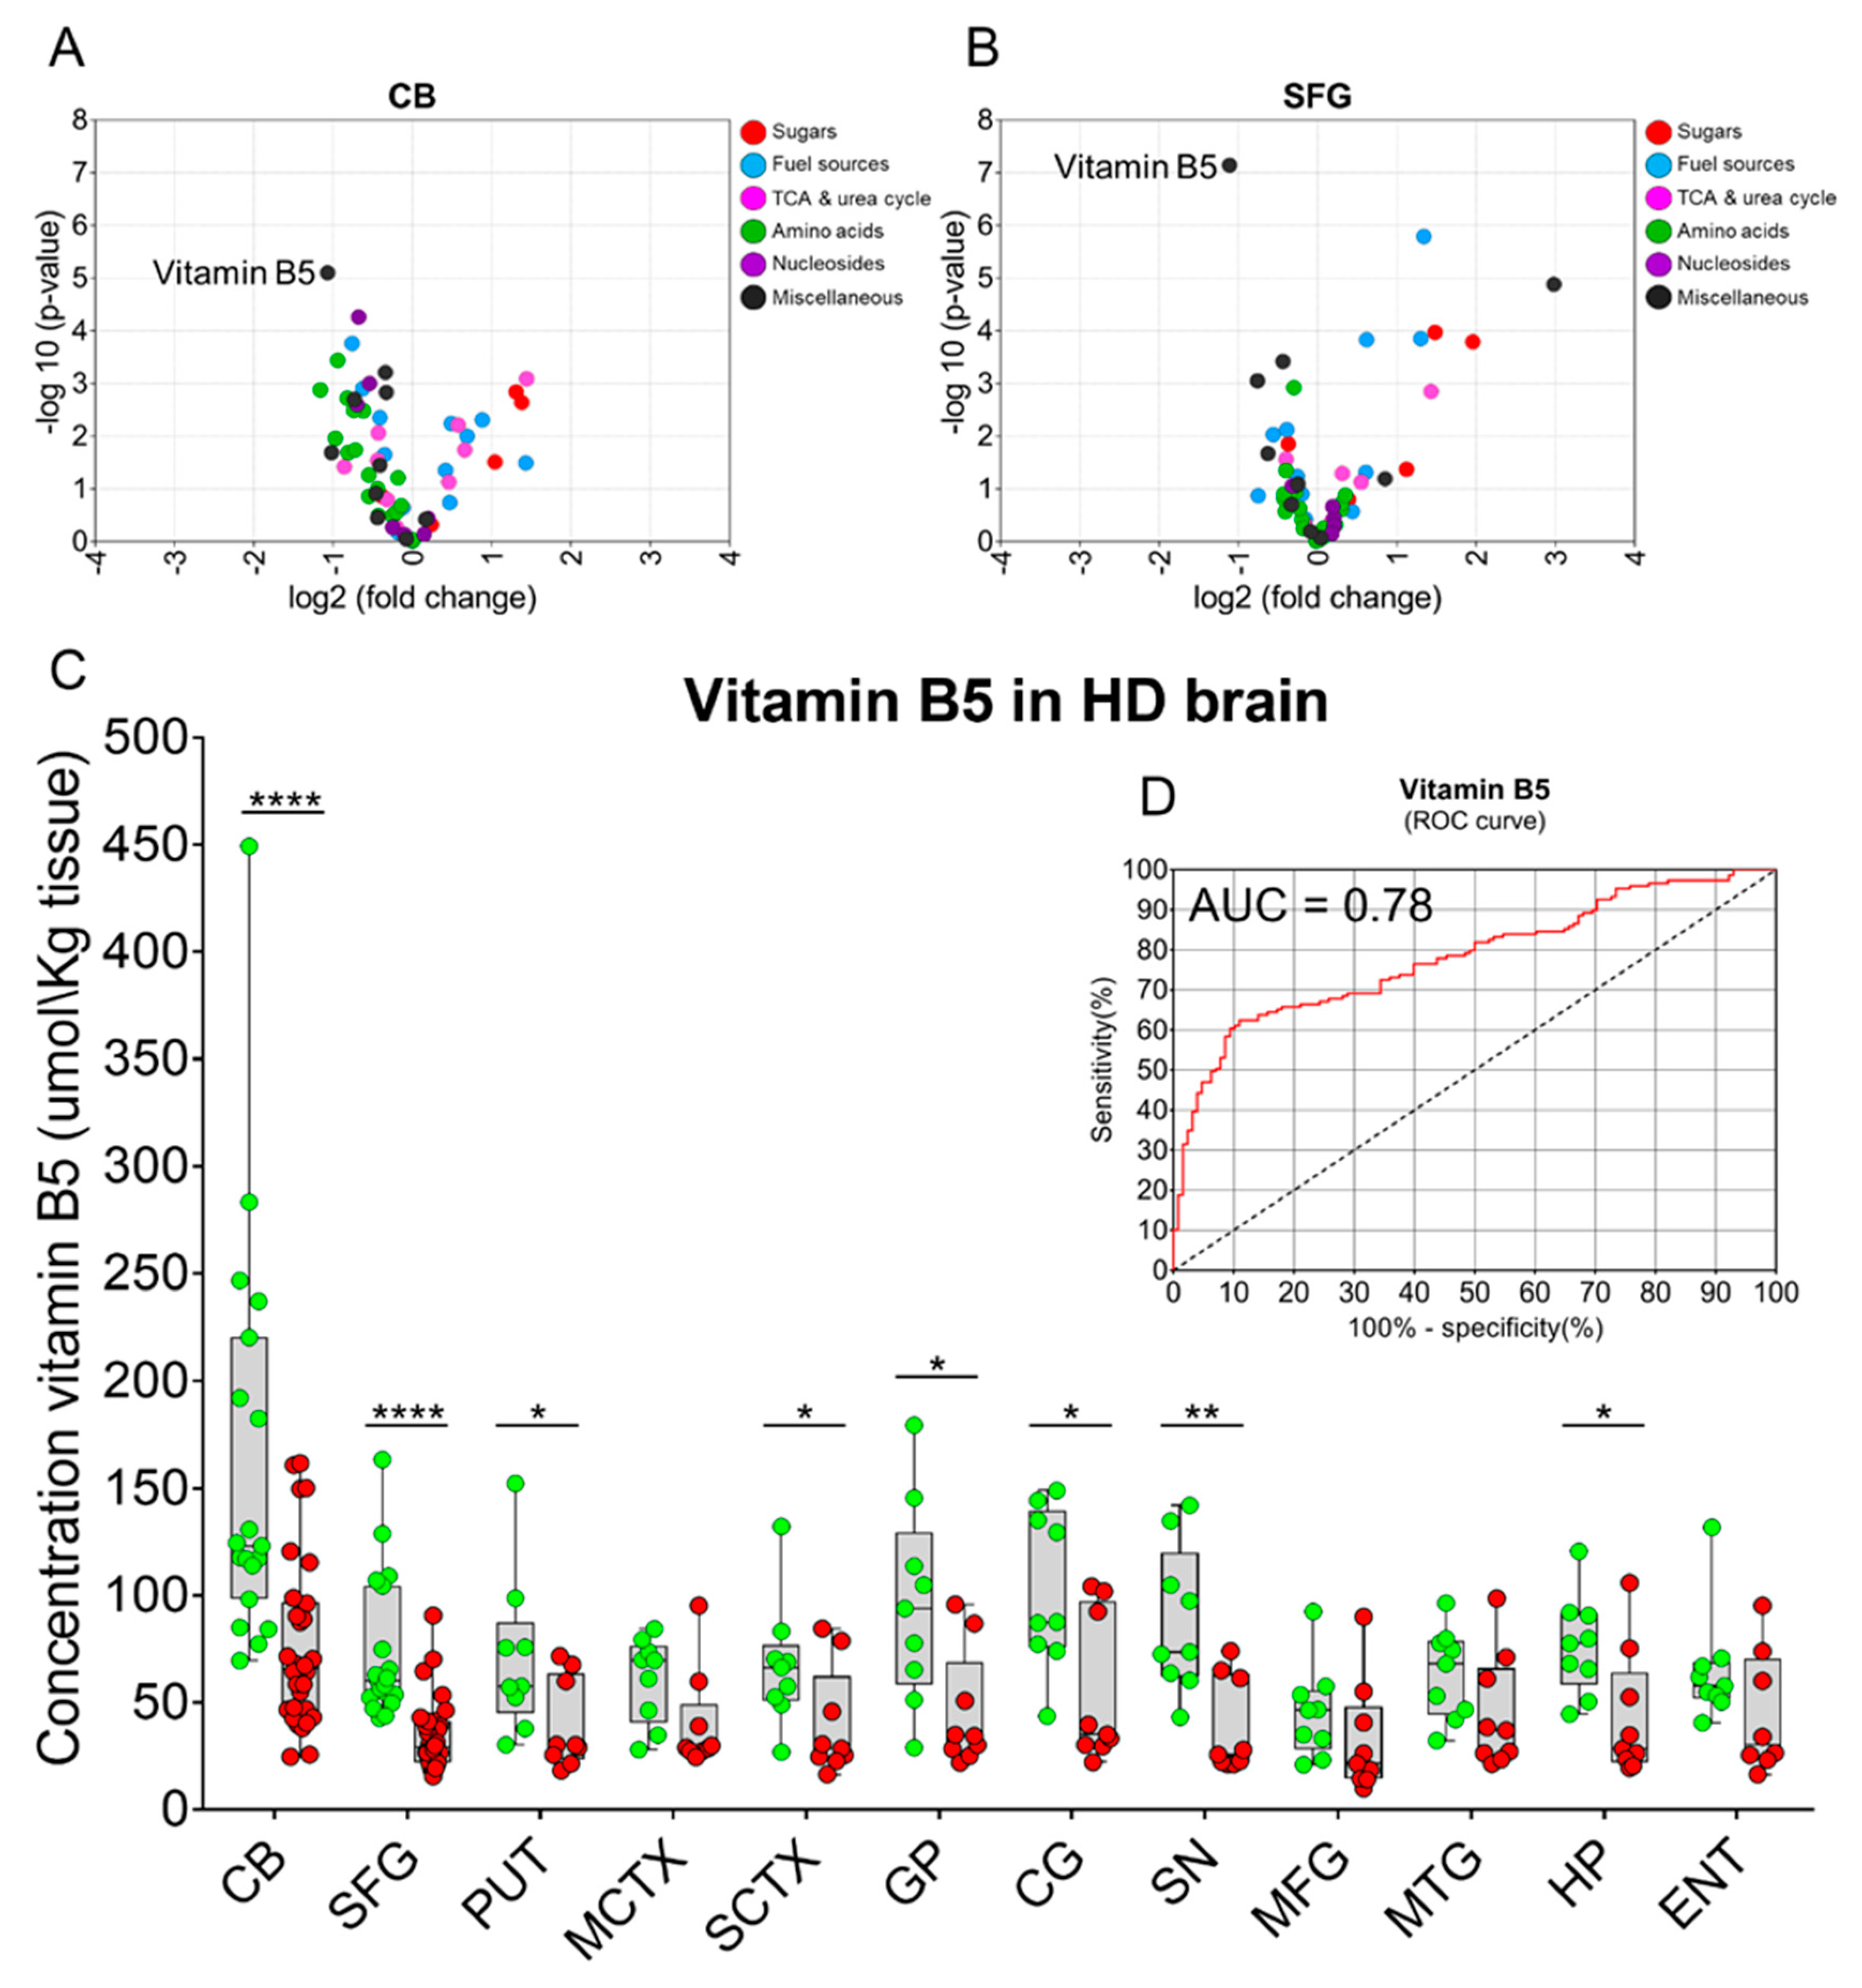
| Brain Region | Vitamin B5 Control (µmol/kg Tissue) | Vitamin B5 HD (µmol/kg Tissue) | p-Values | Fold-Change (HD vs. Control) |
|---|---|---|---|---|
| CB | 161.7 (116.4–206.9) | 76.6 (61.7–91.4) | 6.2 × 10⁻⁵ | 0.5 |
| SFG | 73.6 (57.6–89.6) | 34.7 (28.4–41.1) | 2.0 × 10⁻⁶ | 0.5 |
| PUT | 71.0 (42.6–99.3) | 39.5 (23.4–55.5) | 0.041 | 0.6 |
| MCTX | 60.9 (45.6–76.3) | 40.2 (22.3–58.1) | 0.060 | 0.7 |
| SCTX | 67.5 (45.2–89.9) | 39.8 (20.5–59.1) | 0.046 | 0.6 |
| GP | 95.7 (59.7–131.7) | 45.5 (24.4–66.5) | 0.013 | 0.5 |
| CG | 103.2 (74.6–131.8) | 54.4 (28.0–80.8) | 0.011 | 0.5 |
| SN | 88.1 (61.9–114.3) | 38.1 (21.2–55.0) | 0.002 | 0.4 |
| MFG | 45.6 (28.9–62.2) | 32.4 (12.4–52.4) | 0.262 | 0.7 |
| MTG | 63.5 (47.4–79.6) | 45.1 (24.7–65.4) | 0.121 | 0.7 |
| HP | 76.7 (58.9–94.5) | 43.1 (20.2–66.0) | 0.017 | 0.6 |
| ENT | 65.4 (45.1–85.8) | 44.4 (20.6–68.3) | 0.137 | 0.7 |
| Mean | 86.8 (76.9–96.7) | 47.63 (43.1–53.4) | 3.831 × 10⁻¹² | 0.5 |
© 2019 by the authors. Licensee MDPI, Basel, Switzerland. This article is an open access article distributed under the terms and conditions of the Creative Commons Attribution (CC BY) license (http://creativecommons.org/licenses/by/4.0/).
Share and Cite
Patassini, S.; Begley, P.; Xu, J.; Church, S.J.; Kureishy, N.; Reid, S.J.; Waldvogel, H.J.; Faull, R.L.M.; Snell, R.G.; Unwin, R.D.; et al. Cerebral Vitamin B5 (D-Pantothenic Acid) Deficiency as a Potential Cause of Metabolic Perturbation and Neurodegeneration in Huntington’s Disease. Metabolites 2019, 9, 113. https://doi.org/10.3390/metabo9060113
Patassini S, Begley P, Xu J, Church SJ, Kureishy N, Reid SJ, Waldvogel HJ, Faull RLM, Snell RG, Unwin RD, et al. Cerebral Vitamin B5 (D-Pantothenic Acid) Deficiency as a Potential Cause of Metabolic Perturbation and Neurodegeneration in Huntington’s Disease. Metabolites. 2019; 9(6):113. https://doi.org/10.3390/metabo9060113
Chicago/Turabian StylePatassini, Stefano, Paul Begley, Jingshu Xu, Stephanie J. Church, Nina Kureishy, Suzanne J. Reid, Henry J. Waldvogel, Richard L. M. Faull, Russell G. Snell, Richard D. Unwin, and et al. 2019. "Cerebral Vitamin B5 (D-Pantothenic Acid) Deficiency as a Potential Cause of Metabolic Perturbation and Neurodegeneration in Huntington’s Disease" Metabolites 9, no. 6: 113. https://doi.org/10.3390/metabo9060113
APA StylePatassini, S., Begley, P., Xu, J., Church, S. J., Kureishy, N., Reid, S. J., Waldvogel, H. J., Faull, R. L. M., Snell, R. G., Unwin, R. D., & Cooper, G. J. S. (2019). Cerebral Vitamin B5 (D-Pantothenic Acid) Deficiency as a Potential Cause of Metabolic Perturbation and Neurodegeneration in Huntington’s Disease. Metabolites, 9(6), 113. https://doi.org/10.3390/metabo9060113