Characterization of Bulk Phosphatidylcholine Compositions in Human Plasma Using Side-Chain Resolving Lipidomics

 , , , , ,
  , ,
, ,  and
and
Abstract
1. Introduction
2. Results
2.1. Qualitative Composition of Phosphatidylcholine Sums
2.2. Quantitative Composition of Phosphatidylcholine Sums
2.3. Replication of Quantitative Compositions
2.4. Estimation of the Contribution of Non-Measured Constituents in Phosphatidylcholine Sums
3. Discussion
3.1. Limitations
3.2. Conclusions
4. Materials and Methods
4.1. Human Plasma Samples
4.2. Phosphatidylcholine Quantification on the Lipid Species Level (AbsoluteIDQTM p150 kit)
4.3. Phosphatidylcholine Quantification on the Fatty Acid Level (LipidyzerTM)
4.4. Qualitative Description of Phosphatidylcholine Sums
4.5. Quantitative Estimation of Phosphatidylcholine Sum Composition
4.6. Replication of Estimated Quantitative Phosphatidylcholine Compositions in an Independent Cohort
4.7. Variation of Estimated Phosphatidylcholine Compositions Between Subjects and Challenges
4.8. Estimation of Unmapped Part of Phosphatidylcholine Sums
Supplementary Materials
Author Contributions
Funding
Acknowledgments
Conflicts of Interest
References
- Van Meer, G.; Voelker, D.R.; Feigenson, G.W. Membrane lipids: Where they are and how they behave. Nat. Rev. Mol. Cell Biol. 2008, 9, 112–124. [Google Scholar] [CrossRef] [PubMed]
- Leidl, K.; Liebisch, G.; Richter, D.; Schmitz, G. Mass spectrometric analysis of lipid species of human circulating blood cells. Biochim. Biophys. Acta Mol. Cell Biol. Lipids 2008, 1781, 655–664. [Google Scholar] [CrossRef] [PubMed]
- Cole, L.K.; Vance, J.E.; Vance, D.E. Phosphatidylcholine biosynthesis and lipoprotein metabolism. Biochim. Biophys. Acta Mol. Cell Biol. Lipids 2012, 1821, 754–761. [Google Scholar] [CrossRef] [PubMed]
- Van der Veen, J.N.; Kennelly, J.P.; Wan, S.; Vance, J.E.; Vance, D.E.; Jacobs, R.L. The critical role of phosphatidylcholine and phosphatidylethanolamine metabolism in health and disease. Biochim. Biophys. Acta Biomembr. 2017, 1859, 1558–1572. [Google Scholar] [CrossRef] [PubMed]
- Abe, M.; Sawada, Y.; Uno, S.; Chigasaki, S.; Oku, M.; Sakai, Y.; Miyoshi, H. Role of Acyl Chain Composition of Phosphatidylcholine in Tafazzin-Mediated Remodeling of Cardiolipin in Liposomes. Biochemistry 2017, 56, 6268–6280. [Google Scholar] [CrossRef] [PubMed]
- Nagahama, M.; Otsuka, A.; Oda, M.; Singh, R.K.; Ziora, Z.M.; Imagawa, H.; Nishizawa, M.; Sakurai, J. Effect of unsaturated bonds in the sn-2 acyl chain of phosphatidylcholine on the membrane-damaging action of Clostridium perfringens alpha-toxin toward liposomes. Biochim. Biophys. Acta Biomembr. 2007, 1768, 2940–2945. [Google Scholar] [CrossRef] [PubMed]
- Raclot, T.; Holm, C.; Langin, D. Fatty acid specificity of hormone-sensitive lipase: Implication in the selective hydrolysis of triacylglycerols. J. Lipid Res. 2001, 42, 2049–2057. [Google Scholar]
- Simopoulos, A.P. The Importance of the Omega-6/Omega-3 Fatty Acid Ratio in Cardiovascular Disease and Other Chronic Diseases. Exp. Biol. Med. 2008, 233, 674–688. [Google Scholar] [CrossRef]
- Whiley, L.; Sen, A.; Heaton, J.; Proitsi, P.; García-Gómez, D.; Leung, R.; Smith, N.; Thambisetty, M.; Kloszewska, I.; Mecocci, P.; et al. Evidence of altered phosphatidylcholine metabolism in Alzheimer’s disease. Neurobiol. Aging 2014, 35, 271–278. [Google Scholar] [CrossRef]
- Toledo, J.B.; Arnold, M.; Kastenmüller, G.; Chang, R.; Baillie, R.A.; Han, X.; Thambisetty, M.; Tenenbaum, J.D.; Suhre, K.; Thompson, J.W.; et al. Metabolic network failures in Alzheimer’s disease: A biochemical road map. Alzheimers Dement. 2017, 13, 965–984. [Google Scholar] [CrossRef]
- Floegel, A.; Stefan, N.; Yu, Z.; Mühlenbruch, K.; Drogan, D.; Joost, H.-G.; Fritsche, A.; Häring, H.-U.; Hrabě de Angelis, M.; Peters, A.; et al. Identification of Serum Metabolites Associated With Risk of Type 2 Diabetes Using a Targeted Metabolomic Approach. Diabetes 2013, 62, 639–648. [Google Scholar] [CrossRef] [PubMed]
- Suhre, K.; Meisinger, C.; Döring, A.; Altmaier, E.; Belcredi, P.; Gieger, C.; Chang, D.; Milburn, M.V.; Gall, W.E.; Weinberger, K.M.; et al. Metabolic Footprint of Diabetes: A Multiplatform Metabolomics Study in an Epidemiological Setting. PLoS ONE 2010, 5, e13953. [Google Scholar] [CrossRef] [PubMed]
- Kulkarni, H.; Mamtani, M.; Wong, G.; Weir, J.M.; Barlow, C.K.; Dyer, T.D.; Almasy, L.; Mahaney, M.C.; Comuzzie, A.G.; Duggirala, R.; et al. Genetic correlation of the plasma lipidome with type 2 diabetes, prediabetes and insulin resistance in Mexican American families. BMC Genet. 2017, 18, 48. [Google Scholar] [CrossRef] [PubMed]
- Meikle, P.J.; Christopher, M.J. Lipidomics is providing new insight into the metabolic syndrome and its sequelae. Curr. Opin. Lipidol. 2011, 22, 210–215. [Google Scholar] [CrossRef] [PubMed]
- Draisma, H.H.M.; Pool, R.; Kobl, M.; Jansen, R.; Petersen, A.-K.; Vaarhorst, A.A.M.; Yet, I.; Haller, T.; Demirkan, A.; Esko, T.; et al. Genome-wide association study identifies novel genetic variants contributing to variation in blood metabolite levels. Nat. Commun. 2015, 6, 7208. [Google Scholar] [CrossRef] [PubMed]
- Lario, S.; Ramírez-Lázaro, M.J.; Sanjuan-Herráez, D.; Brunet-Vega, A.; Pericay, C.; Gombau, L.; Junquera, F.; Quintás, G.; Calvet, X. Plasma sample based analysis of gastric cancer progression using targeted metabolomics. Sci. Rep. 2017, 7, 17774. [Google Scholar] [CrossRef]
- Liebisch, G.; Vizcaíno, J.A.; Köfeler, H.; Trötzmüller, M.; Griffiths, W.J.; Schmitz, G.; Spener, F.; Wakelam, M.J.O. Shorthand notation for lipid structures derived from mass spectrometry. J. Lipid Res. 2013, 54, 1523–1530. [Google Scholar] [CrossRef]
- Fahy, E.; Subramaniam, S.; Murphy, R.C.; Nishijima, M.; Raetz, C.R.H.; Shimizu, T.; Spener, F.; van Meer, G.; Wakelam, M.J.O.; Dennis, E.A. Update of the LIPID MAPS comprehensive classification system for lipids. J. Lipid Res. 2009, 50, S9–S14. [Google Scholar] [CrossRef]
- Siskos, A.P.; Jain, P.; Römisch-Margl, W.; Bennett, M.; Achaintre, D.; Asad, Y.; Marney, L.; Richardson, L.; Koulman, A.; Griffin, J.L.; et al. Interlaboratory Reproducibility of a Targeted Metabolomics Platform for Analysis of Human Serum and Plasma. Anal. Chem. 2017, 89, 656–665. [Google Scholar] [CrossRef]
- Yet, I.; Menni, C.; Shin, S.-Y.; Mangino, M.; Soranzo, N.; Adamski, J.; Suhre, K.; Spector, T.D.; Kastenmüller, G.; Bell, J.T. Genetic Influences on Metabolite Levels: A Comparison across Metabolomic Platforms. PLoS ONE 2016, 11, e0153672. [Google Scholar] [CrossRef]
- Wang-Sattler, R.; Yu, Z.; Herder, C.; Messias, A.C.; Floegel, A.; He, Y.; Heim, K.; Campillos, M.; Holzapfel, C.; Thorand, B.; et al. Novel biomarkers for pre-diabetes identified by metabolomics. Mol. Syst. Biol. 2012, 8, 615. [Google Scholar] [CrossRef] [PubMed]
- Available online: https://www.biocrates.com/images/List-of-Isobaric-and-Isomeric-Lipid-Species_v1_2018.pdf (accessed on 1 December 2018).
- Krug, S.; Kastenmüller, G.; Stückler, F.; Rist, M.J.; Skurk, T.; Sailer, M.; Raffler, J.; Römisch-Margl, W.; Adamski, J.; Prehn, C.; et al. The dynamic range of the human metabolome revealed by challenges. FASEB J. 2012, 26, 2607–2619. [Google Scholar] [CrossRef] [PubMed]
- Gieger, C.; Geistlinger, L.; Altmaier, E.; Hrabé de Angelis, M.; Kronenberg, F.; Meitinger, T.; Mewes, H.-W.; Wichmann, H.-E.; Weinberger, K.M.; Adamski, J.; et al. Genetics Meets Metabolomics: A Genome-Wide Association Study of Metabolite Profiles in Human Serum. PLoS Genet. 2008, 4, e1000282. [Google Scholar] [CrossRef] [PubMed]
- Illig, T.; Gieger, C.; Zhai, G.; Römisch-Margl, W.; Wang-Sattler, R.; Prehn, C.; Altmaier, E.; Kastenmüller, G.; Kato, B.S.; Mewes, H.-W.; et al. A genome-wide perspective of genetic variation in human metabolism. Nat. Genet. 2009, 42, 137. [Google Scholar] [CrossRef] [PubMed]
- Ried, J.S.; Shin, S.-Y.; Krumsiek, J.; Illig, T.; Theis, F.J.; Spector, T.D.; Adamski, J.; Wichmann, H.-E.; Strauch, K.; Soranzo, N.; et al. Novel genetic associations with serum level metabolites identified by phenotype set enrichment analyses. Hum. Mol. Genet. 2014, 23, 5847–5857. [Google Scholar] [CrossRef][Green Version]
- Trabado, S.; Al-Salameh, A.; Croixmarie, V.; Masson, P.; Corruble, E.; Fève, B.; Colle, R.; Ripoll, L.; Walther, B.; Boursier-Neyret, C.; et al. The human plasma-metabolome: Reference values in 800 French healthy volunteers; Impact of cholesterol, gender and age. PLoS ONE 2017, 12, e0173615. [Google Scholar] [CrossRef]
- Lau, C.-H.E.; Siskos, A.P.; Maitre, L. Determinants of the urinary and serum metabolome in children from six European populations. BMC Med. 2018, 16, 202. [Google Scholar] [CrossRef]
- Zukunft, S.; Prehn, C.; Röhring, C.; Möller, G.; Hrabě de Angelis, M.; Adamski, J.; Tokarz, J. High-throughput extraction and quantification method for targeted metabolomics in murine tissues. Metabolomics 2018, 14, 18. [Google Scholar] [CrossRef]
- Koal, T.; Klavins, K.; Seppi, D.; Kemmler, G.; Humpel, C. Sphingomyelin SM(d18:1/18:0) is significantly enhanced in cerebrospinal fluid samples dichotomized by pathological amyloid-β42, tau, and phospho-tau-181 levels. J. Alzheimers Dis. 2015, 44, 1193–1201. [Google Scholar] [CrossRef]
- Hagel, J.M.; Mandal, R.; Han, B.; Han, J.; Dinsmore, D.R.; Borchers, C.H.; Wishart, D.S.; Facchini, P.J. Metabolome analysis of 20 taxonomically related benzylisoquinoline alkaloid-producing plants. BMC Plant Biol. 2015, 15, 220. [Google Scholar] [CrossRef]
- Bouatra, S.; Aziat, F.; Mandal, R.; Guo, A.C.; Wilson, M.R.; Knox, C.; Bjorndahl, T.C.; Krishnamurthy, R.; Saleem, F.; Liu, P.; et al. The Human Urine Metabolome. PLoS ONE 2013, 8, e73076. [Google Scholar] [CrossRef]
- Turroni, S.; Fiori, J.; Rampelli, S.; Schnorr, S.L.; Consolandi, C.; Barone, M.; Biagi, E.; Fanelli, F.; Mezzullo, M.; Crittenden, A.N.; et al. Fecal metabolome of the Hadza hunter-gatherers: A host-microbiome integrative view. Sci. Rep. 2016, 6, 32826. [Google Scholar] [CrossRef]
- Jenkins, B.; West, J.A.; Koulman, A. A review of odd-chain fatty acid metabolism and the role of pentadecanoic acid (C15:0) and heptadecanoic acid (C17:0) in health and disease. Molecules 2015, 20, 2425–2444. [Google Scholar] [CrossRef]
- Marai, L.; Kuksis, A. Molecular species of lecithins from erythrocytes and plasma of man. J. Lipid Res. 1969, 10, 141–152. [Google Scholar]
- Bowden, J.A.; Heckert, A.; Ulmer, C.Z.; Jones, C.M.; Koelmel, J.P.; Abdullah, L.; Ahonen, L.; Alnouti, Y.; Armando, A.M.; Asara, J.M.; et al. Harmonizing lipidomics: NIST interlaboratory comparison exercise for lipidomics using SRM 1950–Metabolites in Frozen Human Plasma. J. Lipid Res. 2017, 58, 2275–2288. [Google Scholar] [CrossRef]
- Quehenberger, O.; Armando, A.M.; Brown, A.H.; Milne, S.B.; Myers, D.S.; Merrill, A.H.; Bandyopadhyay, S.; Jones, K.N.; Kelly, S.; Shaner, R.L.; et al. Lipidomics reveals a remarkable diversity of lipids in human plasma. J. Lipid Res. 2010, 51, 3299–3305. [Google Scholar] [CrossRef]
- Harayama, T.; Riezman, H. Understanding the diversity of membrane lipid composition. Nat. Rev. Mol. Cell Biol. 2018, 19, 281–296. [Google Scholar] [CrossRef]
- Mook-Kanamori, D.O.; Selim, M.M.E.-D.; Takiddin, A.H.; Al-Homsi, H.; Al-Mahmoud, K.A.S.; Al-Obaidli, A.; Zirie, M.A.; Rowe, J.; Yousri, N.A.; Karoly, E.D.; et al. 1,5-Anhydroglucitol in Saliva Is a Noninvasive Marker of Short-Term Glycemic Control. J. Clin. Endocrinol. Metab. 2014, 99, E479–E483. [Google Scholar] [CrossRef]
- Ubhi, B.K.; Conner, A.; Duchoslav, E.; Evans, A.; Robinson, R.; Wang, L.; Baker, P.R.; Watkins, S. AB SCIEX Technical Application Note, RUO-MKT-02-2871B; AB SCIEX: Framingham, MA, USA, 2016. [Google Scholar]
- Ubhi, B.K. AB SCIEX Technical Application Note, RUO-MKT-02-3879-A; AB SCIEX: Framingham, MA, USA, 2016. [Google Scholar]
- Baker, P.R.S.; Armando, A.M.; Campbell, J.L.; Quehenberger, O.; Dennis, E.A. Three-dimensional enhanced lipidomics analysis combining UPLC, differential ion mobility spectrometry, and mass spectrometric separation strategies. J. Lipid Res. 2014, 55, 2432–2442. [Google Scholar] [CrossRef]
- Lintonen, T.P.I.; Baker, P.R.S.; Suoniemi, M.; Ubhi, B.K.; Koistinen, K.M.; Duchoslav, E.; Campbell, J.L.; Ekroos, K. Differential Mobility Spectrometry-Driven Shotgun Lipidomics. Anal. Chem. 2014, 86, 9662–9669. [Google Scholar] [CrossRef]
- Ubhi, B.K. Direct infusion-tandem mass spectrometry (DI-MS/MS) analysis of complex lipids in human plasma and serum using the lipidyzerTM platform. In Methods in Molecular Biology; Humana Press: New York, NY, USA, 2018; Volume 1730, pp. 227–236. ISBN 9781493975921. [Google Scholar]
- Bligh, E.G.; Dyer, W.J. A rapid method of total lipid extraction and purification. Can. J. Biochem. Physiol. 1959, 37, 911–917. [Google Scholar] [CrossRef]
- LeBlanc, Y.; Caraiman, D.; Aiello, M.; Ghobarah, H. AB SCIEX Technical Note, RUO-MKT-02-3251-A; AB SCIEX: Framingham, MA, USA, 2015. [Google Scholar]
- Baker, P.R.; Campbell, J.L.; Duchoslav, E.; Hunter, C. AB SCIEX Technical Application Note, RUO-MKT-02-4802-A; AB SCIEX: Framingham, MA, USA, 2017. [Google Scholar]
- Franko, A.; Merkel, D.; Kovarova, M.; Hoene, M.; Jaghutriz, B.A.; Heni, M.; Königsrainer, A.; Papan, C.; Lehr, S.; Häring, H.U.; et al. Dissociation of fatty liver and insulin resistance in I148M PNPLA3 carriers: Differences in diacylglycerol (DAG) FA18:1 lipid species as a possible explanation. Nutrients 2018, 10, 1314. [Google Scholar] [CrossRef]
- R Core Team. R: A Language and Environment for Statistical Computing; R Foundation for Statistical Computing: Vienna, Austria, 2017. [Google Scholar]


| PC Species | Isobaric PC Species | Example | Change in Sum Formula | Change in Mass 1 |
|---|---|---|---|---|
| PC x:y | PC 32:0 | |||
| PC x+1:y+7 | PC 33:7 | +CH2 −14H | −0.093900 Da | |
| PC O-x+1:y | PC O-33:0 | +CH2 +2H −O | +0.036385 Da | |
| PC O-x+2:y+7 | PC O-34:7 | +2(CH2) −12H −O | −0.057515 Da | |
| [13C1]SM x+4:y | [13C1]SM 36:0 | +13C +5H +N −2O | +0.055724 Da | |
| PC O-x:y | PC O-32:0 | |||
| PC O-x+1:y+7 | PC O-33:7 | +CH2 −14H | −0.093900 Da | |
| PC x-1:y | PC 31:0 | +O −CH2 −2H | −0.036385 Da | |
| PC x:y+7 | PC 32:7 | +O −16H | −0.130285 Da | |
| [13C1]SM x+3:y | [13C1]SM 35:0 | +N +H +13C −12C −O | +0.019339 Da |
| Lipid Species 1 | AbsoluteIDQTM | LipidyzerTM | R2 of | Prop. | Confidence interval | Category | Sum Prop. | |
|---|---|---|---|---|---|---|---|---|
| (Neutral Mass) | Metabolite | Metabolite | LM [%] | qij | 5% | 95% | ||
| PC 30:0 (705) | PC aa C30:0 | PC 16:0_14:0 | 83.3 | 0.3584 | 0.2248 | 0.5098 | I | 0.4404 |
| PC 18:0_12:0 | 0.0820 | 0.0462 | 0.1495 | |||||
| PC 32:0 (733) | PC aa C32:0 | PC 16:0_16:0 | 35.3 | 1.0218 | 0.7561 | 1.3897 | II | 1.0449 |
| PC 18:0_14:0 | 0.0231 | 0.0138 | 0.0347 | |||||
| PC 32:1 (731) | PC aa C32:1 | PC 14:0_18:1 | 95.1 | 0.2981 | 0.1773 | 0.5843 | I | 1.0650 |
| PC 16:0_16:1 | 0.7669 | 0.5433 | 0.9891 | I | ||||
| PC 32:2 (729) | PC aa C32:2 | PC 14:0_18:2 | 78.9 | 1.2713 | 0.8229 | 1.7371 | II | 1.2713 |
| PC 34:1 (759) | PC aa C34:1 | PC 16:0_18:1 | 86.6 | 1.4159 | 1.1793 | 1.6821 | II | 1.4230 |
| PC 18:0_16:1 | 0.0057 | 0.0028 | 0.0120 | |||||
| PC 20:0_14:1 | 0.0014 | 0.0009 | 0.0022 | |||||
| PC 34:2 (757) | PC aa C34:2 | PC 14:0_20:2 | 49.4 | 0.0006 | 0.0004 | 0.0010 | 1.5735 | |
| PC 16:0_18:2 | 1.5482 | 1.2968 | 1.8214 | II | ||||
| PC 18:1_16:1 | 0.0247 | 0.0155 | 0.0371 | |||||
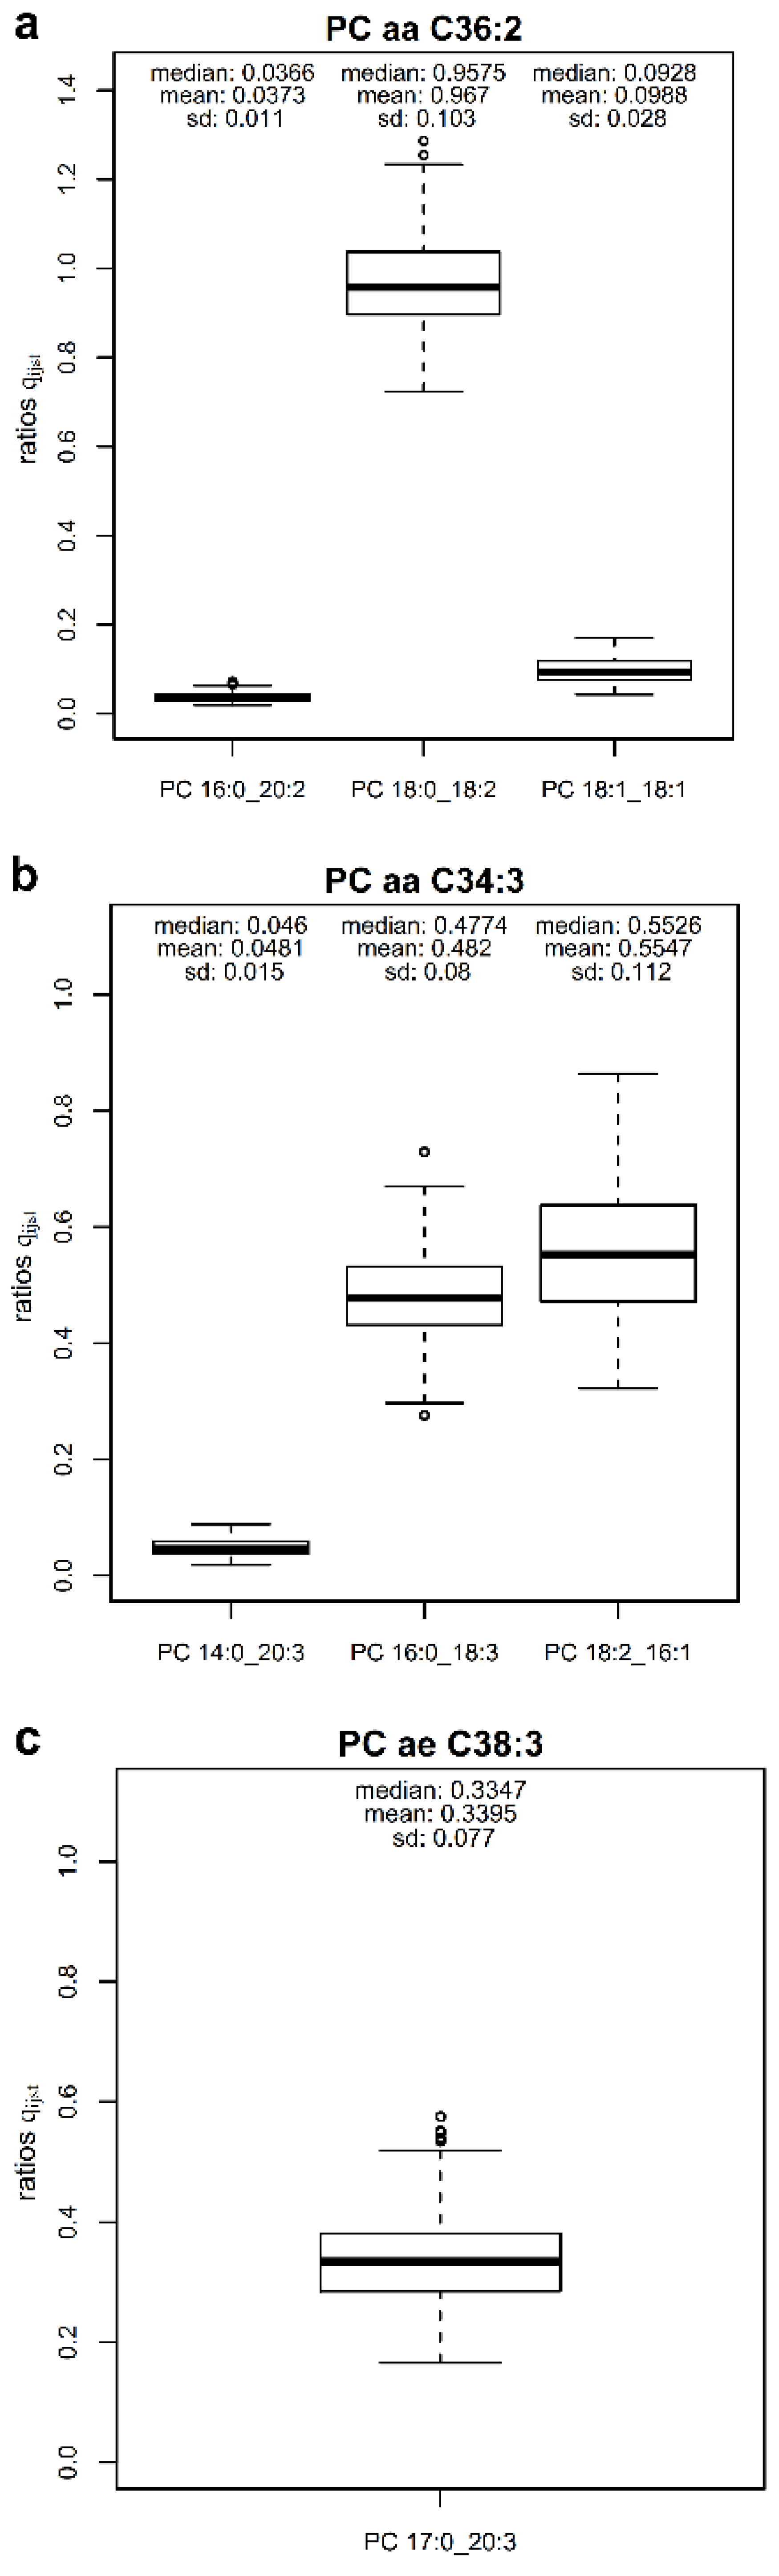
| PC 34:3 (755) | PC aa C34:3 | PC 14:0_20:3 | 85.4 | 0.0481 | 0.0252 | 0.0729 | 1.0848 | |
| PC 16:0_18:3 | 0.4820 | 0.3539 | 0.6165 | I | ||||
| PC 18:2_16:1 | 0.5547 | 0.3811 | 0.7406 | I | ||||
| PC 34:4 (753) | PC aa C34:4 | PC 14:0_20:4 | 53.6 | 0.3681 | 0.2438 | 0.5650 | I | 0.3681 |
| PC 36:0 (789) | PC aa C36:0 | PC 18:0_18:0 | 14.3 | 0.4844 | 0.3066 | 0.7470 | I | 0.4844 |
| PC 36:1 (787) | PC aa C36:1 | PC 16:0_20:1 | 79.0 | 0.0319 | 0.0231 | 0.0447 | 0.9138 | |
| PC 18:0_18:1 | 0.8819 | 0.7171 | 1.0794 | II | ||||
| PC 36:2 (785) | PC aa C36:2 | PC 16:0_20:2 | 57.9 | 0.0373 | 0.0226 | 0.0581 | 1.1031 | |
| PC 18:0_18:2 | 0.9670 | 0.8172 | 1.1362 | II | ||||
| PC 18:1_18:1 | 0.0988 | 0.0601 | 0.1467 | |||||
| PC 36:3 (783) | PC aa C36:3 | PC 16:0_20:3 | 80.4 | 0.6060 | 0.3434 | 0.8409 | I | 1.1303 |
| PC 18:0_18:3 | 0.0175 | 0.0100 | 0.0279 | |||||
| PC 18:1_18:2 | 0.5078 | 0.3177 | 0.7643 | I | ||||
| PC 36:4 (781) | PC aa C36:4 | PC 14:0_22:4 | 65.2 | 0.0016 | 0.0011 | 0.0025 | 0.3842 | |
| PC 16:0_20:4 | 0.2943 | 0.2393 | 0.3555 | I | ||||
| PC 18:1_18:3 | 0.0109 | 0.0033 | 0.0220 | |||||
| PC 18:2_18:2 | 0.0774 | 0.0354 | 0.1558 | |||||
| PC 36:5 (779) | PC aa C36:5 | PC 14:0_22:5 | 17.2 | 0.0172 | 0.0101 | 0.0262 | 0.0482 | |
| PC 18:2_18:3 | 0.0310 | 0.0113 | 0.0615 | |||||
| PC 36:6 (777) | PC aa C36:6 | PC 14:0_22:6 | 32.3 | 0.8810 | 0.4947 | 1.2925 | II | 0.8810 |
| PC 38:0 (817) | PC aa C38:0 | PC 18:0_20:0 | 34.5 | 0.1629 | 0.1193 | 0.2153 | 0.1629 | |
| PC 38:3 (811) | PC aa C38:3 | PC 18:0_20:3 | 80.7 | 0.6485 | 0.4476 | 0.8496 | I | 0.6854 |
| PC 18:1_20:2 | 0.0197 | 0.0126 | 0.0299 | |||||
| PC 18:2_20:1 | 0.0172 | 0.0070 | 0.0436 | |||||
| PC 38:4 (809) | PC aa C38:4 | PC 16:0_22:4 | 58.8 | 0.0758 | 0.0504 | 0.1059 | 0.3974 | |
| PC 18:0_20:4 | 0.2343 | 0.1971 | 0.2867 | I | ||||
| PC 18:1_20:3 | 0.0808 | 0.0490 | 0.1500 | |||||
| PC 18:2_20:2 | 0.0065 | 0.0028 | 0.0126 | |||||
| PC 38:5 (807) | PC aa C38:5 | PC 16:0_22:5 | 67.7 | 0.5515 | 0.4380 | 0.6725 | I | 0.6847 |
| PC 18:1_20:4 | 0.0983 | 0.0687 | 0.1286 | |||||
| PC 18:2_20:3 | 0.0349 | 0.0201 | 0.0647 | |||||
| PC 38:6 (805) | PC aa C38:6 | PC 16:0_22:6 | 77.1 | 1.2431 | 1.0168 | 1.5009 | II | 1.2621 |
| PC 18:2_20:4 | 0.0190 | 0.0118 | 0.0279 | |||||
| PC 40:3 (839) | PC aa C40:3 | PC 20:0_20:3 | 0.2 | 0.4892 | 0.1980 | 0.8453 | I | 0.4892 |
| PC 40:4 (837) | PC aa C40:4 | PC 18:0_22:4 | 67.2 | 0.7065 | 0.4936 | 0.9503 | I | 0.8017 |
| PC 20:0_20:4 | 0.0952 | 0.0644 | 0.1461 | |||||
| PC 40:5 (835) | PC aa C40:5 | PC 18:0_22:5 | 76.5 | 0.7863 | 0.6343 | 0.9819 | I | 0.8451 |
| PC 18:1_22:4 | 0.0588 | 0.0373 | 0.0840 | |||||
| PC 40:6 (833) | PC aa C40:6 | PC 18:0_22:6 | 82.7 | 1.0540 | 0.8588 | 1.2734 | II | 1.1384 |
| PC 18:1_22:5 | 0.0718 | 0.0429 | 0.1039 | |||||
| PC 18:2_22:4 | 0.0126 | 0.0076 | 0.0186 | |||||
| PC 42:6 (861) | PC aa C42:6 | PC 20:0_22:6 | 5.9 | 0.8482 | 0.5587 | 1.2468 | II | 0.8482 |
| PC 33:1 (745) | PC ae C34:1 | PC 15:0_18:1 | 57.8 | 0.0988 | 0.0705 | 0.1373 | 0.1426 | |
| PC 17:0_16:1 | 0.0438 | 0.0307 | 0.0601 | |||||
| PC 33:2 (743) | PC ae C34:2 | PC 15:0_18:2 | 7.1 | 0.1059 | 0.0698 | 0.1541 | 0.1059 | |
| PC 35:1 (773) | PC ae C36:1 | PC 17:0_18:1 | 64.4 | 0.2147 | 0.1601 | 0.2878 | I | 0.2147 |
| PC 35:2 (771) | PC ae C36:2 | PC 17:0_18:2 | 52.8 | 0.2275 | 0.1837 | 0.2799 | I | 0.2275 |
| PC 35:3 (769) | PC ae C36:3 | PC 15:0_20:3 | 49.9 | 0.0700 | 0.0458 | 0.0950 | 0.0700 | |
| PC 35:4 (767) | PC ae C36:4 | PC 15:0_20:4 | 26.0 | 0.0526 | 0.0339 | 0.0793 | 0.0526 | |
| PC 37:3 (797) | PC ae C38:3 | PC 17:0_20:3 | 64.5 | 0.3395 | 0.2248 | 0.4767 | I | 0.3395 |
| PC 37:4 (795) | PC ae C38:4 | PC 17:0_20:4 | 64.1 | 0.1978 | 0.1495 | 0.2547 | 0.1978 | |
| PC 37:5 (793) | PC ae C38:5 | PC 17:0_20:5 | 2.2 | 0.0263 | 0.0145 | 0.0408 | 0.0263 | |
| PC 37:6 (791) | PC ae C38:6 | PC 15:0_22:6 | 12.6 | 0.0677 | 0.0433 | 0.1084 | 0.0677 | |
| PC 39:1 (829) | PC ae C40:1 | PC 18:2_22:6 | 20.3 | 0.5664 | 0.3782 | 0.8648 | I | 0.5664 |
| PC 39:5 (821) | PC ae C40:5 | PC 17:0_22:5 | 19.7 | 0.1234 | 0.0708 | 0.1735 | 0.1234 | |
| PC 39:6 (819) | PC ae C40:6 | PC 17:0_22:6 | 56.3 | 0.1720 | 0.1216 | 0.2262 | 0.1720 | |
© 2019 by the authors. Licensee MDPI, Basel, Switzerland. This article is an open access article distributed under the terms and conditions of the Creative Commons Attribution (CC BY) license (http://creativecommons.org/licenses/by/4.0/).
Share and Cite
Quell, J.D.; Römisch-Margl, W.; Haid, M.; Krumsiek, J.; Skurk, T.; Halama, A.; Stephan, N.; Adamski, J.; Hauner, H.; Mook-Kanamori, D.; et al. Characterization of Bulk Phosphatidylcholine Compositions in Human Plasma Using Side-Chain Resolving Lipidomics. Metabolites 2019, 9, 109. https://doi.org/10.3390/metabo9060109
Quell JD, Römisch-Margl W, Haid M, Krumsiek J, Skurk T, Halama A, Stephan N, Adamski J, Hauner H, Mook-Kanamori D, et al. Characterization of Bulk Phosphatidylcholine Compositions in Human Plasma Using Side-Chain Resolving Lipidomics. Metabolites. 2019; 9(6):109. https://doi.org/10.3390/metabo9060109
Chicago/Turabian StyleQuell, Jan D., Werner Römisch-Margl, Mark Haid, Jan Krumsiek, Thomas Skurk, Anna Halama, Nisha Stephan, Jerzy Adamski, Hans Hauner, Dennis Mook-Kanamori, and et al. 2019. "Characterization of Bulk Phosphatidylcholine Compositions in Human Plasma Using Side-Chain Resolving Lipidomics" Metabolites 9, no. 6: 109. https://doi.org/10.3390/metabo9060109
APA StyleQuell, J. D., Römisch-Margl, W., Haid, M., Krumsiek, J., Skurk, T., Halama, A., Stephan, N., Adamski, J., Hauner, H., Mook-Kanamori, D., Mohney, R. P., Daniel, H., Suhre, K., & Kastenmüller, G. (2019). Characterization of Bulk Phosphatidylcholine Compositions in Human Plasma Using Side-Chain Resolving Lipidomics. Metabolites, 9(6), 109. https://doi.org/10.3390/metabo9060109