Article

Urea Cycle Related Amino Acids Measured in Dried Bloodspots Enable Long-Term In Vivo Monitoring and Therapeutic Adjustment

1
Genetics and Genomic Medicine, Great Ormond Street Institute of Child Health, University College London, London WC1E 6BT, UK
2
Gene Transfer Technology Group, Institute for Women’s Health, University College London, London WC1E 6BT, UK
3
Metabolic Medicine Department, Great Ormond Street Hospital for Children NHS Foundation Trust, London WC1N 3JH, UK
4
National Institute of Health Research Great Ormond Street Hospital Biomedical Research Centre, London W1T 7HA, UK
5
Wits/SAMRC Antiviral Gene Therapy Research Unit, Faculty of Health Sciences, University of the Witwatersrand, Johannesburg 2000, South Africa
6
MRC Laboratory for Molecular Cell Biology, University College London, London WC1E 6BT, UK
*
Author to whom correspondence should be addressed.
Metabolites 2019, 9(11), 275; https://doi.org/10.3390/metabo9110275
Submission received: 28 September 2019 / Revised: 19 October 2019 / Accepted: 5 November 2019 / Published: 12 November 2019
(This article belongs to the Special Issue Genetic Metabolic Diagnostics)

Abstract

:
Background: Dried bloodspots are easy to collect and to transport to assess various metabolites, such as amino acids. Dried bloodspots are routinely used for diagnosis and monitoring of some inherited metabolic diseases. Methods: Measurement of amino acids from dried blood spots by liquid chromatography-tandem mass spectrometry. Results: We describe a novel rapid method to measure underivatised urea cycle related amino acids. Application of this method enabled accurate monitoring of these amino acids to assess the efficacy of therapies in argininosuccinate lyase deficient mice and monitoring of these metabolites in patients with urea cycle defects. Conclusion: Measuring urea cycle related amino acids in urea cycle defects from dried blood spots is a reliable tool in animal research and will be of benefit in the clinic, facilitating optimisation of protein-restricted diet and preventing amino acid deprivation.

1. Introduction

Liquid chromatography-tandem mass spectrometry (LC-MS/MS) is a technique routinely used in clinical laboratories enabling inexpensive high-throughput identification and accurate quantification of metabolites in limited volumes of biological fluids. Dried blood spots (DBS) are a simple method of blood collection and are easily transportable by post. Quantification of compounds from DBS with LC-MSMS has been supported worldwide with a broad field of applications, particularly for new-born screening [1], diagnosis [2,3], and monitoring of inherited metabolic diseases (IMD), such as phenylketonuria [4], homocystinuria [5], and maple syrup urine disease [6].
Amino acids are used as surrogate biomarkers for various IMD. In urea cycle defects, analysis of intermediary amino acids of the urea cycle, i.e., ornithine, citrulline, argininosuccinic acid, and arginine, are critical in aiding the diagnosis, optimising the protein-restricted diet, and amino acid supplementation of patients. High glutamine levels may indicate hyperammonaemia [7] and are predictive of hyperammonaemic crises [8]. All of these amino acids have been investigated as biomarkers for new-born screening in urea cycle defects [9,10].
Methods to measure amino acids have progressed from time-consuming ion-exchange chromatography with post-column ninhydrin derivatisation [11]. High performance liquid chromatography [12] and tandem mass spectrometry (MS/MS) [10] usually require with precolumn derivatisation, e.g., with butyl esterification, requiring manual processing hence another time consuming step, which can potentially affect the reproducibility of the technique. Coupling LC and MS/MS enables a good separation, enabling accurate detection of underivatised amino acids, although the ion-pairing reagent might cause ion suppression [13,14,15].
In this work, we present a LC-MS/MS method optimised to measure underivatised urea cycle related amino acids, its application in vivo to assess efficacy of therapies in argininosuccinate lyase deficient AslNeo/Neo mice, and to monitor urea cycle deficient patients.

2. Results

2.1. Dried Blood Spot Extraction

Optimisation of amino acid extraction from dried blood spot was investigated. The volume of eluent (i.e., methanol) was progressively increased from 100 μL to 500 μL. This did not affect the concentration of analytes detected (Figure S1A). The time of extraction was increased from 15 min to 7 h. A prolonged extraction time did not show any obvious benefit for the amino acids tested with the exception of L-ornithine, which showed a 3-fold increase in elution efficiency with longer time periods (p < 0.01) (Figure S1B). The use of 3.2 mm and 6.4 mm diameter punches, corresponding to a blood volume of 3.4 μL and 11.2 μL, respectively [1], did not show any significant variation in the extraction rate for these amino acids (Figure S1C). Sonication of the DBS punches did not affect extraction efficiency (Figure S1D).

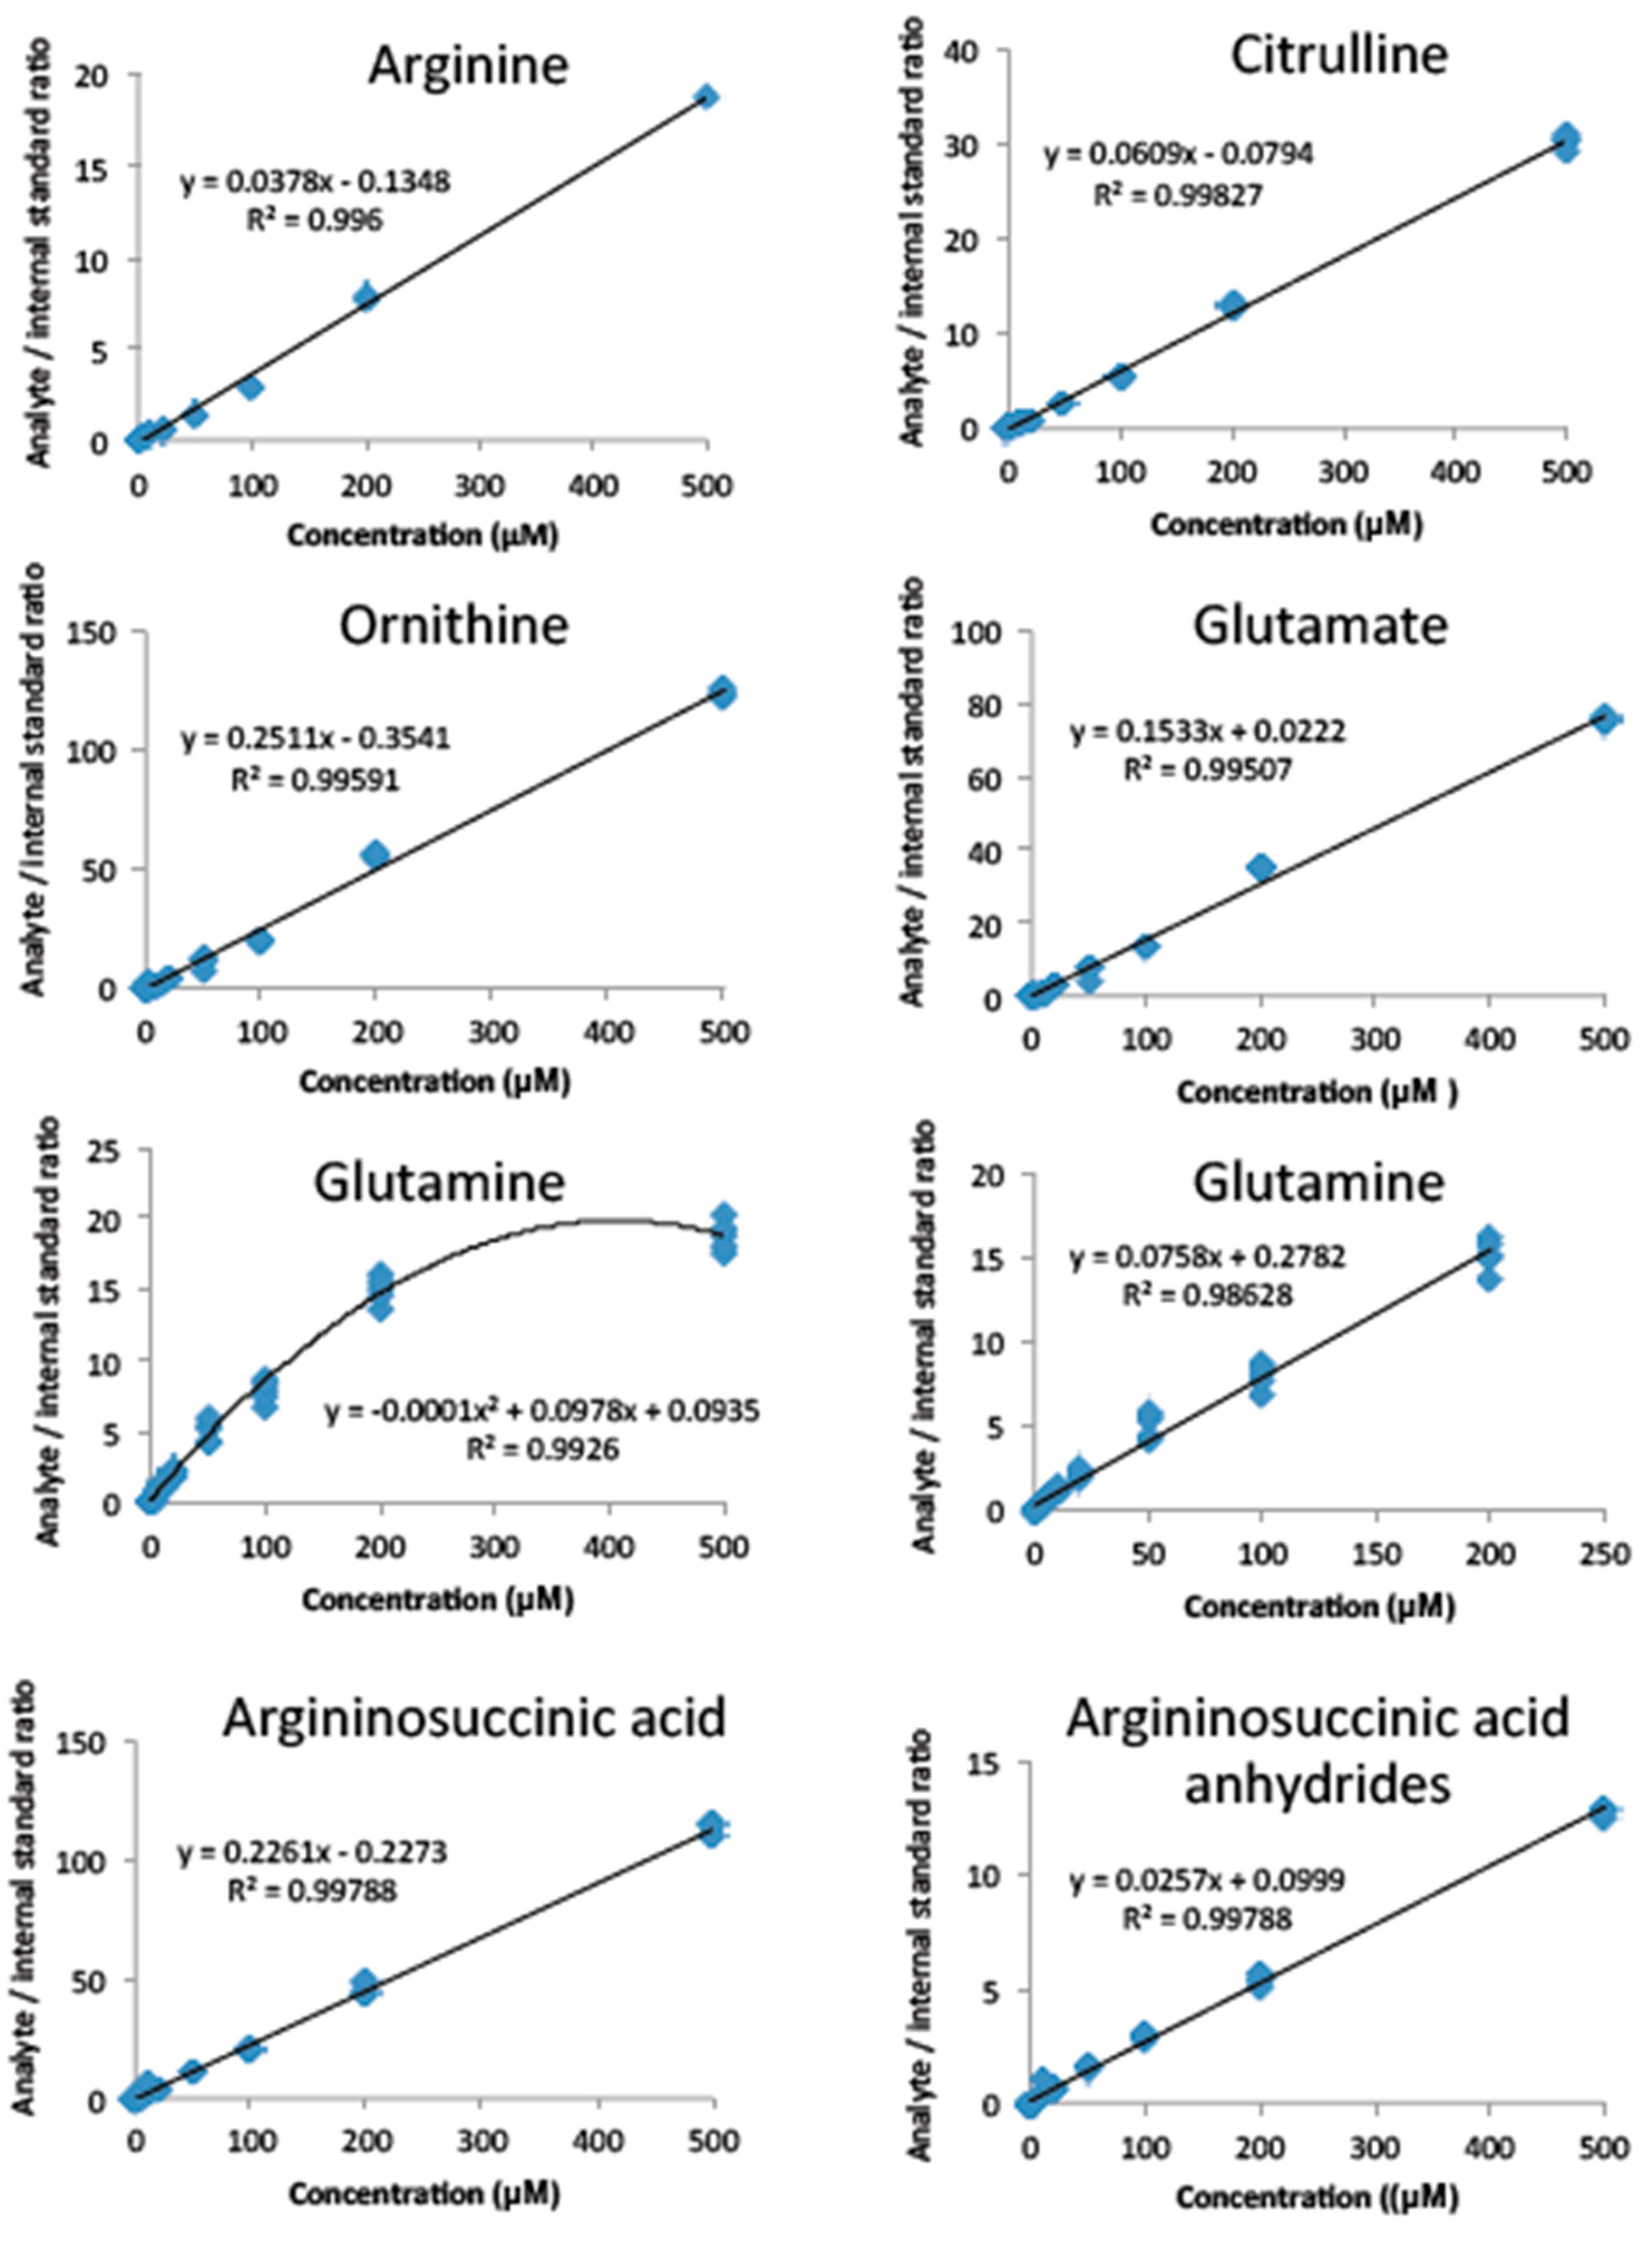
2.2. Method Validation

Multiple reaction monitoring using cone voltage and collision energies, which resulted in maximal ion detection for both precursor and product ions, were identified (Table S1). Linearity was observed for all amino acids between 0 to 200 μM (Figure 1). Precision studies (Table 1) showed intra- and inter-batch coefficients of variation (CVs) all below 10% except for argininosuccinic acid. The intra-batch CV of argininosuccinic acid was below 10%, whilst the inter-batch CV was below 15% at medium and high concentrations (300 and 1500 μM, respectively). At low concentrations (50 µM) however, the value was 27%. The limit of detection (LOD) and limit of quantification (LOQ) were calculated using the standard deviation method and measured between 0.2 to 2.3 μM and 0.8 to 7.7 μM, respectively, for all amino acids. Matrix effects were negligible for l-arginine (85%), l-citrulline (98%), l-ornithine (104%), and l-glutamate (93%), but showed potentiation and ion suppression for l-glutamine (140%) and argininosuccinic acid (33%), respectively (Figure S2). Recovery experiments indicated that the internal standard dilution method was able to compensate for these matrix effects [16].

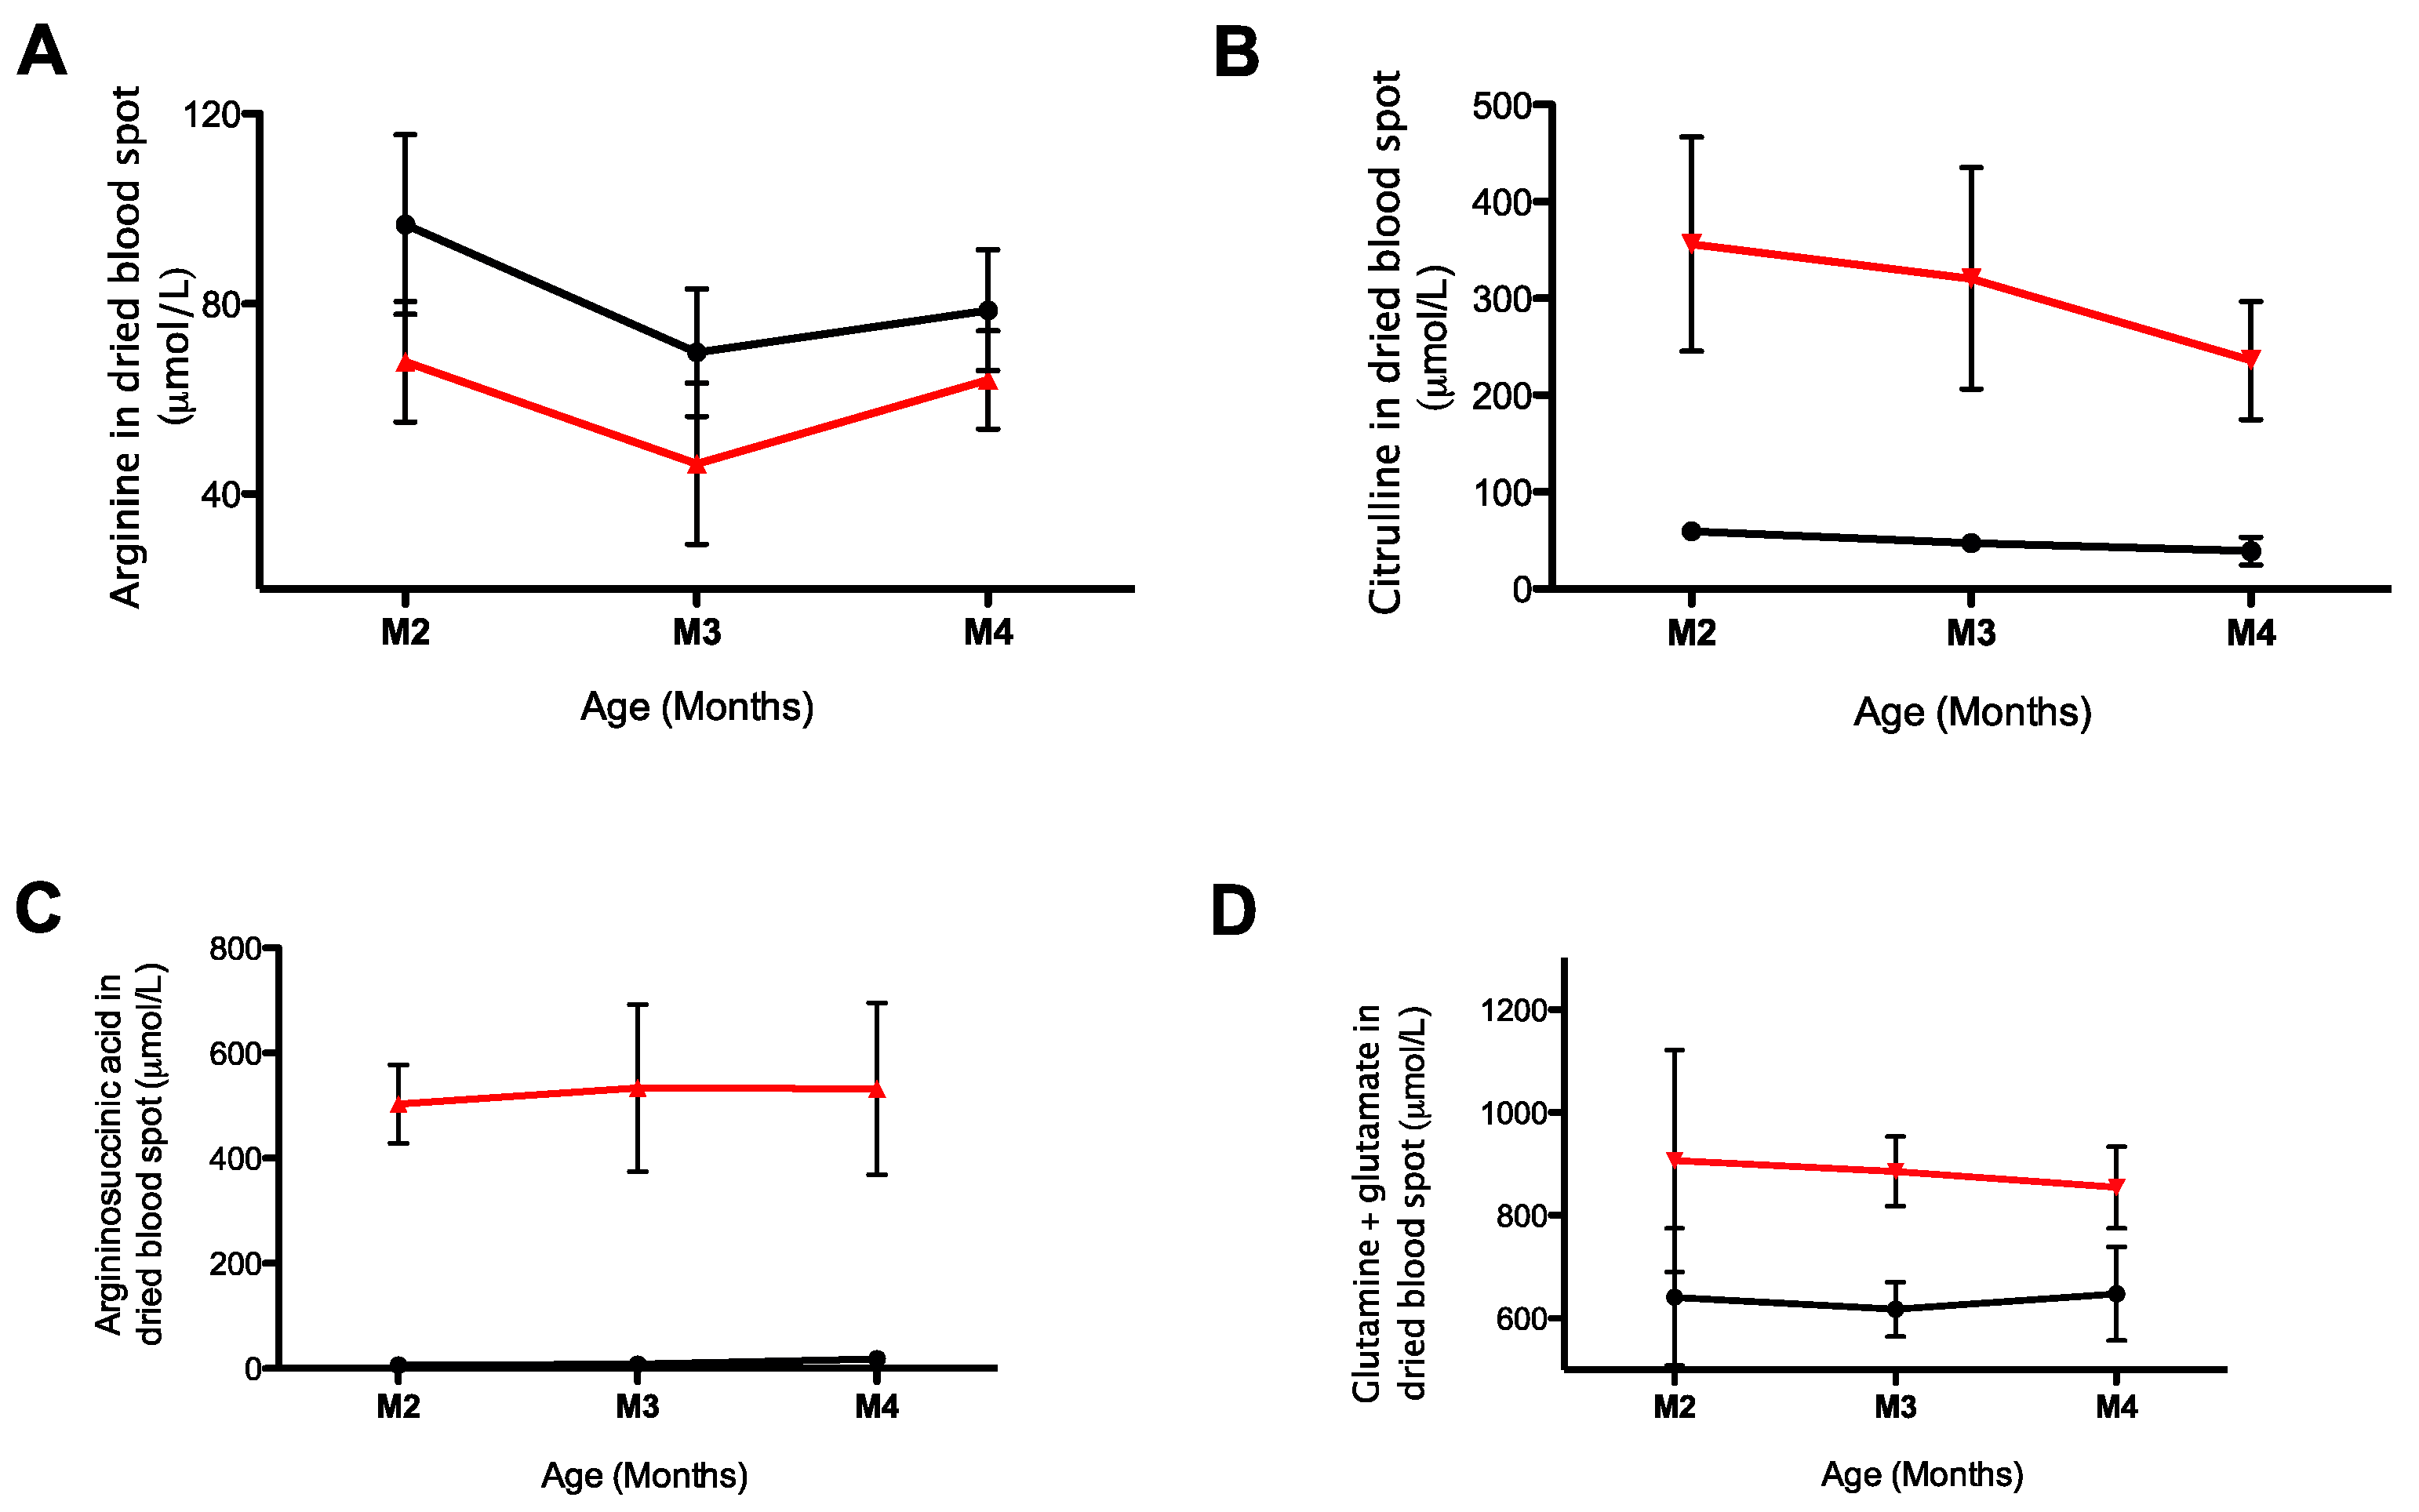
2.3. Monitoring of Urea Cycle Related Amino Acids in AslNeo/Neo Mice

We assessed levels of arginine, citrulline, argininosuccinic acid, and its anhydrides alongside the combined concentrations of glutamate and glutamine in argininosuccinate lyase (ASL) deficient AslNeo/Neo and wild-type mice. This ASL-deficient mouse model recapitulates the human phenotype of inherited ASL deficiency also referred to as argininosuccinic aciduria. Levels were assessed at three time points, i.e., 2-, 3-, and 4-month-old animals and showed reduced arginine, increased citrulline, argininosuccinic acid, and glutamine/glutamate levels with limited variation overtime (Figure 2).

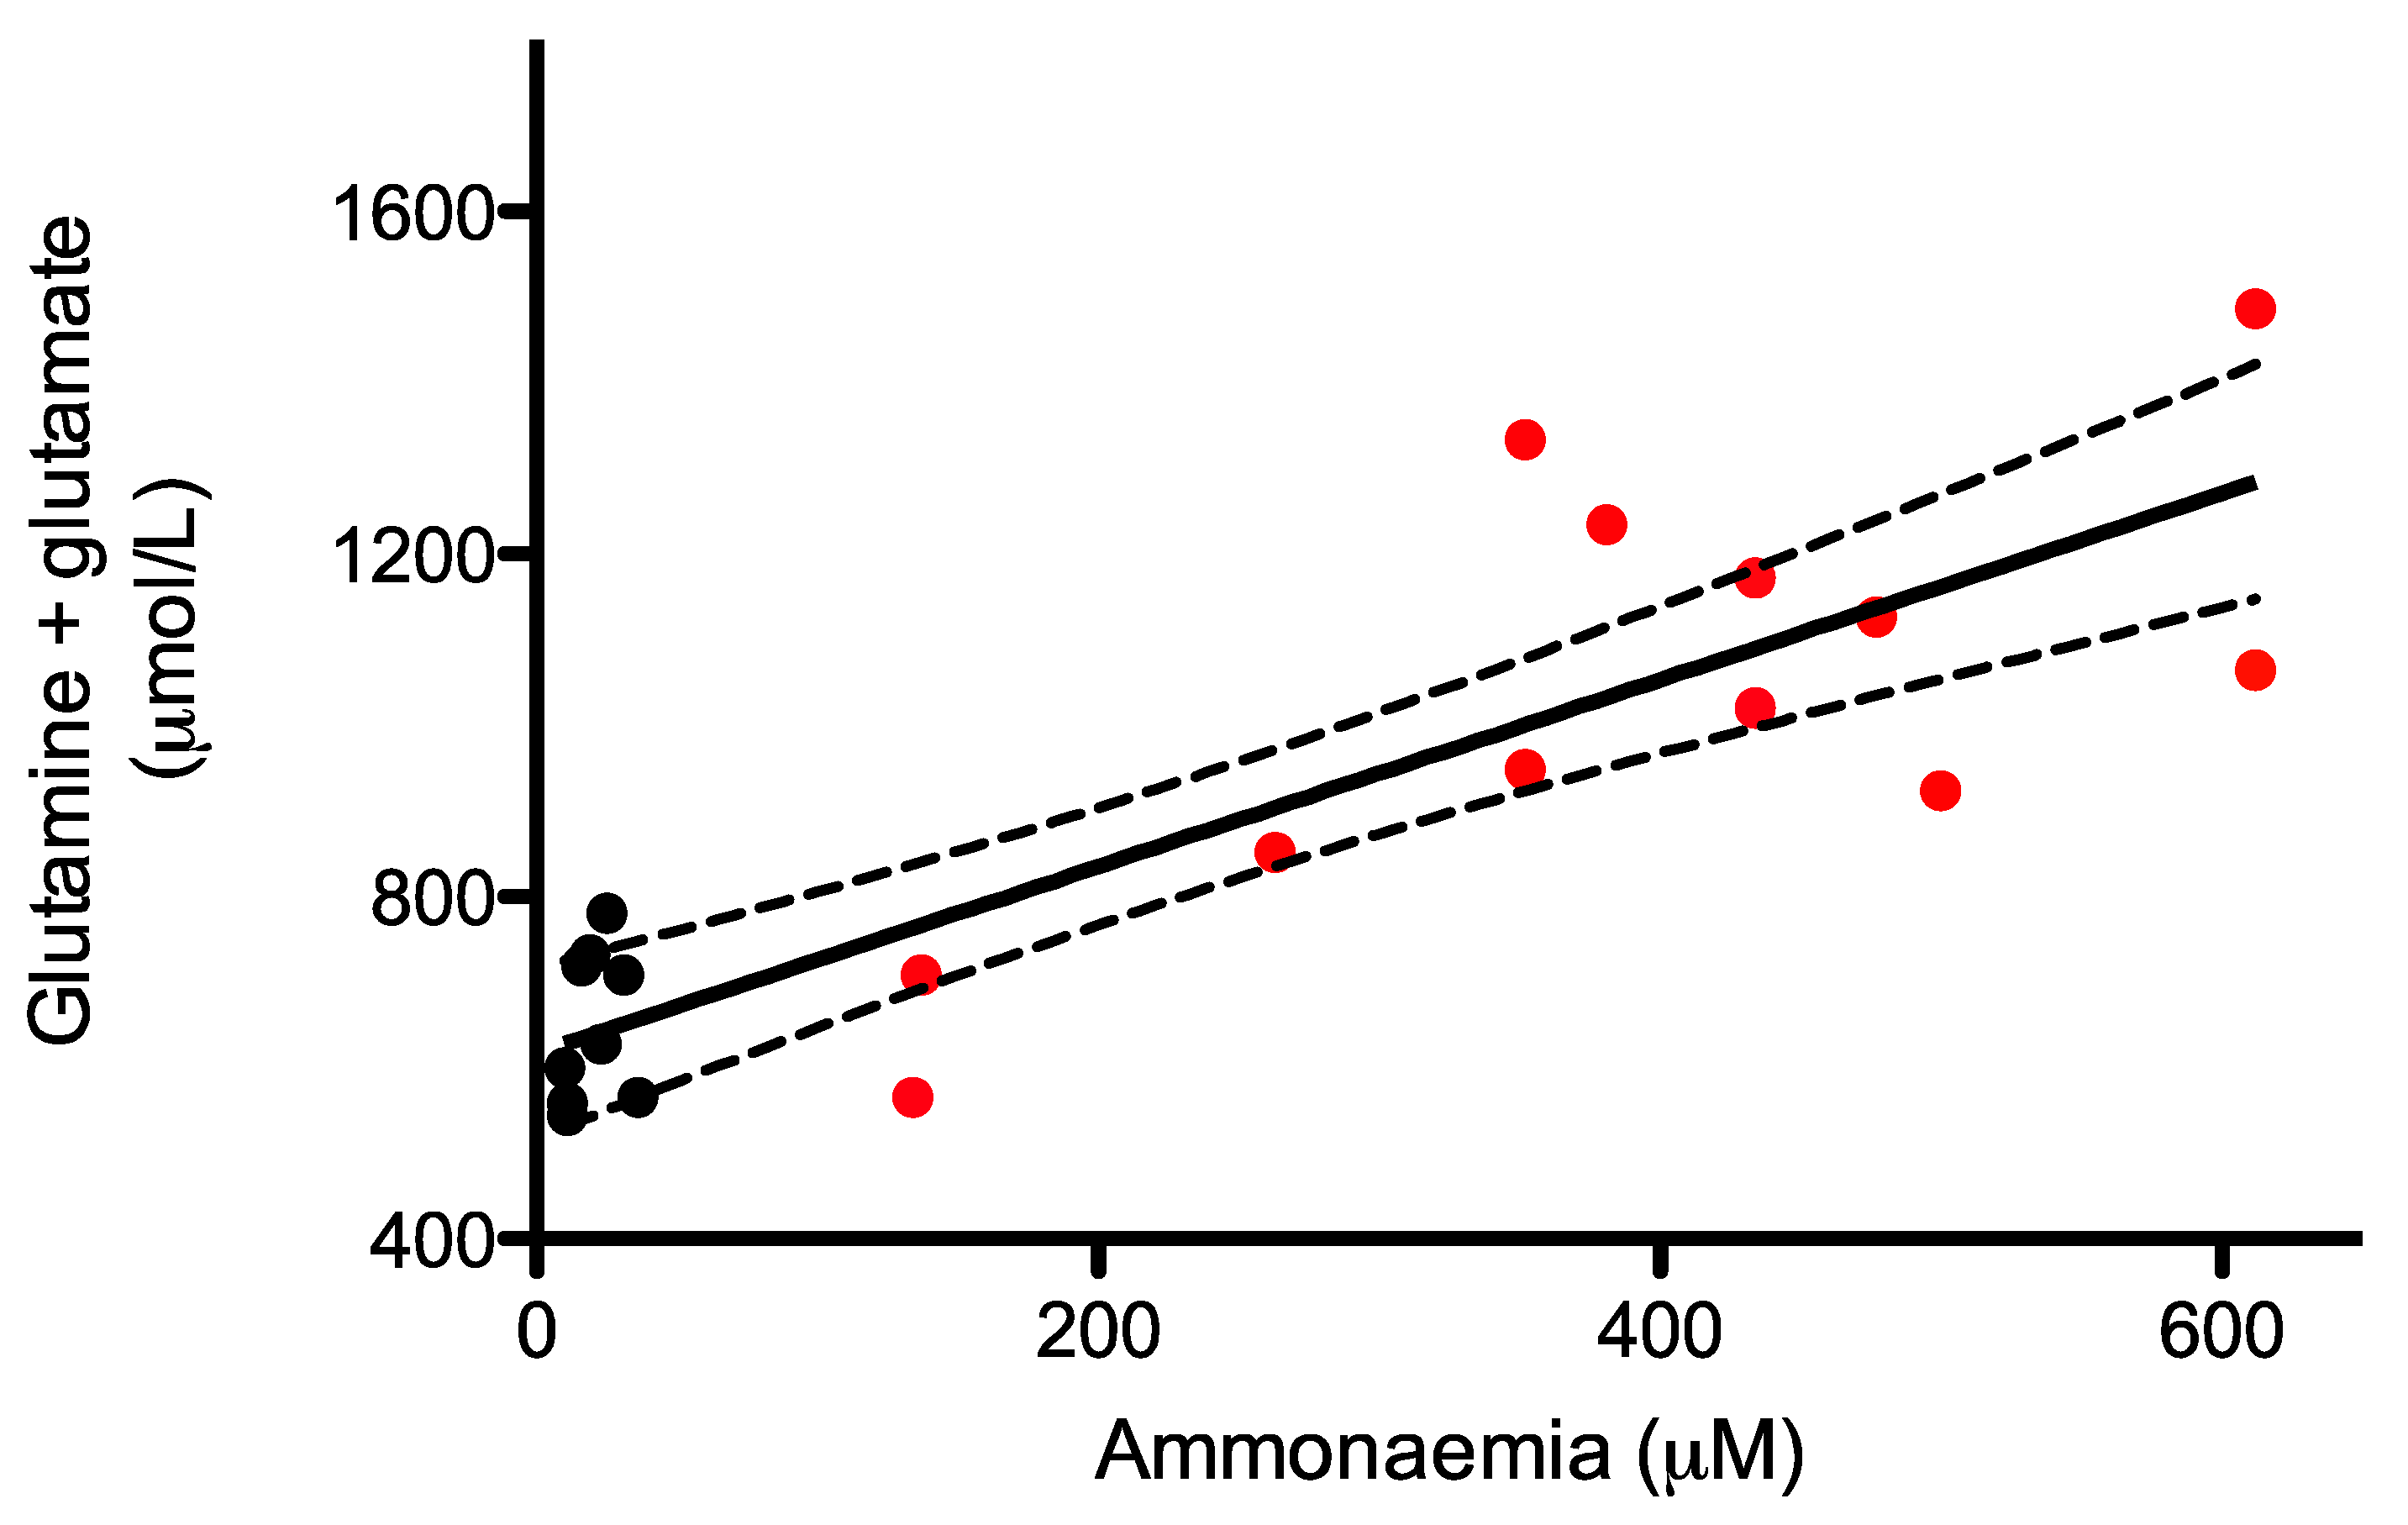
2.4. Monitoring of Glutamine and Glutamate Levels in Dried Blood Spots as A Surrogate of Ammonia Levels in AslNeo/Neo Mice

Glutamate and glutamine buffer ammonia and can therefore be used as an indirect biomarker of ammonia levels. We measured cumulated levels of glutamate and glutamine, and correlated this with plasma ammonia levels in WT and untreated AslNeo/Neo mice. The glutamate-glutamine levels correlated with ammonaemia levels (rs = 0.74; p < 0.0001) (Figure 3).

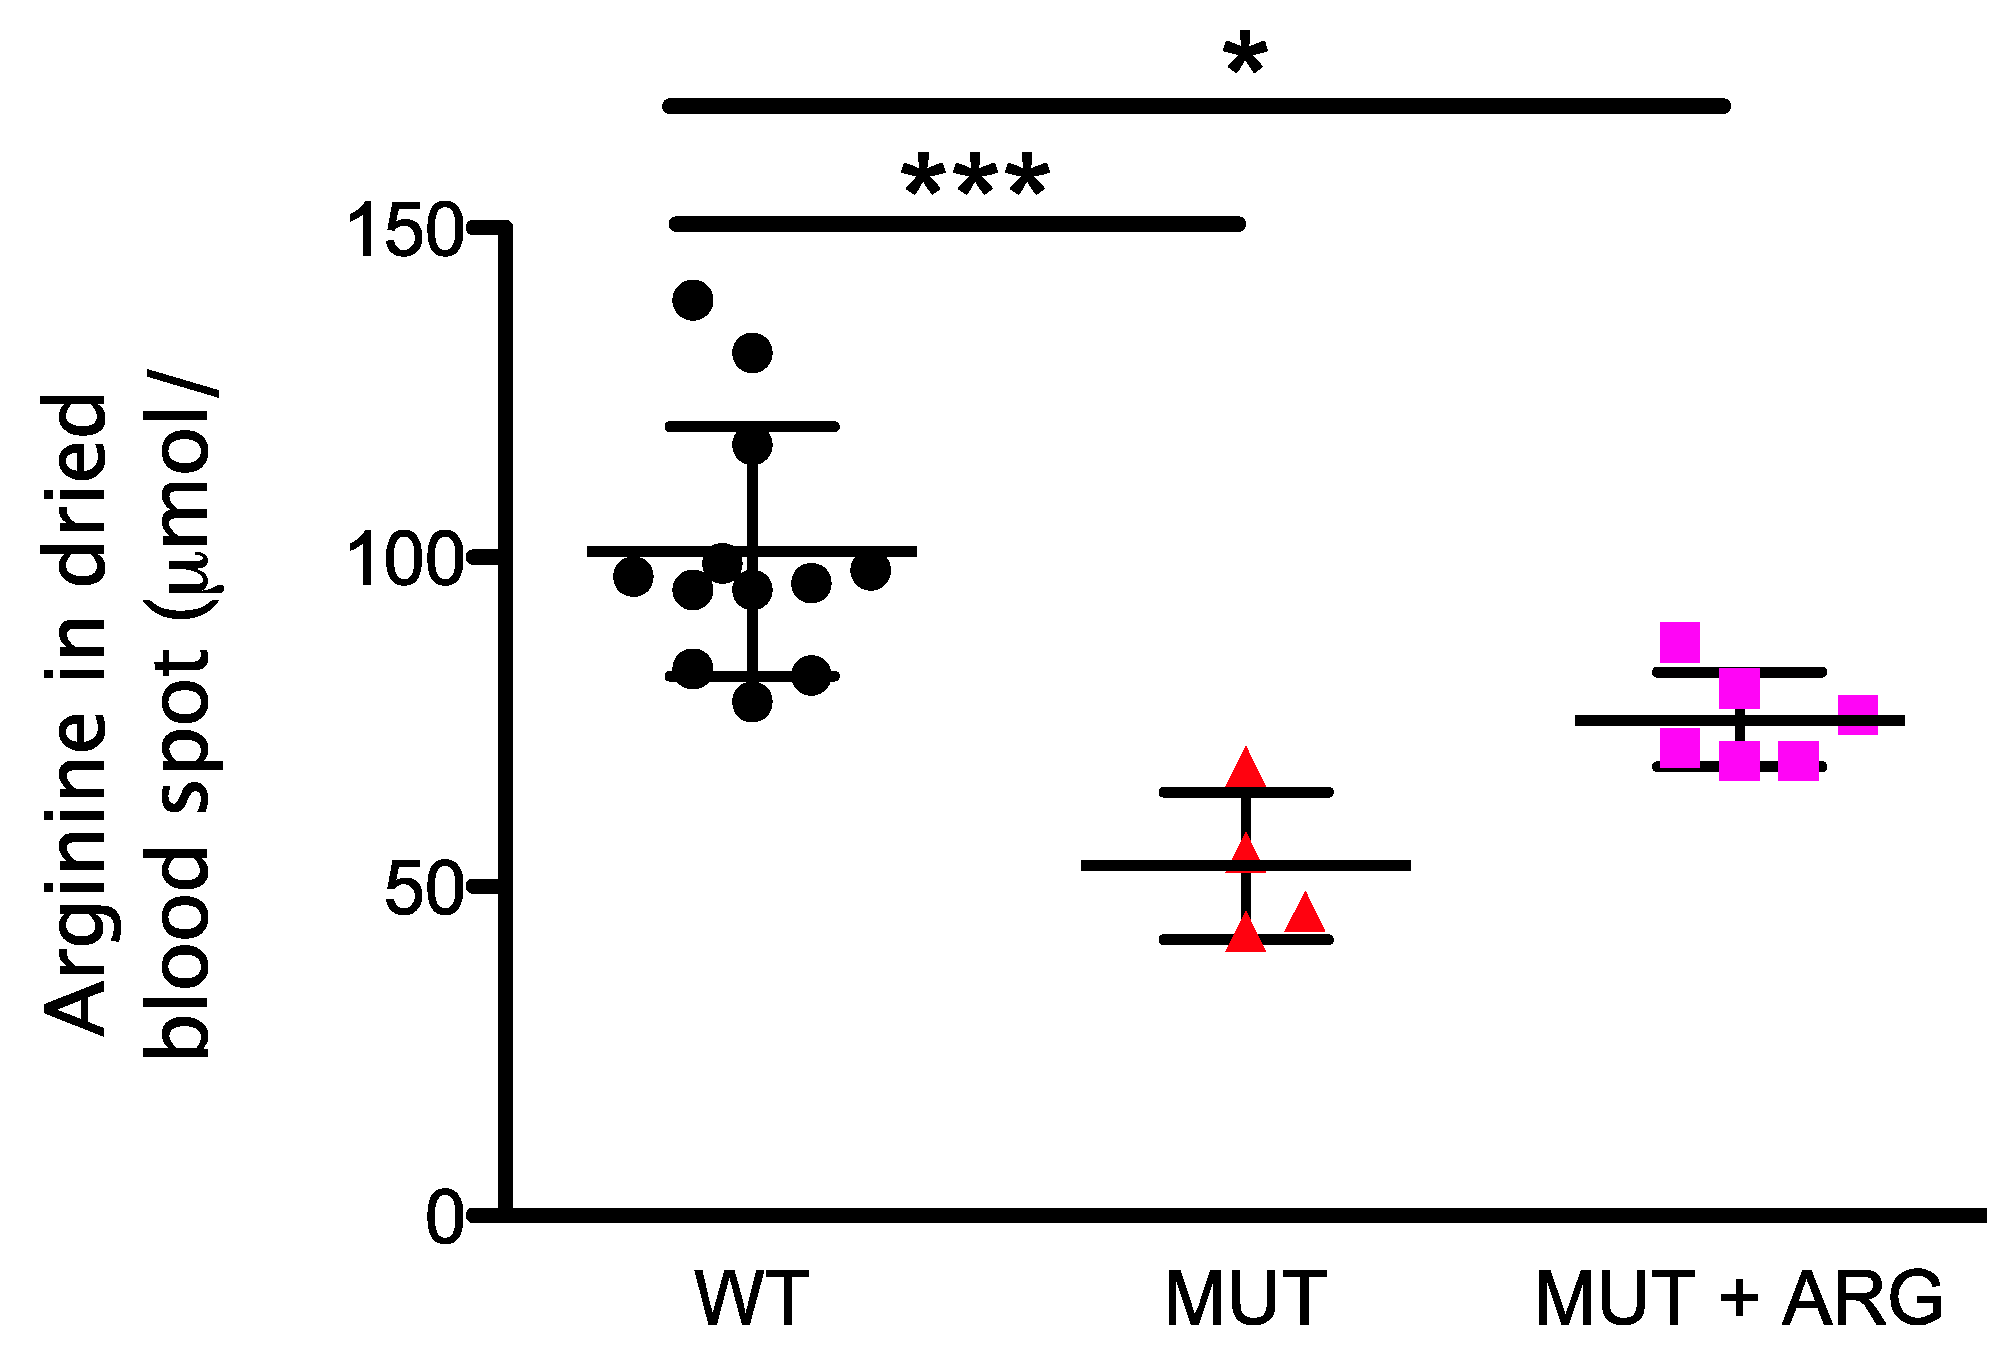
2.5. Monitoring of Arginine Supplementation in AslNeo/Neo Mice

Arginine levels were measured in dried blood spots from WT, untreated, and arginine supplemented AslNeo/Neo mice. We observed a significant decrease in the concentration of the arginine levels in untreated AslNeo/Neo mice compared to that of WT (p < 0.001). This decrease improved with arginine supplementation (p < 0.05) (Figure 4).

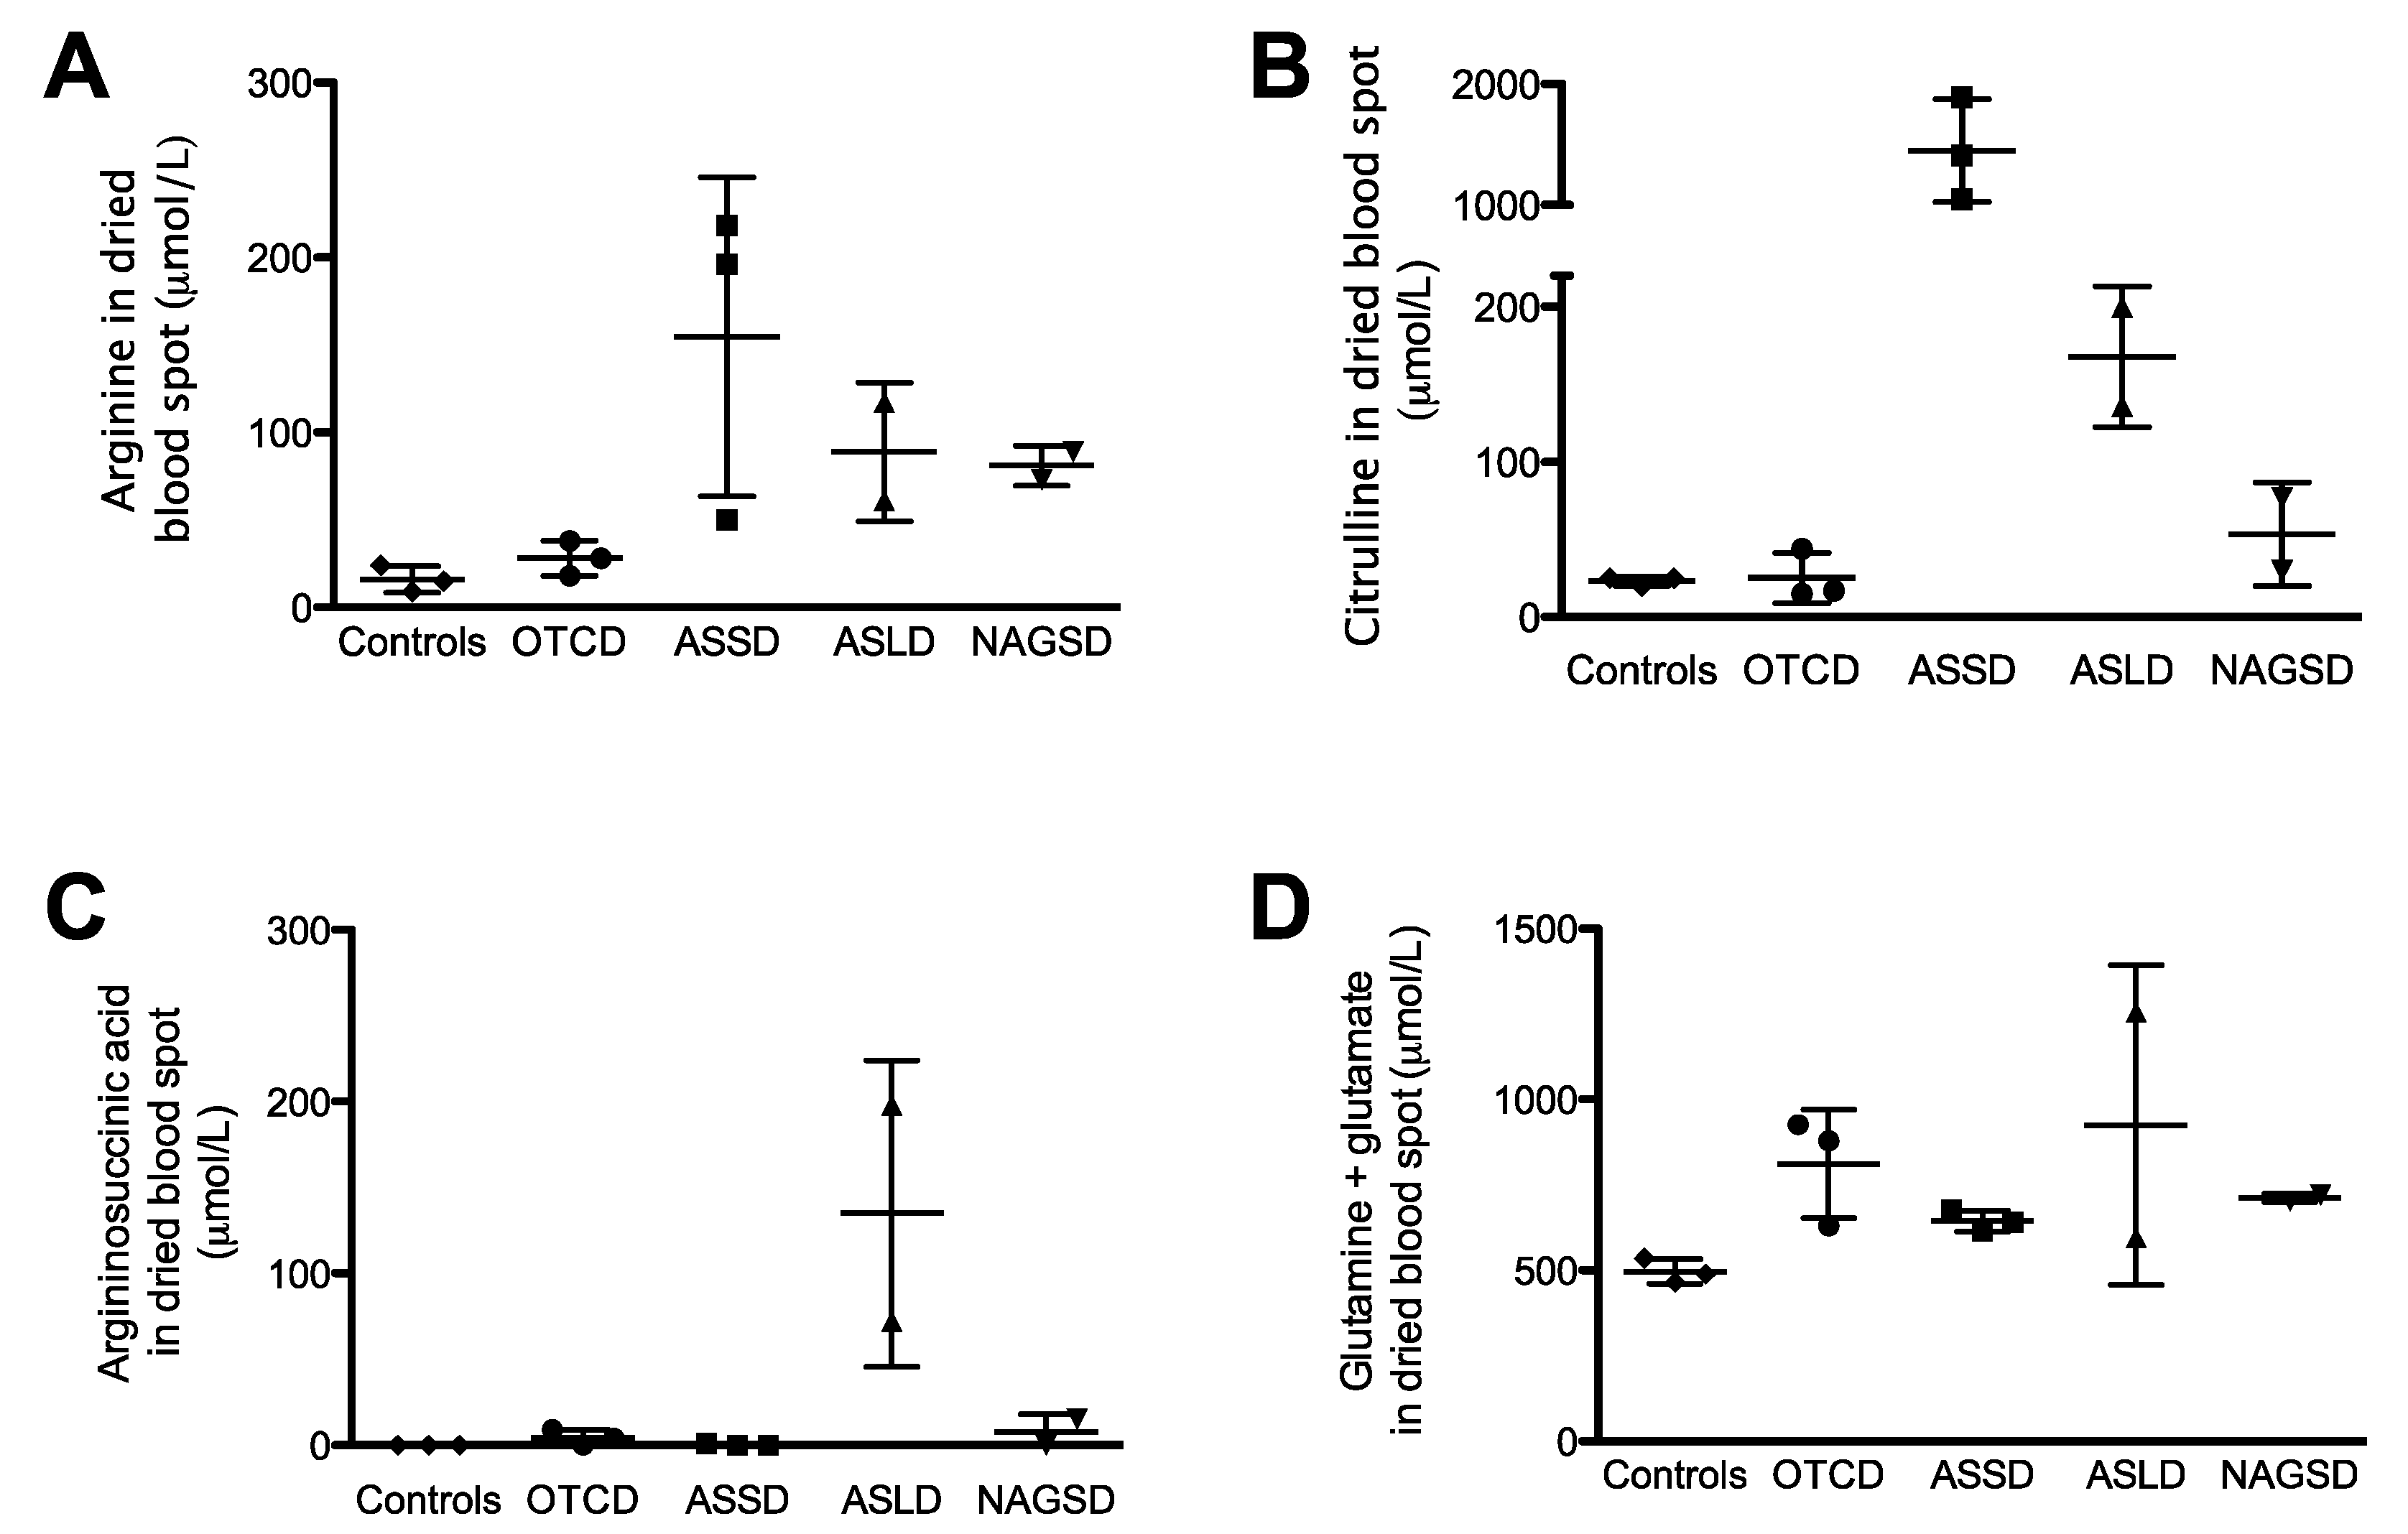
2.6. Urea Cycle Related Amino Acid Levels in Dried Blood Spots from Patients with Urea Cycle Defects

Levels of arginine, citrulline, argininosuccinic acid and its anhydrides, and summed glutamate and glutamine (Figure 5) were assessed in dried blood spots collected from urea cycle deficient patients. These patients were metabolically stable and included individuals with ornithine transcarbamylase deficiency (OTCD) (n = 3), argininosuccinate synthase deficiency (ASSD) (n = 3), argininosuccinate lyase deficiency (ASLD) (n = 2), and N-acetylglutamate synthase deficiency (NAGSD) (n = 1).
As anticipated and compared to healthy controls, citrulline levels were dramatically elevated in ASSD, slightly increased in ASLD patients, and in a similar range or slightly decreased in OTCD. The pathognomonic biomarker argininosuccinic acid was only found in ASLD patients. Cumulated glutamate and glutamine levels were similar between disorders and were all below <1000 μM except for one ASLD patient with concomitant borderline ammonia level (57 μM).

3. Discussion

This report describes the development and in vivo application of a rapid LC-MS/MS method to accurately monitor six urea cycle related amino acids from dried blood spots, i.e., ornithine, citrulline, argininosuccinic acid, arginine, glutamine and glutamate.
Optimisation of methods for the extraction of amino acids from dried blood spots is an essential, but challenging step as incomplete elution or analyte degradation can cause inaccurate results. Amino acid extraction from DBS has been reported previously and is commonly performed as an off-line process [17] at room temperature with methanol, a generic solvent [10]. Temperature and extraction solution (including pH) were therefore not investigated during this study. However, published methods of amino acid extraction from DBS have no consensus regarding the parameters investigated in this work. Extraction times vary from 20–60 min [18,19,20], volumes of methanol used range from 100–900 μL [19], and punch sizes vary from 3.2–6.4 mm (1/4 inches) in diameter [20]. Sonication is incorporated into some protocols [15,21,22]. In our work, only marginal variations were observed by modifying extraction parameters, i.e., time, volume of eluent, punch size, additional solvation energy (sonication) for all of the amino acid analysed with the exception of ornithine, which showed a 2- to 3-fold increase in elution efficiency after 2 and 7 h of extraction, respectively.
This method adapted from Piraud et al. [23] does not involve derivatisation, an approach, which has been reported to be more precise for the analysis of amino acids of the urea cycle [24]. Another advantage of non-derivatisation is the decreased time involved in sample preparation. The liquid chromatography gradient used for the LC-MSMS amino acid analysis incorporates a high percentage of acetic acid in its mobile phase, similar to that used previously for the analysis of B6 vitamers [25]. The method shows good linearity over the physiological range of analytes. The precision and reproducibility of the method, including extraction and analysis, shows good intra-batch reproducibility for all compounds and a satisfactory inter-batch reproducibility for all of the compounds analysed with the exception of argininosuccinic aciduria when present at low concentrations (50 μM). However, this remained within acceptable values published for dried blood spot analysis [24,26] and within the range of argininosuccinic acid levels usually observed in untreated AslNeo/Neo mice [27] and ASLD patients [28].
Compared to others, our method is quick, accurate, and cost-effective with the advantage of using dried blood spots, i.e., requiring minimal sample as low as 20 μL The overall extraction-detection process of our method remains relatively fast, i.e., 15 min and 25 min for extraction and LC-MS/MS detection, respectively. LC-MS/MS methods usually used for new-born screening are now using either butyl ester derivatisation [29] or underivatised [15] approaches. The development of faster methods with more sensitive mass spectrometers and reduced steps has enabled a quicker turn round to maximise efficacy. Liquid chromatography for separation is not always required. The running time in that case can be as quick as 1 min [15], enabling high throughput processing at minimal cost.
Amino acid analysis of dried blood spots has been used to routinely monitor and optimise therapy for the treatment of certain inherited metabolic diseases without (e.g., phenylketonuria, homocystinuria [4,5]) and with (e.g., MSUD [6]) acute decompensations. This study suggests that this approach could be considered for urea cycle defects. Applications could include research in small animal models [27], clinical monitoring to adjust the diet or amino acid supplementation, and identification of patients with higher risk of hyperammonaemic decompensation.
It is known that ureagenesis, ammonia, and amino acids levels are influenced by fed or fasted states. Monitoring in outpatient clinics does not always allow blood sampling at comparable times, which can make the interpretation of results more difficult. Sampling at a similar time of the day performed by the patient could allow a more reliable comparison. This would be of interest as well for other amino acids, such as the branched chain amino acids, which have been reported to be low in some urea cycle deficient patients [30]. Implementation of a more reliable regular monitoring could help clinicians and specialised metabolic dieticians to tailor the protein-restricted diet and amino acid supplementation given to urea cycle patients. For example, regular monitoring of arginine could help preventing secondary creatine deficiency [31]. Monitoring of leucine and valine, which have been recently associated with faltering growth in urea cycle defects [32], could help to optimise supplementation to achieve physiological levels. Careful monitoring of glutamate and glutamine could identify patients with higher risk of decompensations [33].
In some specific cases in developing countries with limited resources and where patients live in remote locations, this approach could help aid diagnosis and guide genetic investigations. However, it is essential to emphasize that whilst this approach can complement the monitoring of therapies for treatment of urea cycle defects it cannot be used as a surrogate for ammonia level monitoring in an acute clinical situation with a patient at risk of hyperammonaemia.

4. Materials and Methods

4.1. Materials

l-Arginine-13C and l-Glutamine-1,2-13C2 from CK isotopes. Ibstock, UK, l-Citrulline-2,3,3,4,4,5,5-d7, l-Glutamic-2,3,3,4,4-d5 Acid, and l-Ornithine-2,3,3,4,4,5,5-d7 HCl from CDN isotopes. Pointe-Claire, Quebec, and Canada were used as internal standards. l-Arginine, l-Citrulline, l-Glutamine, l-Glutamic Acid, l-Argininosucciniate, and l-Ornithine were obtained from Sigma, St Louis, MO, USA.

4.2. Blood Spot Collection and Sample Preparation

Extraction of amino acids from DBS of anonymised healthy adult controls was adapted from Schulze et al. [34]. Whole blood was spiked onto a Guthrie card at the time of collection and allowed to dry at room temperature for 24 h before being stored at −20 °C in a foil bag with desiccant. On the day of analysis, a punch from the centre of the dried blood spot was placed in a 1.5 mL Eppendorf, which contained methanol and a mixture of internal standards (2 nM of l-Arginine-13C, l-Citrulline-2,3,3,4,4,5,5-d7, and l-Glutamic-2,3,3,4,4-d5 Acid, and 0.66 nM l-Glutamine-1,2-13C2 and l-Ornithine-2,3,3,4,4,5,5-d7). The supernatant was removed and centrifuged at 16,000× g for 5 min prior to injection of 3 µL into the LC-MSMS system.

4.3. LC-MSMS

The stationary phase used was a reversed-phase hybrid-based C18 column (Waters XTerra® RP18). A 5 μm 3.9 × 150 mm column was used (Waters, Milford, MA, USA), fitted with the appropriate guard column. A Waters Alliance 2795 LC system (Waters, Midford, MA, USA) high-performance liquid chromatography machine (HPLC) was used to separate the analytes of interest with a 25 min gradient profile modified from Footitt et al. [25]. Two mobile phases, (A) methanol and (B) 3.7% acetic acid, were used with 0.2mL/min flow rate according to the following gradient profile: Phase A: 85% for minute 1–6, 75% for minute 6–8; 5% for minute 9–15, 100% for minute 16–25; 100% B for the first minute, then gradual increase. The column was reconditioned for 10 min at the end of each run.
Detection used a Micromass Quattro micro API (Micromass UK Ltd., Cheshire, UK) tandem mass spectrometer using multiple reaction monitoring in positive ion mode. The temperature of the source and for desolvation were 120 °C and 350 °C, respectively. The capillary and cone voltages are described in Figure S1. The cone gas flow was 50 L/h. The syringe pump flow was set at 30 µL/min. The mass spectrometer vacuum was 4.3 × 10⁻³ mbar. The multiplier and extractor voltages were 650 Volts and 1 Volt, respectively. Dry and highly purified argon was used as the collision cell gas. Data were analysed using Masslynx 4.1 software (Micromass UK Ltd., Cheshire, UK). For quantification, standard curves of stable isotopes were compared to internal standards spiked in samples.

4.4. Analysis

Glutamine can be converted into glutamate either spontaneously or via the catalytic activity of glutaminase [35]. This spontaneous deamidation can occur during storage [36]. Taking this natural deamination into account, it was decided to combine the results for glutamate and glutamine. Similarly, the results for argininosuccinic acid and its anhydrides were combined. Argininosuccinic acid is capable of creating a structure with a five-membered ring when an acyl group binds an amine group located within the aliphatic chain of the molecule. This results in the loss of one molecule of water, creating an anhydride derivative.
Precision studies were performed according to international guidelines (International Conference on Harmonisation, Harmonised Tripartite Guideline, and Validation of Analytical Procedures: Text and Methodology Q2(R1). 1994). Whole blood was spiked onto a Guthrie card with 3 different known concentrations for each amino acid of interest: low (50 μM), medium (300 μM), and high (1500 μM). Reproducibility was assessed by inter- and intra-assay CV. The inter-assay CV was established by performing 5 assays spaced by >7 days apart. The intra-assay CV was established by 10 repeats on the same day. Recovery was calculated on 10 samples run on the same day.

4.5. Animals

The argininosuccinate lyase (ASL) deficient AslNeo/Neo mice (B6.129S7-Asltm1Brle/J) were purchased from Jackson Laboratory (Bar Harbor, ME, USA). Wild-type [37] and AslNeo/Neo littermates were maintained on standard rodent chow (Harlan 2018, Teklab Diets, Madison, WI, USA; protein content 18%) with free access to water. WT and AslNeo/Neo littermates were housed in the same cages. Mouse experiments were approved by institutional ethical review and performed under UK Home Office licences 70/6906 and 70/8030.

4.6. Ethics

Sampling of blood from patients with urea cycle defects was approved by the National Research Ethics Service Committee London-Bloomsbury (13/LO/0168).

4.7. Statistics

Data were analysed using GraphPad Prism 5.0 software, San Diego, CA, USA. The figure shows mean ± standard deviation (SD). Comparisons of continuous variables between three or more experimental groups were performed using the One-way ANOVA test with Dunnett’s post-test for pairwise comparison. p values <0.05 were considered statistically significant.

5. Conclusions

This work presents a rapid and sensitive method to measure underivatised urea cycle related amino acids in tiny samples as dried blood spots. The described method was optimised to allow the best extraction and detection without the additional step of derivatisation. Optimal separation was obtained with LC column which makes this method slightly slower compared to more recently described methods. Examples of in vivo application show the potential of this assay both for clinical and research purposes as a way to provide better monitoring of the protein restricted diet of Urea Cycle patients and for assessing efficacy of therapies.

Supplementary Materials

The following are available online at https://www.mdpi.com/2218-1989/9/11/275/s1, Table S1: Optimised mass spectrometry parameters used for the detection of underivatised urea cycle amino acids in positive ion mode. Figure S1: Optimisation of dried blood spot extraction. Figure S2: Matrix effect.

Author Contributions

J.B. and P.M. contributed to overall study design. J.B. performed experiments and wrote the manuscript. P.G. and S.N.W. supervised the animal work. All authors revised substantially and approved the final manuscript.

Funding

This work was supported by funding from Action Medical Research for Children Charity (grant GN2137) for J.B. and the NIHR Great Ormond Street Hospital Biomedical Research Centre for J.B., P.M., and P.G. The views expressed are those of the author(s) and not necessarily those of the NHS, the NIHR, or the Department of Health. P.M. is in receipt of a Great Ormond Street Hospital (GOSH) Children’s Charity Leadership award (V2516). S.N.W. received funding from ERC grant “Somabio” (260862) and from the MRC and NC3Rs grant (NC/L001780/1).

Acknowledgments

We thank the patients and families who have enrolled in this study. We thank M. McSweeney, M. Dorman, R. Bowers, M. Antonini, and L. Lee for their help in collecting samples for this study. We thank I. Doykov and M. Wilson for technical assistance with LC-MS/MS.

Conflicts of Interest

The authors declare no conflicts of interest.

References

  1. Wang, C.; Zhu, H.; Zhang, W.; Song, F.; Liu, Z.; Liu, S. Second-tier test for quantification of underivatized amino acids in dry blood spot for metabolic diseases in newborn screening. Amino Acids 2013, 44, 661–671. [Google Scholar] [CrossRef] [PubMed]
  2. Wilson, M.P.; Footitt, E.J.; Papandreou, A.; Uudelepp, M.L.; Pressler, R.; Stevenson, D.C.; Gabriel, C.; McSweeney, M.; Baggot, M.; Burke, D.; et al. An LC-MS/MS-Based Method for the Quantification of Pyridox (am) ine 5’-Phosphate Oxidase Activity in Dried Blood Spots from Patients with Epilepsy. Anal. Chem. 2017, 89, 8892–8900. [Google Scholar] [CrossRef] [PubMed]
  3. Liu, Y.; Yi, F.; Kumar, A.B.; Kumar Chennamaneni, N.; Hong, X.; Scott, C.R.; Gelb, M.H.; Turecek, F. Multiplex Tandem Mass Spectrometry Enzymatic Activity Assay for Newborn Screening of the Mucopolysaccharidoses and Type 2 Neuronal Ceroid Lipofuscinosis. Clin. Chem. 2017, 63, 1118–1126. [Google Scholar] [CrossRef] [PubMed]
  4. De Silva, V.; Oldham, C.D.; May, S.W. L-Phenylalanine concentration in blood of phenylketonuria patients: A modified enzyme colorimetric assay compared with amino acid analysis, tandem mass spectrometry, and HPLC methods. Clin. Chem. Lab. Med. 2010, 48, 1271–1279. [Google Scholar] [CrossRef] [PubMed]
  5. Bartl, J.; Chrastina, P.; Krijt, J.; Hodik, J.; Peskova, K.; Kozich, V. Simultaneous determination of cystathionine, total homocysteine, and methionine in dried blood spots by liquid chromatography/tandem mass spectrometry and its utility for the management of patients with homocystinuria. Clin. Chim. Acta. 2014, 437, 211–217. [Google Scholar] [CrossRef] [PubMed]
  6. Alodaib, A.; Carpenter, K.; Wiley, V.; Sim, K.; Christodoulou, J.; Wilcken, B. An improved ultra performance liquid chromatography-tandem mass spectrometry method for the determination of alloisoleucine and branched chain amino acids in dried blood samples. Ann. Clin. Biochem. 2011, 48, 468–470. [Google Scholar] [CrossRef] [PubMed]
  7. Haberle, J.; Burlina, A.; Chakrapani, A.; Dixon, M.; Karall, D.; Lindner, M.; Mandel, H.; Martinelli, D.; Pintos-Morell, G.; Santer, R.; et al. Suggested guidelines for the diagnosis and management of urea cycle disorders: First revision. J. Inherit. Metab. Dis. 2019. [Google Scholar] [CrossRef] [PubMed]
  8. Lee, B.; Diaz, G.A.; Rhead, W.; Lichter-Konecki, U.; Feigenbaum, A.; Berry, S.A.; Le Mons, C.; Bartley, J.A.; Longo, N.; Nagamani, S.C.; et al. Blood ammonia and glutamine as predictors of hyperammonemic crises in patients with urea cycle disorder. Genet. Med. 2015, 17, 561–568. [Google Scholar] [CrossRef] [PubMed]
  9. McHugh, D.; Cameron, C.A.; Abdenur, J.E.; Abdulrahman, M.; Adair, O.; Al Nuaimi, S.A.; Ahlman, H.; Allen, J.J.; Antonozzi, I.; Archer, S.; et al. Clinical validation of cutoff target ranges in newborn screening of metabolic disorders by tandem mass spectrometry: A worldwide collaborative project. Genet. Med. 2011, 13, 230–254. [Google Scholar] [CrossRef] [PubMed]
  10. Chace, D.H.; Kalas, T.A.; Naylor, E.W. Use of tandem mass spectrometry for multianalyte screening of dried blood specimens from newborns. Clin. Chem. 2003, 49, 1797–1817. [Google Scholar] [CrossRef] [PubMed]
  11. Moore, S.; Spackman, D.H.; Stein, W.H. Automatic recording apparatus for use in the chromatography of amino acids. Fed. Proc. 1958, 17, 1107–1115. [Google Scholar] [PubMed]
  12. Dale, Y.; Mackey, V.; Mushi, R.; Nyanda, A.; Maleque, M.; Ike, J. Simultaneous measurement of phenylalanine and tyrosine in phenylketonuric plasma and dried blood by high-performance liquid chromatography. J. Chromatogr. B Anal. Technol. Biomed. Life Sci. 2003, 788, 1–8. [Google Scholar] [CrossRef]
  13. Piraud, M.; Vianey-Saban, C.; Petritis, K.; Elfakir, C.; Steghens, J.P.; Morla, A.; Bouchu, D. ESI-MS/MS analysis of underivatised amino acids: A new tool for the diagnosis of inherited disorders of amino acid metabolism. Fragmentation study of 79 molecules of biological interest in positive and negative ionisation mode. Rapid Commun. Mass Spectrom. 2003, 17, 1297–1311. [Google Scholar] [CrossRef] [PubMed]
  14. Waterval, W.A.; Scheijen, J.L.; Ortmans-Ploemen, M.M.; Habets-van der Poel, C.D.; Bierau, J. Quantitative UPLC-MS/MS analysis of underivatised amino acids in body fluids is a reliable tool for the diagnosis and follow-up of patients with inborn errors of metabolism. Clin. Chim. Acta 2009, 407, 36–42. [Google Scholar] [CrossRef] [PubMed]
  15. Wang, C.; Zhang, W.; Song, F.; Liu, Z.; Liu, S. A simple method for the analysis by MS/MS of underivatized amino acids on dry blood spots from newborn screening. Amino Acids 2012, 42, 1889–1895. [Google Scholar] [CrossRef] [PubMed]
  16. Kruve, A.; Leito, I.; Herodes, K. Combating matrix effects in LC/ESI/MS: The extrapolative dilution approach. Anal. Chim. Acta 2009, 651, 75–80. [Google Scholar] [CrossRef] [PubMed]
  17. Li, W.; Tse, F.L. Dried blood spot sampling in combination with LC-MS/MS for quantitative analysis of small molecules. Biomed. Chromatogr. 2010, 24, 49–65. [Google Scholar] [CrossRef] [PubMed]
  18. Walter, J.H.; Patterson, A.; Till, J.; Besley, G.T.; Fleming, G.; Henderson, M.J. Bloodspot acylcarnitine and amino acid analysis in cord blood samples: Efficacy and reference data from a large cohort study. J. Inherit. Metab. Dis. 2009, 32, 95–101. [Google Scholar] [CrossRef] [PubMed]
  19. Odoardi, S.; Anzillotti, L.; Strano-Rossi, S. Simplifying sample pretreatment: Application of dried blood spot (DBS) method to blood samples, including postmortem, for UHPLC-MS/MS analysis of drugs of abuse. Forensic Sci. Int. 2014, 243, 61–67. [Google Scholar] [CrossRef] [PubMed]
  20. Bloom, K.; Meyers, G.D.; Bennett, M.J. D.; Bennett, J. A Quantitative Method for the Measurement of Dried Blood Spot Amino Acids Using Ultra-Performance Liquid Chromatography. J. Appl. Lab. Med. 2016, 1, 271–279. [Google Scholar] [CrossRef]
  21. Moretti, F.; Birarelli, M.; Carducci, C.; Pontecorvi, A.; Antonozzi, I. Simultaneous high-performance liquid chromatographic determination of amino acids in a dried blood spot as a neonatal screening test. J. Chromatogr. 1990, 511, 131–136. [Google Scholar] [CrossRef]
  22. Nagy, K.; Takats, Z.; Pollreisz, F.; Szabo, T.; Vekey, K. Direct tandem mass spectrometric analysis of amino acids in dried blood spots without chemical derivatization for neonatal screening. Rapid Commun. Mass Spectrom. 2003, 17, 983–990. [Google Scholar] [CrossRef] [PubMed]
  23. Piraud, M.; Vianey-Saban, C.; Petritis, K.; Elfakir, C.; Steghens, J.P.; Bouchu, D. Ion-pairing reversed-phase liquid chromatography/electrospray ionization mass spectrometric analysis of 76 underivatized amino acids of biological interest: A new tool for the diagnosis of inherited disorders of amino acid metabolism. Rapid Commun. Mass Spectrom. 2005, 19, 1587–1602. [Google Scholar] [CrossRef] [PubMed]
  24. Wuyts, B.; Stove, V.; Goossens, L. Critical sample pretreatment in monitoring dried blood spot citrulline. Clin. Chim. Acta 2007, 386, 105–109. [Google Scholar] [CrossRef] [PubMed]
  25. Footitt, E.J.; Clayton, P.T.; Mills, K.; Heales, S.J.; Neergheen, V.; Oppenheim, M.; Mills, P.B. Measurement of plasma B6 vitamer profiles in children with inborn errors of vitamin B6 metabolism using an LC-MS/MS method. J. Inherit. Metab. Dis. 2013, 36, 139–145. [Google Scholar] [CrossRef] [PubMed]
  26. Zytkovicz, T.H.; Fitzgerald, E.F.; Marsden, D.; Larson, C.A.; Shih, V.E.; Johnson, D.M.; Strauss, A.W.; Comeau, A.M.; Eaton, R.B.; Grady, G.F. Tandem mass spectrometric analysis for amino, organic, and fatty acid disorders in newborn dried blood spots: A two-year summary from the New England Newborn Screening Program. Clin. Chem. 2001, 47, 1945–1955. [Google Scholar] [PubMed]
  27. Baruteau, J.; Perocheau, D.P.; Hanley, J.; Lorvellec, M.; Rocha-Ferreira, E.; Karda, R.; Ng, J.; Suff, N.; Diaz, J.A.; Rahim, A.A.; et al. Argininosuccinic aciduria fosters neuronal nitrosative stress reversed by Asl gene transfer. Nat. Commun. 2018, 9, 3505. [Google Scholar] [CrossRef] [PubMed]
  28. Baruteau, J.; Jameson, E.; Morris, A.A.; Chakrapani, A.; Santra, S.; Vijay, S.; Kocadag, H.; Beesley, C.E.; Grunewald, S.; Murphy, E.; et al. Expanding the phenotype in argininosuccinic aciduria: Need for new therapies. J. Inherit. Metab. Dis. 2017, 40, 357–368. [Google Scholar] [CrossRef] [PubMed] [Green Version]
  29. Yunus, Z.M.; Rahman, S.A.; Choy, Y.S.; Keng, W.T.; Ngu, L.H. Pilot study of newborn screening of inborn error of metabolism using tandem mass spectrometry in Malaysia: Outcome and challenges. J. Pediatr. Endocrinol. Metab. 2016, 29, 1031–1039. [Google Scholar] [CrossRef] [PubMed]
  30. Burrage, L.C.; Jain, M.; Gandolfo, L.; Lee, B.H.; Nagamani, S.C.; Urea Cycle Disorders Consortium. Sodium phenylbutyrate decreases plasma branched-chain amino acids in patients with urea cycle disorders. Mol. Genet. Metab. 2014, 113, 131–135. [Google Scholar] [CrossRef] [PubMed] [Green Version]
  31. Boenzi, S.; Pastore, A.; Martinelli, D.; Goffredo, B.M.; Boiani, A.; Rizzo, C.; Dionisi-Vici, C. Creatine metabolism in urea cycle defects. J. Inherit. Metab. Dis. 2012, 35, 647–653. [Google Scholar] [CrossRef] [PubMed]
  32. Molema, F.; Gleich, F.; Burgard, P.; van der Ploeg, A.T.; Summar, M.L.; Chapman, K.A.; Lund, A.M.; Rizopoulos, D.; Kolker, S.; Williams, M.; et al. Decreased plasma l-arginine levels in organic acidurias (MMA and PA) and decreased plasma branched-chain amino acid levels in urea cycle disorders as a potential cause of growth retardation: Options for treatment. Mol. Genet. Metab. 2019, 126, 397–405. [Google Scholar] [CrossRef] [PubMed]
  33. Lee, B.; Diaz, G.A.; Rhead, W.; Lichter-Konecki, U.; Feigenbaum, A.; Berry, S.A.; Le Mons, C.; Bartley, J.; Longo, N.; Nagamani, S.C.; et al. Glutamine and hyperammonemic crises in patients with urea cycle disorders. Mol. Genet. Metab. 2016, 117, 27–32. [Google Scholar] [CrossRef] [PubMed]
  34. Schulze, A.; Lindner, M.; Kohlmuller, D.; Olgemoller, K.; Mayatepek, E.; Hoffmann, G.F. Expanded newborn screening for inborn errors of metabolism by electrospray ionization-tandem mass spectrometry: Results, outcome, and implications. Pediatrics 2003, 111, 1399–1406. [Google Scholar] [CrossRef] [PubMed] [Green Version]
  35. Serra, A.; Gallart-Palau, X.; Wei, J.; Sze, S.K. Characterization of Glutamine Deamidation by Long-Length Electrostatic Repulsion-Hydrophilic Interaction Chromatography-Tandem Mass Spectrometry (LERLIC-MS/MS) in Shotgun Proteomics. Anal. Chem. 2016, 88, 10573–10582. [Google Scholar] [CrossRef] [PubMed] [Green Version]
  36. Darmaun, D.; Manary, M.J.; Matthews, D.E. A method for measuring both glutamine and glutamate levels and stable isotopic enrichments. Anal. Biochem. 1985, 147, 92–102. [Google Scholar] [CrossRef]
  37. Emery, J.L.; Howat, A.J.; Variend, S.; Vawter, G.F. Investigation of inborn errors of metabolism in unexpected infant deaths. Lancet 1988, 2, 29–31. [Google Scholar] [CrossRef]
Figure 1. Linearity of measured amino acids in dried blood spots. Five calibration curves in methanol are presented. Arginine, citrulline, glutamate, ornithine, and argininosuccinic acid and argininosuccinic acid anhydrides were shown to be linear between 0 to 500 μM and glutamine from 0 to 200 μM.
Metabolites 09 00275 g001
Figure 2. Monitoring of urea cycle-related amino acids overtime in AslNeo/Neo mice. (A) Arginine, (B) citrulline, (C) argininosuccinic acid and anhydrides, and (D) glutamine and glutamate in WT (n = 8–18), and AslNeo/Neo (n = 5–10) littermates. Graphs represent mean ± SD.
Metabolites 09 00275 g002
Figure 3. Correlation between ammonaemia versus glutamine and glutamate levels in dried blood spots. Parameters were measured in wild type (black; n = 9) and untreated AslNeo/Neo (red; n = 15) littermates. Spearman’s rank correlation coefficient test (rs = 0.74; p < 0.0001).
Metabolites 09 00275 g003
Figure 4. Monitoring of arginine levels in dried blood spot. Samples were collected from wild type (WT, n = 12), argininosuccinate lyase deficient littermates untreated (MUT, n = 4), or treated with daily intraperitoneal injections of L-arginine (1 g/kg/d) (MUT + ARG, n = 6). Samples were collected at 3–8 weeks of life. Graphs represent mean ± SD.
Metabolites 09 00275 g004
Figure 5. Monitoring of urea cycle-related amino acids in patients with urea cycle defects. (A) Arginine, (B) citrulline, (C) argininosuccinic acid and anhydrides, (D) summed glutamine and glutamate in ornithine transcarbamylase deficiency (OTCD, n = 3), argininosuccinate synthase deficiency (ASSD, n = 3), argininosuccinate lyase deficiency (ASLD, n = 2), and N-acetylglutamine synthase deficiency (NAGSD, n = 1 measured at 2 time points). Graphs represent mean ± SD.
Metabolites 09 00275 g005
Table 1. Recovery, intra- and inter-batch coefficient of variations for each analyte.
Amino acid Amound Added to Whole Blood50 μM300 μM1500 μM
Parameter testedRecovery (%)Intrabatch CV (%)Interbatch CV (%)Recovery (%)Intrabatch CV (%)Interbatch CV (%)Recovery (%)Intrabatch CV (%)Interbatch CV (%)
Arginine995598249765
Citrulline104291163210673
Ornithine9953101329933
Glutamate101261072210244
Glutamine991099229621
Argininosuccinic acid and anhydrides74927110314103012
Three different concentrations were measured: low 50 μM, medium 300 μM, and high 1500 μM. Amino acids were spiked onto a Guthrie card. CV: coefficient of variance.

