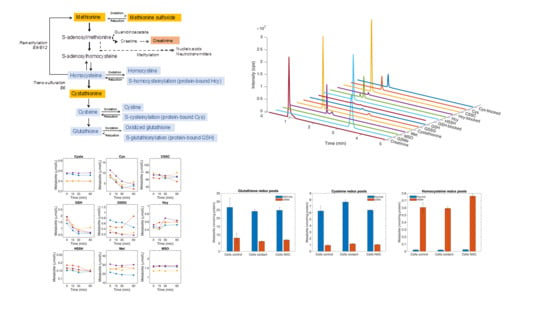
Targeted Metabolic Profiling of Methionine Cycle Metabolites and Redox Thiol Pools in Mammalian Plasma, Cells and Urine
Abstract
1. Introduction
2. Materials
2.1. Materials
2.2. Lysis Buffer
2.3. Aminothiol Preserving Solution (APS)
3. Methods
3.1. Cell Culture
3.2. Isolation of Red Blood Cells (RBCs)
3.3. Sample Handling and Storage
3.3.1. Untreated Plasma
3.3.2. APS-Treated Plasma
3.3.3. Urine
3.3.4. Cells
3.3.5. Conditioned Culture Medium
3.4. Calibration Curves
3.4.1. Total Reduced Thiols
3.4.2. Oxidized, Reduced and Total Thiol Pools
3.5. Internal Standard Solution
3.6. LC-MS/MS Method
3.6.1. Analysis of Matrix Effects
3.6.2. Stability, Recovery and Carry Over
3.6.3. Validation
3.7. Sample Pre-Analytics and Preparation
3.7.1. Total Thiol and Thioether Metabolites in Untreated Plasma
3.7.2. Stability of Thiol and Thioether Metabolites in Freshly isolated Untreated Plasma
3.7.3. Redox Thiol Pools and Thiol and Thioether Metabolites in APS-treated Plasma
3.7.4. Total Thiol and Thioether Metabolites in Untreated Cell Lysates
3.7.5. Redox Thiol Pools, Thiol and Thioether Metabolites in APS-treated Cells
3.7.6. Total Thiol and Thioether Metabolites in Conditioned (Spent) Culture Medium
3.7.7. Total Thiol and Thioether Metabolites in Urine
3.8. Ethical Approval
3.9. Data Analysis
4. Results
4.1. Separation and Quantification of Thiol and Thioether Metabolites by LC-MS/MS
4.2. Linearity Range and Limit of Quantification
4.3. Analysis of Matrix Effects
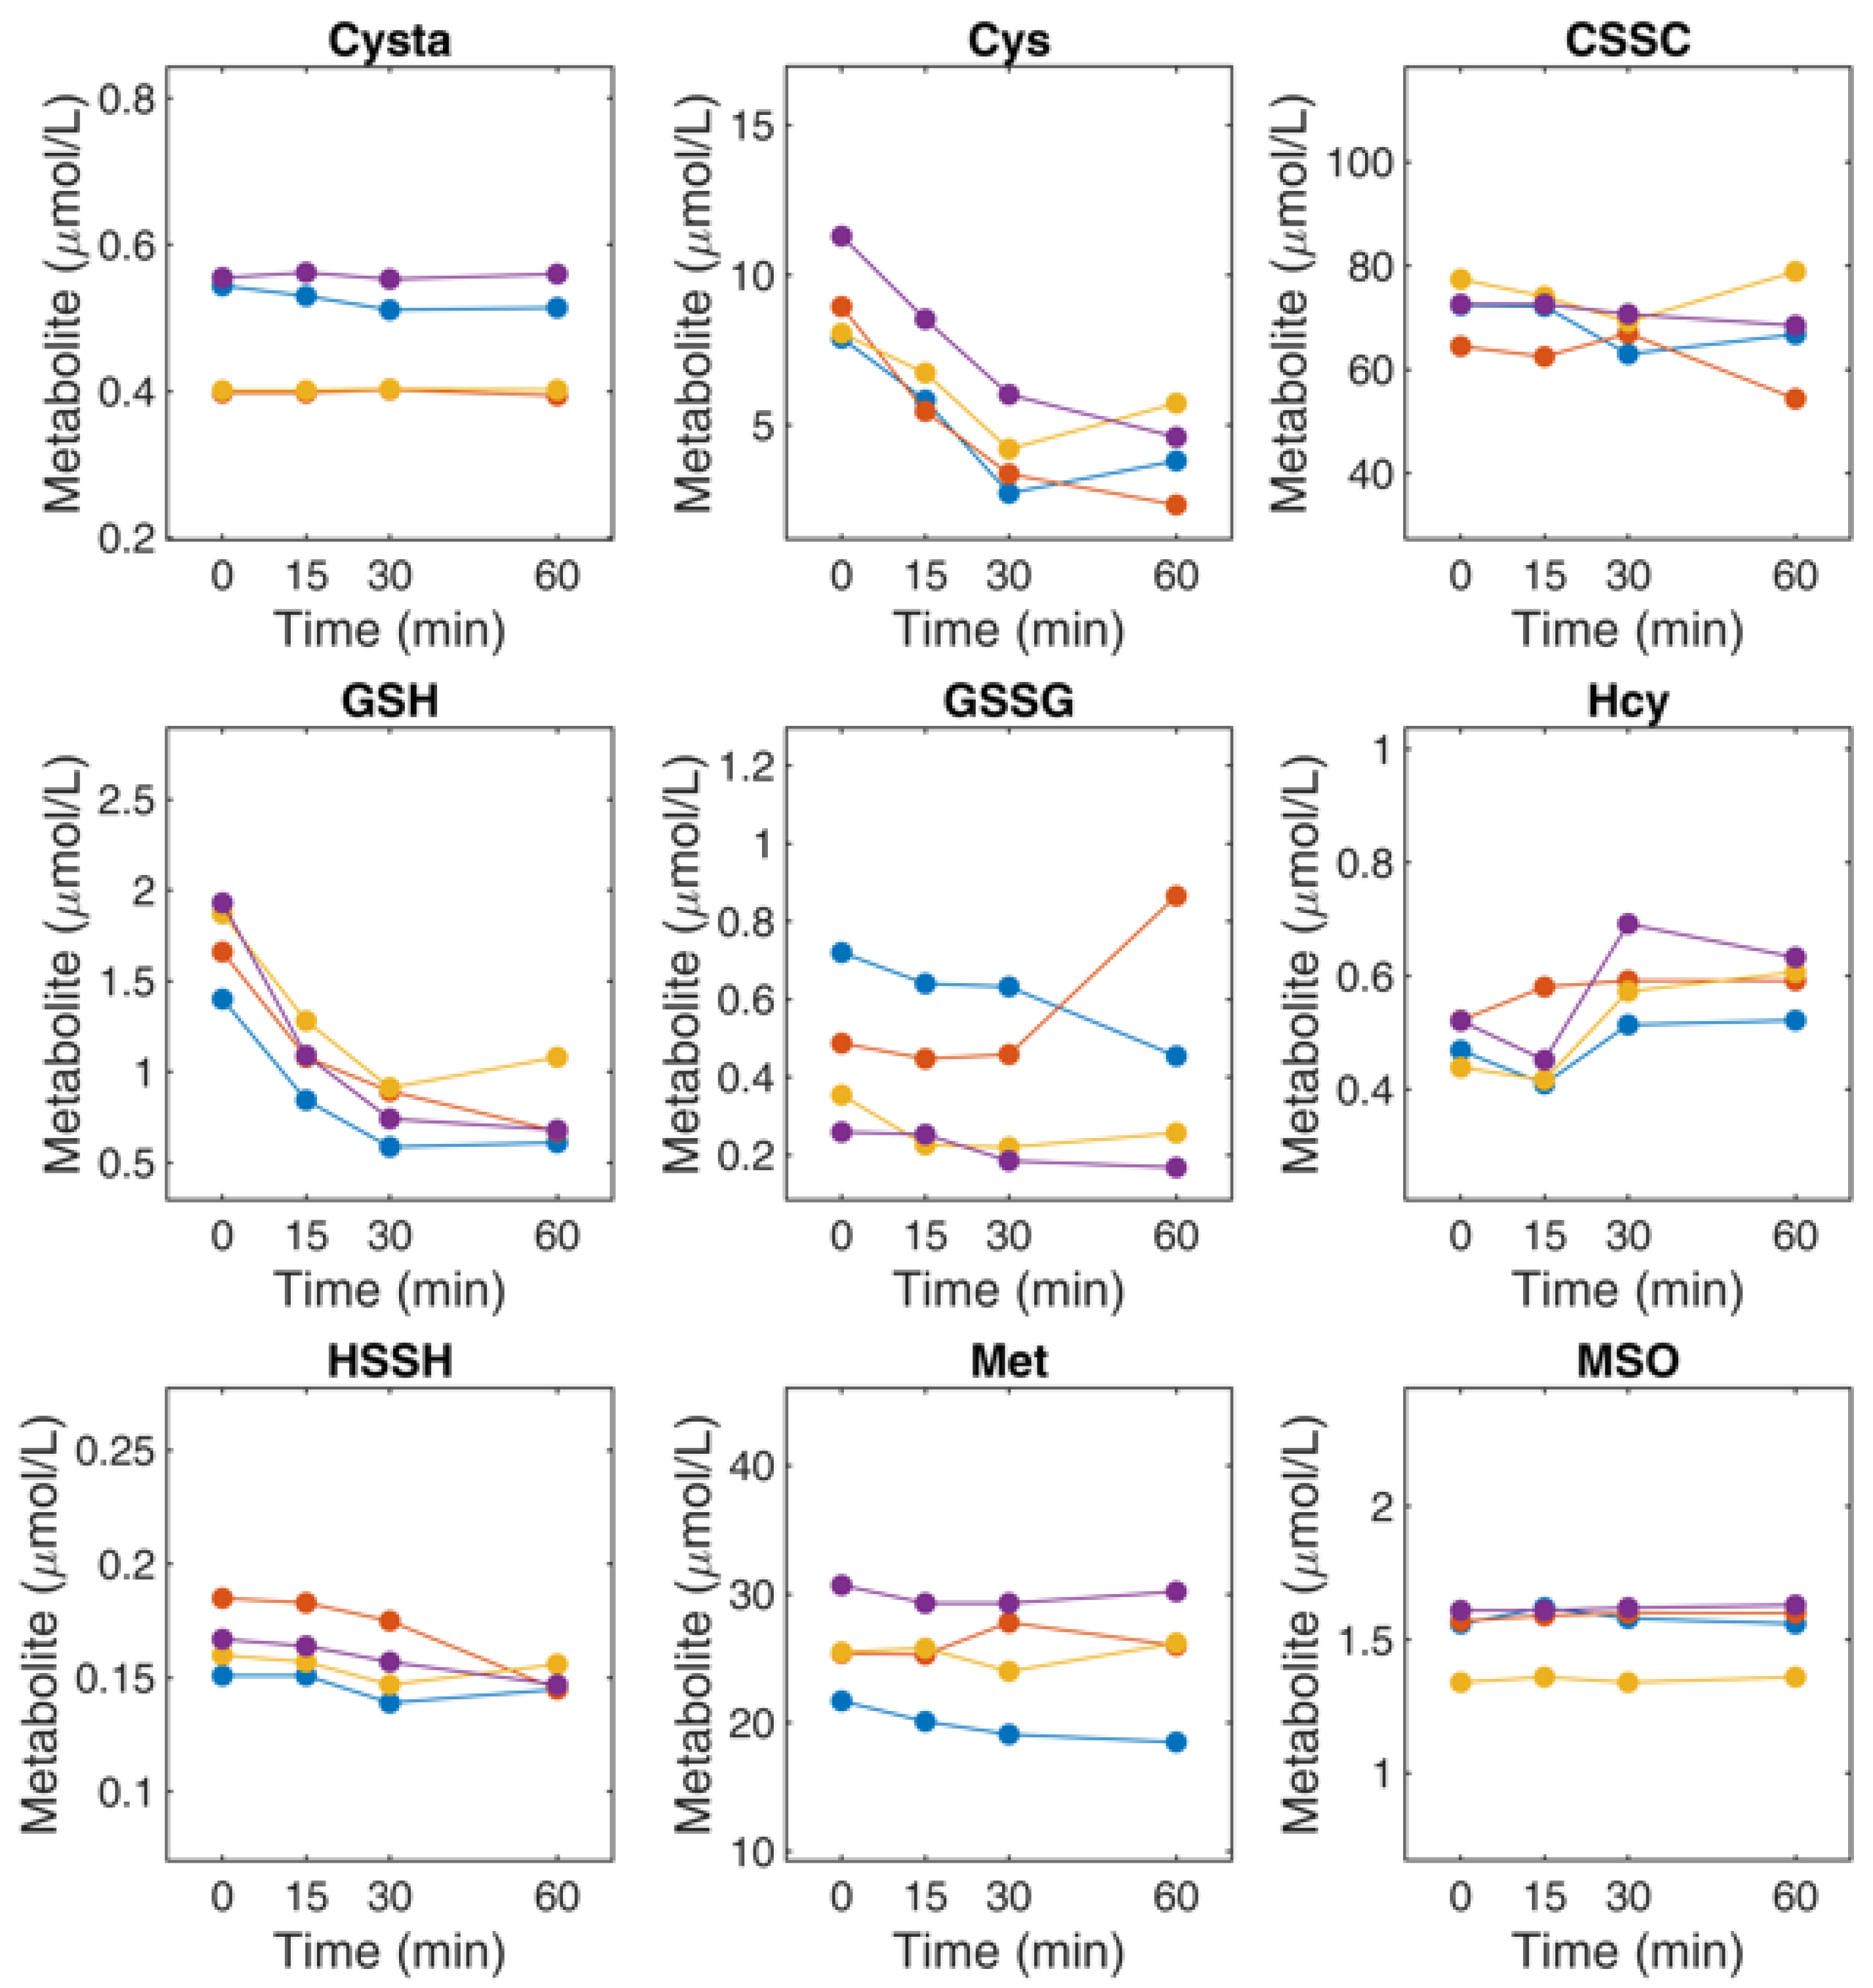
4.4. Stability and Recovery of Thiol and Thioether Metabolites in Plasma
4.5. Profile of Thiol and Thioether Metabolites as Examined in Diagnostic Platforms
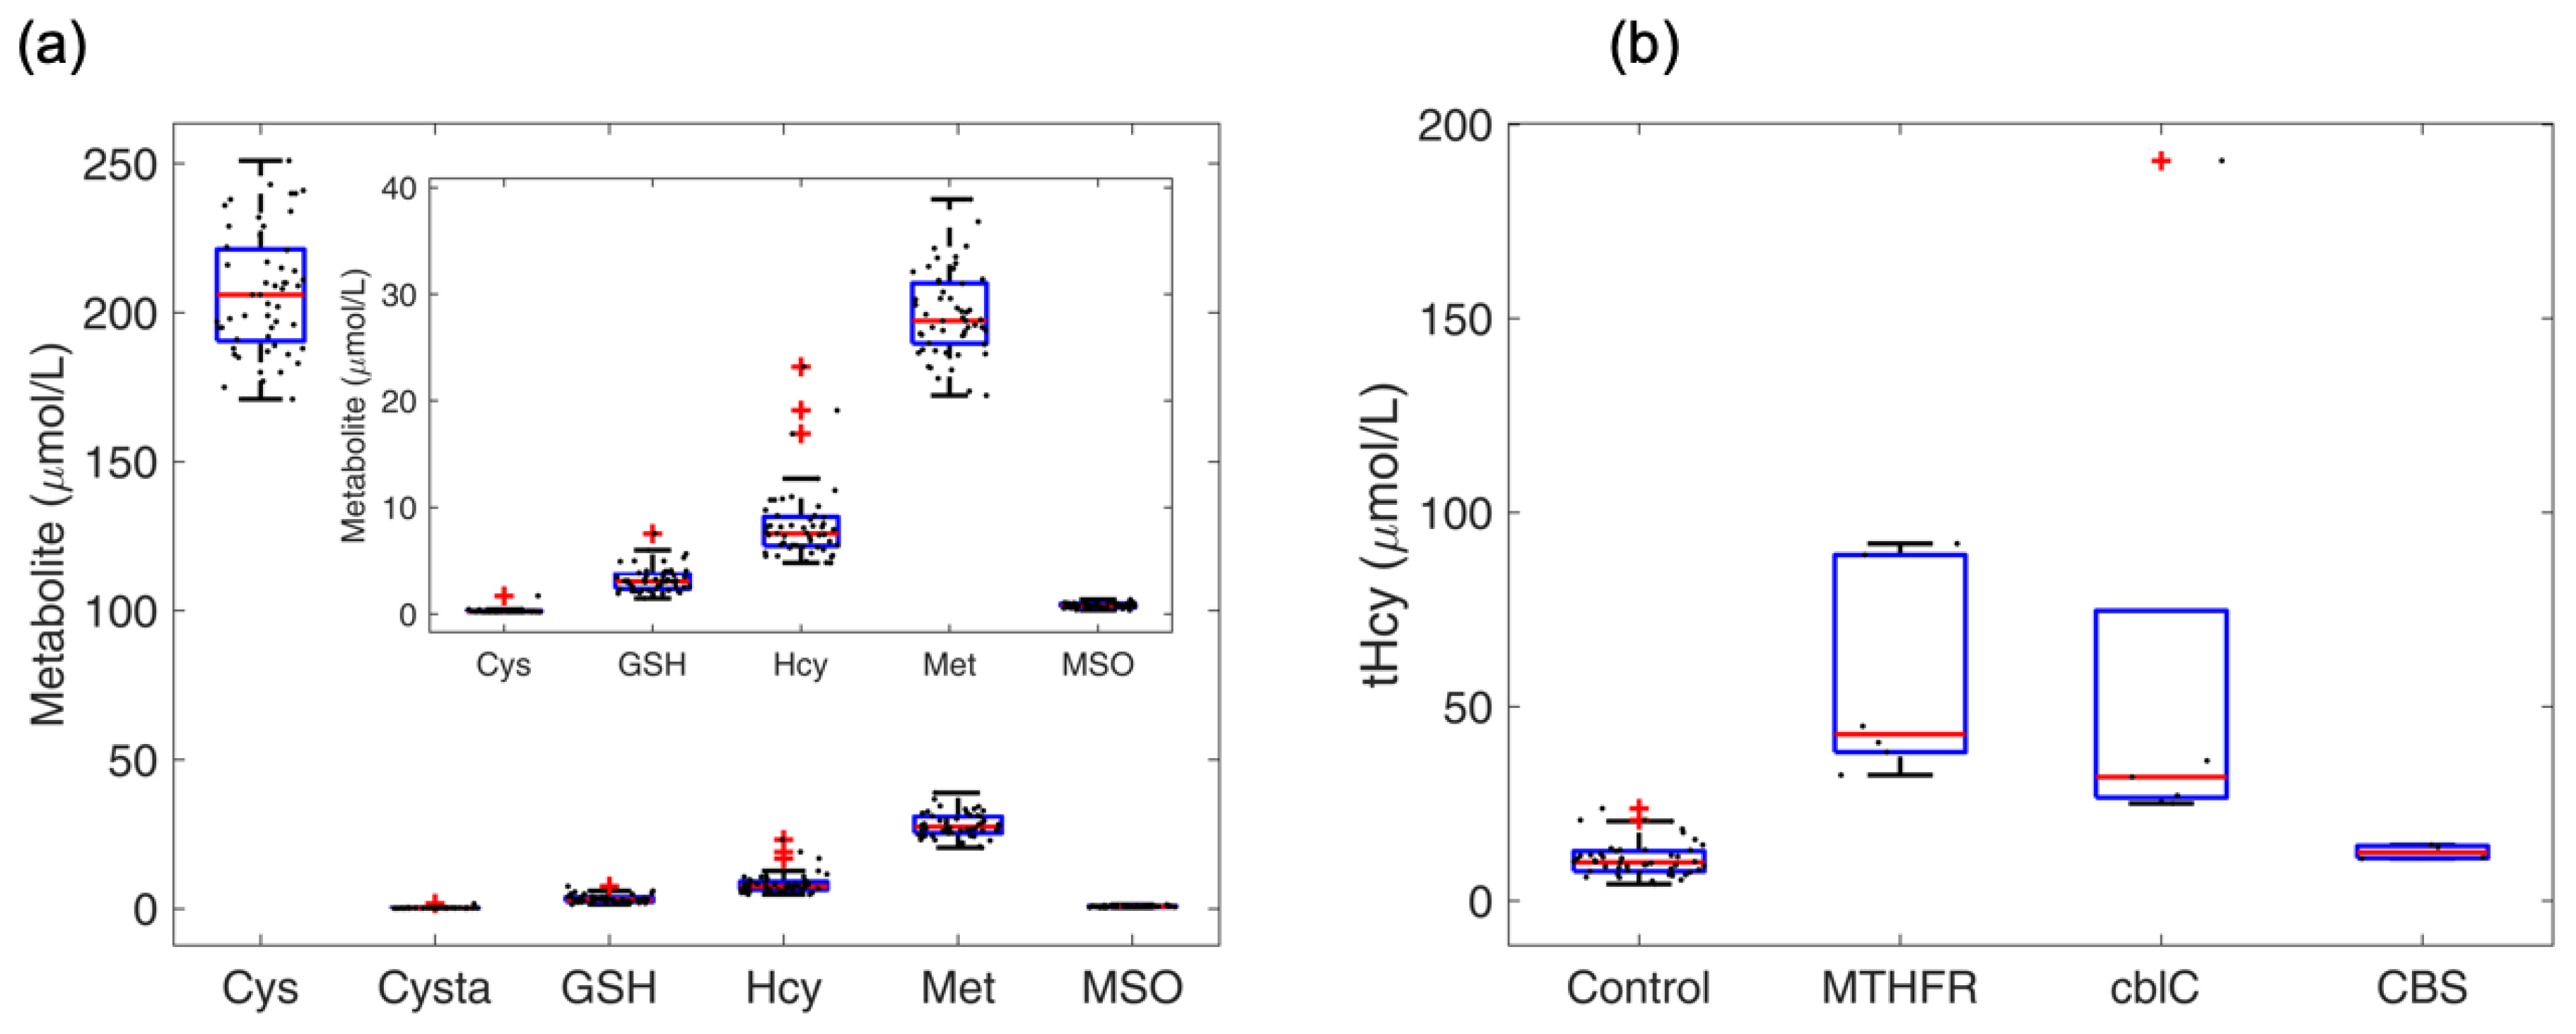
4.6. Profile of Thiol and Thioether Metabolites in Commercial Human and Animal Plasma
4.7. Determination of Thiol and Thioether Metabolites in Their Free-reduced, Oxidized and Protein-Bound Forms
4.8. Determination of Total Thiol and Thioether Metabolites and Creatinine in Urine
4.9. Determination of Thiol and Thioether Metabolites in RBCs: Effect of Sample Handling on Thiol and Thioether Metabolites
4.10. Determination of Thiol and Thioether Metabolites in Various Cell Types
4.11. Determination of Thiol and Thioether Metabolites in Conditioned Culture Medium
4.12. Determination of Intracellular and Extracellular Thiols and Thioethers in HepG2 Cells upon Oxidant Challenge and Antioxidant Supplementation
5. Discussion
6. Strengths and Limitations of the Study
7. Conclusions
Supplementary Materials
Author Contributions
Funding
Acknowledgments
Conflicts of Interest
Abbreviations
References
- Ducker, G.S.; Rabinowitz, J.D. One-Carbon Metabolism in Health and Disease. Cell Metab. 2017, 25, 27–42. [Google Scholar] [CrossRef]
- Turell, L.; Radi, R.; Alvarez, B. The thiol pool in human plasma: The central contribution of albumin to redox processes. Free Radic. Biol. Med. 2013, 65, 244–253. [Google Scholar] [CrossRef]
- Ueland, P.M.; Mansoor, M.A.; Guttormsen, A.B.; Muller, F.; Aukrust, P.; Refsum, H.; Svardal, A.M. Reduced, oxidized and protein-bound forms of homocysteine and other aminothiols in plasma comprise the redox thiol status—A possible element of the extracellular antioxidant defense system. J. Nutr. 1996, 126, 1281S–1284S. [Google Scholar] [CrossRef]
- Jakubowski, H. Homocysteine Modification in Protein Structure/Function and Human Disease. Physiol. Rev. 2019, 99, 555–604. [Google Scholar] [CrossRef]
- Nakashima, F.; Shibata, T.; Kamiya, K.; Yoshitake, J.; Kikuchi, R.; Matsushita, T.; Ishii, I.; Giménez-Bastida, J.A.; Schneider, C.; Uchida, K. Structural and functional insights into S-thiolation of human serum albumins. Sci. Rep. 2018, 8, 932. [Google Scholar] [CrossRef]
- Grek, C.L.; Zhang, J.; Manevich, Y.; Townsend, D.M.; Tew, K.D. Causes and consequences of cysteine S-glutathionylation. J. Biol. Chem. 2013, 288, 26497–26504. [Google Scholar] [CrossRef]
- Banerjee, R. Redox outside the box: Linking extracellular redox remodeling with intracellular redox metabolism. J. Biol. Chem. 2012, 287, 4397–4402. [Google Scholar] [CrossRef]
- Hannibal, L.; Lysne, V.; Bjorke-Monsen, A.L.; Behringer, S.; Grunert, S.C.; Spiekerkoetter, U.; Jacobsen, D.W.; Blom, H.J. Biomarkers and Algorithms for the Diagnosis of Vitamin B12 Deficiency. Front. Mol. Biosci. 2016, 3, 27. [Google Scholar] [CrossRef]
- Green, R.; Allen, L.H.; Bjorke-Monsen, A.L.; Brito, A.; Gueant, J.L.; Miller, J.W.; Molloy, A.M.; Nexo, E.; Stabler, S.; Toh, B.H.; et al. Vitamin B12 deficiency. Nat. Rev. Dis. Primers 2017, 3, 17040. [Google Scholar] [CrossRef]
- Ueland, P.M.; Ulvik, A.; Rios-Avila, L.; Midttun, O.; Gregory, J.F. Direct and Functional Biomarkers of Vitamin B6 Status. Annu. Rev. Nutr. 2015, 35, 33–70. [Google Scholar] [CrossRef]
- Bailey, L.B.; Stover, P.J.; McNulty, H.; Fenech, M.F.; Gregory, J.F., 3rd; Mills, J.L.; Pfeiffer, C.M.; Fazili, Z.; Zhang, M.; Ueland, P.M.; et al. Biomarkers of Nutrition for Development-Folate Review. J. Nutr. 2015, 145, 1636S–1680S. [Google Scholar] [CrossRef]
- Jacobsen, D.W.; Hannibal, L. Redox signaling in inherited diseases of metabolism. Curr. Opin. Physiol. 2019, 9, 48–55. [Google Scholar] [CrossRef]
- Sinclair, L.V.; Howden, A.J.; Brenes, A.; Spinelli, L.; Hukelmann, J.L.; Macintyre, A.N.; Liu, X.; Thomson, S.; Taylor, P.M.; Rathmell, J.C.; et al. Antigen receptor control of methionine metabolism in T cells. eLife 2019, 8. [Google Scholar] [CrossRef]
- Klein Geltink, R.I.; Pearce, E.L. The importance of methionine metabolism. eLife 2019, 8. [Google Scholar] [CrossRef]
- Mak, T.W.; Grusdat, M.; Duncan, G.S.; Dostert, C.; Nonnenmacher, Y.; Cox, M.; Binsfeld, C.; Hao, Z.; Brustle, A.; Itsumi, M.; et al. Glutathione Primes T Cell Metabolism for Inflammation. Immunity 2017, 46, 675–689. [Google Scholar] [CrossRef]
- Klein Geltink, R.I.; O’Sullivan, D.; Pearce, E.L. Caught in the cROSsfire: GSH Controls T Cell Metabolic Reprogramming. Immunity 2017, 46, 525–527. [Google Scholar] [CrossRef]
- Patel, R.S.; Ghasemzadeh, N.; Eapen, D.J.; Sher, S.; Arshad, S.; Ko, Y.A.; Veledar, E.; Samady, H.; Zafari, A.M.; Sperling, L.; et al. Novel Biomarker of Oxidative Stress Is Associated With Risk of Death in Patients With Coronary Artery Disease. Circulation 2016, 133, 361–369. [Google Scholar] [CrossRef]
- Ulvik, A.; Hustad, S.; McCann, A.; Midttun, O.; Nygard, O.K.; Ueland, P.M. Ratios of One-Carbon Metabolites Are Functional Markers of B-Vitamin Status in a Norwegian Coronary Angiography Screening Cohort. J. Nutr. 2017, 147, 1167–1173. [Google Scholar] [CrossRef]
- Gylling, B.; Myte, R.; Ulvik, A.; Ueland, P.M.; Midttun, O.; Schneede, J.; Hallmans, G.; Haggstrom, J.; Johansson, I.; Van Guelpen, B.; et al. One-carbon metabolite ratios as functional B-vitamin markers and in relation to colorectal cancer risk. Int. J. Cancer 2019, 144, 947–956. [Google Scholar] [CrossRef] [PubMed]
- Gao, X.; Sanderson, S.M.; Dai, Z.; Reid, M.A.; Cooper, D.E.; Lu, M.; Richie, J.P., Jr.; Ciccarella, A.; Calcagnotto, A.; Mikhael, P.G.; et al. Dietary methionine influences therapy in mouse cancer models and alters human metabolism. Nature 2019, 572, 397–401. [Google Scholar] [CrossRef]
- Herzog, K.; IJlst, L.; van Cruchten, A.G.; van Roermund, C.W.T.; Kulik, W.; Wanders, R.J.A.; Waterham, H.R. An UPLC-MS/MS Assay to Measure Glutathione as Marker for Oxidative Stress in Cultured Cells. Metabolites 2019, 9, 45. [Google Scholar] [CrossRef] [PubMed]
- Sutton, T.R.; Minnion, M.; Barbarino, F.; Koster, G.; Fernandez, B.O.; Cumpstey, A.F.; Wischmann, P.; Madhani, M.; Frenneaux, M.P.; Postle, A.D.; et al. A robust and versatile mass spectrometry platform for comprehensive assessment of the thiol redox metabolome. Redox Biol. 2018, 16, 359–380. [Google Scholar] [CrossRef] [PubMed]
- Ibanez, C.; Simo, C.; Valdes, A.; Campone, L.; Piccinelli, A.L.; Garcia-Canas, V.; Cifuentes, A. Metabolomics of adherent mammalian cells by capillary electrophoresis-mass spectrometry: HT-29 cells as case study. J. Pharm. Biomed. Anal. 2015, 110, 83–92. [Google Scholar] [CrossRef] [PubMed]
- D’Agostino, L.A.; Lam, K.P.; Lee, R.; Britz-McKibbin, P. Comprehensive plasma thiol redox status determination for metabolomics. J. Proteome Res. 2011, 10, 592–603. [Google Scholar] [CrossRef] [PubMed]
- Mashima, R.; Nakanishi-Ueda, T.; Yamamoto, Y. Simultaneous determination of methionine sulfoxide and methionine in blood plasma using gas chromatography-mass spectrometry. Anal. Biochem. 2003, 313, 28–33. [Google Scholar] [CrossRef]
- Bukowski, M.R.; Picklo, M.J., Sr. Quantitation of Glutathione, Glutathione Disulphide, and Protein-Glutathione Mixed Disulphides by High-Performance Liquid Chromatography-Tandem Mass Spectrometry. Methods Mol. Biol. 2019, 1967, 197–210. [Google Scholar] [CrossRef]
- Sun, X.; Heinrich, P.; Berger, R.S.; Oefner, P.J.; Dettmer, K. Quantification and (13)C-Tracer analysis of total reduced glutathione by HPLC-QTOFMS/MS. Anal. Chim. Acta 2019, 1080, 127–137. [Google Scholar] [CrossRef]
- Benito, S.; Sanchez, A.; Unceta, N.; Andrade, F.; Aldamiz-Echevarria, L.; Goicolea, M.A.; Barrio, R.J. LC-QTOF-MS-based targeted metabolomics of arginine-creatine metabolic pathway-related compounds in plasma: Application to identify potential biomarkers in pediatric chronic kidney disease. Anal. Bioanal. Chem. 2016, 408, 747–760. [Google Scholar] [CrossRef]
- Johnson, J.M.; Strobel, F.H.; Reed, M.; Pohl, J.; Jones, D.P. A rapid LC-FTMS method for the analysis of cysteine, cystine and cysteine/cystine steady-state redox potential in human plasma. Clin. Chim. Acta 2008, 396, 43–48. [Google Scholar] [CrossRef]
- Seiwert, B.; Karst, U. Simultaneous LC/MS/MS determination of thiols and disulfides in urine samples based on differential labeling with ferrocene-based maleimides. Anal. Chem. 2007, 79, 7131–7138. [Google Scholar] [CrossRef]
- McMenamin, M.E.; Himmelfarb, J.; Nolin, T.D. Simultaneous analysis of multiple aminothiols in human plasma by high performance liquid chromatography with fluorescence detection. J. Chromatogr. B 2009, 877, 3274–3281. [Google Scholar] [CrossRef] [PubMed]
- Ivanov, A.V.; Nikiforova, K.A.; Bulgakova, P.O.; Virus, E.D.; Kubatiev, A.A. Determination of Blood Plasma Aminothiols Using Derivatization-enhanced Capillary Transient Isotachophoresis. Anal. Sci. 2018, 34, 505–508. [Google Scholar] [CrossRef] [PubMed]
- Perna, A.F.; Pane, F.; Sepe, N.; Fontanarosa, C.; Pinto, G.; Zacchia, M.; Trepiccione, F.; Anishchenko, E.; Ingrosso, D.; Pucci, P.; et al. Lanthionine and Other Relevant Sulfur Amino Acid Metabolites: Detection of Prospective Uremic Toxins in Serum by Multiple Reaction Monitoring Tandem Mass Spectrometry. Methods Mol. Biol. 2019, 2007, 9–17. [Google Scholar] [CrossRef] [PubMed]
- Steele, M.L.; Ooi, L.; Munch, G. Development of a high-performance liquid chromatography method for the simultaneous quantitation of glutathione and related thiols. Anal. Biochem. 2012, 429, 45–52. [Google Scholar] [CrossRef] [PubMed]
- Jones, D.P.; Carlson, J.L.; Samiec, P.S.; Sternberg, P., Jr.; Mody, V.C., Jr.; Reed, R.L.; Brown, L.A. Glutathione measurement in human plasma. Evaluation of sample collection, storage and derivatization conditions for analysis of dansyl derivatives by HPLC. Clin. Chim. Acta 1998, 275, 175–184. [Google Scholar] [CrossRef]
- Jones, D.P.; Carlson, J.L.; Mody, V.C.; Cai, J.; Lynn, M.J.; Sternberg, P. Redox state of glutathione in human plasma. Free Radic. Biol. Med. 2000, 28, 625–635. [Google Scholar] [CrossRef]
- Hannibal, L.; DiBello, P.M.; Yu, M.; Miller, A.; Wang, S.; Willard, B.; Rosenblatt, D.S.; Jacobsen, D.W. The MMACHC proteome: Hallmarks of functional cobalamin deficiency in humans. Mol. Genet. Metab. 2011, 103, 226–239. [Google Scholar] [CrossRef]
- Ruppert, T.; Schumann, A.; Grone, H.J.; Okun, J.G.; Kolker, S.; Morath, M.A.; Sauer, S.W. Molecular and biochemical alterations in tubular epithelial cells of patients with isolated methylmalonic aciduria. Hum. Mol. Genet. 2015, 24, 7049–7059. [Google Scholar] [CrossRef]
- Matuszewski, B.K.; Constanzer, M.L.; Chavez-Eng, C.M. Strategies for the assessment of matrix effect in quantitative bioanalytical methods based on HPLC-MS/MS. Anal. Chem. 2003, 75, 3019–3030. [Google Scholar] [CrossRef]
- Trufelli, H.; Palma, P.; Famiglini, G.; Cappiello, A. An overview of matrix effects in liquid chromatography-mass spectrometry. Mass Spectrom. Rev. 2011, 30, 491–509. [Google Scholar] [CrossRef]
- Chen, D.; Han, W.; Su, X.; Li, L.; Li, L. Overcoming Sample Matrix Effect in Quantitative Blood Metabolomics Using Chemical Isotope Labeling Liquid Chromatography Mass Spectrometry. Anal. Chem. 2017, 89, 9424–9431. [Google Scholar] [CrossRef] [PubMed]
- Ghassabian, S.; Rethwan, N.S.; Griffiths, L.; Smith, M.T. Fully validated LC-MS/MS method for quantification of homocysteine concentrations in samples of human serum: A new approach. J. Chromatogr. B 2014, 972, 14–21. [Google Scholar] [CrossRef] [PubMed]
- European Medicines Agency. Note for Guidance on Validation of Analytical Procedures: Text and Methodology (CPMP/ICH/381/95); European Medicines Agency: London, UK, 1995. [Google Scholar]
- Kim, S.; Chen, J.; Cheng, T.; Gindulyte, A.; He, J.; He, S.; Li, Q.; Shoemaker, B.A.; Thiessen, P.A.; Yu, B.; et al. PubChem 2019 update: Improved access to chemical data. Nucleic Acids Res. 2019, 47, D1102–D1109. [Google Scholar] [CrossRef] [PubMed]
- Anderson, M.E.; Meister, A. Dynamic state of glutathione in blood plasma. J. Biol. Chem. 1980, 255, 9530–9533. [Google Scholar] [PubMed]
- Hagenfeldt, L.; Arvidsson, A.; Larsson, A. Glutathione and gamma-glutamylcysteine in whole blood, plasma and erythrocytes. Clin. Chim. Acta 1978, 85, 167–173. [Google Scholar] [CrossRef]
- Jacobsen, D.W.; Gatautis, V.J.; Green, R.; Robinson, K.; Savon, S.R.; Secic, M.; Ji, J.; Otto, J.M.; Taylor, L.M., Jr. Rapid HPLC determination of total homocysteine and other thiols in serum and plasma: Sex differences and correlation with cobalamin and folate concentrations in healthy subjects. Clin. Chem. 1994, 40, 873–881. [Google Scholar] [PubMed]
- Jacobsen, D.W.; Gatautis, V.J.; Green, R. Determination of plasma homocysteine by high-performance liquid chromatography with fluorescence detection. Anal. Biochem. 1989, 178, 208–214. [Google Scholar] [CrossRef]
- Zukunft, S.; Prehn, C.; Rohring, C.; Moller, G.; Hrabe de Angelis, M.; Adamski, J.; Tokarz, J. High-throughput extraction and quantification method for targeted metabolomics in murine tissues. Metabolomics 2018, 14, 18. [Google Scholar] [CrossRef]
- Bi, H.; Krausz, K.W.; Manna, S.K.; Li, F.; Johnson, C.H.; Gonzalez, F.J. Optimization of harvesting, extraction, and analytical protocols for UPLC-ESI-MS-based metabolomic analysis of adherent mammalian cancer cells. Anal. Bioanal. Chem. 2013, 405, 5279–5289. [Google Scholar] [CrossRef]
- Dettmer, K.; Nurnberger, N.; Kaspar, H.; Gruber, M.A.; Almstetter, M.F.; Oefner, P.J. Metabolite extraction from adherently growing mammalian cells for metabolomics studies: Optimization of harvesting and extraction protocols. Anal. Bioanal. Chem. 2011, 399, 1127–1139. [Google Scholar] [CrossRef]
- Wilkins, J.; Sakrikar, D.; Petterson, X.M.; Lanza, I.R.; Trushina, E. A comprehensive protocol for multiplatform metabolomics analysis in patient-derived skin fibroblasts. Metabolomics 2019, 15, 83. [Google Scholar] [CrossRef] [PubMed]
- Wagner-Golbs, A.; Neuber, S.; Kamlage, B.; Christiansen, N.; Bethan, B.; Rennefahrt, U.; Schatz, P.; Lind, L. Effects of Long-Term Storage at −80 degrees C on the Human Plasma Metabolome. Metabolites 2019, 9, 99. [Google Scholar] [CrossRef] [PubMed]
- Haid, M.; Muschet, C.; Wahl, S.; Romisch-Margl, W.; Prehn, C.; Moller, G.; Adamski, J. Long-Term Stability of Human Plasma Metabolites during Storage at -80 degrees C. J. Proteome Res. 2018, 17, 203–211. [Google Scholar] [CrossRef] [PubMed]
- Corso, C.R.; Acco, A. Glutathione system in animal model of solid tumors: From regulation to therapeutic target. Crit. Rev. Oncol. Hematol. 2018, 128, 43–57. [Google Scholar] [CrossRef]
- Bansal, A.; Simon, M.C. Glutathione metabolism in cancer progression and treatment resistance. J. Cell Biol. 2018, 217, 2291–2298. [Google Scholar] [CrossRef]
- Mudd, S.H.; Uhlendorf, B.W.; Freeman, J.M.; Finkelstein, J.D.; Shih, V.E. Homocystinuria associated with decreased methylenetetrahydrofolate reductase activity. Biochem. Biophys. Res. Commun. 1972, 46, 905–912. [Google Scholar] [CrossRef]
- Christensen, B.; Rosenblatt, D.S.; Chu, R.C.; Ueland, P.M. Effect of methionine and nitrous oxide on homocysteine export and remethylation in fibroblasts from cystathionine synthase-deficient, cb1G, and cb1E patients. Pediatric Res. 1994, 35, 3–9. [Google Scholar] [CrossRef][Green Version]
- Kolhouse, J.F.; Stabler, S.P.; Allen, R.H. Identification and perturbation of mutant human fibroblasts based on measurements of methylmalonic acid and total homocysteine in the culture media. Arch. Biochem. Biophys. 1993, 303, 355–360. [Google Scholar] [CrossRef]
- Christensen, B.; Refsum, H.; Vintermyr, O.; Ueland, P.M. Homocysteine export from cells cultured in the presence of physiological or superfluous levels of methionine: Methionine loading of non-transformed, transformed, proliferating, and quiescent cells in culture. J. Cell. Physiol. 1991, 146, 52–62. [Google Scholar] [CrossRef]
- Gherasim, C.; Hannibal, L.; Rajagopalan, D.; Jacobsen, D.W.; Banerjee, R. The C-terminal domain of CblD interacts with CblC and influences intracellular cobalamin partitioning. Biochimie 2013, 95, 1023–1032. [Google Scholar] [CrossRef]
- Quadros, E.V.; Lai, S.C.; Nakayama, Y.; Sequeira, J.M.; Hannibal, L.; Wang, S.; Jacobsen, D.W.; Fedosov, S.; Wright, E.; Gallagher, R.C.; et al. Positive newborn screen for methylmalonic aciduria identifies the first mutation in TCblR/CD320, the gene for cellular uptake of transcobalamin-bound vitamin B(12). Hum. Mutat. 2010, 31, 924–929. [Google Scholar] [CrossRef] [PubMed]
- Mudd, S.H.; Finkelstein, J.D.; Irreverre, F.; Laster, L. Homocystinuria: An Enzymatic Defect. Science 1964, 143, 1443–1445. [Google Scholar] [CrossRef] [PubMed]
- Nandania, J.; Kokkonen, M.; Euro, L.; Velagapudi, V. Simultaneous measurement of folate cycle intermediates in different biological matrices using liquid chromatography-tandem mass spectrometry. J. Chromatogr. B 2018, 1092, 168–178. [Google Scholar] [CrossRef] [PubMed]
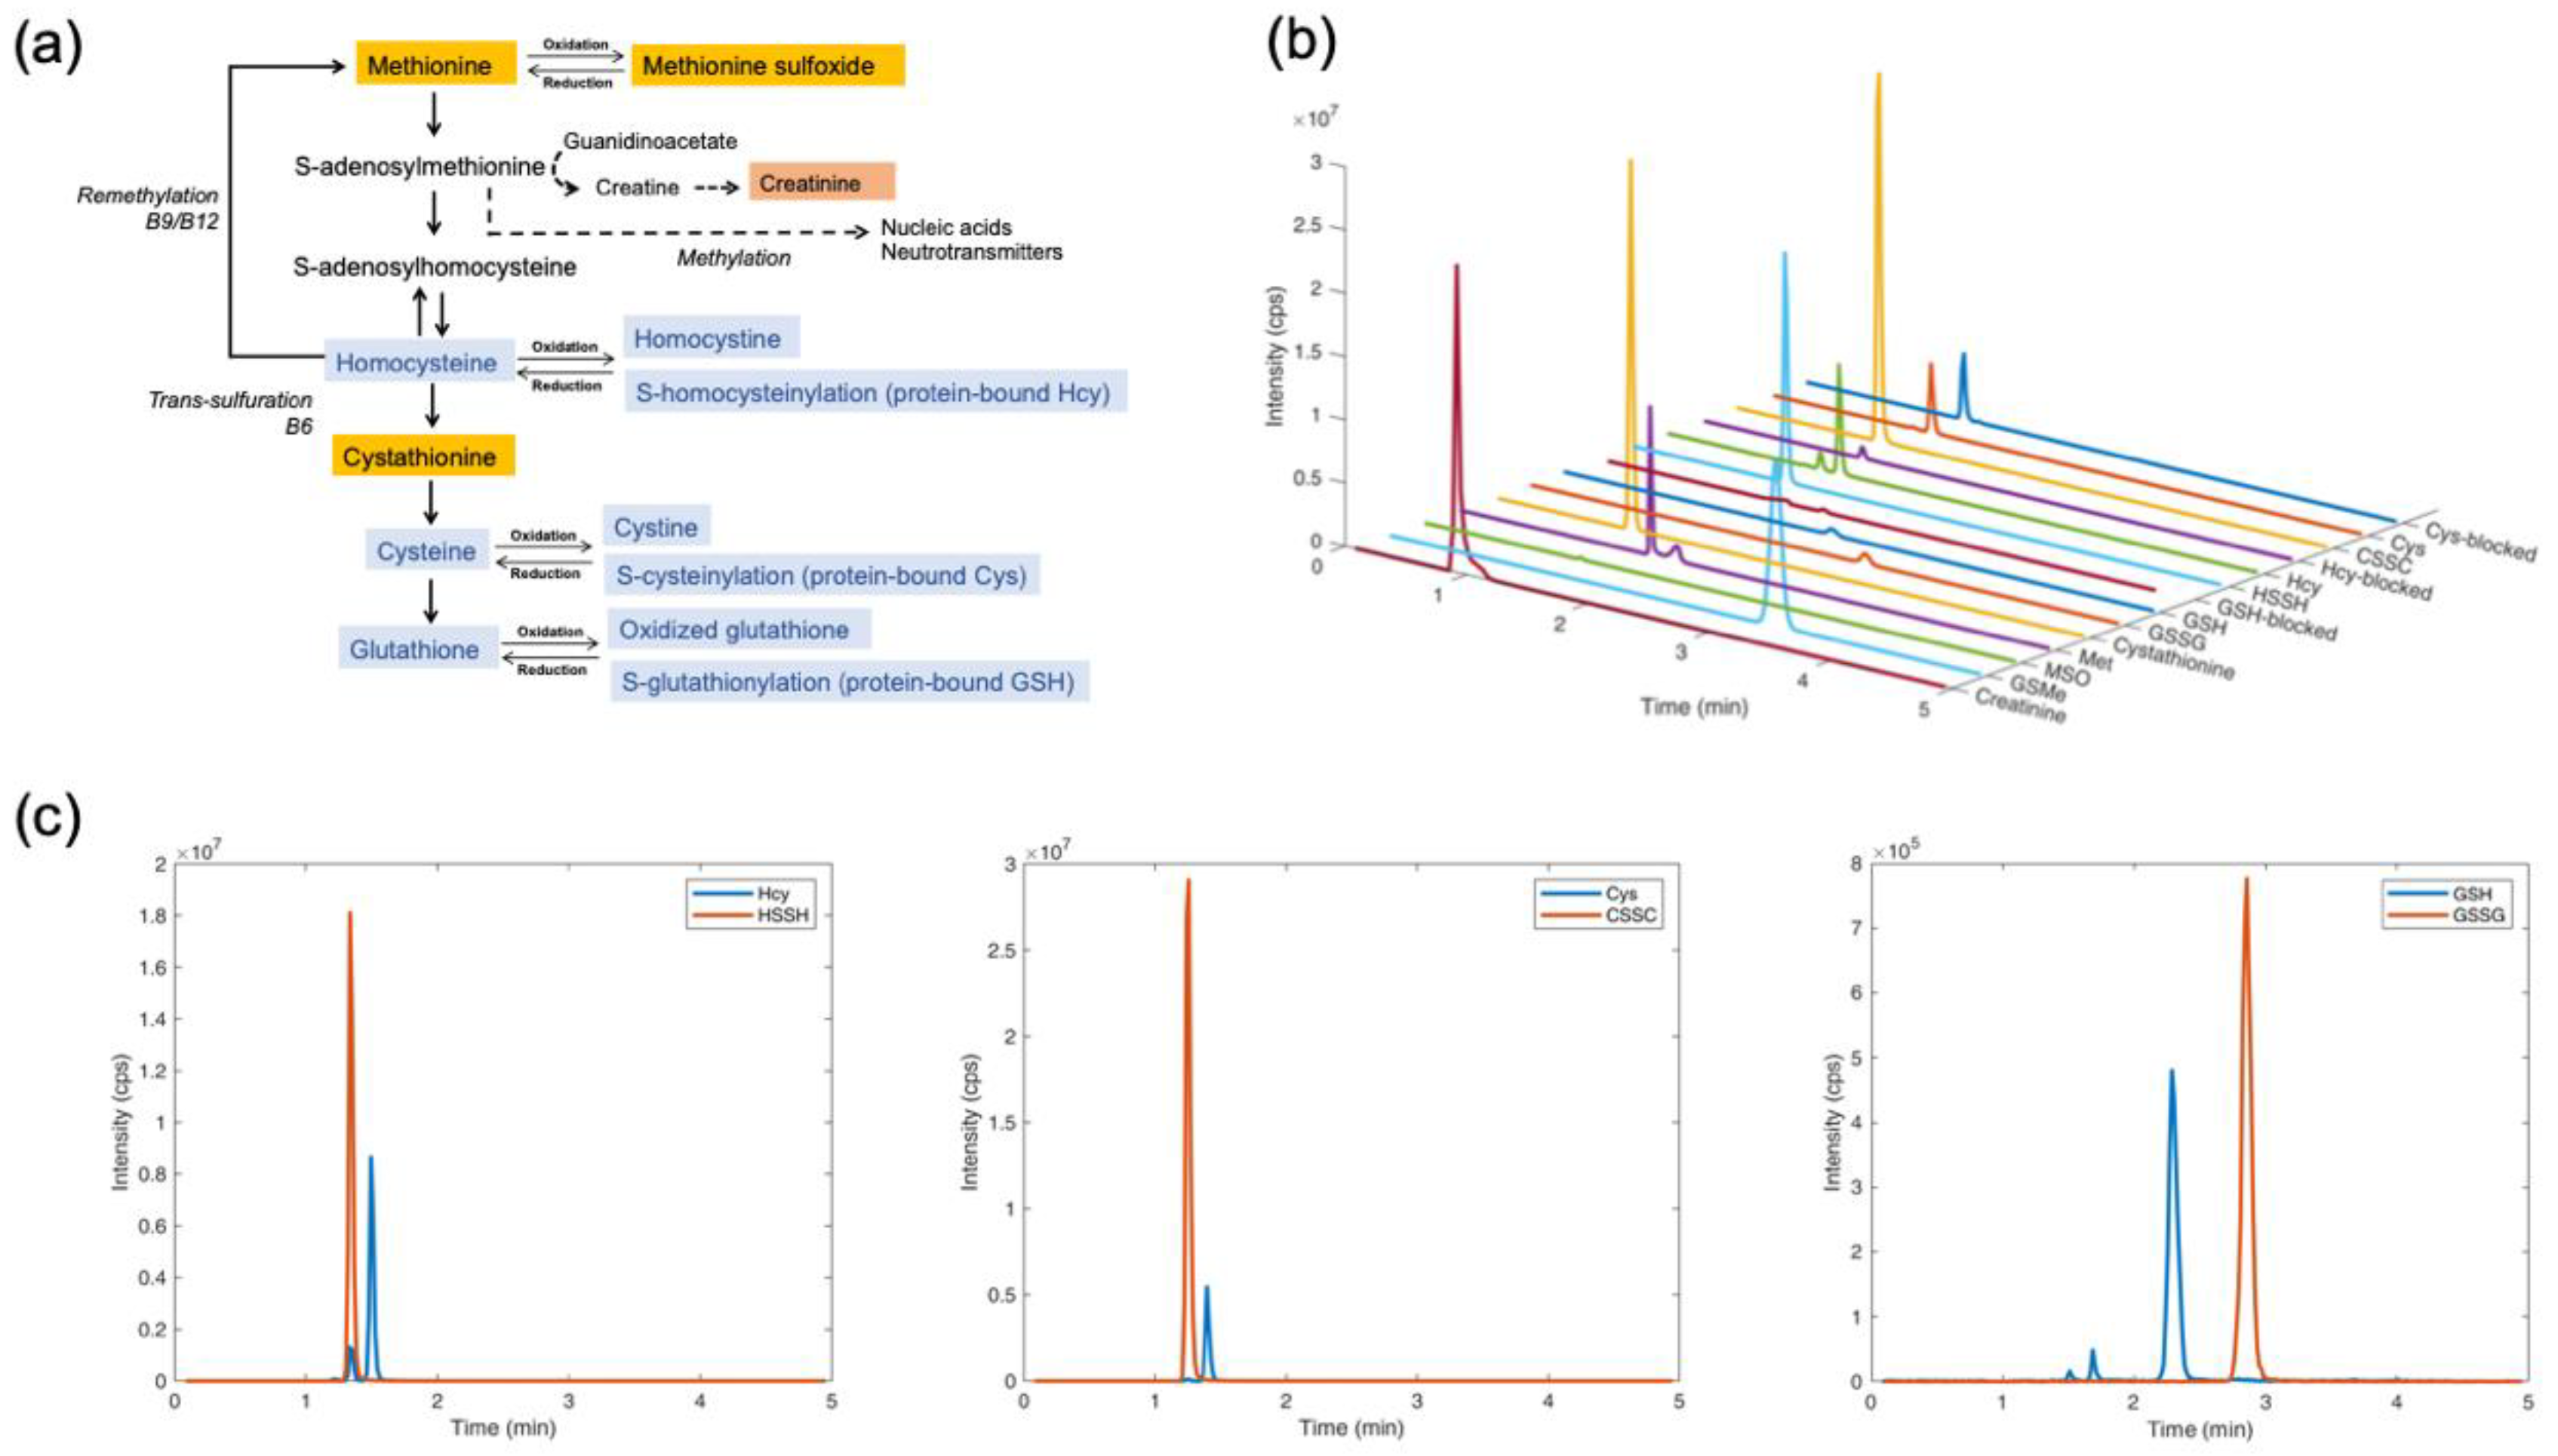
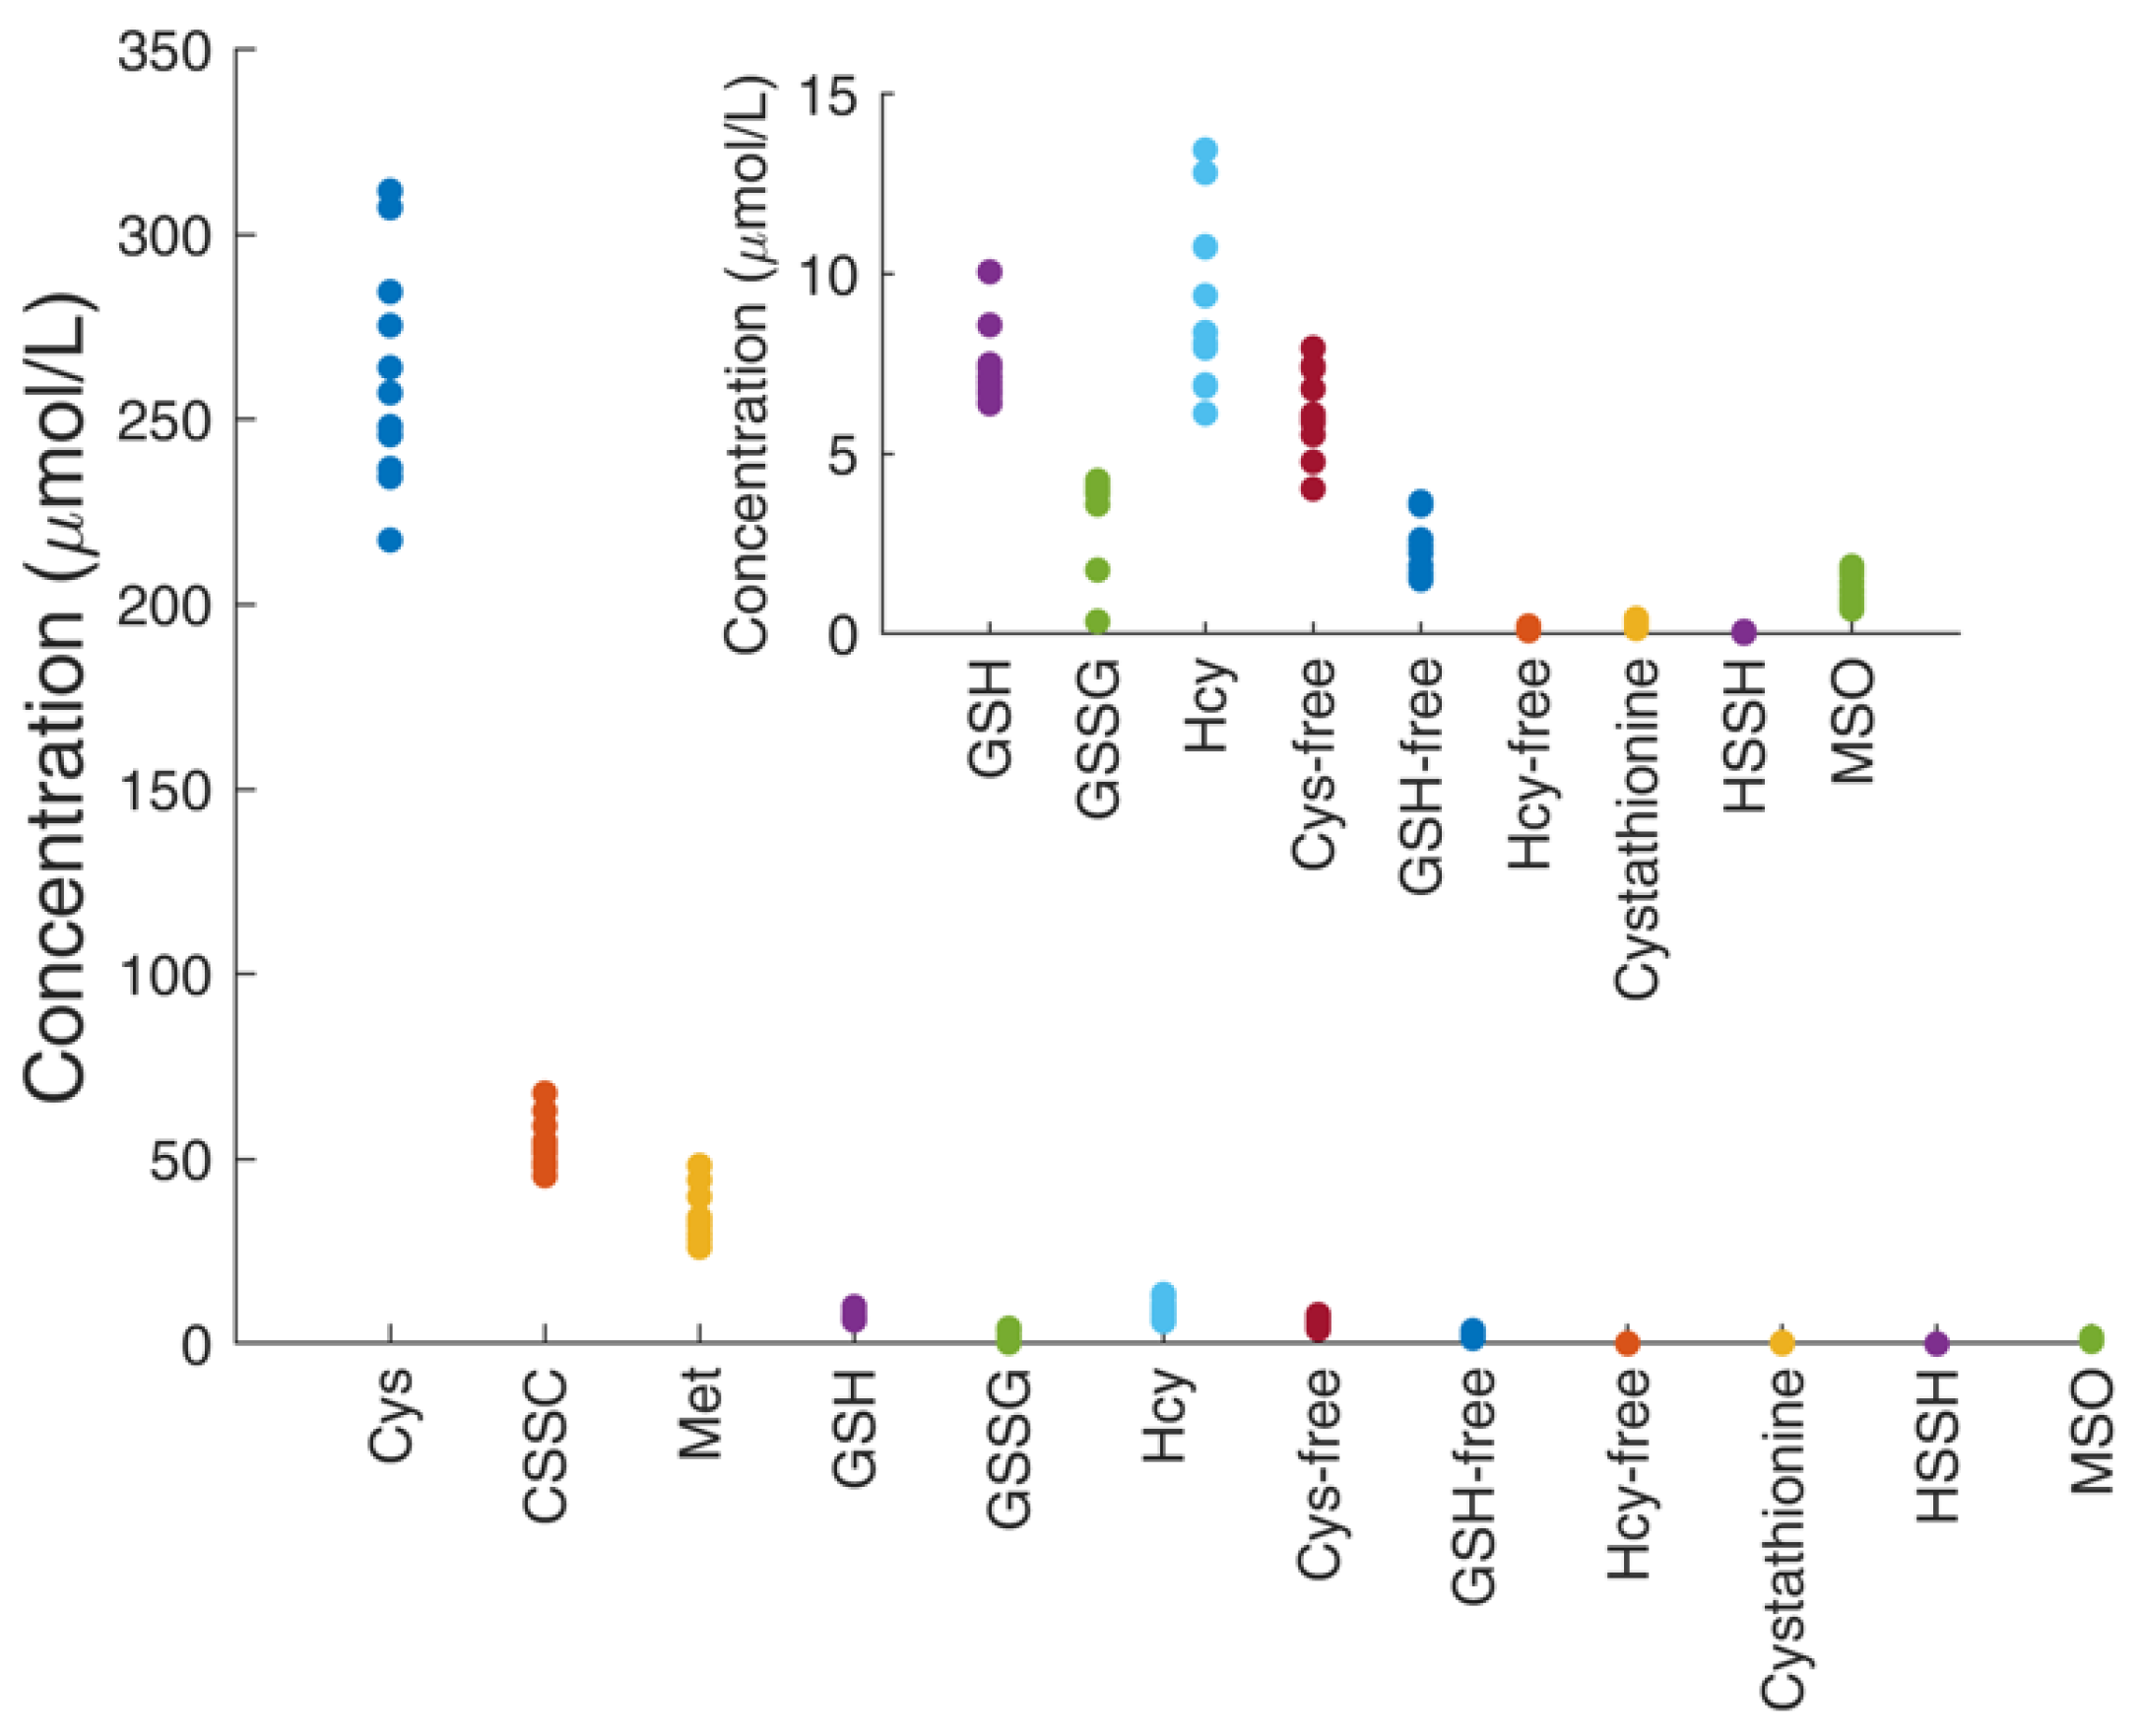

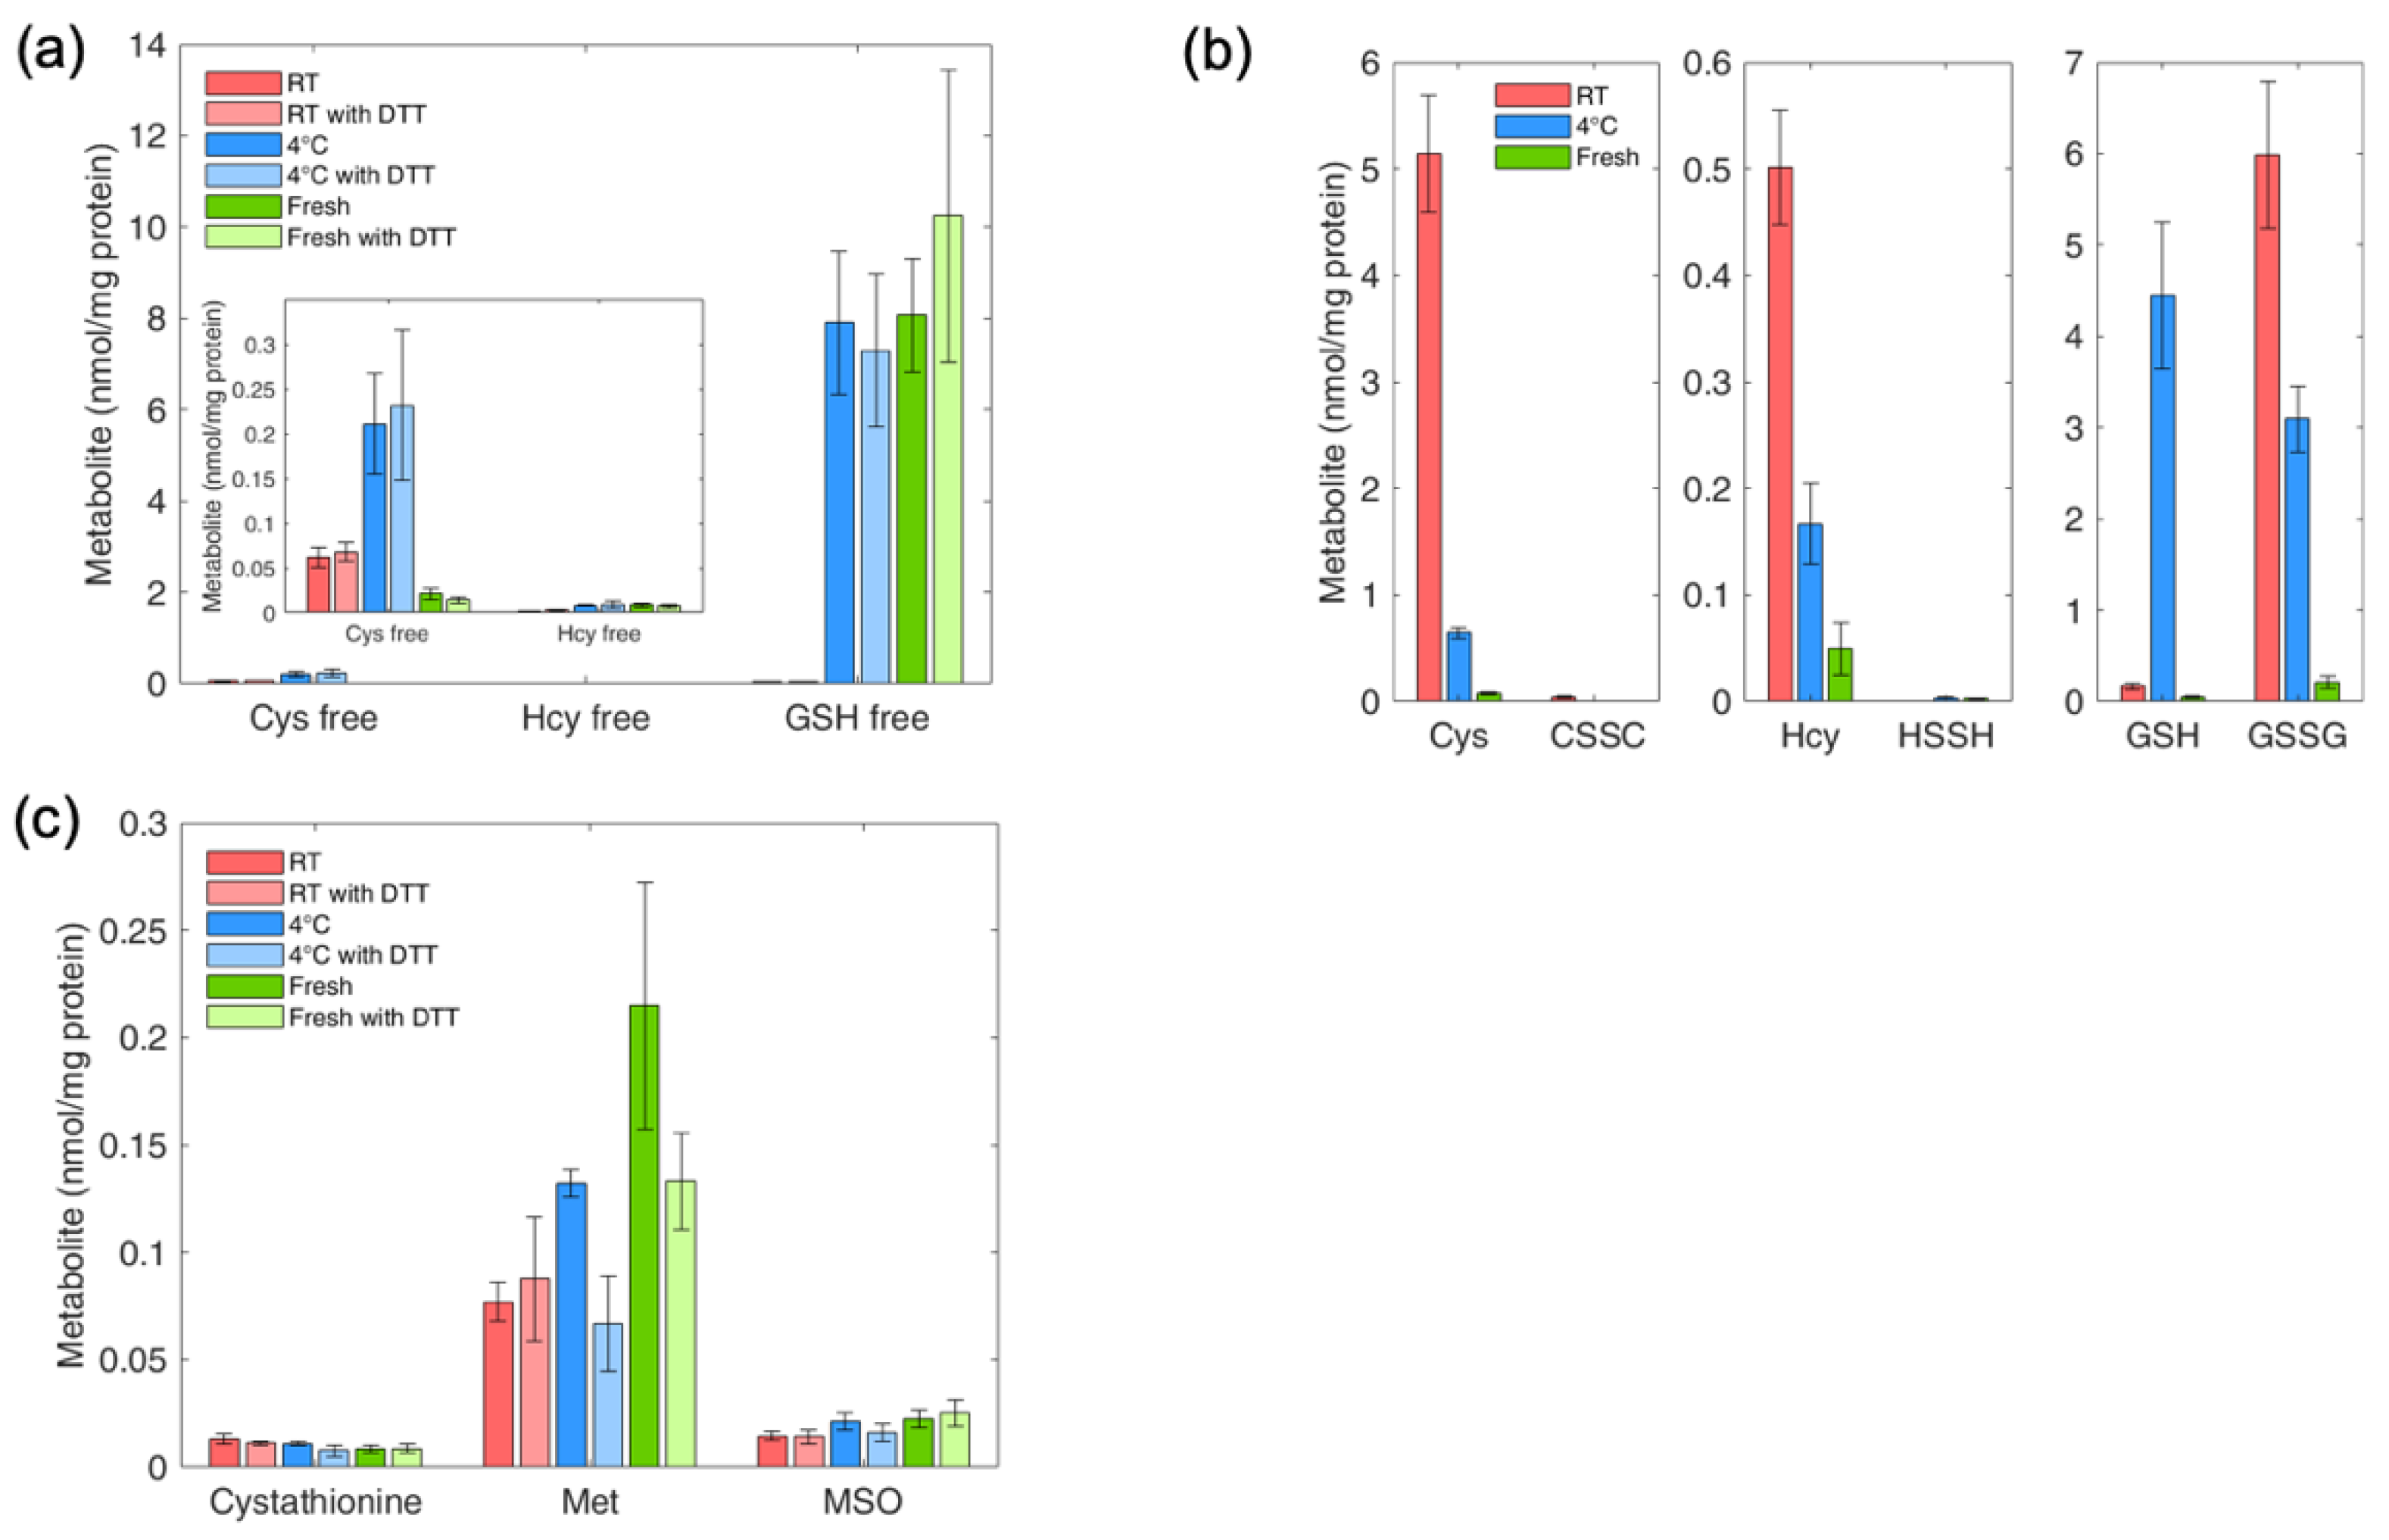
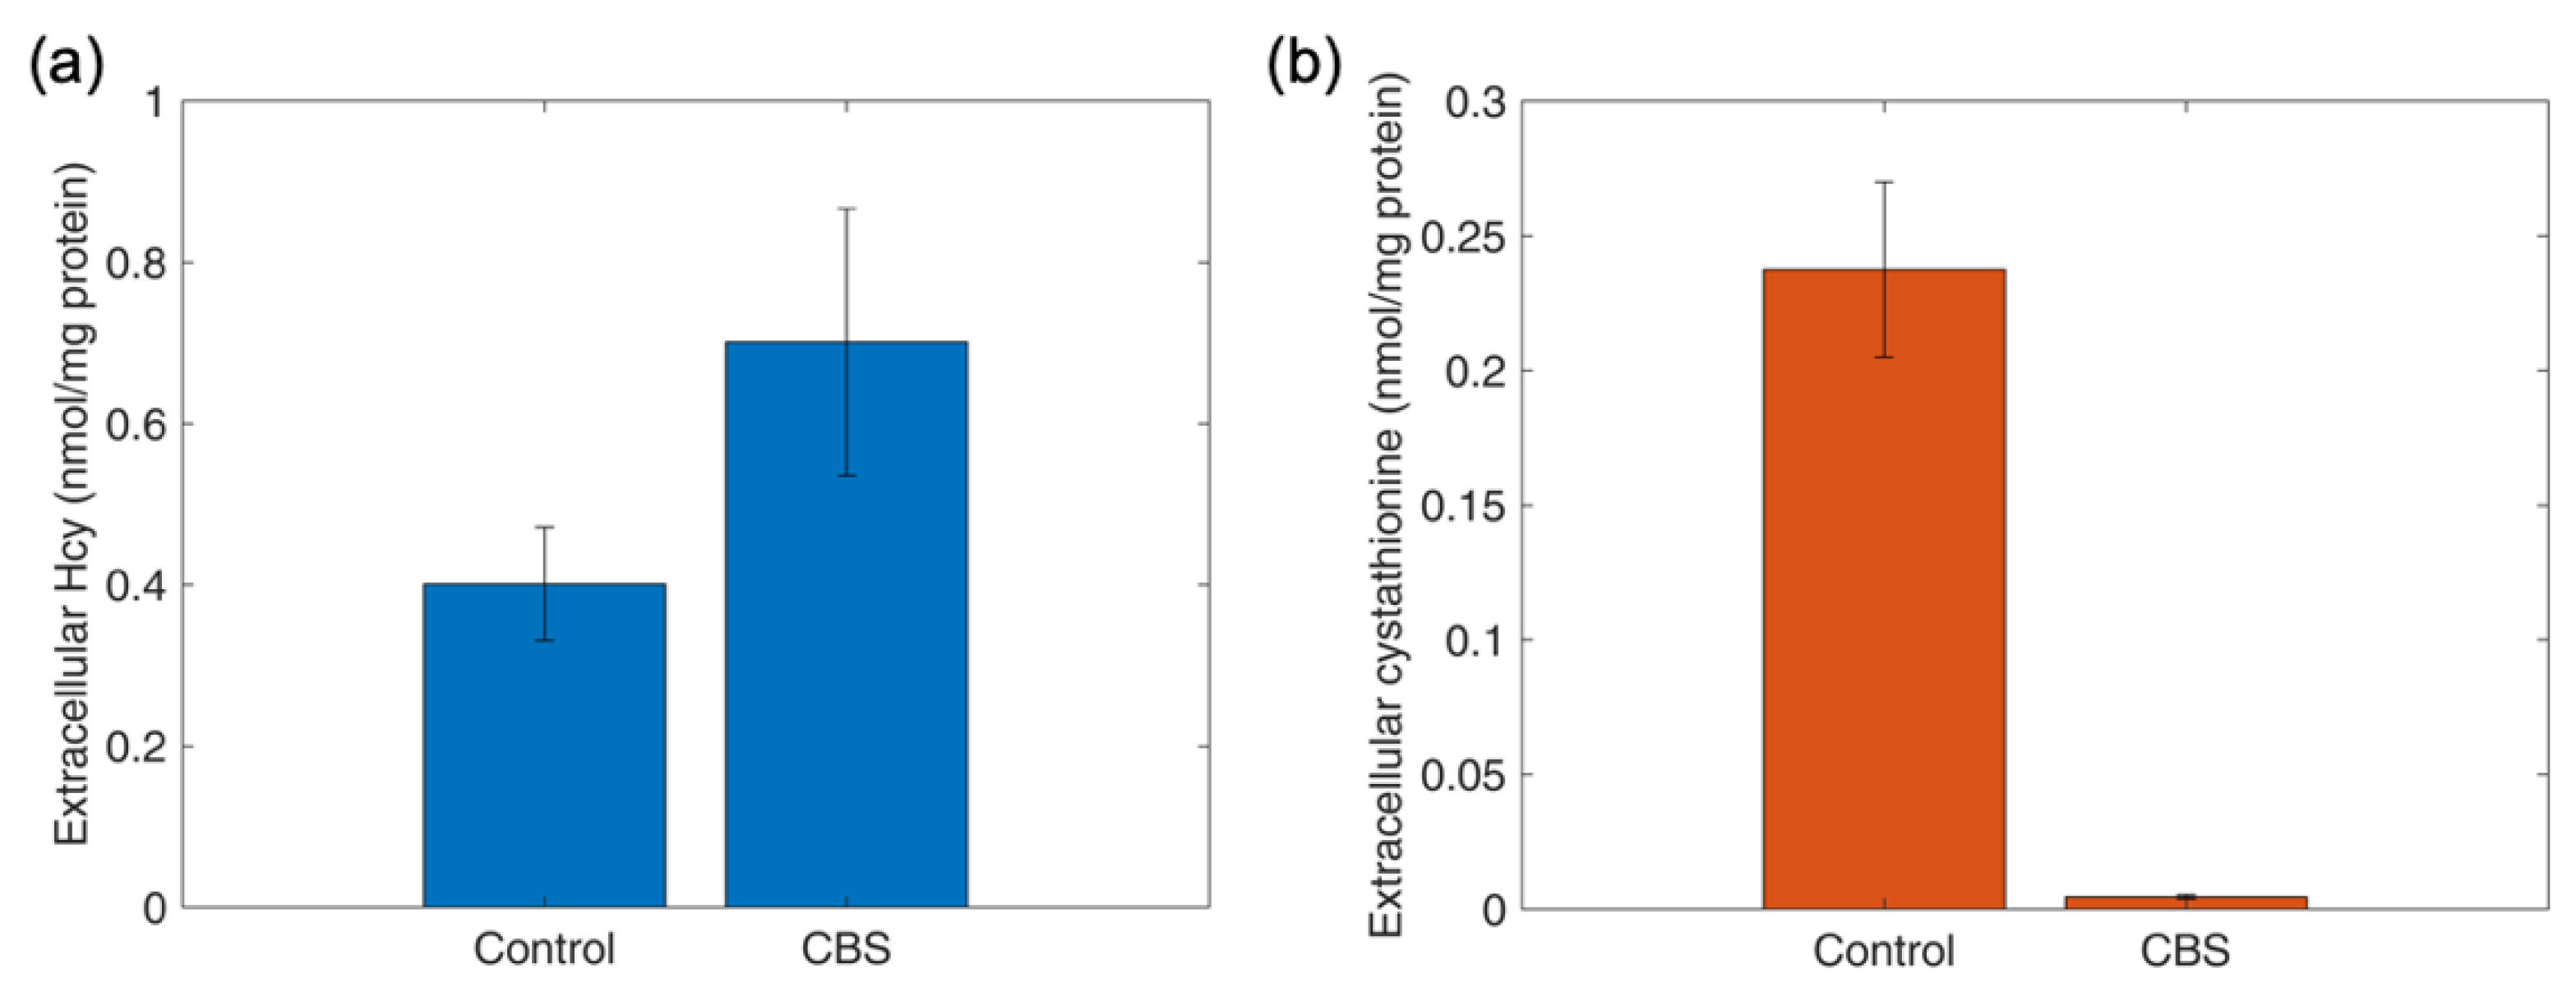

| Metabolite | Abbreviated ID | Retention Time (min) | Q1 Mass (Da) | Q3 Mass (Da) | Dwell Time (ms) | DP (Volts) | EP (Volts) | CE (Volts) | CXP (Volts) |
|---|---|---|---|---|---|---|---|---|---|
| Homocysteine | Hcy | 1.47 | 135.976 | 90 | 20 | 31 | 10 | 19 | 10 |
| Homocystine | HSSH | 1.32 | 268.978 | 136.004 | 20 | 1 | 10 | 13 | 6 |
| Cysteine | Cys | 1.36 | 121.984 | 76 | 20 | 31 | 10 | 17 | 10 |
| Cystine | CSSC | 1.24 | 240.98 | 151.905 | 20 | 26 | 10 | 17 | 4 |
| Oxidized glutathione | GSSG | 2.71 | 612.987 | 355.072 | 20 | 86 | 10 | 31 | 18 |
| Reduced glutathione | GSH | 2.25 | 307.979 | 179 | 20 | 1 | 10 | 15 | 8 |
| S-methylglutathione | GSMe | 3.32 | 322.035 | 176.082 | 20 | 46 | 10 | 21 | 18 |
| Cystathionine | Cysta | 1.18 | 223.1 | 134 | 20 | 26 | 10 | 19 | 16 |
| Methionine | Met | 1.65, 1.82 | 149.987 | 103.9 | 20 | 56 | 10 | 17 | 12 |
| Methionine sulfoxide | MSO | 1.36 | 166.01 | 74.1 | 20 | 1 | 10 | 19 | 6 |
| Cysteine blocked | Cys-free | 1.36 | 179 | 162.1 | 20 | 100 | 10 | 10 | 10 |
| Glutathione blocked | GSH-free | 1.91 | 365 | 236.1 | 20 | 100 | 10 | 10 | 10 |
| Homocysteine blocked | Hcy-free | 1.38 | 193 | 147.2 | 20 | 100 | 10 | 10 | 10 |
| Creatinine | Crea | 0.90 | 114.023 | 43.9 | 20 | 10 | 10 | 27 | 8 |
| D3-creatinine | D3-Crea | 0.90 | 117.094 | 47 | 20 | 10 | 10 | 27 | 8 |
| D4-homocysteine | D4-Hcy | 1.44 | 139.976 | 94 | 20 | 31 | 10 | 19 | 10 |
| D4-cysteine | D4-Cys | 1.35 | 125.984 | 79 | 20 | 31 | 10 | 17 | 10 |
| 13C2,15N glutathione (reduced) | 13C2,15N-GSH | 2.23 | 310.979 | 179 | 20 | 46 | 10 | 15 | 8 |
| D4-cystathionine | D4-Cysta | 1.16 | 227.1 | 138 | 20 | 26 | 10 | 19 | 16 |
| D4-methionine | D4-Met | 1.63, 1.79 | 153.987 | 107.9 | 20 | 56 | 10 | 17 | 12 |
| Metabolite (a) | Linearity (µmol/L) | LoQ (µmol/L) | Inter-assay Variation (%) |
|---|---|---|---|
| Cysteine | 0–300 | 0.9 | 2.95 |
| Cystine | 0–100 | 0.04 | 11.22 |
| Homocysteine | 0–100 | 0.35 | 4.86 |
| Homocystine | 0–50 | 0.02 | 10.2 |
| Glutathione | 0–20 | 0.05 | 2.56 |
| Glutathione disulfide | 0–20 | 0.63 | 7.57 |
| Methionine | 0–150 | 1.65 | 3.74 |
| Methionine sulfoxide | 0–150 | 0.08 | 3.73 |
| Cystathionine | 0–50 | 0.01 | 2.64 |
| Creatinine | 0–500 | 0.01 | 2.35 |
| Metabolite (µmol/L) | |||||||
|---|---|---|---|---|---|---|---|
| Sample | Creatinine | Cystathionine | Cysteine | GSH | Homocysteine | Methionine | MSO |
| Mouse 1 | 6.7 ± 1.0 | 0.701 ± 0.098 | 148 ± 13 | 71 ± 6 | 4.0 ± 0.5 | 55 ± 5 | 0.74 ± 0.08 |
| Mouse 2 | 7.9 ± 0.7 | 0.783 ± 0.130 | 139 ± 18 | 79 ± 3 | 4.2 ± 0.3 | 56 ± 3 | 0.81 ± 0.04 |
| Human | 69 ± 13 | 0.115 ± 0.010 | 181 ± 9 | 3.7 ± 0.5 | 7.5 ± 0.7 | 25 ± 1 | 2.21 ± 0.34 |
| Dawley Rat | 20 ± 4 | 0.443 ± 0.070 | 163 ± 12 | 29 ± 3 | 4.1 ± 0.2 | 60 ± 3 | 0.90 ± 0.07 |
| Beagle Dog | 55 ± 5 | 2.014 ± 0.150 | 128 ± 17 | 11.7 ± 0.6 | 7.4 ± 0.5 | 50 ± 3 | 1.07 ± 0.11 |
| QC | 74 ± 6 | 0.275 ± 0.040 | 269 ± 25 | 2.6 ± 0.3 | 57 ± 3 | 29 ± 2 | 0.70 ± 0.09 |
| Human | 69 ± 13 | 0.115 ± 0.01 | 181 ± 9 | 3.7 ± 0.5 | 7.5 ± 0.7 | 24 ± 2 | 2.21 ± 0.34 |
| Reference Range | < 90 | < 0.400 | 150-350 | 2–5.1 | 5–15 | 18–33 | N/A (a) |
| QC Hcy Expected | 44–65 | - | - | - | - | - | - |
| QC Hcy Experimental | 57 ± 3 | - | - | - | - | - | - |
| Metabolite (µmol/L) | ||||||||||||
|---|---|---|---|---|---|---|---|---|---|---|---|---|
| Subject ID | Cys-Free | GSH-Free | Hcy-Free | Cysta | Cys | CSSC | GSH | GSSG | Hcy | HSSH | Met | MSO |
| Subject 1 | 7.4 | 3.6 | 0.11 | 0.42 | 248 | 54 | 6.4 | 0.3 | 6.9 | 0.045 | 32 | 1.0 |
| Subject 2 | 6.1 | 3.7 | 0.14 | 0.14 | 264 | 54 | 10.1 | 1.8 | 8.1 | 0.019 | 30 | 0.7 |
| Subject 3 | 6.0 | 2.6 | 0.10 | 0.18 | 312 | 59 | 7.5 | 4.0 | 12.8 | 0.029 | 28 | 0.9 |
| Subject 4 | 5.9 | 2.4 | 0.17 | 0.15 | 275 | 49 | 8.6 | 3.9 | 13.5 | 0.030 | 32 | 1.2 |
| Subject 5 | 5.9 | 2.2 | 0.11 | 0.17 | 237 | 48 | 7.0 | 4.1 | 9.4 | 0.021 | 40 | 1.0 |
| Subject 6 | 7.4 | 1.6 | 0.15 | 0.15 | 234 | 55 | 7.4 | 3.9 | 6.1 | 0.021 | 48 | 1.8 |
| Subject 7 | 6.8 | 1.7 | 0.21 | 0.14 | 217 | 46 | 6.4 | 3.6 | 7.9 | 0.024 | 34 | 1.7 |
| Subject 8 | 7.9 | 1.5 | 0.22 | 0.32 | 285 | 63 | 7.1 | 4.3 | 10.8 | 0.065 | 44 | 1.9 |
| Subject 9 | 5.5 | 1.7 | 0.09 | 0.19 | 246 | 52 | 7.4 | 4.1 | 6.9 | 0.020 | 34 | 1.4 |
| Subject 10 | 4.0 | 3.6 | 0.17 | 0.16 | 257 | 53 | 6.8 | 4.1 | 8.4 | 0.019 | 26 | 0.8 |
| Subject 11 | 4.8 | 1.9 | 0.14 | 0.31 | 307 | 68 | 6.7 | 3.9 | 10.7 | 0.031 | 33 | 1.2 |
| Mean | 6.2 | 2.4 | 0.15 | 0.21 | 262 | 54 | 7.4 | 3.5 | 9.2 | 0.029 | 35 | 1.2 |
| SD | 1.2 | 0.9 | 0.04 | 0.09 | 30 | 7 | 1.1 | 1.2 | 2.4 | 0.014 | 7 | 0.4 |
| Reference range (a) | 8.3–10.7 | 2.0–5.1 | 0.17–0.32 | <0.4 | 202–281 | 41–63 | 4.9–7.3 | 0.7–1.6 | 6.5–11.9 | 1.0–1.2 | 18–35 | N/A (b) |
| Urine Sample ID | Creatinine Kinetic Jaffe Method (mM) | Creatinine LC-MS/MS (mM) a |
|---|---|---|
| Subject 1 | 1.32 | 1.47 |
| Subject 2 | 8.25 | 10.56 |
| Subject 3 | 10.26 | 13.06 |
| Subject 4 | 11.45 | 15.00 |
| Subject 5 | 3.42 | 3.71 |
| Cell Type | BAEC | NHDF | GM13395 | hRTPCs | Panc 05.04 | MiaPaCa-2 | AsPC-1 | HepG2 | hESC a |
|---|---|---|---|---|---|---|---|---|---|
| Genotype | Normal | Normal | MTHFR | Normal | Cancer | Cancer | Cancer | Cancer | Normal |
| Organ | Endothelium | Skin | Skin | Kidney | Pancreas | Pancreas | Pancreas | Liver | Stem cells |
| Cys free | 9.2 ± 1.8 | 18.6 ± 3.5 | 2.07 ± 0.45 | 11.7 ± 3.5 | 23.1 ± 4.3 | 26.0 ± 3.3 | 22.1 ± 3.4 | 6.26 ± 0.77 | - |
| Hcy free | 0.14 ± 0.04 | 0.11 ± 0.06 | 0.027 ± 0.015 | 0.15 ± 0.02 | 0.12 ± 0.05 | 0.06 ± 0.01 | 0.05 ± 0.03 | 0.021 ± 0.004 | - |
| GSH free | 40.9 ± 3.9 | 57.2 ± 7.1 | 5.64 ± 1.59 | 19.6 ± 10.5 | 43.0 ± 4.2 | 68.3 ± 3.1 | 34.6 ± 1.9 | 26.5 ± 5.6 | - |
| CSSC | 1.90 ± 0.51 | 2.56 ± 1.38 | 11.6 ± 4.9 | 0.33 ± 0.25 | 8.76 ± 0.63 | 2.90 ± 0.81 | 6.94 ± 0.50 | 0.93 ± 0.18 | - |
| HSSH | 0.18 ± 0.05 | 0.22 ± 0.03 | 0.50 ± 0.13 | 0.11 ± 0.02 | 5.03 ± 0.25 | 0.77 ± 0.09 | 4.35 ± 0.16 | 0.60 ± 0.07 | - |
| GSSG | 1.58 ± 0.92 | 5.18 ± 0.65 | 12.8 ± 3.1 | 0.67 ± 0.56 | 8.61 ± 0.78 | 18.6 ± 0.81 | 6.14 ± 0.38 | 8.09 ± 2.94 | - |
| Cys | 8.63 ± 2.59 | 14.2 ± 5.9 | 46.2 ± 14.2 | 2.78 ± 1.09 | 55.3 ± 2.5 | 30.0 ± 3.3 | 47.0 ± 4.6 | 16.1 ± 1.6 | 7.03 ± 0.40 |
| Hcy | 0.64 ± 0.11 | 0.46 ± 0.12 | 0.53 ± 0.13 | 0.17 ± 0.03 | 4.34 ± 0.15 | 1.84 ± 0.18 | 4.78 ± 0.54 | 2.60 ± 0.42 | 0.017 ± 0.002 |
| GSH | 1.87 ± 0.67 | 3.84 ± 0.47 | 8.41 ± 1.34 | 0.99 ± 0.51 | 19.6 ± 3.0 | 20.0 ± 1.2 | 17.0 ± 0.3 | 15.3 ± 0.9 | 3.96 ± 0.19 |
| Cysta | 5.56 ± 1.07 | 4.74 ± 0.68 | 1.66 ± 0.60 | 3.17 ± 1.00 | 2.40 ± 0.34 | 55.2 ± 8.9 | 2.83 ± 0.18 | 93.4 ± 16.4 | 0.602 ± 0.016 |
| Met | 62.0 ± 11.3 | 29.1 ± 5.4 | 46.4 ± 8.30 | 11.8 ± 1.6 | 468 ± 65 | 193 ± 13 | 217 ± 4.5 | 98.4 ± 22.3 | 4.38 ± 0.10 |
| MSO | 212 ± 40 | 184 ± 38 | 256 ± 49 | 60.2 ± 7.1 | 1614 ± 165 | 377 ± 15 | 873 ± 50 | 0.78 ± 0.13 | 0.056 ± 0.003 |
© 2019 by the authors. Licensee MDPI, Basel, Switzerland. This article is an open access article distributed under the terms and conditions of the Creative Commons Attribution (CC BY) license (http://creativecommons.org/licenses/by/4.0/).
Share and Cite
Behringer, S.; Wingert, V.; Oria, V.; Schumann, A.; Grünert, S.; Cieslar-Pobuda, A.; Kölker, S.; Lederer, A.-K.; Jacobsen, D.W.; Staerk, J.; et al. Targeted Metabolic Profiling of Methionine Cycle Metabolites and Redox Thiol Pools in Mammalian Plasma, Cells and Urine. Metabolites 2019, 9, 235. https://doi.org/10.3390/metabo9100235
Behringer S, Wingert V, Oria V, Schumann A, Grünert S, Cieslar-Pobuda A, Kölker S, Lederer A-K, Jacobsen DW, Staerk J, et al. Targeted Metabolic Profiling of Methionine Cycle Metabolites and Redox Thiol Pools in Mammalian Plasma, Cells and Urine. Metabolites. 2019; 9(10):235. https://doi.org/10.3390/metabo9100235
Chicago/Turabian StyleBehringer, Sidney, Victoria Wingert, Victor Oria, Anke Schumann, Sarah Grünert, Artur Cieslar-Pobuda, Stefan Kölker, Ann-Kathrin Lederer, Donald W. Jacobsen, Judith Staerk, and et al. 2019. "Targeted Metabolic Profiling of Methionine Cycle Metabolites and Redox Thiol Pools in Mammalian Plasma, Cells and Urine" Metabolites 9, no. 10: 235. https://doi.org/10.3390/metabo9100235
APA StyleBehringer, S., Wingert, V., Oria, V., Schumann, A., Grünert, S., Cieslar-Pobuda, A., Kölker, S., Lederer, A.-K., Jacobsen, D. W., Staerk, J., Schilling, O., Spiekerkoetter, U., & Hannibal, L. (2019). Targeted Metabolic Profiling of Methionine Cycle Metabolites and Redox Thiol Pools in Mammalian Plasma, Cells and Urine. Metabolites, 9(10), 235. https://doi.org/10.3390/metabo9100235


