Brief Report

1D “Spikelet” Projections from Heteronuclear 2D NMR Data—Permitting 1D Chemometrics While Preserving 2D Dispersion

by
Maryam Tabatabaei Anaraki
1,
Wolfgang Bermel
2,
Rudraksha Dutta Majumdar
3,
Ronald Soong
1,
Myrna Simpson
1,4,
Martine Monnette
3 and
André J. Simpson
1,4,*
1
Environmental NMR Center, Department of Physical and Environmental Sciences, University of Toronto Scarborough, Military Trial, Toronto, ON 1265, Canada
2
Bruker BioSpin GmbH, Silberstreifen 4, 76287 Rheinstetten, Germany
3
Bruker Ltd., 2800 High Point Drive, Milton, ON L9T 6P4, Canada
4
Department of Chemistry, University of Toronto, 80 St. George Street, Toronto, ON M1C 1A4, Canada
*
Author to whom correspondence should be addressed.
Metabolites 2019, 9(1), 16; https://doi.org/10.3390/metabo9010016
Submission received: 13 December 2018 / Revised: 8 January 2019 / Accepted: 9 January 2019 / Published: 16 January 2019
(This article belongs to the Special Issue NMR-based Metabolomics and Its Applications Volume 2)

Abstract

:
Nuclear magnetic resonance (NMR) spectroscopy is a powerful tool for the non-targeted metabolomics of intact biofluids and even living organisms. However, spectral overlap can limit the information that can be obtained from 1D 1H NMR. For example, magnetic susceptibility broadening in living organisms prevents any metabolic information being extracted from solution-state 1D 1H NMR. Conversely, the additional spectral dispersion afforded by 2D 1H-13C NMR allows a wide range of metabolites to be assigned in-vivo in 13C enriched organisms, as well as a greater depth of information for biofluids in general. As such, 2D 1H-13C NMR is becoming more and more popular for routine metabolic screening of very complex samples. Despite this, there are only a very limited number of statistical software packages that can handle 2D NMR datasets for chemometric analysis. In comparison, a wide range of commercial and free tools are available for analysis of 1D NMR datasets. Overtime, it is likely more software solutions will evolve that can handle 2D NMR directly. In the meantime, this application note offers a simple alternative solution that converts 2D 1H-13C Heteronuclear Single Quantum Correlation (HSQC) data into a 1D “spikelet” format that preserves not only the 2D spectral information, but also the 2D dispersion. The approach allows 2D NMR data to be converted into a standard 1D Bruker format that can be read by software packages that can only handle 1D NMR data. This application note uses data from Daphnia magna (water fleas) in-vivo to demonstrate how to generate and interpret the converted 1D spikelet data from 2D datasets, including the code to perform the conversion on Bruker spectrometers.

1. Introduction

Heteronuclear 2D NMR provides superior spectral dispersion over one-dimensional (1D) datasets. The 1D 1H spectra have been reported to have a peak capacity of ~3000, while that of 2D 1H-13C approaches 2,000,000 [1]. This becomes very important for the metabolomics studies of very complex samples that show poor resolution in 1D NMR (due to a combination of magnetic susceptibility distortions and sample complexity). As such, the importance of 2D NMR as a routine tool to extract otherwise inaccessible NMR information is continuing to rise [2,3,4,5,6,7,8].
Recently, stable 13C isotopic labeling [9,10,11,12] of organisms or live cells [13,14,15], has emerged as powerful approaches to overcome poor resolution and resonance overlap. However, in most of these studies 1D NMR, such as 13C NMR, is commonly acquired, as chemometric software packages that directly handle 2D NMR data are still limited [16,17,18,19].
The 1H-13C HSQC data, one of the 2D NMR techniques, are relatively well resolved and can be used to identify a range of metabolites in 13C labeled samples or concentrated non-enriched samples. The question now becomes: is it possible to preserve all the information from a 2D 1H-13C HSQC spectrum while generating a standard 1D format compatible with chemometrics and statistical packages? In the present application note, we describe the generation of such a format—1D spikelet—and demonstrate its applicability using both principal component analysis (PCA) and quantile plots (a useful visualization tool with the ability to identify changes within 1D datasets as color gradients) as examples.

2. Results and Discussion

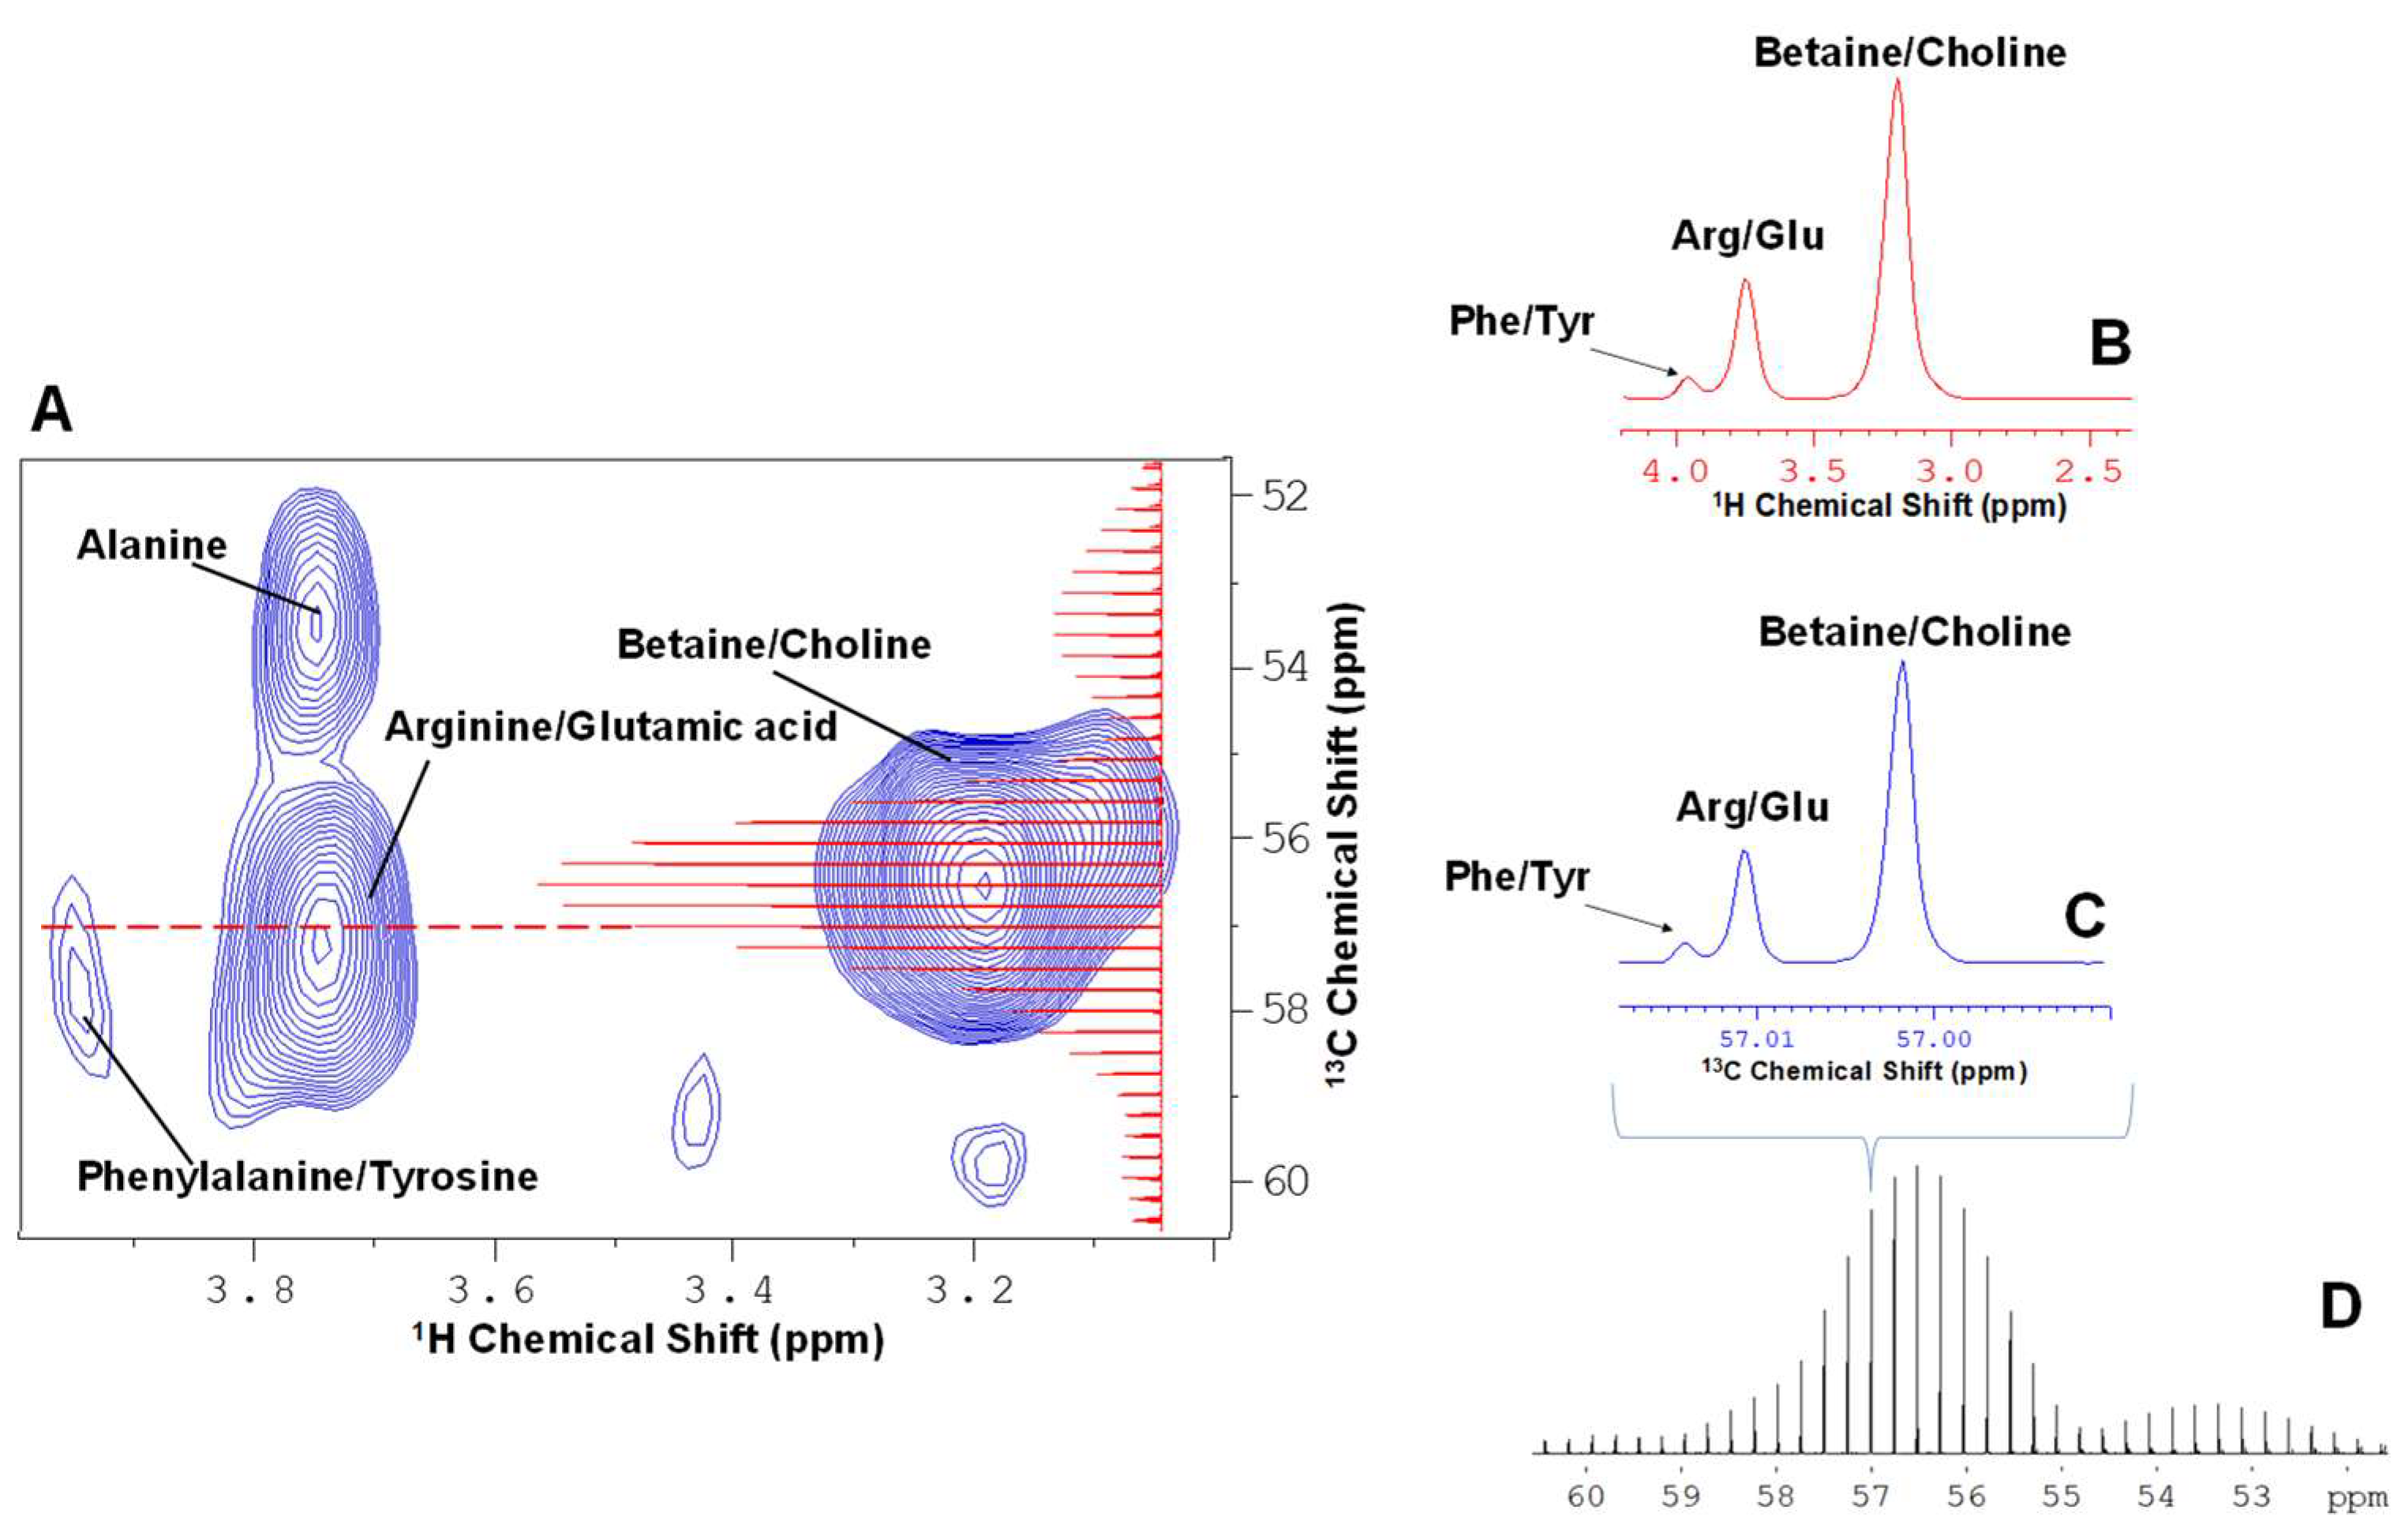
The excellent spectral dispersion of HSQC helps metabolite discrimination, however the 2D format makes it incompatible with some chemometric approaches and software packages. Figure 1 compares the full 1H-13C HSQC (1A), conventional 1H projection (1B), and 13C projection (1C) against the information rich complete projection (1D) (termed here as “spikelet projection”) for in vivo Daphnia magna. Maryam Tabatabaei Anaraki et al. [20] have discussed the impacts of anoxic stress on Daphnia magna. In the study, it was demonstrated that the separation along PC1 arises from the accumulation of lactic acid, whereas the separation along PC2 arises from slight differences in the lipids between the 3 different populations of Daphnia magna. In the spikelet approach, complete 1H spectra extracted for each point in f1 (13C) in the processed spectrum are concatenated into a continuous profile, and then the corresponding 13C chemical shifts are projected onto the axis of the spikelet projection. The result is the overall profile of the spikelet projection and is analogous to the conventional 13C projection (Figure 1C), but for each 13C plane, the complete 1H spectrum is also preserved (see Figure 1D). Figure 2 demonstrates the concept of 1D spikelet projection with an expansion of the area around 57 ppm. Looking at the dashed line in Figure 2A (57 ppm carbon plane), three corresponding 1H signals from Betaine/Choline, Arginine/Glutamic acid, and Phenylalanine/Tyrosine are present. Figure 2B shows the 57 ppm slice from the full HSQC, in which all 3 signals are well resolved. Figure 2C shows the exact same slice from the spikelet projection (Figure 2D). The 1H information content is identical, with the only difference being the label on the axis (13C vs 1H). For cross checking assignments, the slice from the spikelet projection indicates where to look in the 2D (in this case 57 ppm carbon), after which proton information can be read from the original 2D data in the normal manner. It is important to reiterate that the advantage of the spikelet projections is that they are amenable to 1D data processing approaches. As such, methods that may only be available for 1D formats can be applied to information extracted from the 2D datasets that otherwise may not be possible. The complete code for converting 2D NMR data into the 1D spikelet format is available in Appendix A. The code is executed as a standard AU program in Bruker’s Topspin package.

2.1. Principle Component Analysis (PCA) of the Spikelet Projections

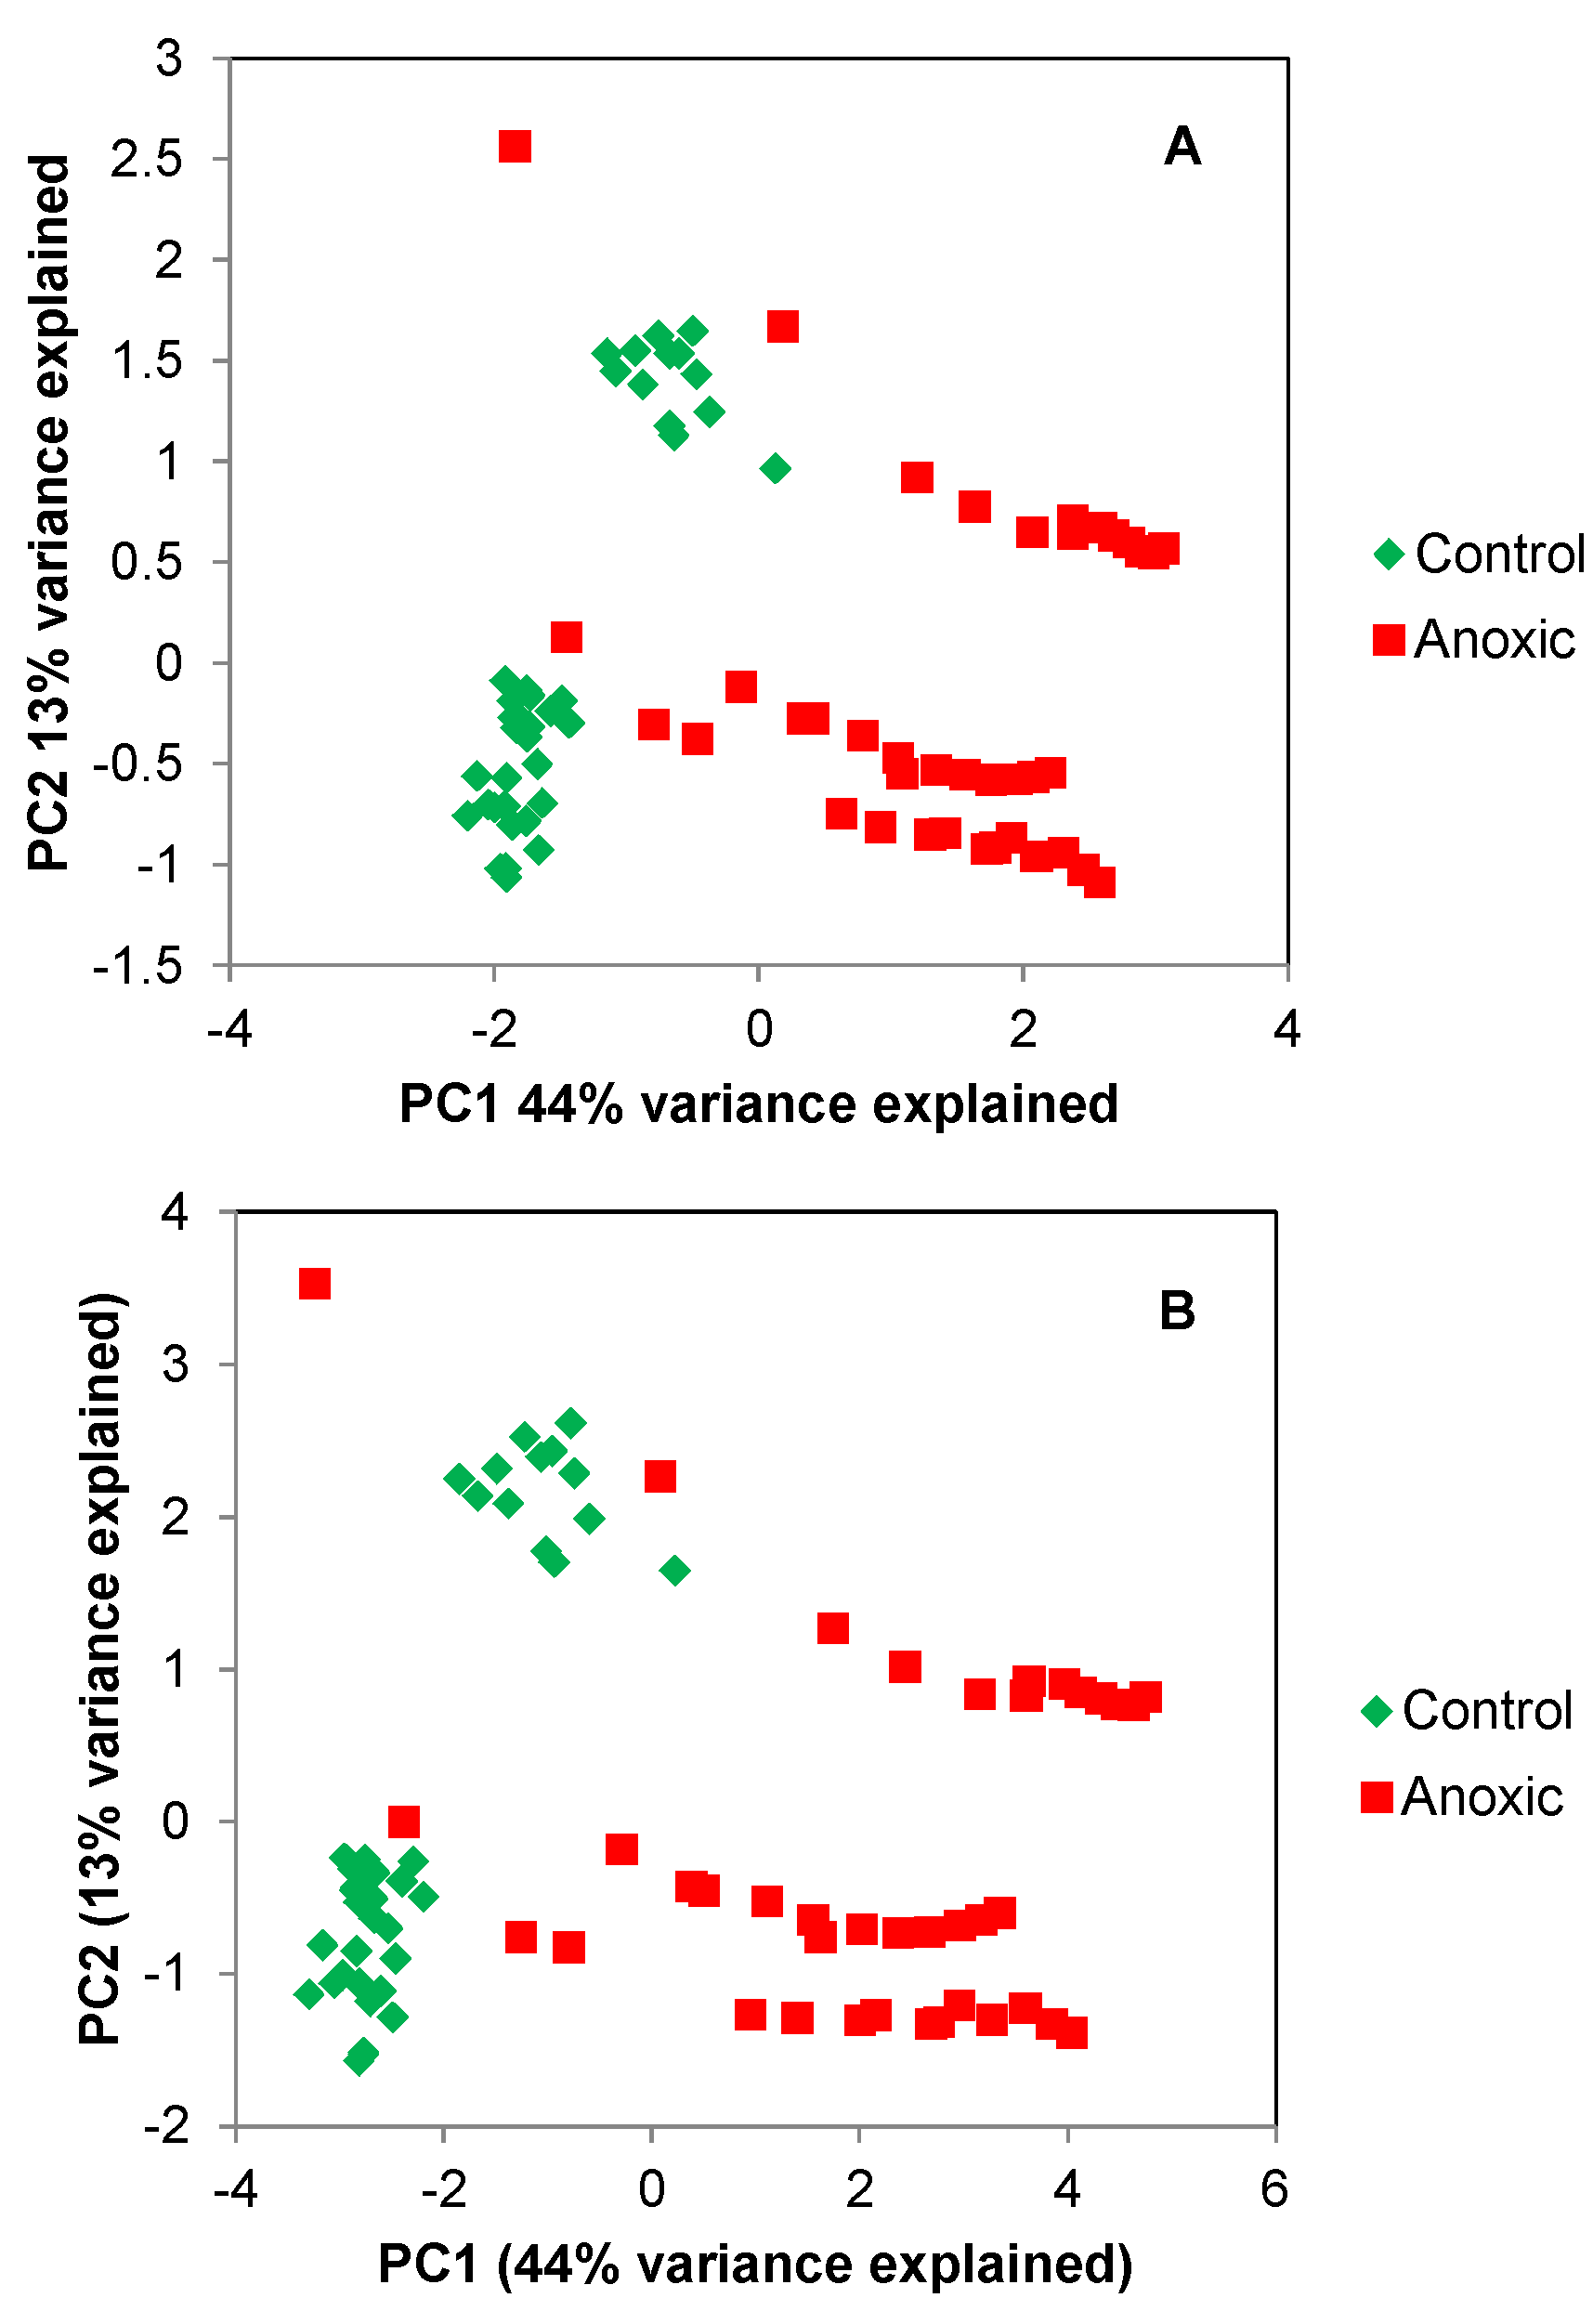
Here, we simply demonstrate that the same result is obtained when a chemometrics approach is applied to the 1D spikelet data and 2D NMR data. Therefore, PCA analysis of NMR data of living Daphnia magna under decreasing levels of oxygenation is performed. Figure 3 compares PCA analysis using (A) the full 2D datasets, and (B) the spikelet projections, both performed in AMIX. The data from 1H-13C HSQC were obtained from 99% enriched 13C Daphnia magna (water fleas) with twenty organisms in the tube per replicate. HSQC spectra are collected every 1.5 h over a period of 24 h.
For the control points (green), the organisms are supplied food and oxygenated water throughout the entire experiment, and the organisms are maintained in aerobic conditions (analogous to a conventional “control” dataset). The red dots represent a condition when the flow is stopped, and the organisms undergo anoxic stress that increases over time. Over time, as the anoxic stress increases (the red dots representing the stressed condition), distinct deviation from the control cluster (green dots) appears, due to variation caused by the build-up of lactic acid in the organisms’ metabolome (see quantile plot in Figure 4 for a simple way to visualize the lactic acid). With both the 2D data and 1D spikelet projections, the PCA shows near identical profiles (Figure 3A,B). There are some very slight variations between the PCA plots, likely due to the way Amix internally handles noise in the 1D and 2D during processing. However, the same information is obtained from each PCA plot. This is expected, considering the data being fed into the program are indeed identical and just displayed in a different format.

2.2. Quantile Plot from the Spikelet Projections

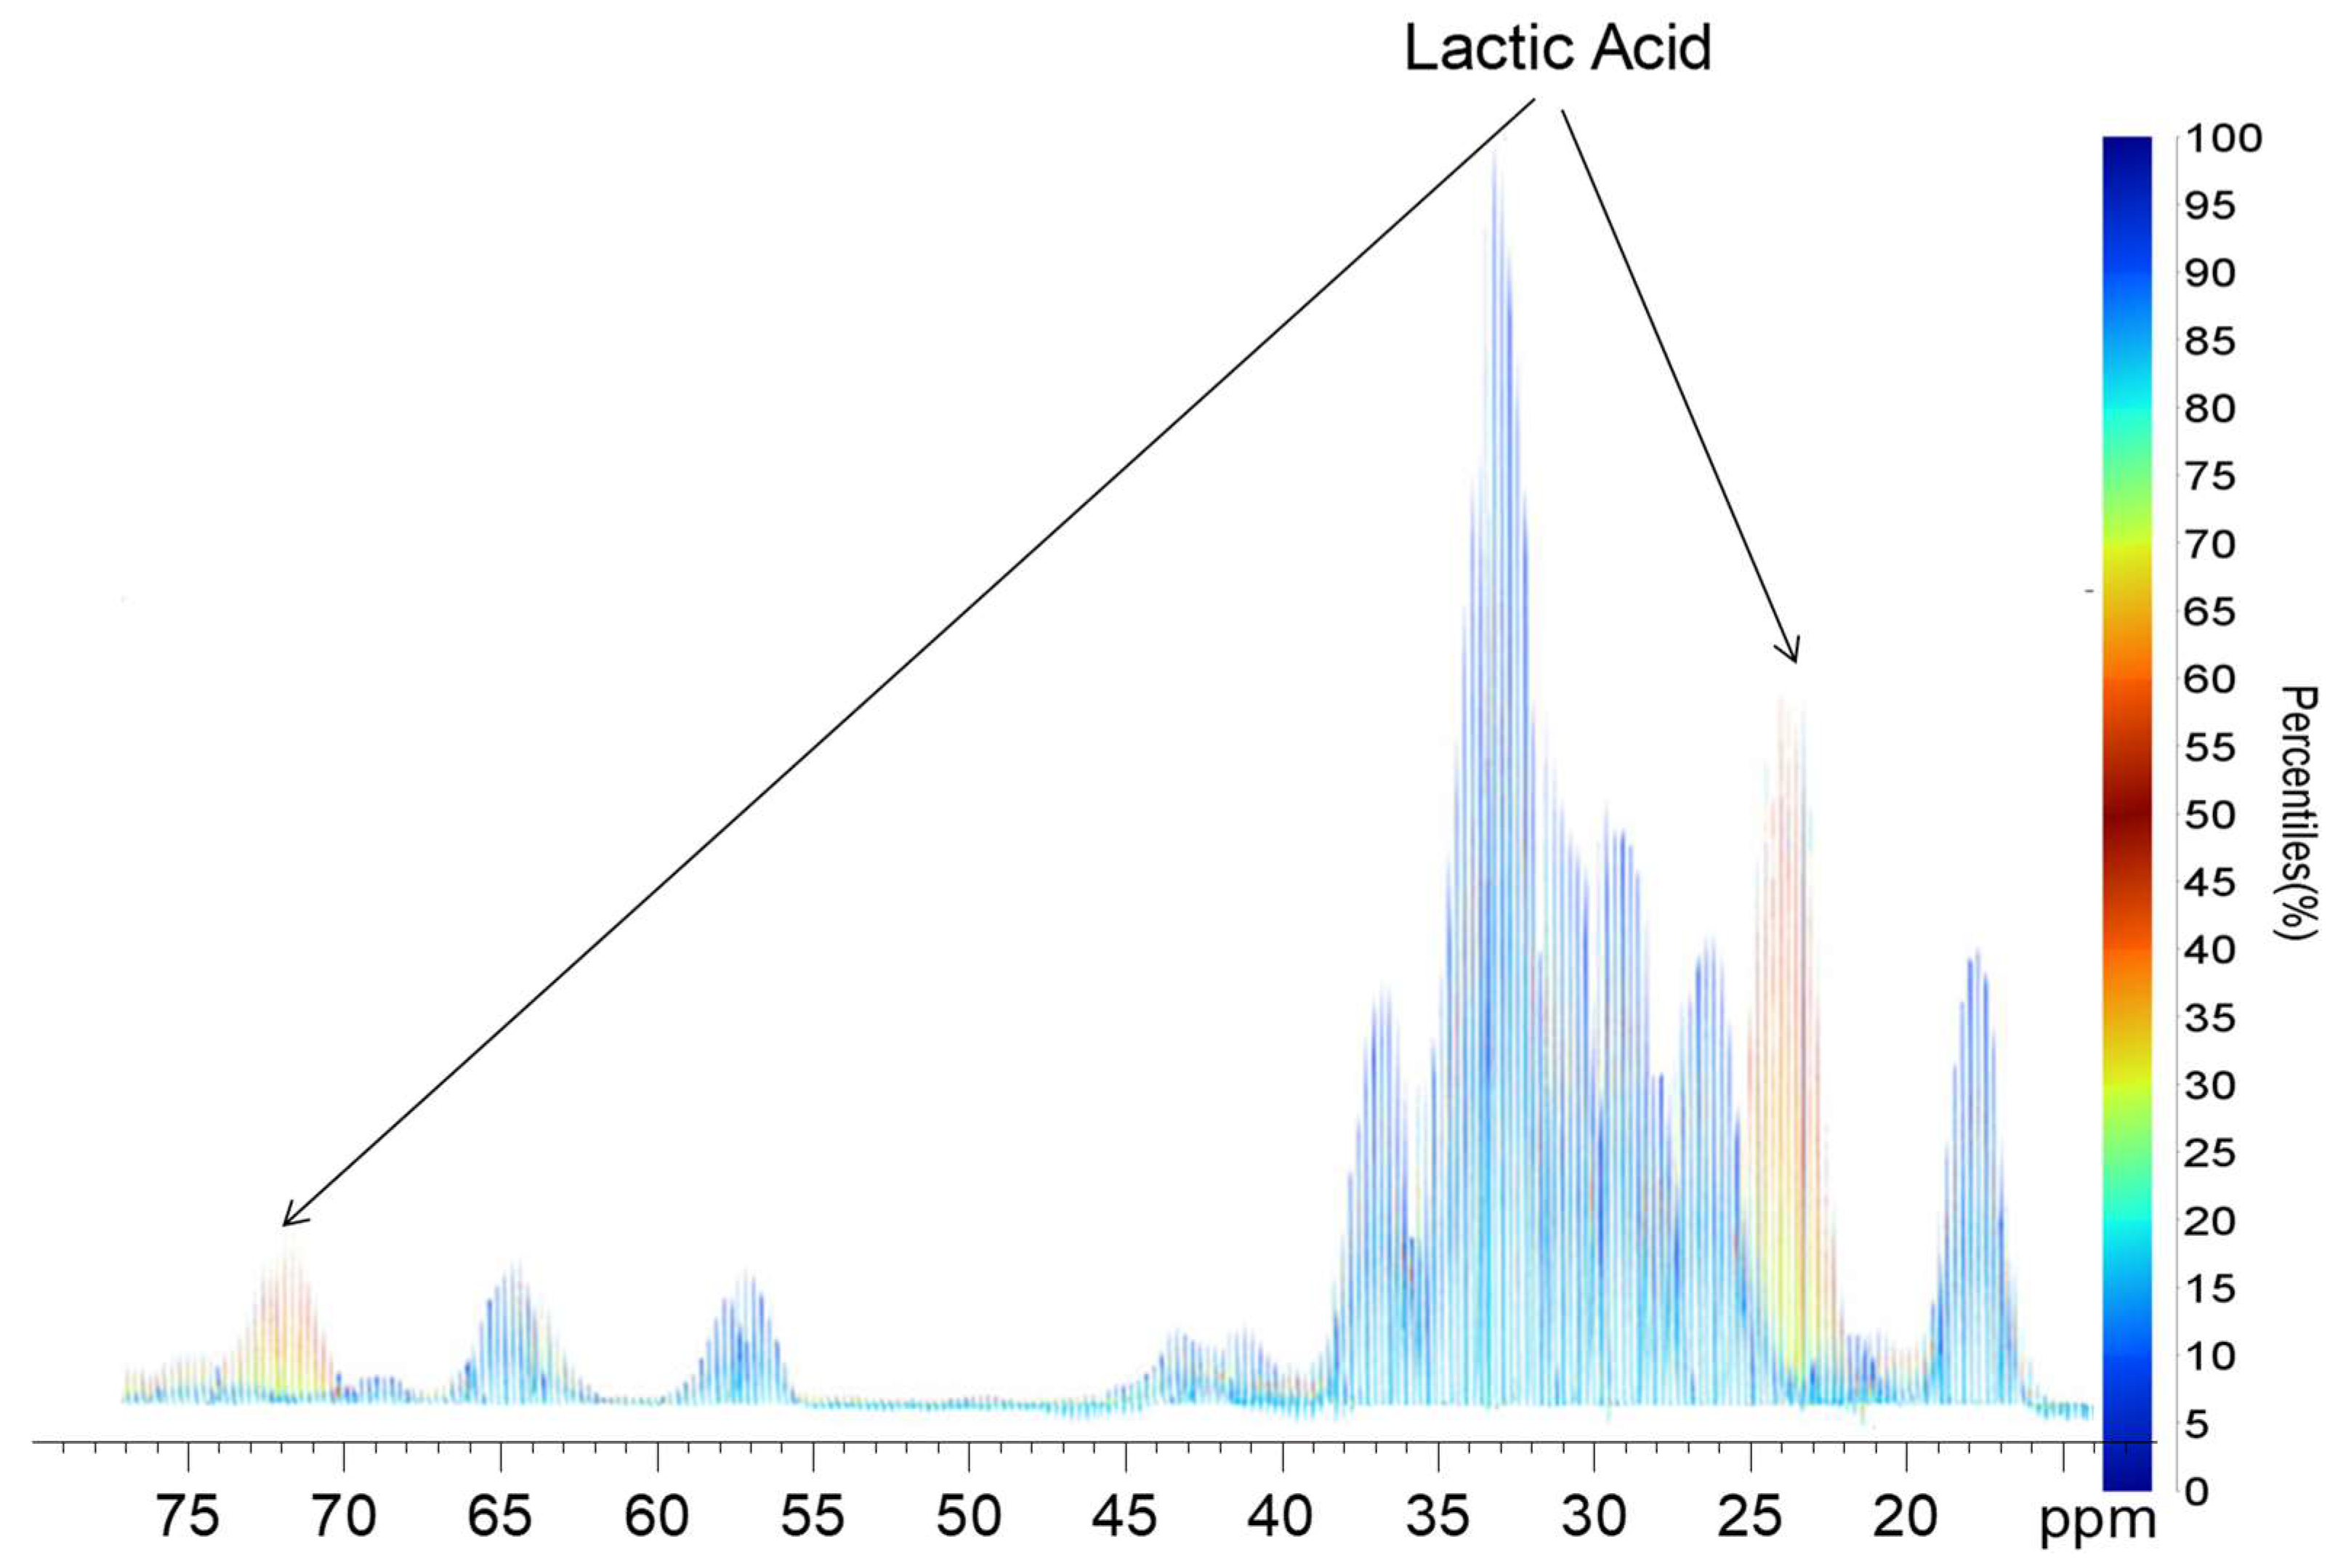
Another interesting approach to visualize the change or variation across a time series is to use a quantile plot. To our knowledge, producing a quantile plot from the 2D NMR data is not possible with currently available software. Even if it were possible, the envelope describing the variation would be superimposed across a contour profile and would require visualization in 3D from a large number of angles to appreciate. However, by reducing the 2D data to 1D, a simple quantile plot is easy to construct (see Figure 4). Here, blue corresponds to signals that do not vary significantly across the dataset, whereas signals in the yellow, orange, and red vary the most across the data. It is very simple to assign the two main peaks of lactic acid, which are known to be the primary stress response of Daphnia under anoxic conditions. As such, quantile plots hold the potential to quickly evaluate what is changing across a series of data. While not normally applicable to 2D NMR, the 1D spikelet permits the implementation in an easy fashion. This is just a very simple example of how converting a 2D NMR data set into a 1D format may also open up new potential for analyses not directly applicable to the 2D data itself.

3. Materials and Methods

3.1. Daphnia and Algae Culturing

Unlabelled Daphnia magna were cultured as previously described [21]. The neonates were isolated and exclusively fed a diet of 13C-enriched algae Chlamydomonas reinhardtii (Silantes, Munich, Germany) three times a week, during which 50–60% of the water was replaced everyday. The algae Chlamydomonas reinhardtii (not isotopically enriched), cultured as previously described [21], was added to the water reservoir to feed D. magna during the NMR experiments, in order to feed the organisms inside the NMR magnet without any additional signals from the food [6,7].

3.2. NMR Spectroscopy

All NMR experiments were performed using a Bruker Avance III HD 500 MHz (1H) NMR spectrometer with a 5-mm three channel 1H-13C-15N TCI Prodigy™ cryoprobe fitted with an actively shielded z-gradient. An external D2O lock bulb (~5 µL) was used for all experiments to keep the lock solvent separate from the organisms. The HSQC experiment was performed via double INEPT transfer using sensitivity improvement, States-TPPI phase cycling, and Garp4 decoupling. The SPR-W5-WATERGATE sequence was incorporated into the pulse-sequence to suppress the water signal [21]. A total of 128 increments were collected, each with 36 scans, 1024 time domain points, and recycle delay of 1 s. The interpulse delay during the INEPT transfer was based on 1JHC of 145 Hz. Data were processed with a qsine function shifted by 90 ° in both dimensions. Data were zero filled to 2048 points in F2, while F1 was filled to 1024 points along with 32 coefficients of forward linear prediction. Spectra were calibrated against a range of known compounds in the Bruker Biofluid Reference Compound Database (v.2.0.0—2.0.5) prior to matching.

3.3. In Vivo NMR Spectroscopy

Fully 13C labelled D. magna were cultured by feeding them a 13C labelled diet from birth. Twenty of the 10-day-old Daphnia were placed in the 5 –mm NMR tube for each experiment, and 2D datasets were collected every 90 min over a period of 20 h. Three “control” datasets were obtained under continuous flow and the NMR tube was connected to a flow system, as previously described [13]. The temperature of the flow system and NMR was maintained at 10 °C for the duration of the experiment. The HPLC pump allowed for circulation of fluid containing food and water. Three “anoxic” experiments were conducted under no flow condition, and the organisms experienced anoxic stress that increased over time. An excess of 12C food was added (Chlamydomonas reinhardtii) to the NMR tube at the beginning of each anoxic experiment to ensure Daphnia will have enough food during the no flow conditions.

3.4. Data and Statistical Analysis

Principal component analysis (PCA) was performed on 2D and 1D spikelet NMR spectra using an Analysis of Mixtures (AMIX) statistics package (version 3.9.14, Bruker BioSpin). The 2D NMR spectra were binned using rectangular bins of 0.24 ppm in the 13C dimension (5 to 150 ppm) and 0.1 ppm in the 1H dimension (−2 to 12.5 ppm). The 13C buckets were calculated such that there was one bucket per processed point in F1. This gave rise to ~87,600 bins per 2D spectrum. The 1D concatenated spikelet data were binned with 0.1 ppm to give the same number of buckets. The approach using 2D NMR for PCA analysis has been introduced elsewhere [8]. The region 4.70–4.85 ppm along the F2 (1H axis) is excluded due to the residual H2O/HOD signals present. The “sum of intensities” was used as the integration mode and the scaling was set to “total intensity”. The quantile plot was calculated using AssureNMR (version 2.1, Bruker Biospin, Rheinstetten, Germany), using the 1D spikelet bucket table described above.

4. Conclusions

This application note describes a simple approach to convert 2D 1H-13C HSQC NMR data into a 1D format (spikelet projection) that preserves the full information content and spectral dispersion. In turn, the approach potentially permits the larger array for tools that are available, or more developed for 1D NMR, to be applied, or where the visualization of higher dimensional data is challenging. The approach may have application beyond metabolomics. For example, processing of DOSY-HSQC data would require software to display the data in a 3D cube [22]. Converting the 2D HSQC data to a 1D spikelet format would still permit a conventional plot of chemical shift vs. diffusion to be performed. Similar arguments apply for the fitting HSQC collected with a series of T1 and T2 weighting for relaxation analysis, which is often performed in biomolecular NMR [23]. Conversion of the 2D HSQC format to a 1D format should permit additional analysis of the data when software capabilities required to work directly with the 2D format are not available. Furthermore, the conversion of 2D to 1D format may facilitate easier storage in universal formats that have recently been recommended for databased NMR-based metabolomics data [24]. This is particularly useful for the metabolomics in very complex mixtures or in-vivo data, where the additional dispersion of 2D NMR is required to reduce signal overlap.

Funding

This research was funded by the Strategic (STPGP 494273-16) and Discovery Programs (RGPIN-2014-05423), the Canada Foundation for Innovation (CFI), the Ontario Ministry of Research and Innovation (MRI), and the Krembil Foundation.

Conflicts of Interest

The authors declare no competing financial interests.

Appendix A

Below is the code for an AU program to run in Bruker topspin. Paste everything below this line into a text file and store in the topspin installation path \exp\stan\nmr\au\src\user. Run from the HSQC data set that needs to be converted into a “Spikelet Projection”
AUERR = create_1d_from_2d(curdat, cmd);
QUIT
#undef MASR
#undef SINO
#undef TILT
#include <pstruc.h>
#include <pstruc_all.h>
#include <lib/par.h>
static struct all_pars p_f2s =
#include <pinit_all.h>
int create_1d_from_2d(const char* curdat, const char* cmd)
{
char infile[PATH_MAX], outfile[PATH_MAX], path[PATH_MAX];
char nuc1[10];
double sw_p1, sf1;
float axis_offs1, sr1;
int i,j,k,m;
int byteorder, ret;
int si1, si2, xdim1, xdim2;
int curprocno, nprocno;
int *rowin, *rowout;
int *dbuf;
FILE *fpin, *fpout;
/***** get dataset and parameters *****/
GETCURDATA
FETCHPARS("SI",&si2);
FETCHPAR1S("SI",&si1);
FETCHPARS("BYTORDP",&byteorder);
FETCHPARS("XDIM",&xdim2);
FETCHPAR1S("XDIM",&xdim1);
curprocno = procno;
nprocno = procno + 10000;
/***** read axis parameters *****/
FETCHPAR1S("SF",&sf1);
FETCHPAR1S("SW_p",&sw_p1);
FETCHPAR1S("OFFSET",&axis_offs1);
FETCHPAR1S("SR",&sr1);
FETCHPAR1S("AXNUC",&nuc1);
/***** create 1D *****/
WRPPARAM(nprocno)
DATASET(name, expno, nprocno, disk, user)
STOREPAR("PPARMOD", 0);
STOREPARS("PPARMOD", 0);
/***** allocate memory *****/
if ( 2. * (double)si1 * (double)si2 * (double)sizeof(int)
                    >= 2. * 1024 * 1024* 1024 )
 {
 (void)sprintf(path,"amount of memory requested too large\n");
 STOPMSG(path);
 }
dbuf = malloc ( 2 * si1 * si2 * sizeof(int) );
if (dbuf == 0)
 {
 (void)sprintf(path,"cannot get enough mermory\n");
 STOPMSG(path);
 }
rowin = dbuf;
rowout = dbuf + si1*si2;
/***** read 2D *****/
DATASET(name, expno, curprocno, disk, user)
(void)strcpy(infile, PROCPATH("2rr"));
fpin = fopen(infile,"rb");
if ( fpin == NULL )
 {
 (void)sprintf(path,"cannot open 2rr file: %s",infile);
 STOPMSG(path);
 }
(void)fclose(fpin);
fpin = fopen(infile,"rb");
fread(rowin,sizeof(int),si1*si2,fpin);
local_swap4(rowin,sizeof(int)*si1*si2,byteorder);
(void)fclose(fpin);
/***** sort(no xdim) *****/
for (m=0; m < si1/xdim1; m++)
 {
 for (k=0; k < si2/xdim2; k++)
  {
  for (j=0; j < xdim1; j++)
   {
   for (i=0; i < xdim2; i++)
    {
    rowout[i+j*si2+k*xdim2+m*si2*xdim1] = rowin[i+j*xdim2+k*xdim2*xdim1+m*xdim1*si2];
    }
   }
  }
 }
/***** store 2D *****/
strcpy(outfile, NEWPROCPATH(nprocno, "1r"));
fpout = fopen(outfile,"wb");
local_swap4(rowout,sizeof(int)*si1*si2,byteorder);
fwrite(rowout,sizeof(int),si1*si2,fpout);
(void)fclose(fpout);
/***** store parameters *****/
DATASET(name, expno, nprocno, disk, user)
STOREPAR("SI", si1*si2)
STOREPARS("SI", si1*si2)
/***** store axis parameters *****/
STOREPARS("AXNUC", nuc1);
STOREPARS("SR", sr1);
(void)strcpy(path, PROCPATH("procs"));
if ((ret = getpar(path, "$PROC", &p_f2s)) < 0)
 {
 Proc_err(DEF_ERR_OPT, "getpar failed on %s\n%s", path, par_err(ret));
 return -1;
 }
p_f2s.SF = sf1;
p_f2s.SW_p = sw_p1;
p_f2s.OFFSET = axis_offs1;
if ((ret = putpar(path, "$PROC", &p_f2s)) < 0)
 {
 Proc_err(DEF_ERR_OPT, "getpar failed on %s\n%s", path, par_err(ret));
 return -1;
 }
/***** view data *****/
VIEWDATA
Proc_err(ERROPT_AK_NO, "transpose finished");
return 0;
}

References

  1. Hertkorn, N.; Ruecker, C.; Meringer, M.; Gugisch, R.; Frommberger, M.; Perdue, E.M.; Witt, M.; Schmitt-Kopplin, P. High-precision frequency measurements: Indispensable tools at the core of the molecular-level analysis of complex systems. Anal. Bioanal. Chem. 2007, 389, 1311–1327. [Google Scholar] [CrossRef] [PubMed]
  2. Lewis, I.A.; Schommer, S.C.; Hodis, B.; Robb, K.A.; Tonelli, M.; Westler, W.M.; Sussman, M.R.; Markley, J.L. Method for determining molar concentrations of metabolites in complex solutions from two-dimensional1H-13C NMR spectra. Anal. Chem. 2007, 79, 9385–9390. [Google Scholar] [CrossRef] [PubMed]
  3. Bollard, M.E.; Garrod, S.; Holmes, E.; Lindon, J.C.; Humpfer, E.; Spraul, M.; Nicholson, J.K. High-resolution 1H and 1H-13C magic angle spinning NMR spectroscopy of rat liver. Magn. Reson. Med. 2000. [Google Scholar] [CrossRef]
  4. An, Y.J.; Xu, W.J.; Jin, X.; Wen, H.; Kim, H.; Lee, J.; Park, S. Metabotyping of the C. elegans sir-2.1 mutant using in vivo labeling and13C-heteronuclear multidimensional NMR metabolomics. ACS Chem. Biol. 2012, 7, 2012–2018. [Google Scholar] [CrossRef] [PubMed]
  5. Dumas, M.E.; Canlet, C.; Andŕ, F.; Vercauteren, J.; Paris, A. Metabonomic assessment of physiological disruptions using1H-13C HMBC-NMR spectroscopy combined with pattern recognition procedures performed on filtered variables. Anal. Chem. 2002. [Google Scholar] [CrossRef]
  6. Yuk, J.; Simpson, M.J.; Simpson, A.J. 1-D and 2-D NMR-based metabolomics of earthworms exposed to endosulfan and endosulfan sulfate in soil. Environ. Pollut. 2013, 175, 35–44. [Google Scholar] [CrossRef]
  7. Yuk, J.; Simpson, M.J.; Simpson, A.J. 1-D and 2-D NMR metabolomics of earthworm responses to sub-lethal trifluralin and endosulfan exposure. Environ. Chem. 2011. [Google Scholar] [CrossRef]
  8. Yuk, J.; McKelvie, J.R.; Simpson, M.J.; Spraul, M.; Simpson, A.J. Comparison of 1-D and 2-D NMR techniques for screening earthworm responses to sub-lethal endosulfan exposure. Environ. Chem. 2010, 7, 524–536. [Google Scholar] [CrossRef]
  9. Creek, D.J.; Chokkathukalam, A.; Jankevics, A.; Burgess, K.E.V.; Breitling, R.; Barrett, M.P. Stable isotope-assisted metabolomics for network-wide metabolic pathway elucidation. Anal. Chem. 2012, 84, 8442–8447. [Google Scholar] [CrossRef]
  10. Clendinen, C.S.; Stupp, G.S.; Ajredini, R.; Lee-McMullen, B.; Beecher, C.; Edison, A.S. An overview of methods using 13C for improved compound identification in metabolomics and natural products. Front. Plant Sci. 2015, 6. [Google Scholar] [CrossRef] [Green Version]
  11. Clendinen, C.S.; Stupp, G.S.; Wang, B.; Garrett, T.J.; Edison, A.S. 13C Metabolomics: NMR and IROA for Unknown Identification. Curr. Metab. 2016, 4, 116–120. [Google Scholar] [CrossRef]
  12. Chokkathukalam, A.; Kim, D.H.; Barrett, M.P.; Breitling, R.; Creek, D.J. Stable isotope-labeling studies in metabolomics: New insights into structure and dynamics of metabolic networks. Bioanalysis 2014, 6, 511–524. [Google Scholar] [CrossRef]
  13. Tabatabaei Anaraki, M.; Dutta Majumdar, R.; Wagner, N.; Soong, R.; Kovacevic, V.; Reiner, E.J.; Bhavsar, S.P.; Ortiz Almirall, X.; Lane, D.; Simpson, M.J.; et al. Development and Application of a Low-Volume Flow System for Solution-State in Vivo NMR. Anal. Chem. 2018, 90, 7912–7921. [Google Scholar] [CrossRef] [PubMed]
  14. Majumdar, R.D.; Akhter, M.; Fortier-McGill, B.; Soong, R.; Liaghati-Mobarhan, Y.; Simpson, A.J.; Spraul, M.; Schmidt, S.; Heumann, H. In vivo solution-state NMR-based environmental metabolomics. eMagRes 2017, 6, 133–148. [Google Scholar] [CrossRef]
  15. Yang, C.; Harrison, C.; Jin, E.S.; Chuang, D.T.; Sherry, A.D.; Malloy, C.R.; Merritt, M.E.; DeBerardinis, R.J. Simultaneous steady-state and dynamic13C NMR can differentiate alternative routes of pyruvate metabolism in living cancer cells. J. Biol. Chem. 2014, 289, 6212–6224. [Google Scholar] [CrossRef] [PubMed]
  16. Féraud, B.; Govaerts, B.; Verleysen, M.; de Tullio, P. Statistical treatment of 2D NMR COSY spectra in metabolomics: Data preparation, clustering-based evaluation of the Metabolomic Informative Content and comparison with1H-NMR. Metabolomics 2015, 11, 1756–1768. [Google Scholar] [CrossRef]
  17. Ludwig, C.; Viant, M.R. Two-dimensional J-resolved NMR spectroscopy: Review of a key methodology in the metabolomics toolbox. Phytochem. Anal. 2010, 21, 22–32. [Google Scholar] [CrossRef]
  18. Arbogast, L.W.; Delaglio, F.; Schiel, J.E.; Marino, J.P. Multivariate Analysis of Two-Dimensional 1 H, 13 C Methyl NMR Spectra of Monoclonal Antibody Therapeutics to Facilitate Assessment of Higher Order Structure. Anal. Chem. 2017. [Google Scholar] [CrossRef] [PubMed]
  19. Worley, B.; Powers, R. Generalized adaptive intelligent binning of multiway data. Chemom. Intell. Lab. Syst. 2015, 146, 42–46. [Google Scholar] [CrossRef] [Green Version]
  20. Tabatabaei Anaraki, M.; Simpson, M.J.; Simpson, A.J. Reducing impacts of organism variability in metabolomics via time trajectory in vivo NMR. Magn. Reson. Chem. 2018, 56, 1117–1123. [Google Scholar] [CrossRef]
  21. Soong, R.; Nagato, E.; Sutrisno, A.; Fortier-Mcgill, B.; Akhter, M.; Schmidt, S.; Heumann, H.; Simpson, A.J. In vivo NMR spectroscopy: Toward real time monitoring of environmental stress. Magn. Reson. Chem. 2015, 53, 774–779. [Google Scholar] [CrossRef] [PubMed]
  22. Barjat, H.; Morris, G.A.; Swanson, A.G. A Three-Dimensional DOSY-HMQC Experiment for the High-Resolution Analysis of Complex Mixtures. J. Magn. Reson. 1998. [Google Scholar] [CrossRef]
  23. Peng, J.W.; Wagner, G. Investigation of protein motions via relaxation measurements. Methods Enzymol. 1994. [Google Scholar] [CrossRef]
  24. Schober, D.; Jacob, D.; Wilson, M.; Cruz, J.A.; Marcu, A.; Grant, J.R.; Moing, A.; Deborde, C.; De Figueiredo, L.F.; Haug, K.; et al. NmrML: A Community Supported Open Data Standard for the Description, Storage, and Exchange of NMR Data. Anal. Chem. 2018, 90, 649–656. [Google Scholar] [CrossRef] [PubMed]
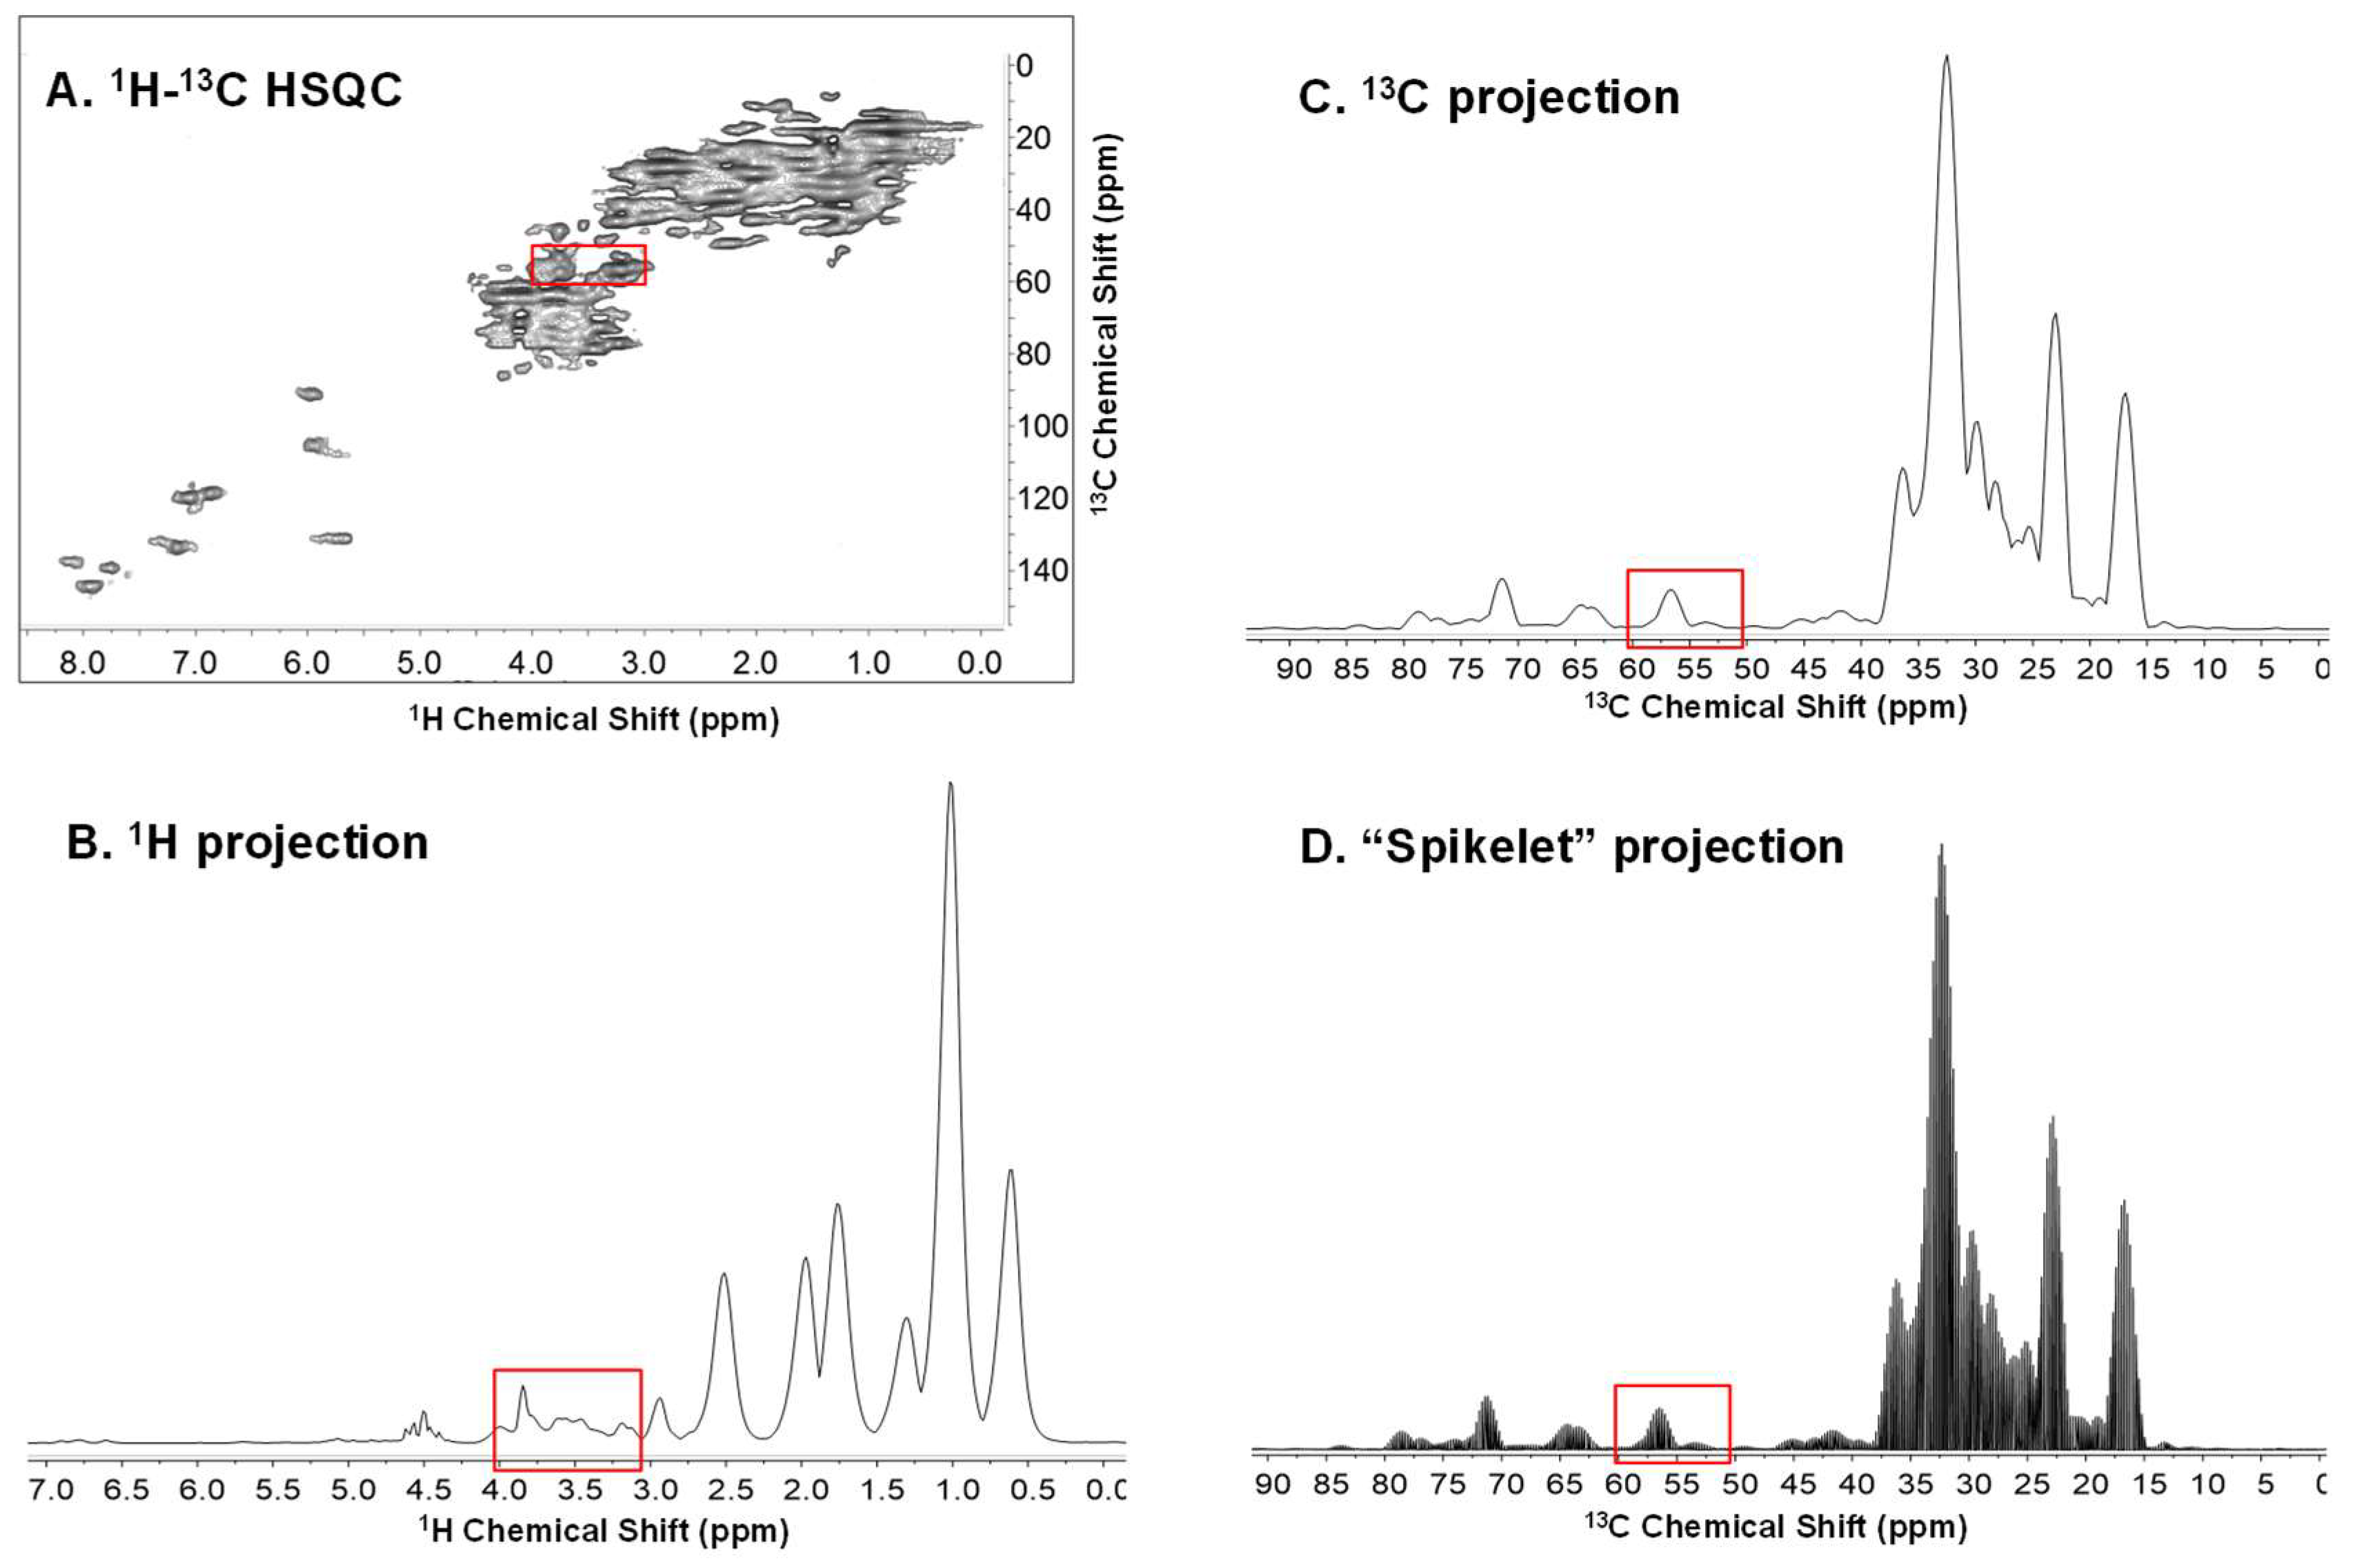
Figure 1. NMR data for 13C enriched in vivo Daphnia magna in a flow system [13]. (A) Full 1H-13C HSQC, (B) conventional 1H projection, (C) conventional 13C projection, and (D) spikelet projection.
Metabolites 09 00016 g001
Figure 2. An expanded region around 57 ppm carbon, which demonstrates the information contained in the spikelet projection is identical to that in the full HSQC. (A) Expanded regions of 2D 1H-13C HSQC NMR, where three corresponding 1H signals from Betaine/Choline, Arginine/Glutamic acid, and Phenylalanine/Tyrosine are present; (B) indicates 1H chemical shift of the 57 ppm slice from the full HSQC, in which all three signals are well resolved; (C) shows 13C chemical shift of the exact same slice from (D) the spikelet projection.
Metabolites 09 00016 g002
Figure 3. PCA plots (3 replicates) from the (A) full 2D dataset, and (B) the spikelet projections, offer near identical results.
Metabolites 09 00016 g003
Figure 4. Quantile plot of 1D spikelet projection spectra generated from 1H-13C HSQC NMR. The red/orange peaks are from lactic acid that change over time, while other peaks in blue do not change.
Metabolites 09 00016 g004