Abstract
For people with Parkinson’s disease (PD), considered the most common neurodegenerative disease behind Alzheimer’s disease, accurate diagnosis is dependent on many factors; however, misdiagnosis is extremely common in the prodromal phases of the disease, when treatment is thought to be most effective. Currently, there are no robust biomarkers that aid in the early diagnosis of PD. Following previously reported work by our group, we accurately measured the concentrations of 18 bile acids in the serum of a prodromal mouse model of PD. We identified three bile acids at significantly different concentrations (p < 0.05) when mice representing a prodromal PD model were compared with controls. These include ω-murichoclic acid (MCAo), tauroursodeoxycholic acid (TUDCA) and ursodeoxycholic acid (UDCA). All were down-regulated in prodromal PD mice with TUDCA and UDCA at significantly lower levels (17-fold and 14-fold decrease, respectively). Using the concentration of three bile acids combined with logistic regression, we can discriminate between prodromal PD mice from control mice with high accuracy (AUC (95% CI) = 0.906 (0.777–1.000)) following cross validation. Our study highlights the need to investigate bile acids as potential biomarkers that predict PD and possibly reflect the progression of manifest PD.
1. Introduction
Parkinson’s Disease (PD) is a common, long-term neurodegenerative disease. Adjusting for age and gender, the incidence of PD has been estimated to affect 1 in every 100 people over the age of 60 [1]. PD motor symptoms are believed to originate from striatal dopamine loss which occurs due to the death of dopaminergic neurons in the substantia nigra pars compacta (SNpc). The loss of dopaminergic neurons in the SNpc is the hallmark indicator for the post-mortem diagnosis of PD [2]. Lewy bodies and Lewy neurites, composed mainly of misfolded α-synuclein (α-syn) protein also feature in PD brains. Clinical diagnosis of PD is based on several criteria including bradykinesia in combination with rigidity, resting tremor, or both and response to dopaminergic drugs [3]. In addition to the classical motor symptoms, a wide range of non-motor symptoms and signs are apparent in PD patients [4], some of which are already present long before the onset of motor symptoms, in the PD prodrome [5]. However, misdiagnosis is common in the prodromal phase, when a potential disease-modifying treatment is thought to be most effective [6,7]. Currently, no robust biomarkers for early and more precise diagnosis of PD exist [8] and as several new potentially disease-modifying treatments emerge this is becoming a major unmet medical need [6,9].
In a previous study by our group, we identified Bile Acid metabolism as one of the major biochemical pathways to be perturbed in the brain of a mouse model of prodromal PD [10]. Bile acids are molecules derived from cholesterol in hepatocytes and are used to emulsify fats in the small intestine and promote fat digestion and absorption [11,12]. In addition to their role in lipid digestion and absorption, bile acids function as signaling molecules, participating as ligands in both membrane-bound receptors and nuclear hormone receptors [13,14]. It has been reported that certain bile acids, including ursodeoxycholic acid (UDCA) and tauroursodeoxycholic acid (TUDCA) can pass the blood–brain barrier [14] with their presence also being noted in cerebrospinal fluid (CSF), plasma, urine, and serum [15,16,17,18]. To date, several reports implicate bile acids in neurodegenerative diseases and suggest a possible role in modulating neuronal proliferation. One such study links statistically significant increases in levels of deoxycholic acid (DCA), glycodeoxycholic acid (GDCA), and lithocholic acid (LCA) in plasma, to Alzheimer’s disease and mild cognitive impairment [19]. Abdelkader et al. observed a neuroprotective effect from administration of UDCA on a murine rotenone model of PD [20]. Further, it has been reported that cholic acid is a ligand for liver X receptors which promote ventral midbrain neurogenesis and cell survival [21]. Bile acids have also been reported to be potential biomarkers of other neurodegenerative diseases including Alzheimer’s disease (AD) [22,23,24].
In the current study, we accurately measured the concentrations of 18 bile acids in the serum of a prodromal mouse model of PD. Following on from our previous metabolomics work using this model, we believe that bile acids may prove to be essential for the development of a robust biomarker panel capable of accurately diagnosing PD.
2. Results
2.1. Univariate Analysis
To investigate bile acids in a model of prodromal PD, we used a mouse model previously developed by our group which consists of WT mice injected with α-syn fibrils into the olfactory bulb [7,10]. The injection of α-syn fibrils leads to the propagation of α-syn aggregates throughout several interconnected regions in the brain. The progressive spreading of α-synucleinopathy shows many similarities with that which has been suggested to occur in PD [23,25,26,27]. Using mass spectrometry, we analyzed the serum of the α-syn fibrils-injected mice (PFF mice) and of α-syn monomers-injected mice (HuMonomers mice; controls), collected 3 months post injection.
Of the 18 bile acids profiled, all were within the limits of detection and quantification. Of these, we found three to be significantly perturbed in PFF mice compared to HuMonomers mice: Omega-murichoclic acid (MCAo), tauroursodeoxycholic acid (TUDCA) and ursodeoxycholic acid (UDCA) (Table 1). Of the three bile acids, we found UDCA and its taurine conjugated form TUDCA to be extremely decreased (17- and 14-fold, respectively) in the mice injected with PFFs.

Table 1.
Results of the univariate analyses for bile acids measured in serum from mice injected with HuMonomers and PFFs. p-Values were calculated using the Wilcoxon–Mann–Whitney test. LOD-Limit of detection; LLOQ-Lower limit of quantification. Those bile acids highlighted in bold are considered statistically significantly different (p < 0.05; q < 0.05).
Figure 1 displays the Box and Whisker plots for the top three significantly different (p < 0.05; FDR < 0.05) metabolites in both the HuMonomer- and PFF-injected mice. As is evident from the plots, all are at significantly lower concentrations in PFF-injected mice.
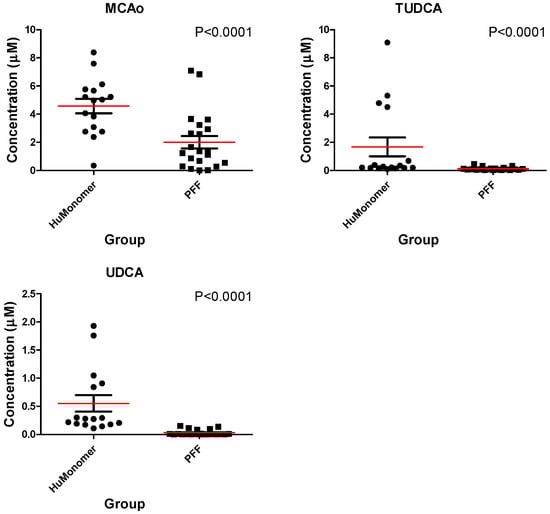
Figure 1.
The mean distribution (±SEM) for each of the three significantly different bile acids between mice injected with HuMonomers and PFFs.
2.2. Logistic Regression Analysis
Using the concentrations of taurolithocholic acid (TLCA), glycochenodeoxycholic acid (GCDCA) and TUDCA, we developed a diagnostic algorithm capable of accurately differentiating between HuMonomer- and PFF-injected mice with 91.4% accuracy following 100-fold cross validations.
where P is Pr(y = 1|x). The best threshold (or Cutoff) for the predicted P is 0.52. Original Label: 0/1 --> Labels in Logistic Regression: 0/1 Note) The class/response value is recommended as (Case: 1 and Control: 0).
logit(P) = log(P/(1 − P)) = −0.893 + 11.152 TLCA + 8.917 GCDCA − 18.221 TUDCA
Table 2 lists the summary of each feature used to produce the diagnostic algorithm. Table 3 details the performance values of the logistic regression model following 10-fold cross validation with Figure 2 displaying the ROC plot for said model. The model was significant following 1000-permutation tests with p = 0.003. Figure 2 displays the ROC curve for the logistic regression analysis following 10-fold cross validation.
Table 2.
Logistic Regression Model—Summary of Each Feature.
Table 3.
The performance values for the logistic regression model.
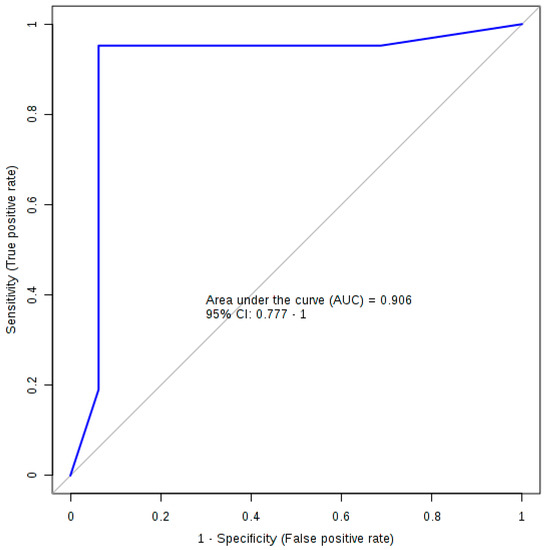
Figure 2.
The ROC plot for the logistic regression diagnostic algorithm.
3. Discussion
This is the first study to accurately quantify bile acids from the serum of a validated mouse model of prodromal PD. Our study was primarily driven by the results from a previous study by our group [10]. In total, we profiled 18 bile acids of which only three were found to be statistically significantly different in PFF mice when compared with HuMonomer controls (p < 0.05). All three were found to be significantly decreased in PFF mouse serum, with TUDCA and UDCA at 14- and 17-fold lower concentrations, respectively.
Using the concertation of three bile acids (TLCA, GCDCA and TUDCA), we developed a predictive model capable of differentiating between PFF mice and HuMonomer controls with an AUC (95 % CI) = 0.906 (0.777–1.00) with high sensitivity and specificity values (0.952 (0.952–1.000) and 0.938 (0.819–1.000), respectively) following cross validation. This eclipses work previously reported by our group in which we report a predictive logistic regression model developed using the concentration of three phosphocholines and trans-4-hrdroxyproline [10]. This previous model achieved an AUC (95% CI) = 0.836 (0.696−0.9777) high sensitivity and specificity values (0.800 (0.800−0.975) and 0.889 (0.744−1.00), respectively); however, following cross validation, those results are less precise than what we report herein.
Bile acids play pivotal roles in many physiological and pathological activities which include acting as signaling molecules that regulate lipid, glucose and energy metabolism [28]; however, very little is known about the molecular mechanisms of bile acids in the central nervous system [29]. It has, however, been shown that following primary bile acid synthesis in the liver, bile acids are subsequently secreted into the gut where they are modified by the intestinal bacteria to produce secondary bile acids. These can be further modified in the liver or gut and may be conjugated with glycine or taurine [30]. Figure 3 displays a simplified depiction of the biochemistry. In Figure 3, we show which bile acids have been reported as being cytotoxic and neuroprotective [31,32]. Of the neuroprotective bile acids measured in this study, UDCA and TUDCA were found to be at markedly lower concentrations in the serum of PFF mice as compared to controls (17-fold and 14-fold, respectively). UDCA and TUDCA are secondary bile acids, produced in the gut and not in the liver. They have been reported to have neuroprotective effects in the brain, functioning partly as chaperones, decreasing the formation of toxic aggregates in protein folding disorders [33,34]. Further, they have also been reported to reduce reactive oxygen species formation [35], inhibit apoptosis [36] and prevent mitochondrial dysfunction [37].
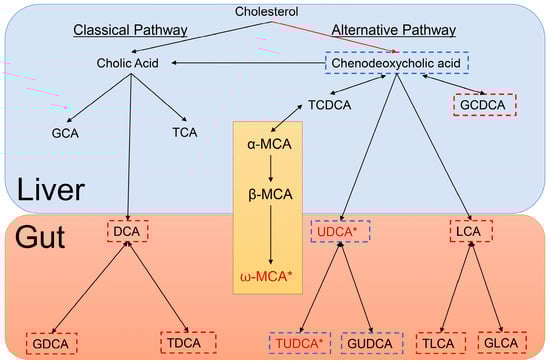
Figure 3.
Depiction of Bile Acid Metabolism in the liver and gut of mice. Bile acids outlined in blue are neuroprotective, bile acids outlined in red are cytotoxic and those bile acids in red with an accompanying asterisk are statistically significantly different between HuMonomer- and PFF-injected mice. The section detailing Muricholic acid (MCA) only occurs in mice.
A recent emerging and exciting concept in health and disease is the ability of the guts microbiota to communicate with the brain and subsequently modulate behavior [38]. This bidirectional signaling axis between the gut and the brain is believed to be essential for conserving homeostasis which is regulated at the hormonal, immunological and neuronal levels (central and enteric nervous systems) [38]. While a lot of attention has been placed on the gut microbiome and neurodegenerative diseases, most of the reported studies have focused on the gut as being the driver. In this study, we show that by inducing α-synucleinopathy in the brain with PFFs to mirror what is observed in prodromal PD, we see a significant decrease in the concentrations of secondary bile acids which have neuroprotective properties. As depicted in Figure 3, the production of these secondary, neuroprotective bile acids only occurs in the gut by intestinal bacteria. So, is the formation of the α-syn aggregates in the brain directly affecting the PFF mouse gut bacteria and the formation of secondary bile acids deemed neuroprotective? Or is it possible that these neuroprotective bile acids are being degraded faster in the prodromal PD brain due to the developing α-synucleinopathy which subsequently leads to lower blood concentrations? Both hypotheses need further exploration in the future.
We report, for the first time, a bile acid biomarker panel capable of identifying mice with developing α-synucleinopathy. Using bile acids as biomarkers is a marked improvement on our previous metabolomics work and highlights the potential of bile acids for the prediction of those patients at greatest risk of developing PD, particularly in the prodromal phase when a treatment aiming at slowing disease progression is potentially most effective and might even delay the onset of motor symptoms [8,9]. Further, our results demonstrate a potential novel therapeutic area for prodromal PD and developing α-synucleinopathy which needs future exploration. More work is required to verify these initial hypotheses, using mouse models and, most importantly, large clinical cohorts of people who exhibit several signs of prodromal PD.
4. Materials and Methods
4.1. Animals
Under 12 h light/12 h dark cycles, C57Bl/6J mice (Jackson Laboratory) were housed four to five per cage with ad libitum access to food and water. As previously described by our group, all procedures relating to the animals followed The Guide for Care and Use of Laboratory Animals (National Research Council) and were validated by the Van Andel Research Institute’s Institutional Animal Care and Use Committee (Animal Use Protocols 14-01-001 and 16-12-033).
4.2. Purification of Recombinant α-syn, Assembly of Preformed Fibrils and Stereotactic Injections
Recombinant α-syn purification, assembly of the fibrils and stereotactic injections were previously described by our group [7,10,39]. In brief, we cultured BL21 E. coli and induced them to express human α-syn. The bacteria were then pelleted, and lysed by sonication. We boiled the lysate for 10 min and collected the supernatant after centrifugation. The supernatant was then dialyzed overnight in 10 mM Tris, pH 7.5, 50 mM NaCl, and 1 mM EDTA. The lysate was then purified by chromatographic separation using a Superdex 200 Column (GE Healthcare Life Sciences, Marlborough, MA, USA) and a Hi-trap Q HP anion exchange column (GE Healthcare Life Sciences, Marlborough, MA, USA). Extracts from the different fractions were then migrated by SDS-PAGE and we identified the fractions containing α-syn after Coomassie staining. The selected fractions were then collected and dialyzed against PBS buffer (GE Healthcare Life Sciences, Marlborough, MA, USA). We then measured the final concentration of purified recombinant α-syn using a NanoDrop 2000 (Thermofisher Scientific, Waltham, MA, USA) and concentrated if needed. Aliquots were stored at −80 °C until use. For fibril assembly, purified recombinant α-syn was thawed and diluted to 5 mg/mL in PBS and under continuous shaking at 1000 rpm at 37 °C in a Thermomixer (Eppendorf, Hamburg, Germany) for 7 days. Fibrils were aliquoted and frozen at −80 °C until use.
Before injection, human α-syn fibrils (PFFs, 5 µg/µL) were thawed at RT and sonicated at RT as previously described in Graham et al., 2018 [10]. Human α-syn monomers (huMonomers) were thawed and we collected the supernatant after ultracentrifugation at 100,000 g for 30 min. We injected mice stereotactically with PFFs (n = 20) or huMonomers (n = 20) (0.8 µL, 5 µg/µL) in the OB (unilateral) of 2 months-old wild type mice as previously described [7,40]. Two mice injected with huMonomers were euthanized after developing severe dermatitis, unrelated to the surgical procedure.
We imaged the fibrils post-sonication by transmission electron microscopy to check the morphology of the fibrils. Human fibrils (after sonication) were diluted to 0.1 µg/µL into sterile PBS and negatively stained with 2% uranyl formate (Electron Microscopy Science, Hatfield, PA, USA, ref #22400). Grids were imaged using a FEI Tecnai G2 Spirit TWIN transmission electron microscope (FEI Company, Hillsboro, OR, USA) at 120 kV (Figure S1).
4.3. Serum Collection
Serum samples were acquired as previously described by our group [10]. Three months post-injection, mice were deeply anesthetized with sodium pentobarbital and we collected blood at final bleed by cardiac puncture in BD red top–vacutainer tubes. We kept the tubes at RT for 20–30 min to allow blood clot formation and then centrifuged them at 4500 g for 10 min at 15 °C. The serum was collected and transferred to pre-cooled vials, vortexed, aliquoted and frozen on crushed dry ice. Samples were then stored at −80 °C.
4.4. Bile Acid Quantification
Bile acids were analyzed using the Biocrates® Bile Acids Kit (Biocrates Life Science AG, Innsbruck, Austria) as described by our group previously [22]. In brief, data were acquired on a Waters TQ-S spectrometer coupled with an Acquity I-Class ultra-pressure liquid chromatography (UPLC) system. All serum specimens were acquired in accordance with the protocol as described in the Bile Acids kit manual. All data analysis was completed using the Biocrates MetIDQ software and TargetLynx (Waters, Milford, MA, USA).
4.5. Statistical Analysis
All data were analyzed using MetaboAnalyst (v4.0) [41]. A Wilcoxon–Mann–Whitney U-test was performed on all data acquired to determine whether there were any significantly different metabolites between prodromal PD model mice and age-matched controls injected with HuMonomers (p < 0.05; q-value < 0.05). Bonferroni-corrected p-values were used to correct for multiple comparisons.
Prior to logistic regression analyses, all data were normalized to the sum and autoscaled. To select the predictor variables used in the logistic regression analyses, Least Absolute Shrinkage and Selection Operator (LASSO) and stepwise variable selection were utilized for optimizing all the model components [42]. A k-fold cross-validation (CV) technique was used to show that the models were not over fit and to assess potential predictive accuracy in an independent sample [43]. Area under the curve (AUC (95% confidence interval)), sensitivity and specificity values were calculated to estimate the performance of the logistic regression and ROC analyses.
Supplementary Materials
The following are available online at http://www.mdpi.com/2218-1989/8/4/71/s1, Figure S1: Sonicated PFFs stained by uranyl formate, imaged by transmission electron microscopy to confirm their fibrillary nature.
Author Contributions
Designing Research Studies, S.F.G., N.L.R., J.A.S. and P.B.; Conducting Experiments, S.F.G., N.L.R., Z.U., A.Y., E.S. (Eric Sherman), K.B., E.S. (Emily Schulz), L.K.M. and J.A.S.; Analyzing Data, S.F.G.; Drafting the Manuscript, S.F.G., N.L.R. and P.B.; Writing the Manuscript, all authors contributed to the editing of the manuscript.
Acknowledgments
We would like to thank Anne Whitlaw for her charitable donation which helped to fund the metabolomics section of this work. In addition, this work was partly funded by the generous contribution made by the Fred A. & Barbara M. Erb Foundation. We acknowledge the Van Andel Research Institute and the many individuals and corporations that financially support research into neurodegenerative disease at the Institute. N.L.R. is supported by the Peter C. and Emajean Cook Foundation. P.B. is supported by grants from the National Institutes of Health (1R01DC016519-01 and 5R21NS093993-02). P.B. reports additional grants from Office of the Assistant Secretary of Defense for Health Affairs (Parkinson’s Research Program, Award No. W81XWH-17-1-0534), The Michael J Fox Foundation, National Institutes of Health, Cure Parkinson’s Trust, which are outside but relevant to the submitted work.
Conflicts of Interest
P.B. has received commercial support as a consultant from Renovo Neural, Inc., Fujifilm-Cellular Dynamics, Axial Biotherapeutics, Roche, Teva Inc., Lundbeck A/S, NeuroDerm, AbbVie, ClearView Healthcare, FCB Health, IOS Press Partners and Capital Technologies, Inc. He is conducting sponsored research on behalf of Roche and Lundbeck A/S. He has ownership interests in Acousort AB, Lund, Sweden. The other authors declare no conflict of interest.
References
- De Lau, L.M.; Breteler, M.M. Epidemiology of Parkinson’s disease. Lancet Neurol. 2006, 5, 525–535. [Google Scholar] [CrossRef]
- Kalia, L.V.; Lang, A.E. Parkinson’s disease. Lancet 2015, 386, 896–912. [Google Scholar] [CrossRef]
- Tysnes, O.-B.; Storstein, A. Epidemiology of Parkinson’s disease. J. Neural Transm. 2017, 124, 901–905. [Google Scholar] [CrossRef] [PubMed]
- Schapira, A.H.V.; Chaudhuri, K.R.; Jenner, P. Non-motor features of Parkinson disease. Nat. Rev. Neurosci. 2017, 18, 435–450. [Google Scholar] [CrossRef] [PubMed]
- Postuma, R.B.; Berg, D. Advances in markers of prodromal Parkinson disease. Nat. Rev. Neurol. 2016, 12, 622–634. [Google Scholar] [CrossRef] [PubMed]
- Havelund, J.F.; Heegaard, N.H.H.; Faergeman, N.J.K.; Gramsbergen, J.B. Biomarker Research in Parkinson’s Disease Using Metabolite Profiling. Metabolites 2017, 7, 42. [Google Scholar] [CrossRef] [PubMed]
- Rey, N.L.; Steiner, J.A.; Maroof, N.; Luk, K.C.; Madaj, Z.; Trojanowski, J.Q.; Lee, V.M.-Y.; Brundin, P. Widespread transneuronal propagation of α-synucleinopathy triggered in olfactory bulb mimics prodromal Parkinson’s disease. J. Exp. Med. 2016, 213, 1759–1778. [Google Scholar] [CrossRef] [PubMed]
- Espay, A.J.; Schwarzschild, M.A.; Tanner, C.M.; Fernandez, H.H.; Simon, D.K.; Leverenz, J.B.; Merola, A.; Chen-Plotkin, A.; Brundin, P.; Erro, R.; et al. Biomarker-driven phenotyping in Parkinson’s disease: A translational missing link in disease-modifying clinical trials. Mov. Disord. Off. J. Mov. Dis. Soc. 2017, 32, 319–324. [Google Scholar] [CrossRef] [PubMed]
- Espay, A.J.; Brundin, P.; Lang, A.E. Precision medicine for disease modification in Parkinson disease. Nat. Rev. Neurol. 2017, 13, 119–126. [Google Scholar] [CrossRef] [PubMed]
- Graham, S.F.; Rey, N.L.; Yilmaz, A.; Kumar, P.; Madaj, Z.; Maddens, M.; Bahado-Singh, R.O.; Becker, K.; Schulz, E.; Meyerdirk, L.K.; et al. Biochemical Profiling of the Brain and Blood Metabolome in a Mouse Model of Prodromal Parkinson’s Disease Reveals Distinct Metabolic Profiles. J. Proteom Res. 2018, 17, 2460–2469. [Google Scholar] [CrossRef] [PubMed]
- Camilleri, M.; Gores, G.J. Therapeutic targeting of bile acids. Am. J. Phys. Gastrointest. Liver Phys. 2015, 309, G209–G215. [Google Scholar] [CrossRef] [PubMed]
- Thomas, C.; Pellicciari, R.; Pruzanski, M.; Auwerx, J.; Schoonjans, K. Targeting bile-acid signalling for metabolic diseases. Nat. Rev. Drug Dis. 2008, 7, 678–693. [Google Scholar] [CrossRef] [PubMed]
- Perino, A.; Schoonjans, K. TGR5 and Immunometabolism: Insights from Physiology and Pharmacology. Trends Pharmacol. Sci. 2015, 36, 847–857. [Google Scholar] [CrossRef] [PubMed]
- Parry, G.J.; Rodrigues, C.M.; Aranha, M.M.; Hilbert, S.J.; Davey, C.; Kelkar, P.; Low, W.C.; Steer, C.J. Safety, tolerability, and cerebrospinal fluid penetration of ursodeoxycholic Acid in patients with amyotrophic lateral sclerosis. Clin. Neuropharmacol. 2010, 33, 17–21. [Google Scholar] [CrossRef] [PubMed]
- Mano, N.; Goto, T.; Uchida, M.; Nishimura, K.; Ando, M.; Kobayashi, N.; Goto, J. Presence of protein-bound unconjugated bile acids in the cytoplasmic fraction of rat brain. J. Lipid Res. 2004, 45, 295–300. [Google Scholar] [CrossRef] [PubMed]
- Bron, B.; Waldram, R.; Silk, D.B.; Williams, R. Serum, cerebrospinal fluid, and brain levels of bile acids in patients with fulminant hepatic failure. Gut 1977, 18, 692–696. [Google Scholar] [CrossRef] [PubMed]
- Olazaran, J.; Gil-de-Gomez, L.; Rodriguez-Martin, A.; Valenti-Soler, M.; Frades-Payo, B.; Marin-Munoz, J.; Antunez, C.; Frank-Garcia, A.; Acedo-Jimenez, C.; Morlan-Gracia, L.; et al. A blood-based, 7-metabolite signature for the early diagnosis of Alzheimer’s disease. J. Alzheimer’s Dis. 2015, 45, 1157–1173. [Google Scholar] [CrossRef] [PubMed]
- Bathena, S.P.; Mukherjee, S.; Olivera, M.; Alnouti, Y. The profile of bile acids and their sulfate metabolites in human urine and serum. J. Chromatogr. B Anal. Technol. Biomed. Life Sci. 2013, 942–943, 53–62. [Google Scholar] [CrossRef] [PubMed]
- Abdelkader, N.F.; Safar, M.M.; Salem, H.A. Ursodeoxycholic Acid Ameliorates Apoptotic Cascade in the Rotenone Model of Parkinson’s Disease: Modulation of Mitochondrial Perturbations. Mol. Neurobiol. 2016, 53, 810–817. [Google Scholar] [CrossRef] [PubMed]
- Theofilopoulos, S.; Wang, Y.; Kitambi, S.S.; Sacchetti, P.; Sousa, K.M.; Bodin, K.; Kirk, J.; Salto, C.; Gustafsson, M.; Toledo, E.M.; et al. Brain endogenous liver X receptor ligands selectively promote midbrain neurogenesis. Nat. Chem. Biol. 2013, 9, 126–133. [Google Scholar] [CrossRef] [PubMed]
- Marksteiner, J.; Blasko, I.; Kemmler, G.; Koal, T.; Humpel, C. Bile acid quantification of 20 plasma metabolites identifies lithocholic acid as a putative biomarker in Alzheimer’s disease. Metabolomics 2018, 14, 1. [Google Scholar] [CrossRef] [PubMed]
- Pan, X.; Elliott, C.T.; McGuinness, B.; Passmore, P.; Kehoe, P.G.; Holscher, C.; McClean, P.L.; Graham, S.F.; Green, B.D. Metabolomic Profiling of Bile Acids in Clinical and Experimental Samples of Alzheimer’s Disease. Metabolites 2017, 7, 28. [Google Scholar] [CrossRef] [PubMed]
- Braak, H.; Ghebremedhin, E.; Rub, U.; Bratzke, H.; Del Tredici, K. Stages in the development of Parkinson’s disease-related pathology. Cell Tissue Res. 2004, 318, 121–134. [Google Scholar] [CrossRef] [PubMed]
- MahmoudianDehkordi, S.; Arnold, M.; Nho, K.; Ahmad, S.; Jia, W.; Xie, G.; Louie, G.; Kueider-Paisley, A.; Moseley, M.A.; Thompson, J.W.; et al. Altered bile acid profile associates with cognitive impairment in Alzheimer’s disease-An emerging role for gut microbiome. Alzheimer’s Dement. J. Alzheimer’s Assoc. 2018. [Google Scholar] [CrossRef] [PubMed]
- Braak, H.; Del Tredici, K. Neuropathological Staging of Brain Pathology in Sporadic Parkinson’s disease: Separating the Wheat from the Chaff. J. Parkinson’s Dis. 2017, 7, S71–S85. [Google Scholar] [CrossRef] [PubMed]
- Beach, T.G.; White, C.L., 3rd; Hladik, C.L.; Sabbagh, M.N.; Connor, D.J.; Shill, H.A.; Sue, L.I.; Sasse, J.; Bachalakuri, J.; Henry-Watson, J.; et al. Olfactory bulb alpha-synucleinopathy has high specificity and sensitivity for Lewy body disorders. Acta Neuropathol. 2009, 117, 169–174. [Google Scholar] [CrossRef] [PubMed]
- Beach, T.G.; Adler, C.H.; Lue, L.; Sue, L.I.; Bachalakuri, J.; Henry-Watson, J.; Sasse, J.; Boyer, S.; Shirohi, S.; Brooks, R.; et al. Unified staging system for Lewy body disorders: Correlation with nigrostriatal degeneration, cognitive impairment and motor dysfunction. Acta Neuropathol. 2009, 117, 613–634. [Google Scholar] [CrossRef] [PubMed]
- Liu, Y.; Rong, Z.; Xiang, D.; Zhang, C.; Liu, D. Detection technologies and metabolic profiling of bile acids: A comprehensive review. Lipid Health Dis. 2018, 17, 121. [Google Scholar] [CrossRef] [PubMed]
- Lieu, T.; Jayaweera, G.; Bunnett, N.W. GPBA: A GPCR for bile acids and an emerging therapeutic target for disorders of digestion and sensation. Br. J. Pharmacol. 2014, 171, 1156–1166. [Google Scholar] [CrossRef] [PubMed]
- Hofmann, A.F. The continuing importance of bile acids in liver and intestinal disease. Arch. Int. Med. 1999, 159, 2647–2658. [Google Scholar] [CrossRef]
- Benedetti, A.; Alvaro, D.; Bassotti, C.; Gigliozzi, A.; Ferretti, G.; La Rosa, T.; Di Sario, A.; Baiocchi, L.; Jezequel, A.M. Cytotoxicity of bile salts against biliary epithelium: A study in isolated bile ductule fragments and isolated perfused rat liver. Hepatology 1997, 26, 9–21. [Google Scholar] [CrossRef] [PubMed]
- Mello-Vieira, J.; Sousa, T.; Coutinho, A.; Fedorov, A.; Lucas, S.D.; Moreira, R.; Castro, R.E.; Rodrigues, C.M.; Prieto, M.; Fernandes, F. Cytotoxic bile acids, but not cytoprotective species, inhibit the ordering effect of cholesterol in model membranes at physiologically active concentrations. Biochim. Biophys. Acta 2013, 1828, 2152–2163. [Google Scholar] [CrossRef] [PubMed]
- Geier, A.; Wagner, M.; Dietrich, C.G.; Trauner, M. Principles of hepatic organic anion transporter regulation during cholestasis, inflammation and liver regeneration. Biochim. Biophys. Acta 2007, 1773, 283–308. [Google Scholar] [CrossRef] [PubMed]
- Cortez, L.M.; Campeau, J.; Norman, G.; Kalayil, M.; Van der Merwe, J.; McKenzie, D.; Sim, V.L. Bile Acids Reduce Prion Conversion, Reduce Neuronal Loss, and Prolong Male Survival in Models of Prion Disease. J. Virol. 2015, 89, 7660–7672. [Google Scholar] [CrossRef] [PubMed]
- Rodrigues, C.M.; Fan, G.; Wong, P.Y.; Kren, B.T.; Steer, C.J. Ursodeoxycholic acid may inhibit deoxycholic acid-induced apoptosis by modulating mitochondrial transmembrane potential and reactive oxygen species production. Mol. Med. 1998, 4, 165–178. [Google Scholar] [CrossRef] [PubMed]
- Rodrigues, C.M.; Sola, S.; Sharpe, J.C.; Moura, J.J.; Steer, C.J. Tauroursodeoxycholic acid prevents Bax-induced membrane perturbation and cytochrome C release in isolated mitochondria. Biochemistry 2003, 42, 3070–3080. [Google Scholar] [CrossRef] [PubMed]
- Rodrigues, C.M.; Fan, G.; Ma, X.; Kren, B.T.; Steer, C.J. A novel role for ursodeoxycholic acid in inhibiting apoptosis by modulating mitochondrial membrane perturbation. J. Clin. Investig. 1998, 101, 2790–2799. [Google Scholar] [CrossRef] [PubMed]
- Cryan, J.F.; O’Mahony, S.M. The microbiome-gut-brain axis: From bowel to behavior. Neurogastroenterol. Motil. 2011, 23, 187–192. [Google Scholar] [CrossRef] [PubMed]
- Rey, N.L.; George, S.; Steiner, J.A.; Madaj, Z.; Luk, K.C.; Trojanowski, J.Q.; Lee, V.M.-Y.; Brundin, P. Spread of aggregates after olfactory bulb injection of α-synuclein fibrils is associated with early neuronal loss and is reduced long term. Acta Neuropathol. 2018, 135, 65–83. [Google Scholar] [CrossRef] [PubMed]
- Rey, N.L.; Petit, G.H.; Bousset, L.; Melki, R.; Brundin, P. Transfer of human alpha-synuclein from the olfactory bulb to interconnected brain regions in mice. Acta Neuropathol. 2013, 126, 555–573. [Google Scholar] [CrossRef] [PubMed]
- Xia, J.; Sinelnikov, I.V.; Han, B.; Wishart, D.S. MetaboAnalyst 3.0—Making metabolomics more meaningful. Nucleic Acid Res. 2015, 43, W251–W257. [Google Scholar] [CrossRef] [PubMed]
- Tibshirani, R. Regression Shrinkage and Selection via the Lasso. J. R. Stat. Soc. Ser. B 1996, 58, 267–288. [Google Scholar]
- Xia, J.; Psychogios, N.; Young, N.; Wishart, D.S. MetaboAnalyst: A web server for metabolomic data analysis and interpretation. Nucleic Acid Res. 2009, 37, W652–W660. [Google Scholar] [CrossRef] [PubMed]


© 2018 by the authors. Licensee MDPI, Basel, Switzerland. This article is an open access article distributed under the terms and conditions of the Creative Commons Attribution (CC BY) license (http://creativecommons.org/licenses/by/4.0/).