Incremental Prognostic Value of Albumin-Anchored Inflammatory Ratios Beyond a SOFA-Based Model in a Medical ICU: A Retrospective Cohort Study
 , ,
, ,
Abstract
1. Introduction
2. Materials and Methods
2.1. Study Design and Setting
2.2. Participants
2.3. Variables and Definitions
2.4. Data Sources and Measurement
2.5. Bias
2.6. Study Size
2.7. Quantitative Variables
2.8. Statistical Analysis
2.9. Analysis of Cohort Selection
3. Results
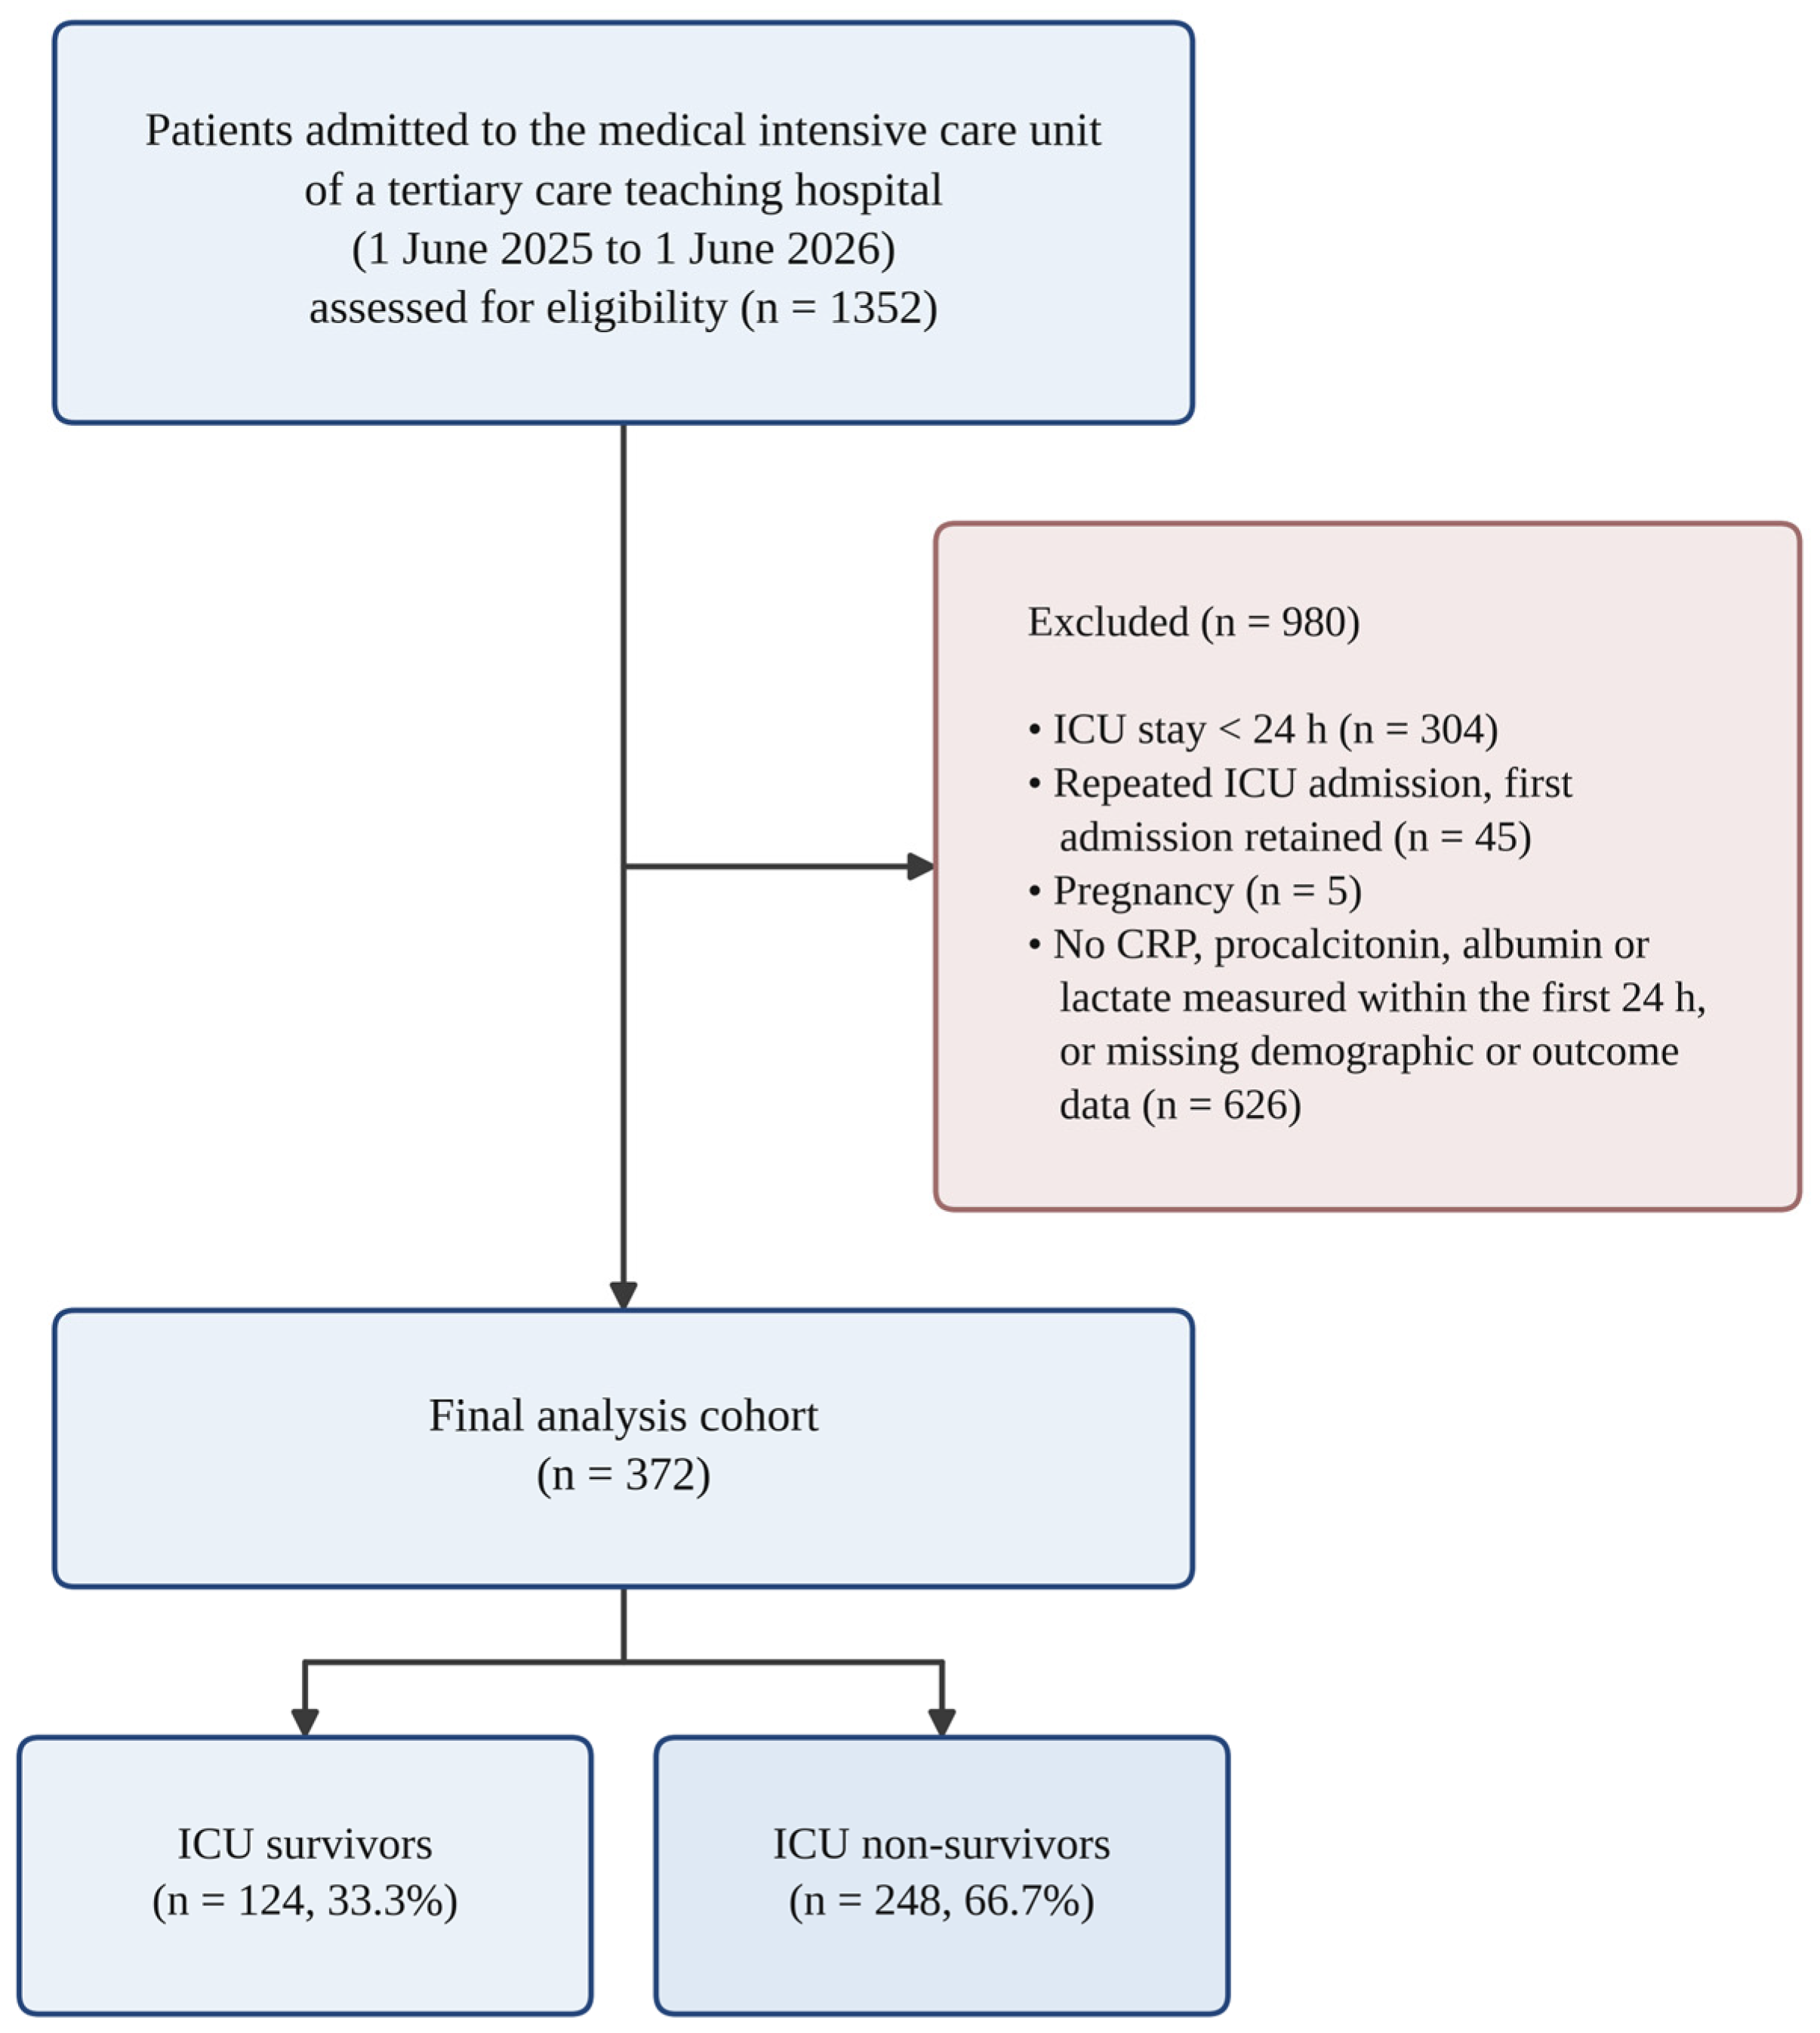
3.1. Participants and Descriptive Data
3.2. Discrimination of Individual Predictors
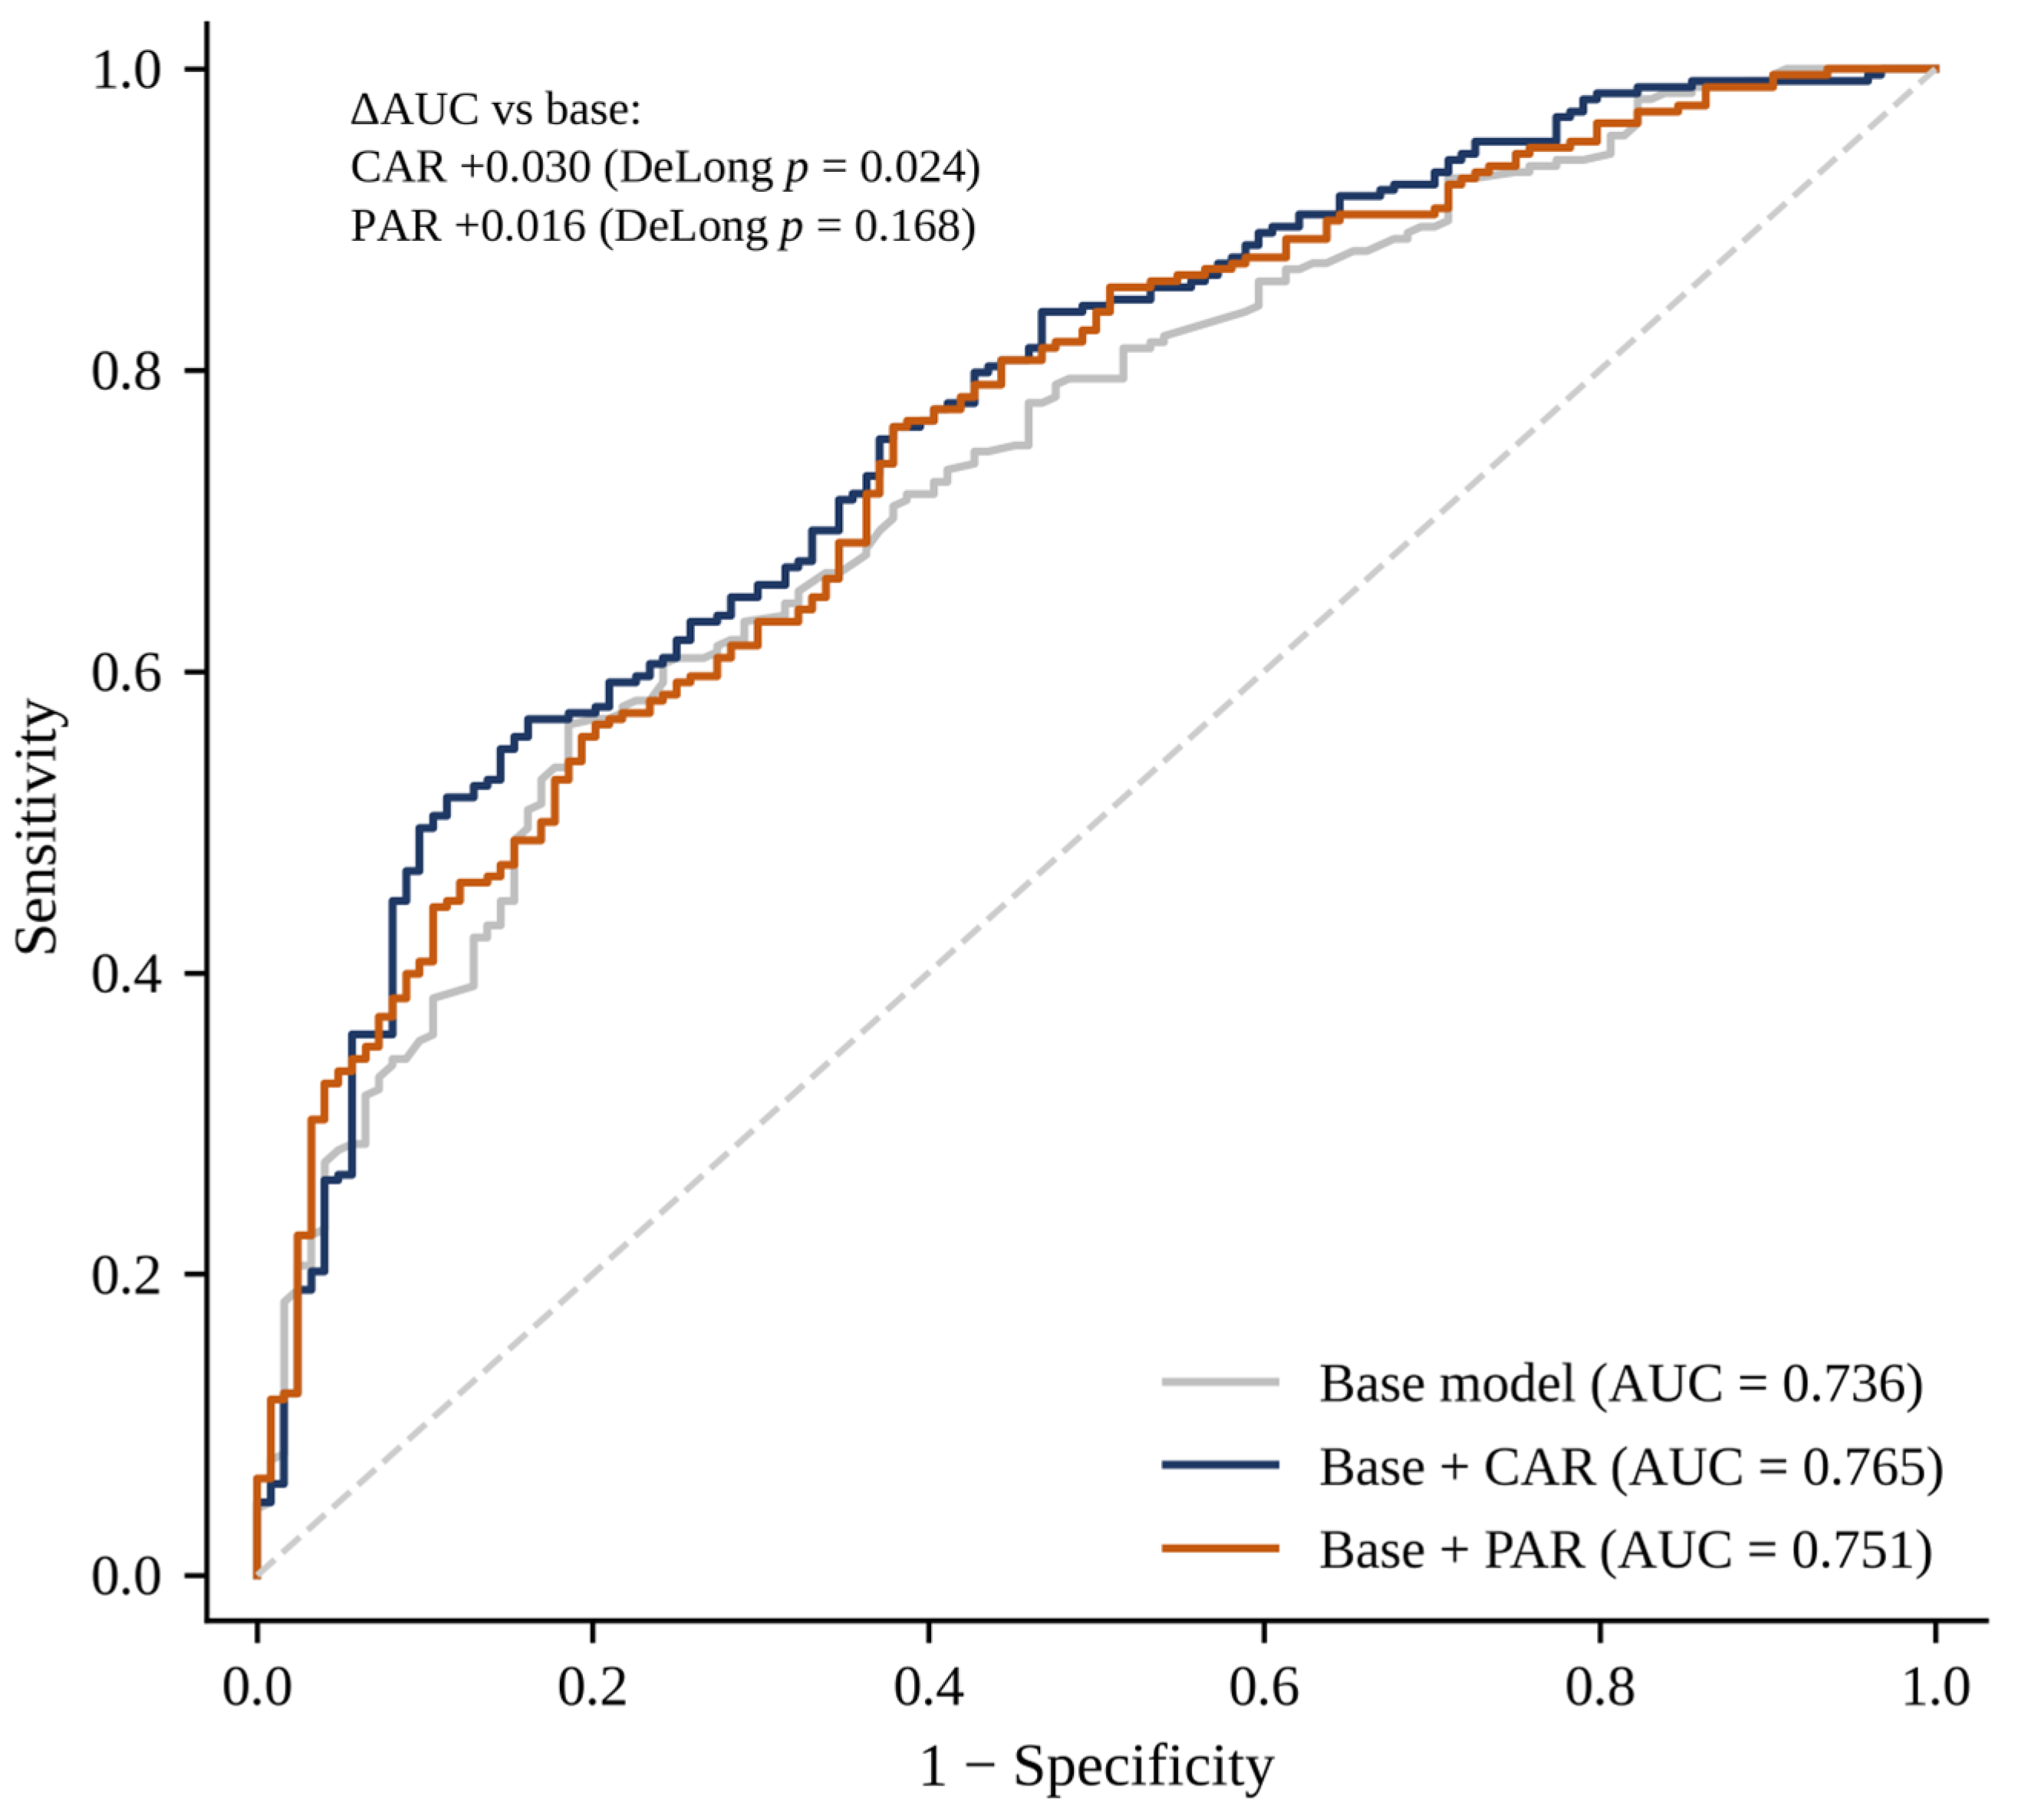
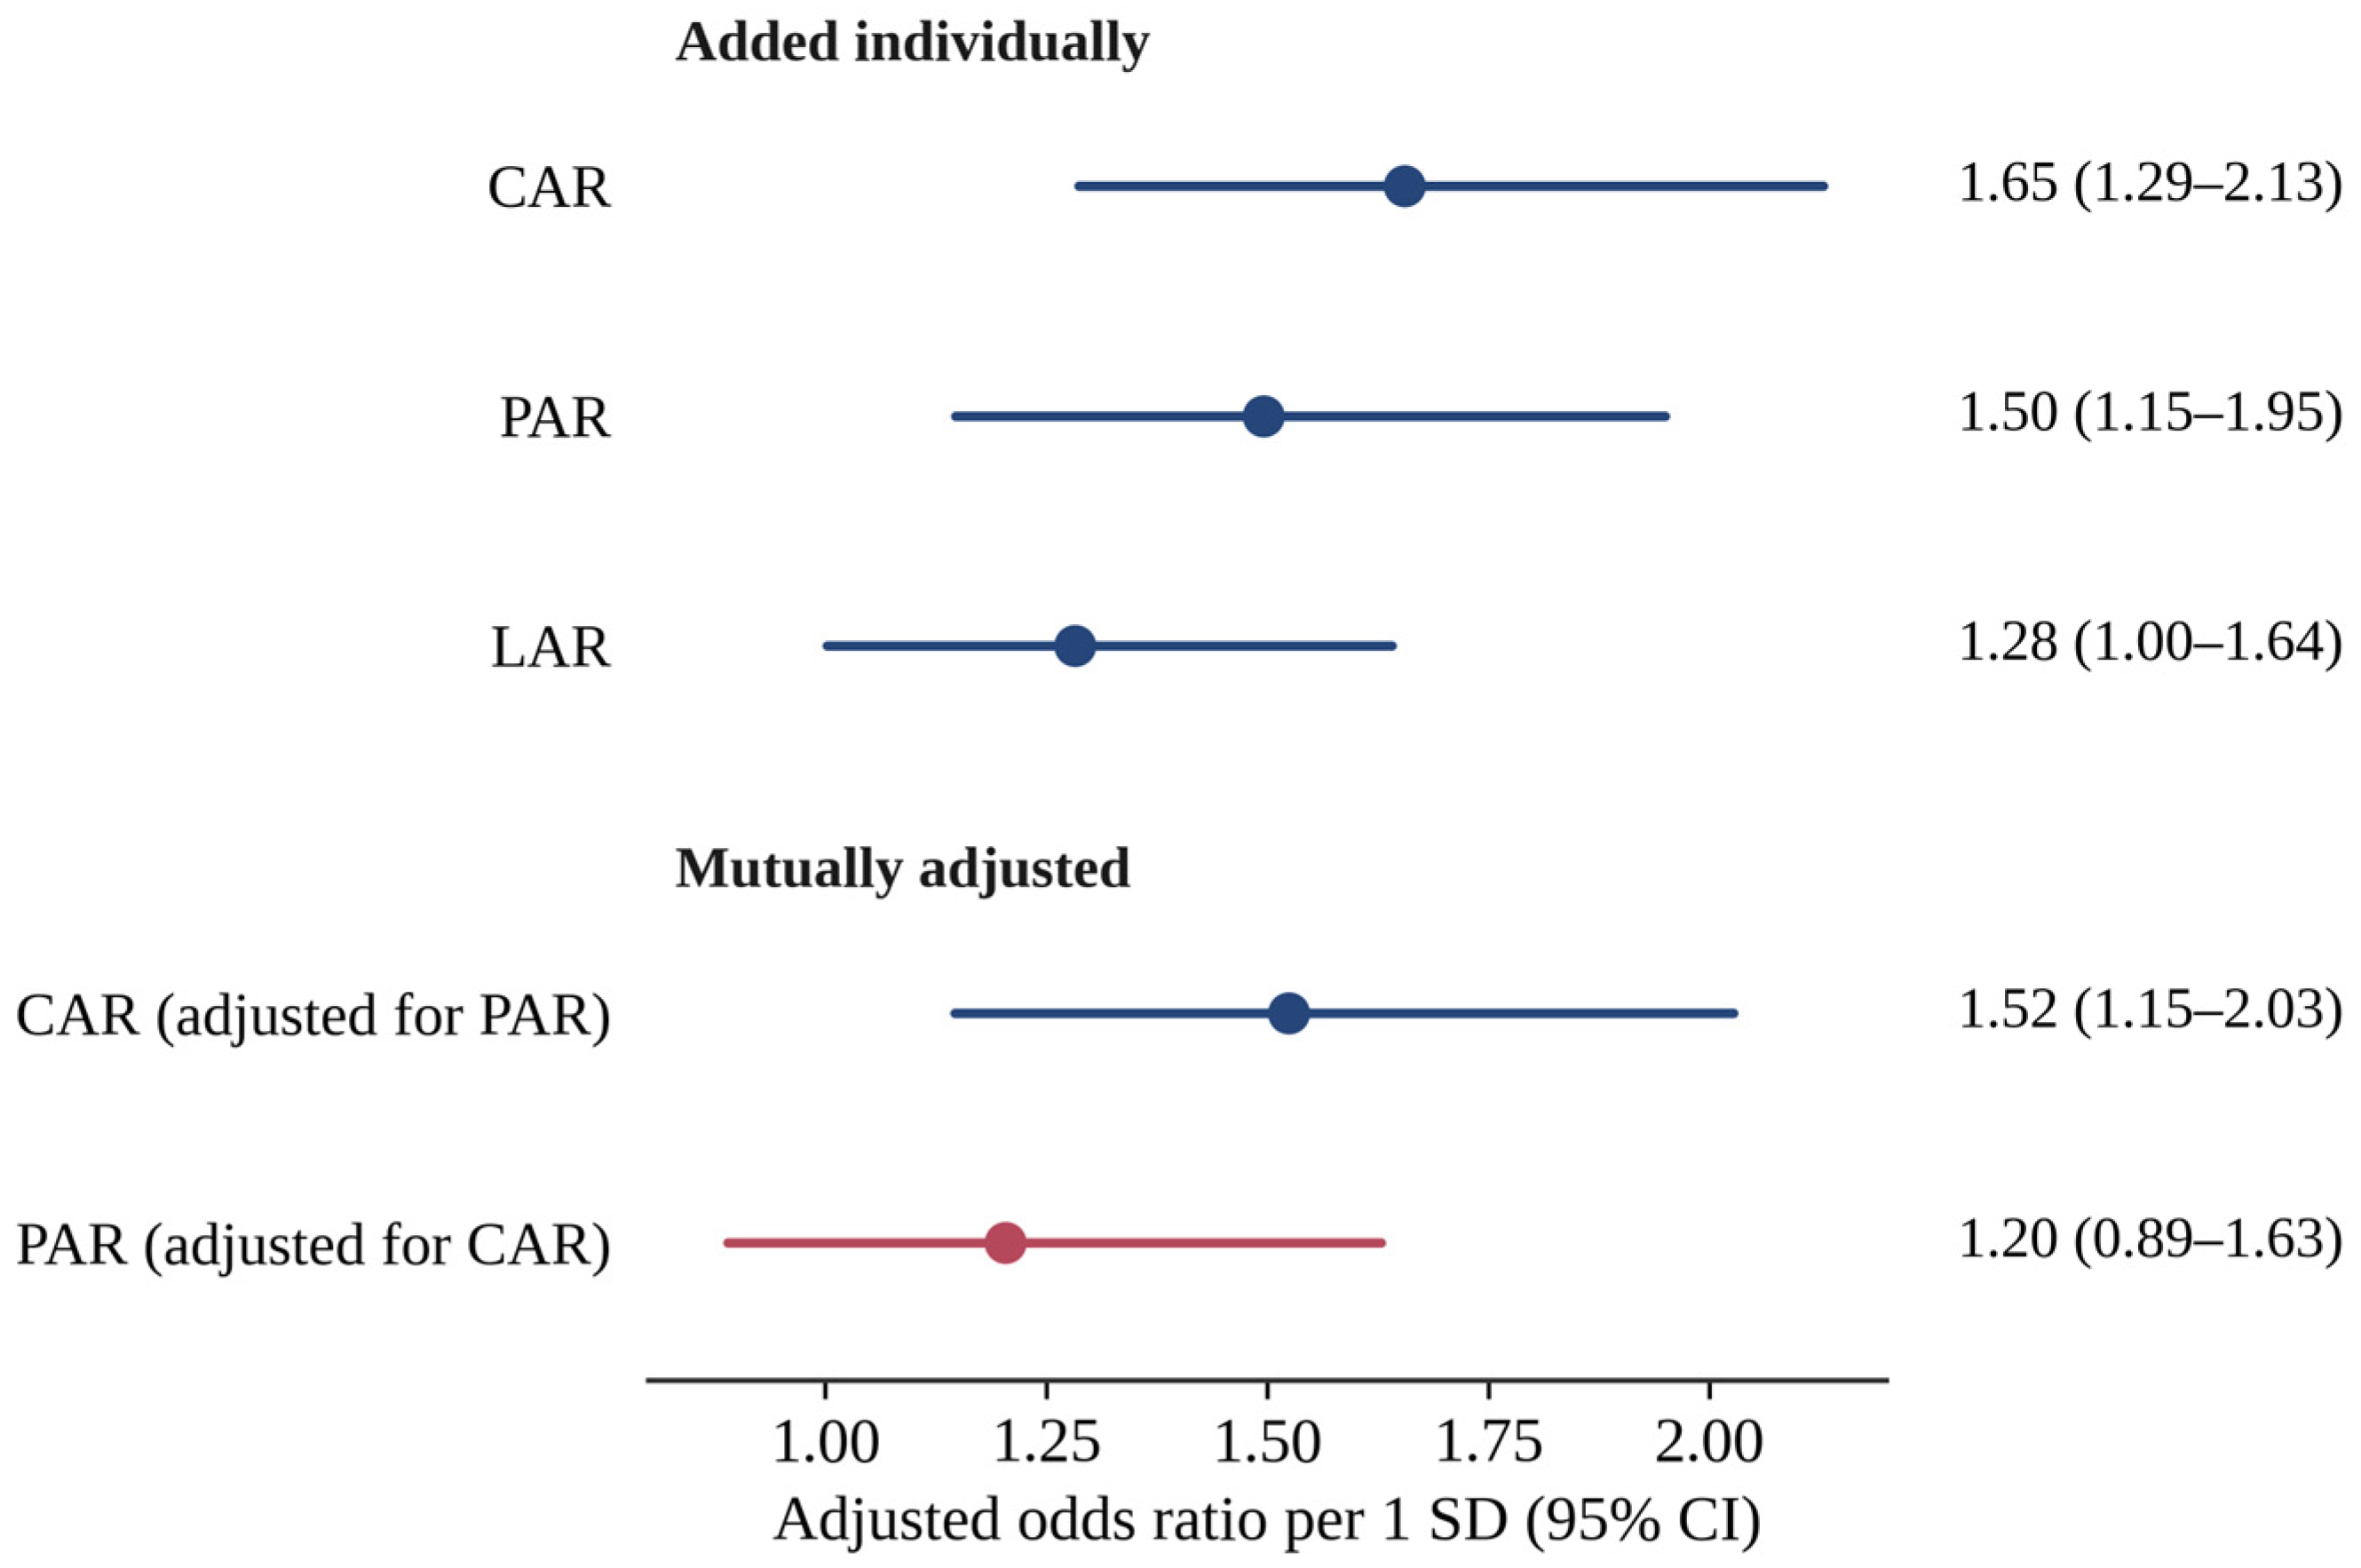
3.3. Incremental Value over the Base Model
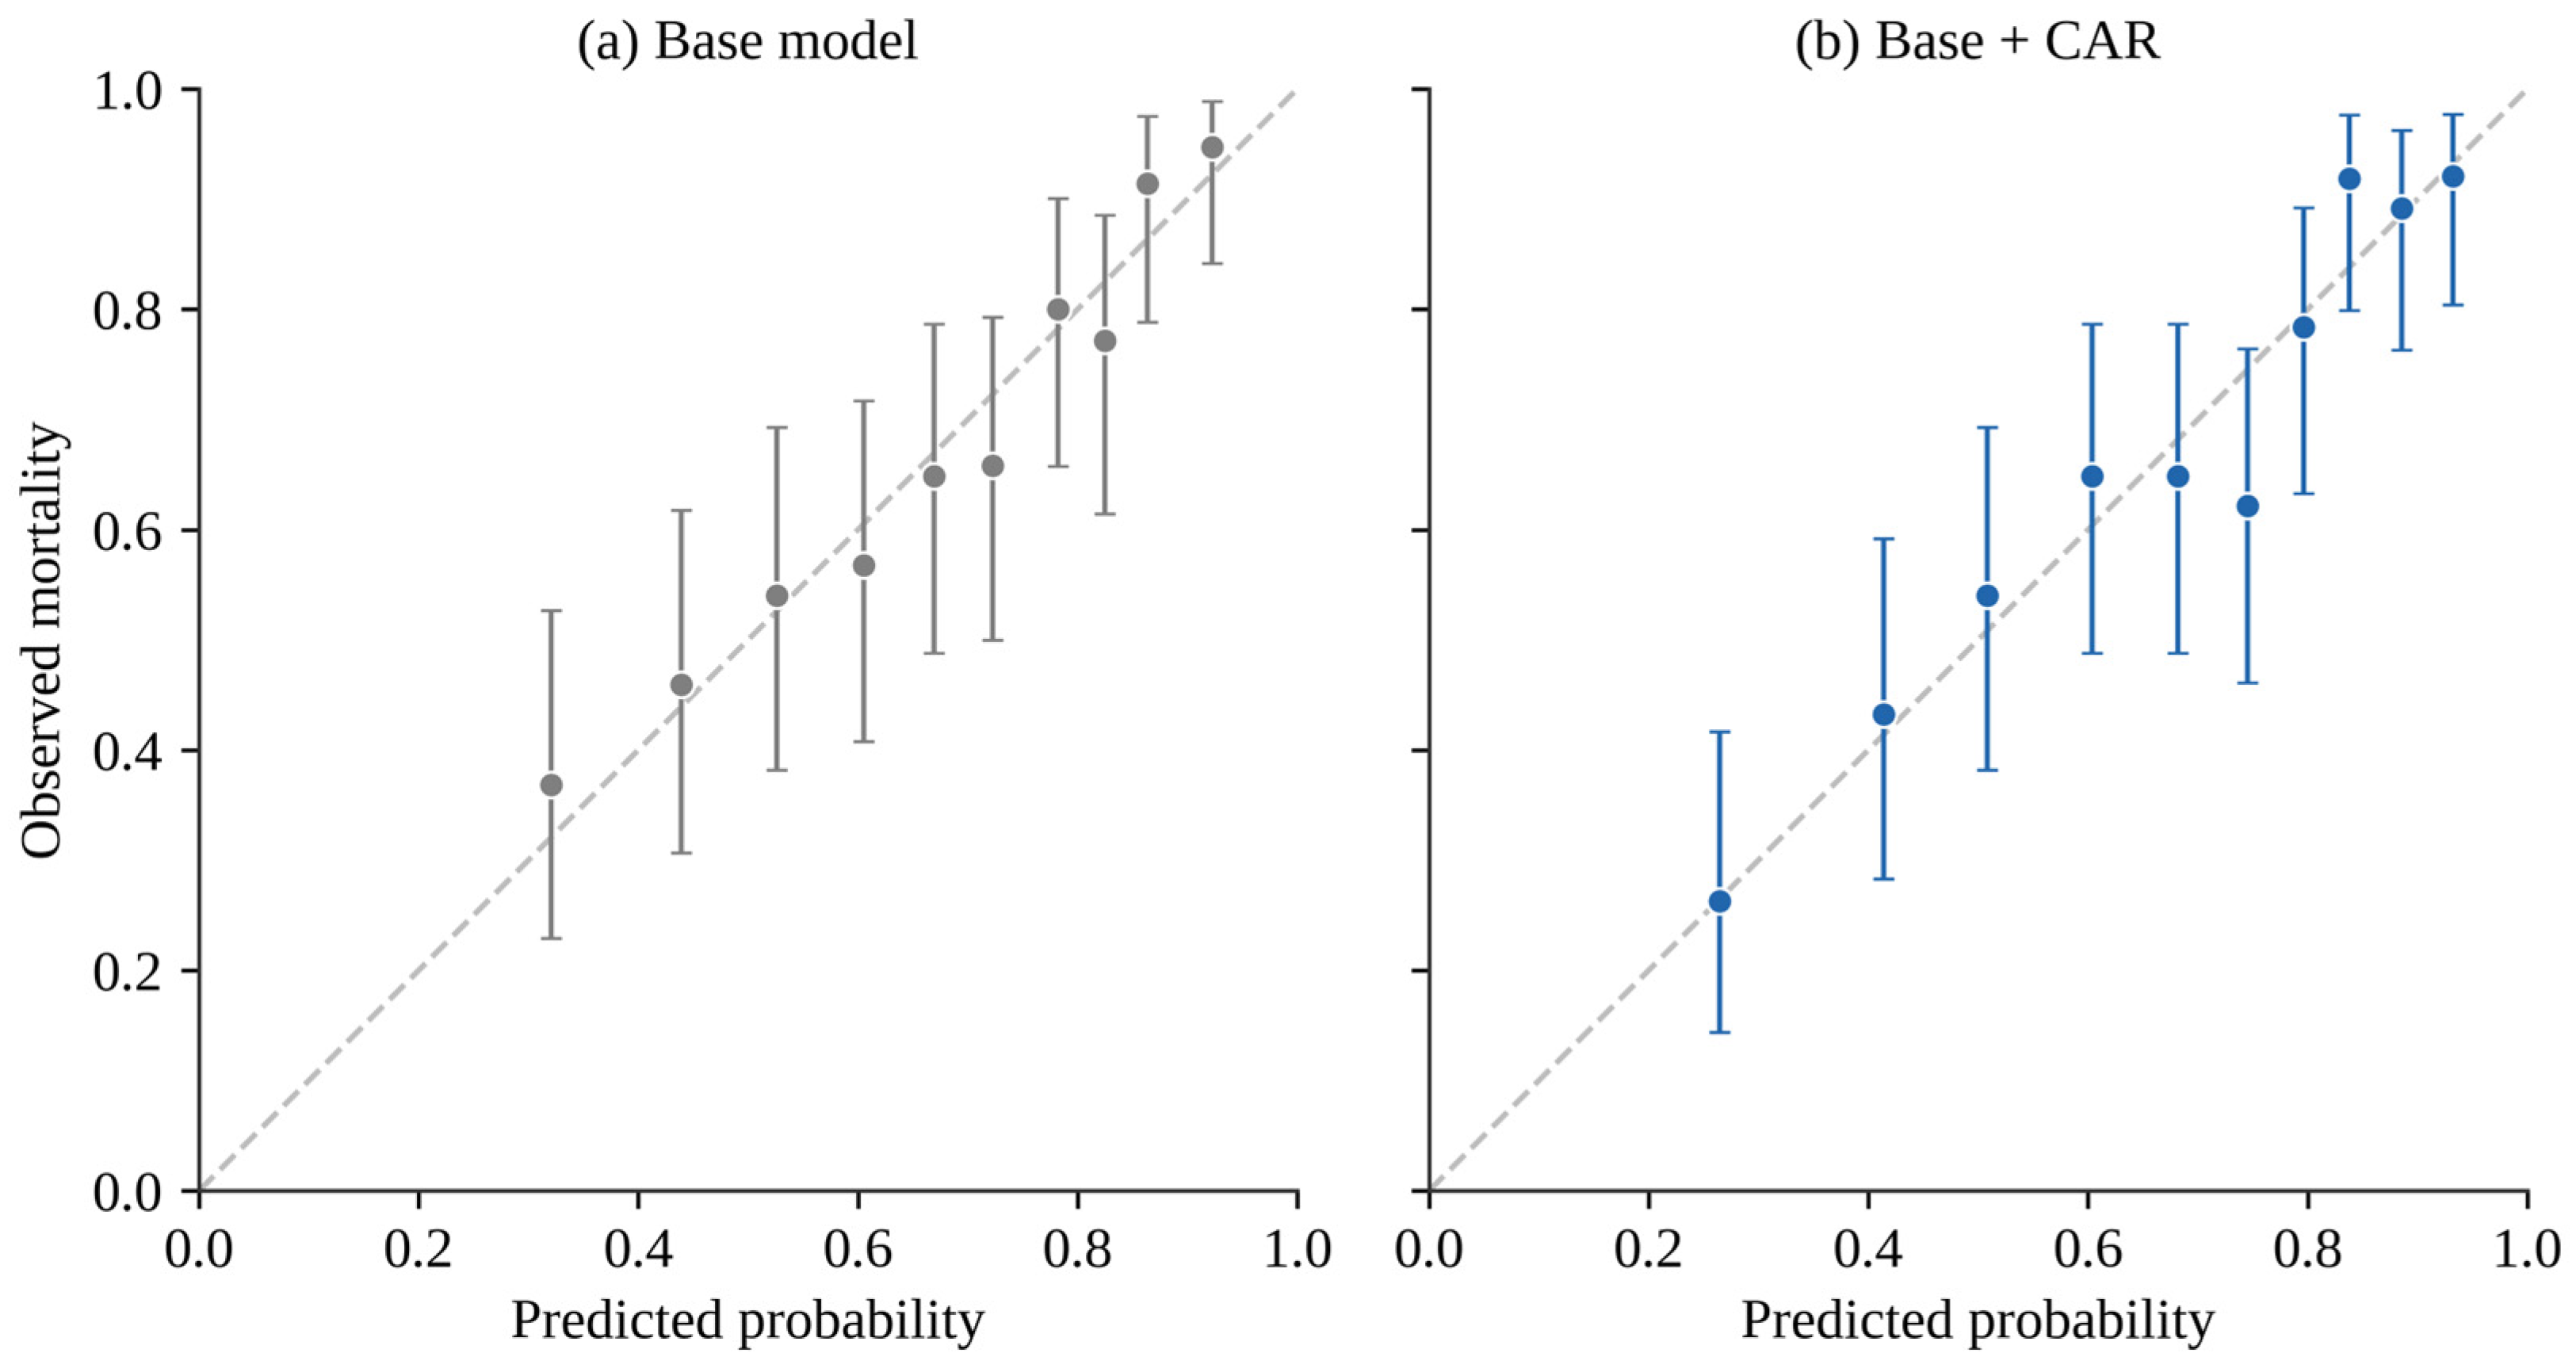
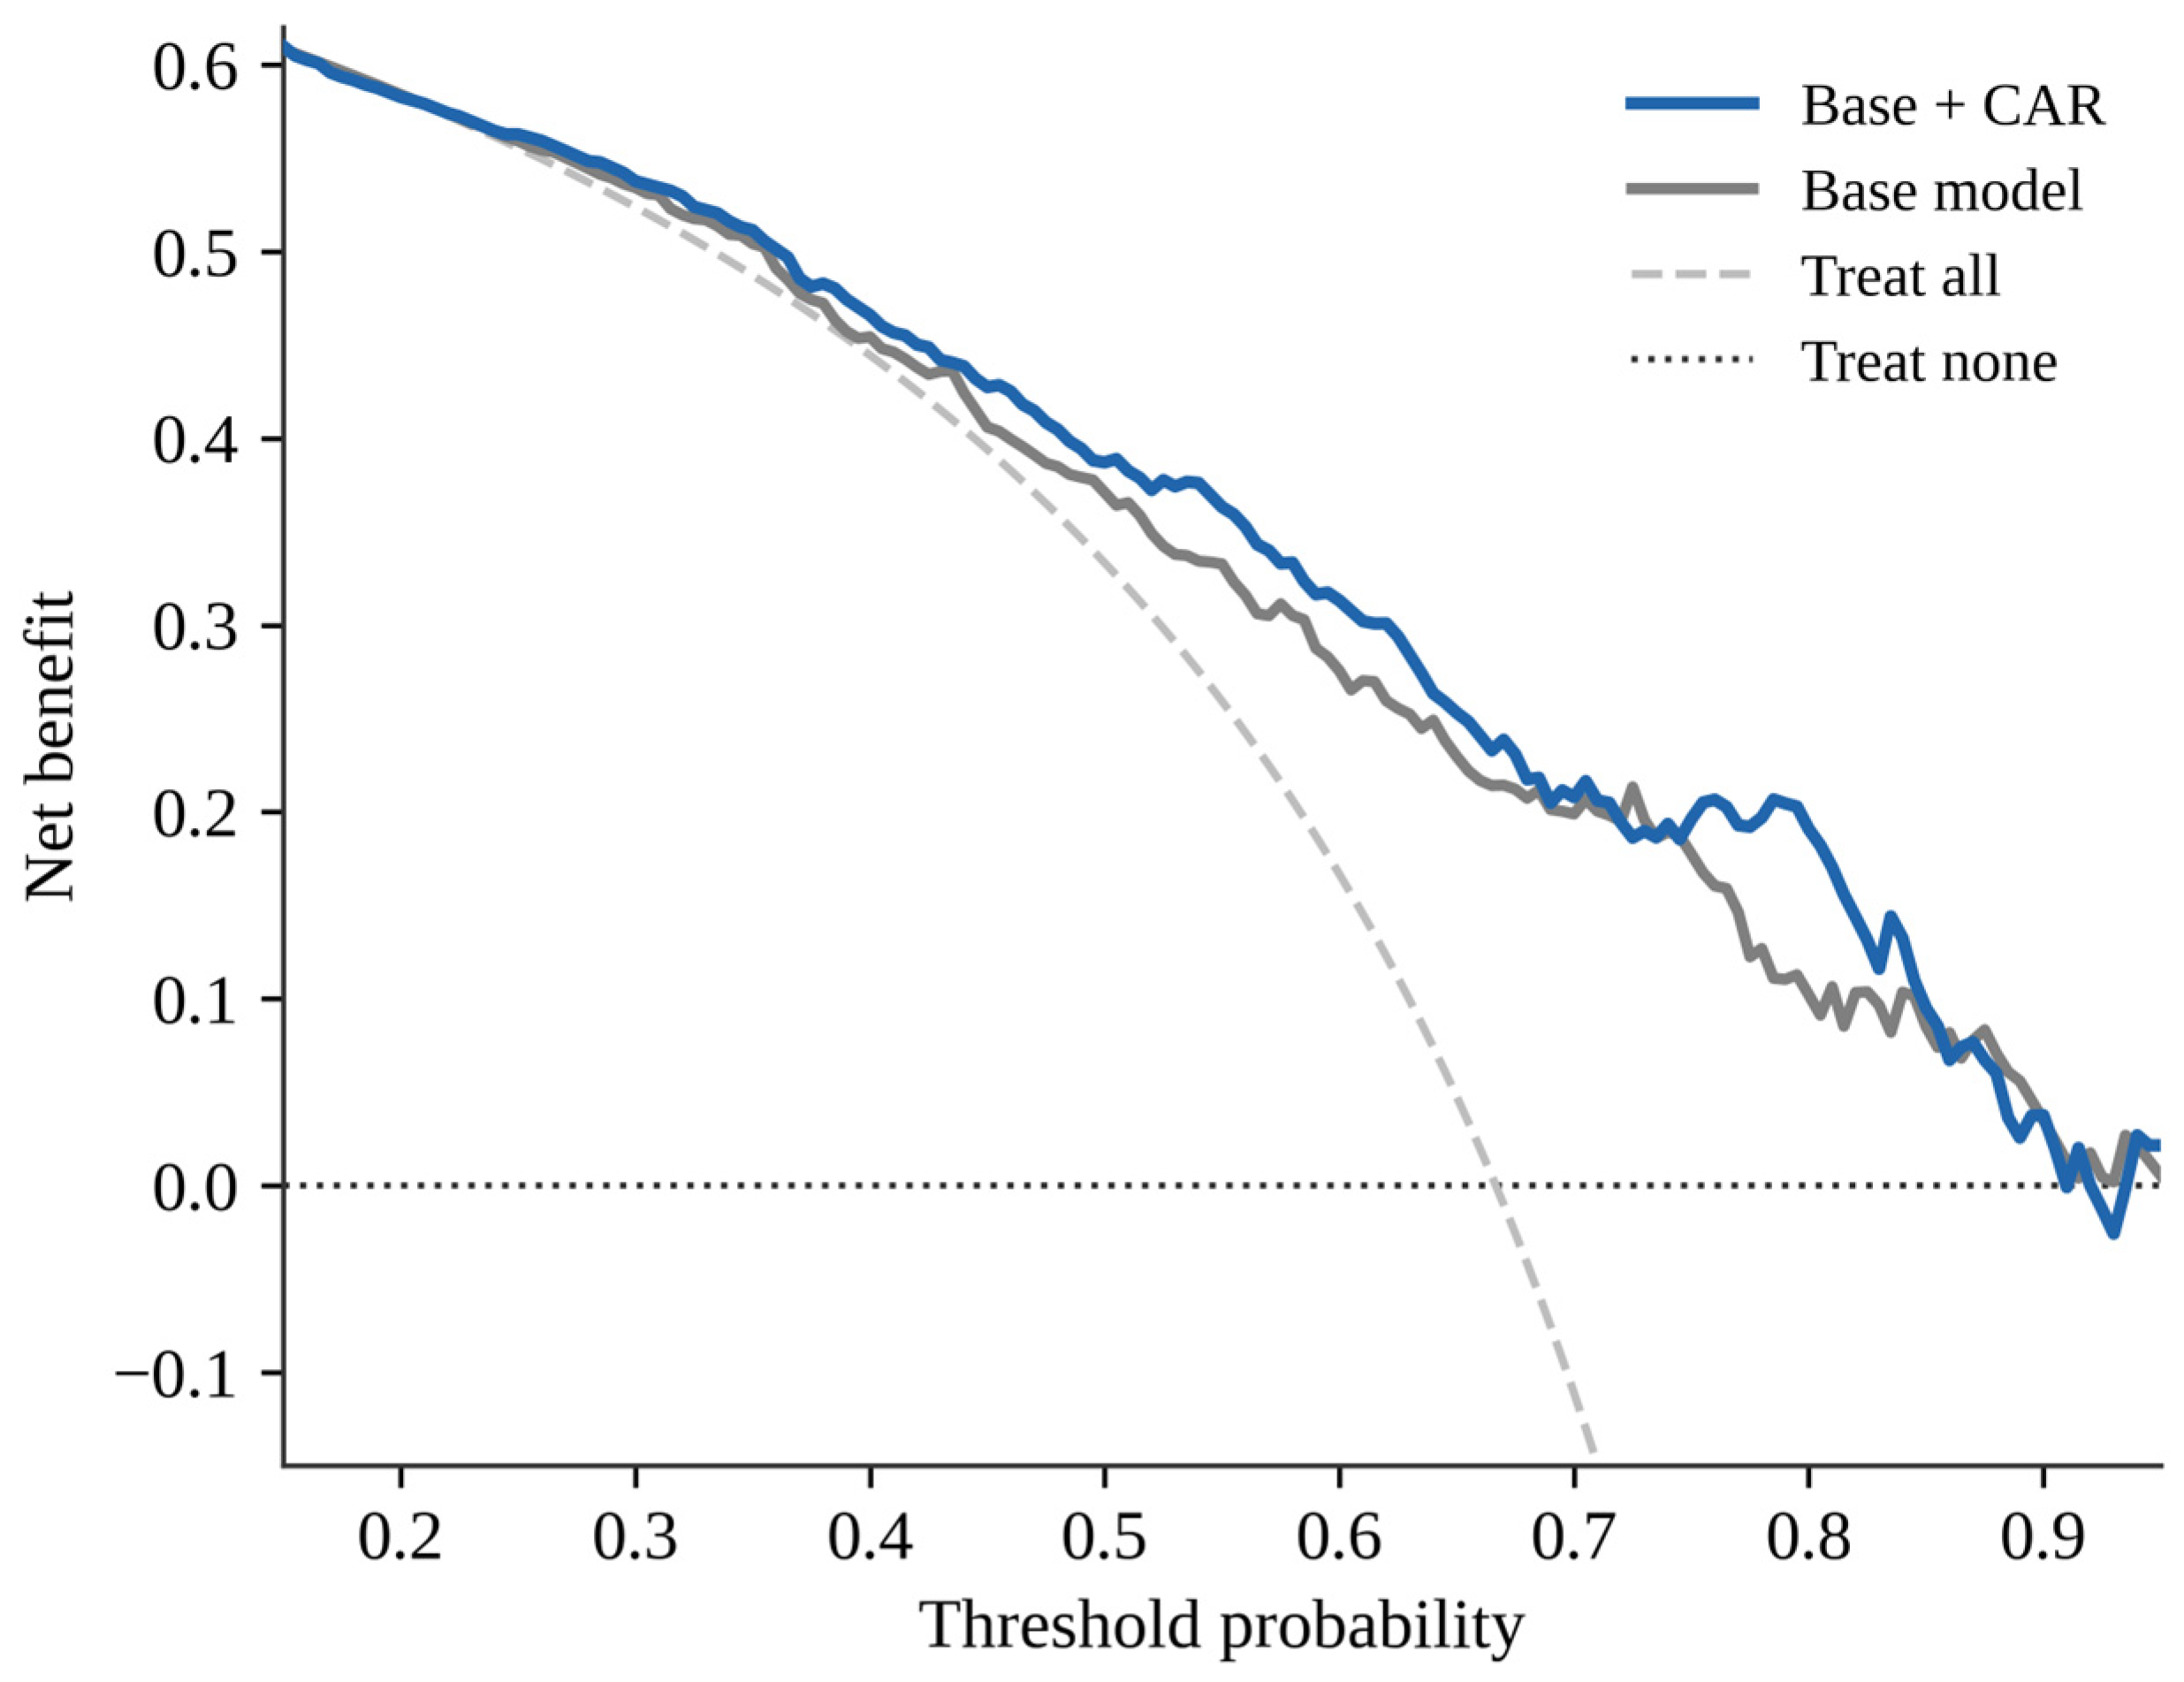
3.4. Net Benefit and Calibration
3.5. Exploratory Cut-Offs and Classification Performance
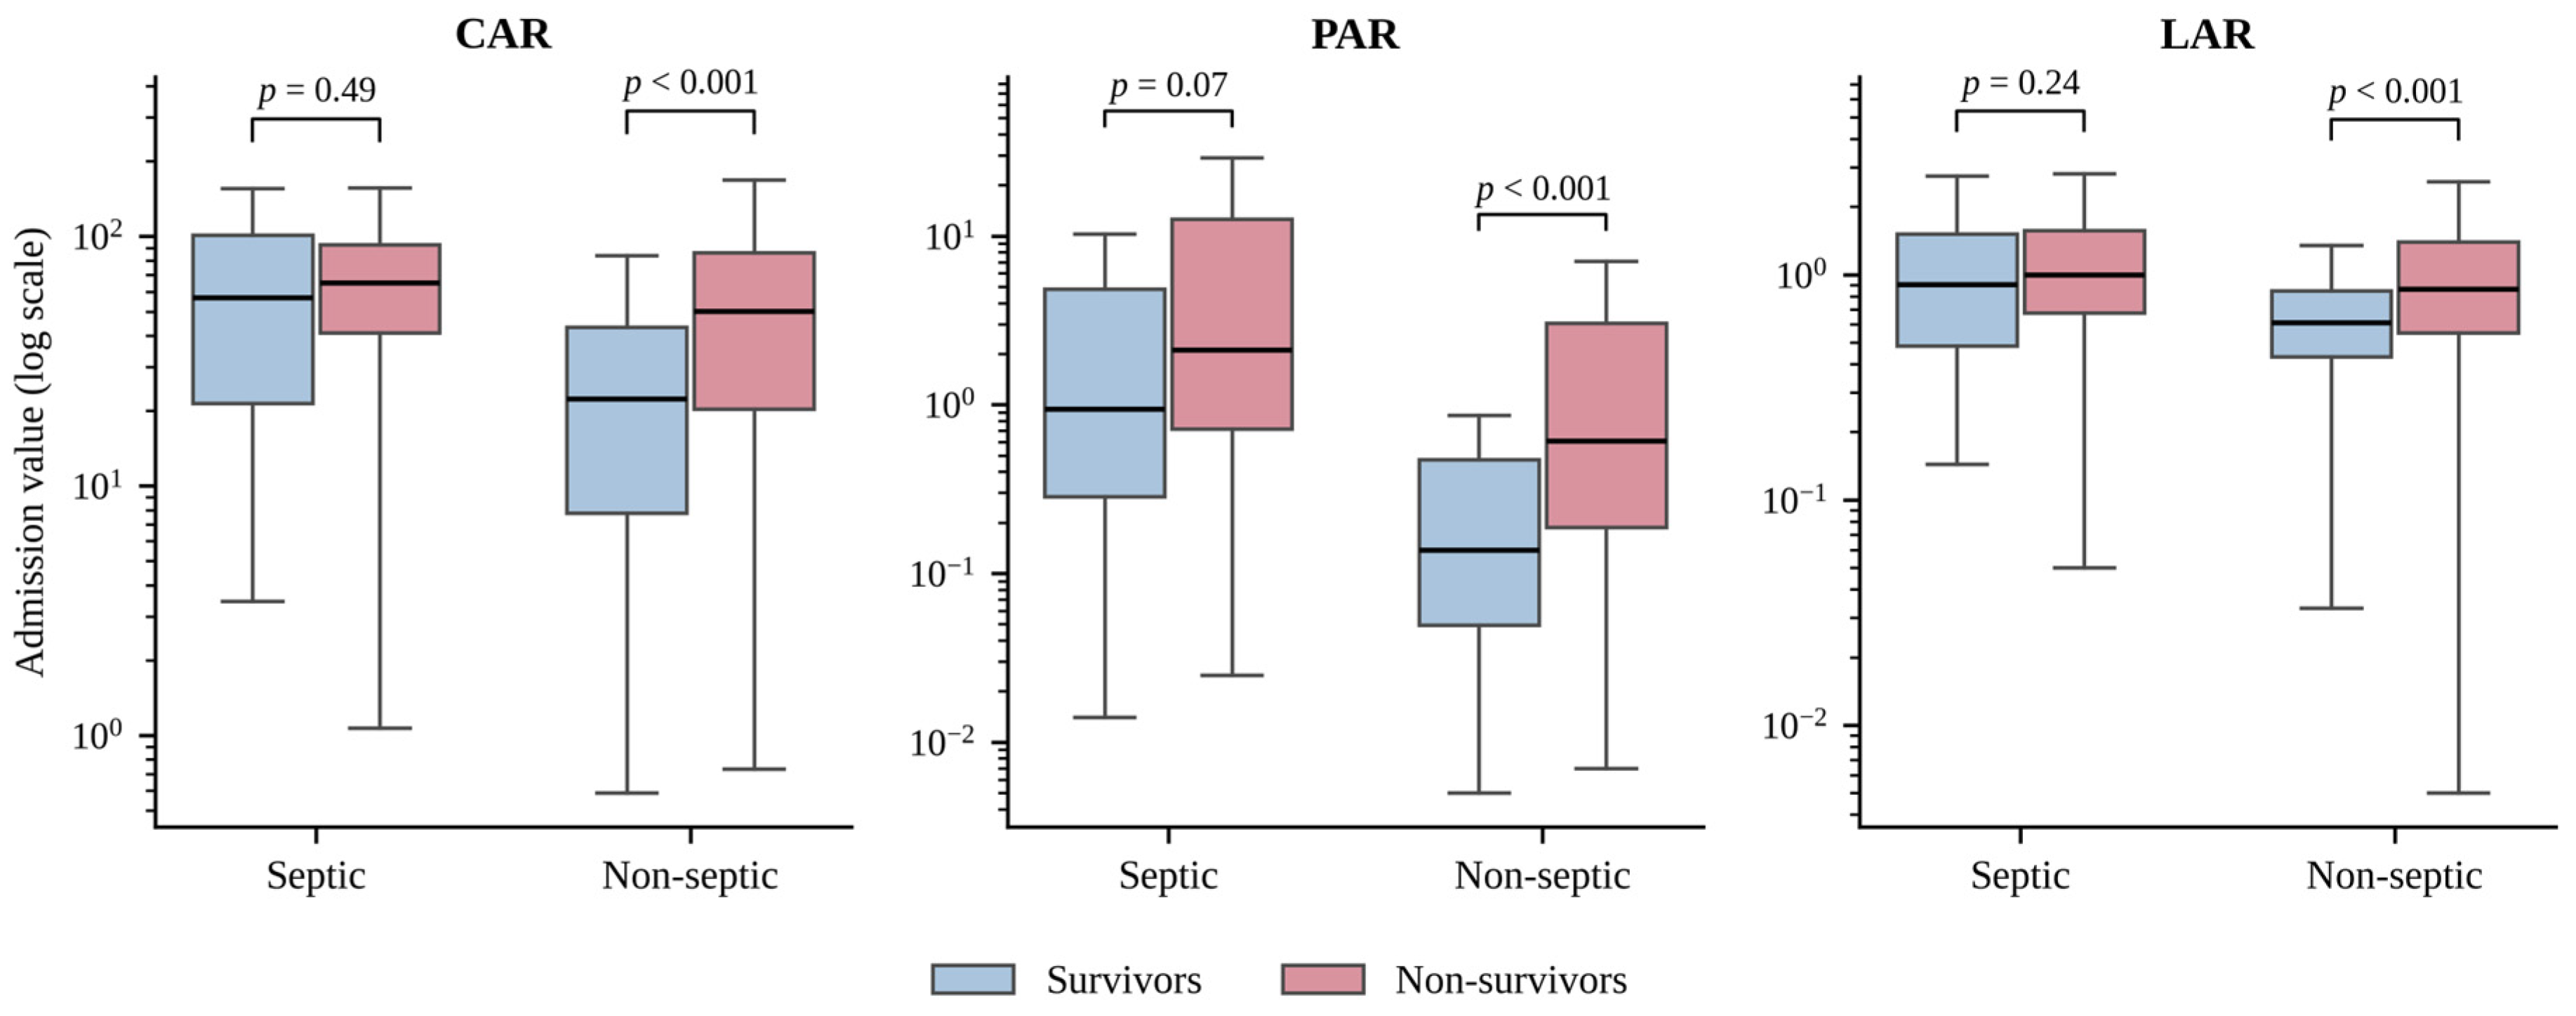
3.6. Septic Versus Non-Septic Subgroups
3.7. Sensitivity and Interaction Analyses
3.8. Cohort Selection and Selection-Weighted Sensitivity Analysis
4. Discussion
4.1. Strengths and Limitations
4.2. Generalisability and Scope of Inference
5. Conclusions
Author Contributions
Funding
Institutional Review Board Statement
Informed Consent Statement
Data Availability Statement
Acknowledgments
Conflicts of Interest
Abbreviations
| AUC | area under the receiver-operating-characteristic curve |
| CAR | C-reactive protein-to-albumin ratio |
| CCI | Charlson Comorbidity Index |
| CI | confidence interval |
| CRP | C-reactive protein |
| ICU | intensive care unit |
| IDI | integrated discrimination improvement |
| IQR | interquartile range |
| LAR | lactate-to-albumin ratio |
| NRI | net reclassification improvement |
| PAR | procalcitonin-to-albumin ratio |
| PCT | procalcitonin |
| SD | standard deviation |
| SOFA | Sequential Organ Failure Assessment |
Appendix A

| Model and Variable | β (SE) | OR (95% CI) | p |
|---|---|---|---|
| Base model | |||
| Intercept | −1.804 (0.441) | – | <0.001 |
| SOFA score, per point | +0.242 (0.035) | 1.27 (1.19–1.36) | <0.001 |
| Male sex | −0.188 (0.242) | 0.83 (0.52–1.33) | 0.437 |
| Age-adjusted CCI, per point | +0.069 (0.040) | 1.07 (0.99–1.16) | 0.084 |
| Base + CAR | |||
| Intercept | −1.421 (0.451) | – | 0.002 |
| SOFA score, per point | +0.225 (0.036) | 1.25 (1.17–1.34) | <0.001 |
| Male sex | −0.212 (0.248) | 0.81 (0.50–1.32) | 0.394 |
| Age-adjusted CCI, per point | +0.043 (0.040) | 1.04 (0.96–1.13) | 0.291 |
| log CAR, per 1 SD | +0.504 (0.128) | 1.65 (1.29–2.13) | <0.001 |
| Base + PAR | |||
| Intercept | −1.410 (0.461) | – | 0.002 |
| SOFA score, per point | +0.202 (0.037) | 1.22 (1.14–1.32) | <0.001 |
| Male sex | −0.160 (0.245) | 0.85 (0.53–1.38) | 0.514 |
| Age-adjusted CCI, per point | +0.066 (0.040) | 1.07 (0.99–1.16) | 0.096 |
| log PAR, per 1 SD | +0.403 (0.135) | 1.50 (1.15–1.95) | 0.003 |
| Base + LAR | |||
| Intercept | −1.650 (0.447) | – | <0.001 |
| SOFA score, per point | +0.229 (0.035) | 1.26 (1.17–1.35) | <0.001 |
| Male sex | −0.180 (0.243) | 0.84 (0.52–1.35) | 0.459 |
| Age-adjusted CCI, per point | +0.064 (0.040) | 1.07 (0.99–1.15) | 0.107 |
| log LAR, per 1 SD | +0.249 (0.126) | 1.28 (1.00–1.64) | 0.048 |
| Base + CAR + PAR | |||
| Intercept | −1.307 (0.462) | – | 0.005 |
| SOFA score, per point | +0.209 (0.038) | 1.23 (1.14–1.33) | <0.001 |
| Male sex | −0.197 (0.249) | 0.82 (0.50–1.34) | 0.428 |
| Age-adjusted CCI, per point | +0.047 (0.041) | 1.05 (0.97–1.13) | 0.250 |
| log CAR, per 1 SD | +0.421 (0.145) | 1.52 (1.15–2.03) | 0.004 |
| log PAR, per 1 SD | +0.185 (0.154) | 1.20 (0.89–1.63) | 0.229 |
| Variable | β (SE) | OR (95% CI) | p |
|---|---|---|---|
| Intercept | −1.234 (0.378) | – | 0.001 |
| Age, per year | −0.004 (0.005) | 1.00 (0.99–1.01) | 0.364 |
| Male sex | −0.339 (0.147) | 0.71 (0.53–0.95) | 0.021 |
| SOFA score, per point | +0.086 (0.021) | 1.09 (1.05–1.14) | <0.001 |
| Charlson index (unadjusted), per point | +0.038 (0.029) | 1.04 (0.98–1.10) | 0.184 |
| Invasive mechanical ventilation | −0.045 (0.189) | 0.96 (0.66–1.38) | 0.813 |
| Vasopressor support | +0.918 (0.200) | 2.50 (1.69–3.70) | <0.001 |
| Renal replacement therapy | +0.176 (0.157) | 1.19 (0.88–1.62) | 0.262 |
| Admission category (reference: respiratory failure) | |||
| Cardiovascular | +1.700 (0.656) | 5.48 (1.51–19.81) | 0.010 |
| Gastrointestinal/hepatic | +0.958 (0.318) | 2.61 (1.40–4.87) | 0.003 |
| Metabolic/endocrine | +1.105 (0.767) | 3.02 (0.67–13.58) | 0.150 |
| Neurologic | +0.590 (0.555) | 1.80 (0.61–5.35) | 0.287 |
| Other | +1.262 (0.435) | 3.53 (1.50–8.29) | 0.004 |
| Postoperative/trauma | +0.762 (0.497) | 2.14 (0.81–5.67) | 0.125 |
| Sepsis | −1.256 (0.171) | 0.28 (0.20–0.40) | <0.001 |
| Covariate | SMD Before Weighting | SMD After Weighting | Balanced (|SMD| < 0.10) |
|---|---|---|---|
| Age | −0.043 | −0.048 | Yes |
| Male sex | −0.084 | +0.030 | Yes |
| SOFA score | +0.218 | −0.022 | Yes |
| Charlson index (unadjusted) | +0.095 | +0.008 | Yes |
| Invasive mechanical ventilation | +0.108 | −0.114 | No |
| Vasopressor support | +0.220 | −0.053 | Yes |
| Renal replacement therapy | +0.111 | +0.016 | Yes |
| Admission category | |||
| Cardiovascular | +0.150 | −0.005 | Yes |
| Gastrointestinal/hepatic | +0.149 | −0.003 | Yes |
| Metabolic/endocrine | +0.053 | −0.003 | Yes |
| Neurologic | +0.048 | −0.004 | Yes |
| Other | +0.130 | −0.003 | Yes |
| Postoperative/trauma | +0.052 | −0.013 | Yes |
| Respiratory failure | +0.086 | −0.092 | Yes |
| Sepsis | −0.322 | +0.097 | Yes |
References
- Vincent, J.L.; Moreno, R.; Takala, J.; Willatts, S.; De Mendonça, A.; Bruining, H.; Reinhart, C.K.; Suter, P.M.; Thijs, L.G. The SOFA (Sepsis-related Organ Failure Assessment) score to describe organ dysfunction/failure. Intensive Care Med. 1996, 22, 707–710. [Google Scholar] [CrossRef] [PubMed]
- Lambden, S.; Laterre, P.F.; Levy, M.M.; Francois, B. The SOFA score—Development, utility and challenges of accurate assessment in clinical trials. Crit. Care 2019, 23, 374. [Google Scholar] [CrossRef] [Scilit]
- Capurso, C.; Lo Buglio, A.; Bellanti, F.; Serviddio, G. C-Reactive Protein to Albumin Ratio Predicts Early Mortality in Hospitalized Older Patients, Independent of the Admission Diagnosis. Nutrients 2025, 17, 1984. [Google Scholar] [CrossRef] [Scilit]
- Oh, T.K.; Ji, E.; Na, H.S.; Min, B.; Jeon, Y.T.; Do, S.H.; Song, I.A.; Park, H.P.; Hwang, J.W. C-Reactive Protein to Albumin Ratio Predicts 30-Day and 1-Year Mortality in Postoperative Patients after Admission to the Intensive Care Unit. J. Clin. Med. 2018, 7, 39. [Google Scholar] [CrossRef] [Scilit] [PubMed]
- Żerdziński, K.; Gałuszewski, M.; Janiec, J.; Skrzypek, M.; Krzych, Ł.J. Early Peri-Admission Lactate-to-Albumin (LAR), C-Reactive Protein-to-Albumin (CAR), and Procalcitonin-to-Albumin (PAR) Ratios and ICU Mortality in a Tertiary Cardiac ICU. J. Clin. Med. 2026, 15, 826. [Google Scholar] [CrossRef] [Scilit] [PubMed]
- Yoon, J.H.; Choi, W.S.; Lim, Y.S.; Jang, J.H. Comparison of Prognostic Performance between Procalcitonin and Procalcitonin-to-Albumin Ratio in Post Cardiac Arrest Syndrome. J. Clin. Med. 2023, 12, 4568. [Google Scholar] [CrossRef] [Scilit] [PubMed]
- von Elm, E.; Altman, D.G.; Egger, M.; Pocock, S.J.; Götzsche, P.C.; Vandenbroucke, J.P. The Strengthening the Reporting of Observational Studies in Epidemiology (STROBE) statement: Guidelines for reporting observational studies. Lancet 2007, 370, 1453–1457. [Google Scholar] [CrossRef] [Scilit] [PubMed]
- Charlson, M.E.; Pompei, P.; Ales, K.L.; MacKenzie, C.R. A new method of classifying prognostic comorbidity in longitudinal studies: Development and validation. J. Chronic Dis. 1987, 40, 373–383. [Google Scholar] [CrossRef] [Scilit] [PubMed]
- Singer, M.; Deutschman, C.S.; Seymour, C.W.; Shankar-Hari, M.; Annane, D.; Bauer, M.; Bellomo, R.; Bernard, G.R.; Chiche, J.D.; Coopersmith, C.M.; et al. The Third International Consensus Definitions for Sepsis and Septic Shock (Sepsis-3). JAMA 2016, 315, 801–810. [Google Scholar] [CrossRef] [Scilit] [PubMed]
- DeLong, E.R.; DeLong, D.M.; Clarke-Pearson, D.L. Comparing the areas under two or more correlated receiver operating characteristic curves: A nonparametric approach. Biometrics 1988, 44, 837–845. [Google Scholar] [CrossRef] [Scilit] [PubMed]
- Pencina, M.J.; D’Agostino, R.B., Sr.; D’Agostino, R.B., Jr.; Vasan, R.S. Evaluating the added predictive ability of a new marker: From area under the ROC curve to reclassification and beyond. Stat. Med. 2008, 27, 157–172. [Google Scholar] [CrossRef] [Scilit] [PubMed]
- Park, J.E.; Chung, K.S.; Song, J.H.; Kim, S.Y.; Kim, E.Y.; Jung, J.Y.; Kang, Y.A.; Park, M.S.; Kim, Y.S.; Chang, J.; et al. The C-Reactive Protein/Albumin Ratio as a Predictor of Mortality in Critically Ill Patients. J. Clin. Med. 2018, 7, 333. [Google Scholar] [CrossRef] [Scilit] [PubMed]
- Ranzani, O.T.; Zampieri, F.G.; Forte, D.N.; Azevedo, L.C.P.; Park, M. C-Reactive Protein/Albumin Ratio Predicts 90-Day Mortality of Septic Patients. PLoS ONE 2013, 8, e59321. [Google Scholar] [CrossRef] [Scilit] [PubMed]
- Liu, Y.; Gao, Y.; Liang, B.; Liang, Z. The Prognostic Value of C-Reactive Protein to Albumin Ratio in Patients with Sepsis: A Systematic Review and Meta-Analysis. Aging Male 2023, 26, 2261540. [Google Scholar] [CrossRef] [Scilit] [PubMed]
- Oh, T.K.; Song, I.A.; Lee, J.H. Clinical Usefulness of C-Reactive Protein to Albumin Ratio in Predicting 30-Day Mortality in Critically Ill Patients. Sci. Rep. 2018, 8, 14977. [Google Scholar] [CrossRef] [Scilit] [PubMed]
- Leening, M.J.G.; Steyerberg, E.W.; Van Calster, B.; D’Agostino, R.B., Sr.; Pencina, M.J. Net Reclassification Improvement and Integrated Discrimination Improvement Require Calibrated Models. Stat. Med. 2014, 33, 3415–3418. [Google Scholar] [CrossRef] [Scilit] [PubMed]
- Li, F.; Ye, Z.; Zhu, J.; Gu, S.; Peng, S.; Fang, Y.; Hu, L.; Xiong, J. Early Lactate/Albumin and Procalcitonin/Albumin Ratios as Predictors of 28-Day Mortality in ICU-Admitted Sepsis Patients: A Retrospective Cohort Study. Med. Sci. Monit. 2023, 29, e940654. [Google Scholar] [CrossRef] [Scilit] [PubMed]
- Liu, D.; Su, L.; Han, G.; Yan, P.; Xie, L. Prognostic Value of Procalcitonin in Adult Patients with Sepsis: A Systematic Review and Meta-Analysis. PLoS ONE 2015, 10, e0129450. [Google Scholar] [CrossRef] [Scilit]
- Schuetz, P.; Birkhahn, R.; Sherwin, R.; Jones, A.E.; Singer, A.; Kline, J.A.; Runyon, M.S.; Self, W.H.; Courtney, D.M.; Nowak, R.M.; et al. Serial Procalcitonin Predicts Mortality in Severe Sepsis Patients: Results from the Multicenter Procalcitonin MOnitoring SEpsis (MOSES) Study. Crit. Care Med. 2017, 45, 781–789. [Google Scholar] [CrossRef] [Scilit] [PubMed]
- Pepys, M.B.; Hirschfield, G.M. C-Reactive Protein: A Critical Update. J. Clin. Investig. 2003, 111, 1805–1812. [Google Scholar] [CrossRef] [PubMed]
- Lobo, S.M.; Lobo, F.R.; Bota, D.P.; Lopes-Ferreira, F.; Soliman, H.M.; Mélot, C.; Vincent, J.L. C-Reactive Protein Levels Correlate with Mortality and Organ Failure in Critically Ill Patients. Chest 2003, 123, 2043–2049. [Google Scholar] [CrossRef] [Scilit] [PubMed]
- Vincent, J.L.; Dubois, M.J.; Navickis, R.J.; Wilkes, M.M. Hypoalbuminemia in Acute Illness: Is There a Rationale for Intervention? A Meta-Analysis of Cohort Studies and Controlled Trials. Ann. Surg. 2003, 237, 319–334. [Google Scholar] [CrossRef] [Scilit] [PubMed]
- Soeters, P.B.; Wolfe, R.R.; Shenkin, A. Hypoalbuminemia: Pathogenesis and Clinical Significance. JPEN J. Parenter. Enter. Nutr. 2019, 43, 181–193. [Google Scholar] [CrossRef] [Scilit] [PubMed]
- Peters, E.J.; Frydland, M.S.; Hassager, C.; Bos, L.D.J.; van Vught, L.A.; Cremer, O.L.; Møller, J.E.; van den Born, B.J.H.; Vlaar, A.P.J.; Henriques, J.P.S.; et al. Biomarker Patterns in Patients with Cardiogenic Shock versus Septic Shock. IJC Heart Vasc. 2024, 52, 101424. [Google Scholar] [CrossRef] [Scilit] [PubMed]
- Cornish, M.; Butler, M.B.; Green, R.S. Predictors of Poor Outcomes in Critically Ill Adults with Hematologic Malignancy. Can. Respir. J. 2016, 2016, 9431385. [Google Scholar] [CrossRef] [Scilit] [PubMed]
- Yeo, C.D.; Kim, J.W.; Kim, S.C.; Kim, Y.K.; Kim, K.H.; Kim, H.J.; Lee, S.; Rhee, C.K. Prognostic Factors in Critically Ill Patients with Hematologic Malignancies Admitted to the Intensive Care Unit. J. Crit. Care 2012, 27, 739.e1–739.e6. [Google Scholar] [CrossRef] [Scilit] [PubMed]
- Vigneron, C.; Charpentier, J.; Valade, S.; Alexandre, J.; Chelabi, S.; Palmieri, L.J.; Franck, N.; Laurence, V.; Mira, J.P.; Jamme, M.; et al. Patterns of ICU Admissions and Outcomes in Patients with Solid Malignancies over the Revolution of Cancer Treatment. Ann. Intensive Care 2021, 11, 182. [Google Scholar] [CrossRef] [Scilit] [PubMed]
- Collins, G.S.; Reitsma, J.B.; Altman, D.G.; Moons, K.G.M. Transparent Reporting of a Multivariable Prediction Model for Individual Prognosis or Diagnosis (TRIPOD): The TRIPOD Statement. Ann. Intern. Med. 2015, 162, 55–63, Correction in Ann. Intern. Med. 2015, 162, 600. https://doi.org/10.7326/L15-0078-4. [Google Scholar] [CrossRef] [Scilit] [PubMed]
- Hilden, J.; Gerds, T.A. A Note on the Evaluation of Novel Biomarkers: Do Not Rely on Integrated Discrimination Improvement and Net Reclassification Index. Stat. Med. 2014, 33, 3405–3414. [Google Scholar] [CrossRef] [Scilit] [PubMed]


| Characteristic | All (n = 372) | Survivors (n = 124) | Non-Survivors (n = 248) | p |
|---|---|---|---|---|
| General characteristics | ||||
| Age, years | 70 (59–77) | 70 (58–77) | 69 (59–78) | 0.934 |
| Male sex | 200 (53.8) | 68 (54.8) | 132 (53.2) | 0.854 |
| Admission category, n (%) | ||||
| Respiratory failure | 158 (42.5) | 46 (37.1) | 112 (45.2) | <0.001 |
| Sepsis | 116 (31.2) | 30 (24.2) | 86 (34.7) | |
| Gastrointestinal/hepatic | 36 (9.7) | 21 (16.9) | 15 (6.0) | |
| Cardiovascular | 18 (4.8) | 3 (2.4) | 15 (6.0) | |
| Postoperative/trauma | 10 (2.7) | 6 (4.8) | 4 (1.6) | |
| Neurologic | 8 (2.2) | 4 (3.2) | 4 (1.6) | |
| Metabolic/endocrine | 5 (1.3) | 4 (3.2) | 1 (0.4) | |
| Other | 21 (5.6) | 10 (8.1) | 11 (4.4) | |
| Comorbid diseases | ||||
| Metastatic solid tumour | 82 (22.0) | 18 (14.5) | 64 (25.8) | 0.019 |
| Haematological malignancy | 73 (19.6) | 14 (11.3) | 59 (23.8) | 0.006 |
| Diabetes mellitus | 142 (38.2) | 55 (44.4) | 87 (35.1) | 0.105 |
| Chronic kidney disease | 123 (33.1) | 41 (33.1) | 82 (33.1) | 1.000 |
| COPD | 54 (14.5) | 16 (12.9) | 38 (15.3) | 0.661 |
| Congestive heart failure | 123 (33.1) | 48 (38.7) | 75 (30.2) | 0.129 |
| Severity scores | ||||
| SOFA score | 9 (6–12) | 7 (4–10) | 11 (8–13) | <0.001 |
| Age-adjusted Charlson Comorbidity Index | 7 (5–9) | 7 (5–9) | 7 (5–9) | 0.098 |
| Laboratory in the first 24 h | ||||
| Haemoglobin, g/dL | 9.4 (8.3–11.0) | 9.4 (8.1–10.9) | 9.4 (8.4–11.0) | 0.366 |
| Platelets, ×109/L | 157.5 (68.8–248.0) | 168.0 (95.0–252.0) | 138.5 (58.8–240.8) | 0.065 |
| Lactate, mmol/L | 2.0 (1.4–3.2) | 1.8 (1.3–2.4) | 2.3 (1.5–3.6) | <0.001 |
| CRP, mg/L | 115 (54–197) | 78 (33–150) | 144 (68–220) | <0.001 |
| Procalcitonin, ng/mL | 1.6 (0.4–8.4) | 0.6 (0.2–2.6) | 2.5 (0.7–12.1) | <0.001 |
| Creatinine, mg/dL | 1.6 (0.9–2.7) | 1.4 (0.9–2.4) | 1.7 (1.0–2.9) | 0.071 |
| Total bilirubin, mg/dL | 0.8 (0.4–1.7) | 0.6 (0.4–1.1) | 0.8 (0.5–2.0) | 0.003 |
| Albumin, g/dL | 2.7 (2.2–3.0) | 2.8 (2.4–3.2) | 2.5 (2.2–3.0) | <0.001 |
| Albumin-based ratios | ||||
| CAR (CRP/albumin) | 46.6 (18.3–79.1) | 27.6 (12.1–57.7) | 55.1 (25.8–88.6) | <0.001 |
| PAR (procalcitonin/albumin) | 0.6 (0.1–3.5) | 0.2 (0.1–1.1) | 1.0 (0.3–4.8) | <0.001 |
| LAR (lactate/albumin) | 0.8 (0.5–1.3) | 0.7 (0.5–0.9) | 0.9 (0.6–1.4) | <0.001 |
| Organ support, n (%) | ||||
| Invasive mechanical ventilation | 269 (72.3) | 46 (37.1) | 223 (89.9) | <0.001 |
| Vasopressor support | 286 (76.9) | 57 (46.0) | 229 (92.3) | <0.001 |
| Renal replacement therapy | 150 (40.3) | 34 (27.4) | 116 (46.8) | <0.001 |
| Outcomes | ||||
| ICU stay, days | 8 (5–15) | 5 (4–10) | 10 (6–16) | <0.001 |
| Hospital stay, days | 20 (11–32) | 19 (13–28) | 20 (11–34) | 0.949 |
| In-hospital death, n (%) | 268 (72.0) | 20 (16.1) | 248 (100.0) | – |
| Predictor | AUC (95% CI) |
|---|---|
| SOFA score | 0.730 (0.677–0.782) |
| Age-adjusted Charlson Comorbidity Index | 0.552 (0.491–0.614) |
| Albumin | 0.633 (0.573–0.692) |
| CRP | 0.656 (0.597–0.715) |
| Procalcitonin | 0.681 (0.622–0.740) |
| Lactate | 0.611 (0.552–0.669) |
| CAR | 0.671 (0.614–0.729) |
| PAR | 0.689 (0.630–0.747) |
| LAR | 0.642 (0.585–0.700) |
| Model | AUC (95% CI) | OR per SD (95% CI) | ΔAUC | NRI (95% CI) | IDI (95% CI) | HL p |
|---|---|---|---|---|---|---|
| Base + CAR | 0.765 (0.715–0.815) | 1.65 (1.29–2.13) | +0.030 | +0.39 (+0.17–+0.61) | +0.042 (+0.013–+0.091) | 0.69 |
| Base + PAR | 0.751 (0.700–0.802) | 1.50 (1.15–1.95) | +0.016 | +0.28 (+0.06–+0.58) | +0.023 (+0.002–+0.065) | 0.53 |
| Base + LAR | 0.742 (0.690–0.793) | 1.28 (1.00–1.64) | +0.006 | +0.22 (–0.02–+0.48) | +0.009 (+0.000–+0.031) | 0.89 |
| Base + CAR + PAR | 0.768 (0.718–0.817) | n/a | +0.032 | +0.47 (+0.21–+0.68) | +0.045 (+0.016–+0.097) | 0.02 |
| CAR (adjusted for PAR) | 1.52 (1.15–2.03) | |||||
| PAR (adjusted for CAR) | 1.20 (0.89–1.63) |
| Marker | Cut-Off | Sensitivity (95% CI) | Specificity (95% CI) | PPV | NPV | Mortality≥ vs. <Cut-Off |
|---|---|---|---|---|---|---|
| CAR | 45.9 | 0.60 (0.54–0.66) | 0.68 (0.59–0.75) | 0.79 | 0.46 | 79% vs. 54% |
| PAR | 0.48 | 0.64 (0.58–0.69) | 0.68 (0.59–0.75) | 0.80 | 0.48 | 80% vs. 52% |
| LAR | 0.93 | 0.51 (0.45–0.57) | 0.78 (0.70–0.85) | 0.82 | 0.44 | 82% vs. 56% |
| Marker | Survivors | Non-Survivors | p | AUC (95% CI) |
|---|---|---|---|---|
| Septic patients (n = 116, mortality 74%) | ||||
| CAR | 56.9 (21.4–101.4) | 65.4 (41.1–92.5) | 0.490 | 0.543 (0.416–0.669) |
| PAR | 0.94 (0.28–4.86) | 2.11 (0.72–12.62) | 0.075 | 0.610 (0.484–0.736) |
| LAR | 0.90 (0.48–1.52) | 1.00 (0.67–1.57) | 0.240 | 0.572 (0.450–0.695) |
| Non-septic patients (n = 256, mortality 63%) | ||||
| CAR | 22.4 (7.8–43.3) | 50.2 (20.3–86.1) | <0.001 | 0.698 (0.633–0.763) |
| PAR | 0.14 (0.05–0.47) | 0.61 (0.19–3.04) | <0.001 | 0.702 (0.634–0.769) |
| LAR | 0.61 (0.43–0.85) | 0.86 (0.55–1.40) | <0.001 | 0.652 (0.585–0.718) |
| Variable | Analysis Cohort (n = 372) | Excluded, Incomplete Work-Up (n = 626) | Excluded, <24 h Stay (n = 304) | p * |
|---|---|---|---|---|
| Age, years | 70 (59–77) | 70 (60–79) | 70 (59–77) | 0.426 |
| Male sex, n (%) | 200 (53.8) | 378 (60.4) | 174 (57.2) | 0.047 |
| SOFA score | 9 (6–12) | 8 (4–11) | 7 (4–12) | <0.001 |
| Charlson Comorbidity Index, unadjusted | 4 (3–6) | 4 (2–6) | 4 (2–6) | 0.043 |
| Sepsis on admission, n (%) | 116 (31.2) | 350 (55.9) | 137 (45.1) | <0.001 |
| Respiratory failure on admission, n (%) | 158 (42.5) | 224 (35.8) | 131 (43.1) | <0.001 |
| Invasive mechanical ventilation, n (%) | 269 (72.3) | 403 (64.4) | 142 (46.7) | 0.012 |
| Vasopressor support, n (%) | 286 (76.9) | 383 (61.2) | 145 (47.7) | <0.001 |
| Renal replacement therapy, n (%) | 150 (40.3) | 199 (31.8) | 73 (24.0) | 0.008 |
| ICU stay, days | 8 (5–15) | 7 (4–13) | 0 (0–0) | <0.001 |
| ICU mortality, n (%) | 248 (66.7) | 388 (62.0) | 158 (52.0) | 0.155 |
Disclaimer/Publisher’s Note: The statements, opinions and data contained in all publications are solely those of the individual author(s) and contributor(s) and not of MDPI and/or the editor(s). MDPI and/or the editor(s) disclaim responsibility for any injury to people or property resulting from any ideas, methods, instructions or products referred to in the content. |
© 2026 by the authors. Licensee MDPI, Basel, Switzerland. This article is an open access article distributed under the terms and conditions of the Creative Commons Attribution (CC BY) license.
Share and Cite
Çolak, Ö.Y.; İşevi, M.; Sezer Akman, T.; Kılıç, Ö.; Ünal Akdemir, N. Incremental Prognostic Value of Albumin-Anchored Inflammatory Ratios Beyond a SOFA-Based Model in a Medical ICU: A Retrospective Cohort Study. Metabolites 2026, 16, 692. https://doi.org/10.3390/metabo16090692
Çolak ÖY, İşevi M, Sezer Akman T, Kılıç Ö, Ünal Akdemir N. Incremental Prognostic Value of Albumin-Anchored Inflammatory Ratios Beyond a SOFA-Based Model in a Medical ICU: A Retrospective Cohort Study. Metabolites. 2026; 16(9):692. https://doi.org/10.3390/metabo16090692
Chicago/Turabian StyleÇolak, Özkul Yılmaz, Melda İşevi, Tuğçehan Sezer Akman, Özgür Kılıç, and Neslihan Ünal Akdemir. 2026. "Incremental Prognostic Value of Albumin-Anchored Inflammatory Ratios Beyond a SOFA-Based Model in a Medical ICU: A Retrospective Cohort Study" Metabolites 16, no. 9: 692. https://doi.org/10.3390/metabo16090692
APA StyleÇolak, Ö. Y., İşevi, M., Sezer Akman, T., Kılıç, Ö., & Ünal Akdemir, N. (2026). Incremental Prognostic Value of Albumin-Anchored Inflammatory Ratios Beyond a SOFA-Based Model in a Medical ICU: A Retrospective Cohort Study. Metabolites, 16(9), 692. https://doi.org/10.3390/metabo16090692