Article

Comprehensive Profiling of Antioxidant, Antidiabetic, and Cytotoxic Compounds from Morinda lucida Benth Using 1H-NMR- and UHPLC-Q Exactive Orbitrap MS-Based Metabolomics Combined with Molecular Networking and Molecular Docking


by
Dorcas Tlhapi
1,*,
Ntsoaki Malebo
2,
Idah Tichaidza Manduna
1,
Monizi Mawunu
3,4,
Chika Ifeanyi Chukwuma
5,
Ramakwala Christinah Chokwe
6 and
Kolawole Olofinsan
7
1
Centre for Applied Food Sustainability and Biotechnology, Faculty of Health and Environmental Sciences, Central University of Technology, Bloemfontein 9301, South Africa
2
Department of Life Sciences, Faculty of Health and Environmental Sciences, Central University of Technology, Bloemfontein 9301, South Africa
3
Department of Agronomy, Polytechnic Institute, Kimpa Vita University, Uíge P.O. Box 77, Angola
4
Department of Biology, Faculty of Science and Technology, University of Kinshasa, Kinshasa P.O. Box 190, Congo
5
Centre for Quality of Health and Living, Faculty of Health and Environmental Sciences, Central University of Technology, Bloemfontein 9301, South Africa
6
Department of Chemistry, College of Science Engineering and Technology, University of South Africa, Florida, Johannesburg 1710, South Africa
7
Department of Pharmacology, Faculty of Health Sciences, University of the Free State, Bloemfontein 9300, South Africa
*
Author to whom correspondence should be addressed.
Metabolites 2026, 16(8), 523; https://doi.org/10.3390/metabo16080523
Submission received: 14 May 2026 / Revised: 10 July 2026 / Accepted: 10 July 2026 / Published: 24 July 2026
(This article belongs to the Section Metabolomic Profiling Technology)

Abstract

Background/Objectives: Morinda lucida Benth is widely distributed throughout Central and West Africa. It has traditionally been used to treat and manage various diseases. However, scientific research on its phytochemical and pharmacological properties remains scarce. This study investigated the phytochemical profiles, antioxidant activities, α-glucosidase inhibitors, and cytotoxic effects of compounds derived from various parts of M. lucida. Methods: Seventy-seven natural compounds were putatively annotated using 1H-NMR, UHPLC–Q Exactive Orbitrap MS, and molecular networking techniques. The antioxidant activities of the crude extracts were assessed in vitro using DPPH free radical scavenging and reducing power assays, whereas the in vitro α-glucosidase inhibition activity and toxicity of the crude extracts were evaluated using the α-glucosidase inhibition and MTT assays. Molecular docking was used to assess the interactions between the identified glycosides and the α-glucosidase protein. Results: The root extract exhibited the highest DPPH free radical scavenging (IC50 = 7.7550 ± 6.9142 μg/mL) and reducing power capacity (IC0.5 = 0.0052 ± 0.0025 μg/mL). In contrast, the stem bark extract demonstrated significant inhibition of alpha-glucosidase (IC50 = 79.9 ± 16.1 µg/mL). Sophoricoside, formononetin 7-O-glucoside, and epicatechin identified in the stem bark extract showed notable in silico interactions with the α-glucosidase protein. The stem bark and leaf extracts were more toxic than the root extract at different concentrations. Conclusions: The results of this study demonstrate the therapeutic potential of M. lucida and provide information on its phytochemical composition and pharmacological properties.

1. Introduction

Morinda lucida Benth (“brimstone tree”) is a medicinal plant species belonging to the Rubiaceae family, which includes approximately 12,000 known species and approximately 576 genera, and is widely distributed in Central and West Africa [1,2]. M. lucida has been used to treat various ailments, including diabetes, hypertension, cancer, inflammation, parasitic worms, malaria, jaundice, trypanosomiasis, typhoid fever, neurological disorders, cognitive disorders, fever, and sickle cell disease [2,3,4]. Several studies on M. lucida have revealed its bioactivities, including antiproliferative, antionchocercal, antifungal, antitrypanosomal, antileishmanial, antisickling, hypotensive, antidiabetic, anti-inflammatory, antimicrobial, immunostimulatory, antimalarial, and antioxidant activities [5]. Various compounds, including cardiac glycosides, polyphenols, iridoids, terpenoids, sterols, anthraquinones, flavonoids, saponins, fatty acids, phenols, alkaloids, and tannins, have been identified in different parts of Morinda lucida [6]. These compounds may be correlated with the medicinal properties of the plants. Several studies have been performed on the bioactivities of M. lucida; however, there has been no documentation of metabolomic profiles linked to the bioactivity of this plant species. Therefore, it is necessary to discover the phytochemicals that contribute to the antioxidant activity, α-glucosidase inhibition, and cytotoxic effects of this plant. Studies on M. lucida have focused on classical phytochemical techniques such as column chromatography (CC), Sephadex LH-20, liquid chromatography (LC), gas chromatography (GC), thin-layer chromatography (TLC), and high-performance thin-layer chromatography (HPTLC). However, these methods are time-consuming and often inefficient for the analysis of chemical constituents [7,8]. 1H nuclear magnetic resonance (1H-NMR) and ultra-high-performance liquid chromatography-quadrupole-electrostatic field orbitrap mass spectrometry (UHPLC–Q Exactive Orbitrap MS) combined with molecular networking (MN) and molecular docking techniques have modernized phytochemical analysis, allowing for faster identification, annotation, and quantification of different phytochemicals with remarkable sensitivity and precision [9].
Metabolomics involves methods and techniques to analyze a group of chemical compounds in a complex matrix [10,11,12]. Molecular networking is a tool used to classify, identify, and visualize the similarities between metabolites [13]. This approach makes it easier for scientific researchers to annotate known natural compounds in crude extracts and focus on unknown natural compounds that could be of biological interest [14]. Molecular docking is a computational technique used to analyze, model, and predict chemical and biological processes [15]. Few studies have shown that M. lucida is used to treat diabetes [1,15,16]; however, the bioactive compounds in this plant have rarely been isolated and characterized using classical phytochemical techniques. Furthermore, there are no reports on the chemical profiling of bioactive extracts from Morinda species for α-glucosidase inhibition using a metabolomic approach. Applying these techniques, the stem bark, root, and leaf extracts of Morinda lucida were analyzed to identify possible antidiabetic compounds. This study explored the metabolic fingerprint, in vitro antioxidant activity, α-glucosidase potential, and cytotoxicity of different plant parts of M. lucida using proton nuclear magnetic resonance (1H-NMR), ultra-high-performance liquid chromatography–quadrupole–electrostatic field orbitrap mass spectrometry (UHPLC–Q Exactive Orbitrap MS), MN, and molecular docking techniques. Furthermore, this study provides information on which plant organ can be a potential source of safe and effective compounds for the treatment of diabetes using the 2,2-diphenyl-1-picrylhydrazyl (DPPH) free radical scavenging, reducing power, α-glucosidase inhibition, and MTT (3-(4,5-dimethylthiazol-2-yl)-2,5-diphenyltetrazolium bromide) assays.

2. Materials and Methods

2.1. General Experimental Procedure

Minimal essential medium, fetal bovine serum, L- glutamine, penicillin/streptomycin, trypan blue, Earle’s balanced salt solution, and trypsin/EDTA were obtained from Cytiva HyClone (Marlborough, MA, USA). Acarbose, α-glucosidase enzyme solution, phosphate-buffered saline (PBS), and p-Nitrophenyl α-D-glucopyranoside were purchased from Sigma-Aldrich (Darmstadt, Germany). African green monkey (Vero) kidney cells (ATCC CCL-81, RRID: CVCL_0059) were purchased from Cytiva HyClone (Marlborough, MA, USA). Acetonitrile, methanol, dichloromethane, and formic acid were purchased from Sigma-Aldrich (St. Louis, MO, USA). Ascorbic acid, quercetin, gallic acid, DPPH (2,2-diphenyl-1-picrylhydrazyl), and dimethyl sulfoxide were purchased from Sigma-Aldrich (Darmstadt, Germany). All solvents and chemicals used in this research study were of analytical grade.

2.2. Plant Collection, Sampling, and Extraction

The leaves, root, and stem bark of Morinda lucida were collected in Condo Benza, Uíge Province, Angola (Latitude: S 7°35′59.38044″, Longitude: E 15°0′16.434″, https://www.google.com/maps/search/?api=1&query=-7.5998279,15.004565) accessed on 15 March 2023. The samples were air-dried for four weeks and then ground to a fine powder using a POLYMIX lab mill with blade grinding, PX- MFC 90 D (Willows, Bloemfontein, South Africa). The samples were identified, and a herbarium reference specimen (UNIKIVI-017-2023) was deposited at Kimpa Vita University, Uíge Province, Angola. The dried leaves (approximately 115.32 g) of M. lucida were extracted by maceration with 2 L of 100% dichloromethane and 100% methanol at room temperature for 48 h. The resulting crude dichloromethane and methanol extracts were filtered and concentrated using a Büchi Rotavapor (Sigma-Aldrich, St. Louis, MO, USA) to 1.32 g and 4.00 g of dichloromethane and methanol leaf extracts, respectively, were obtained. In addition, the dried root (approximately 859.07 g) and stem bark (approximately 173.76 g) of M. lucida were extracted by maceration with 2 L of 100% methanol at room temperature for 48 h. The resulting crude methanol extracts were filtered and concentrated using a Büchi Rotavapor (Sigma-Aldrich, St. Louis, MO, USA) to 8.12 g and 9.45 g of methanol root and stem bark extracts.

2.3. 1H-NMR Spectroscopic Analysis

One-dimensional (1D) 1H-NMR spectra were recorded at 500 MHz using an Avance III HD spectrometer (Bruker, Fällanden, Switzerland). The chemical shifts for 1H-NMR were measured in parts per million (ppm). Deuterated chloroform (CDCl3) and dimethyl sulfoxide-d6 (DMSO-d6) served as solvents for preparation of the NMR samples. The NMR spectral data were processed using Bruker TopSpin 5.0 software, which facilitated baseline correction, phase correction, normalization, and referencing. All the crude extracts underwent analysis via 1H-NMR spectroscopy, and the annotation of compounds was confirmed through one-dimensional (1D) 1H-NMR spectral analysis, comparison with previously reported 1D 1H-NMR data, and reference to the Human Metabolite Database (https://hmdb.ca).

2.4. UHPLC–Q Exactive Orbitrap MS Analysis

The leaves, root, and stem bark extracts of Morinda lucida were annotated using a Q Exactive Plus Orbitrap mass spectrometer connected to a Thermo Scientific Dionex Ulti-mate 3000 ultra-high-performance liquid chromatography system (UHPLC; Thermo Fisher Scientific, Waltham, MA, USA). The Exactive Plus was attached to the mass spectrometry with a heated electrospray ionization (ESI) probe and an optimum source (auxiliary temperature, 400 °C; spray voltage, 3 kV; 50 arbitrary units; sheath gas flow, capillary temperature, 290 °C). Full mass spectrometry (MS) selected ion monitoring and data-dependent MS2 with both negative and positive polarity exchanging over a scan range of m/z 100 to 1500 with a mass tolerance window of less than 5 ppm were used for both the negative and positive ESI modes. The mass spectrometer was operated at a resolution of 70,000 full width at half maximum in a complete scan mode, with an automated gain control target set at 1.0 × 10⁶ and a maximum injection time of 100 ms. Liquid chromatography, electrospray ionization, and Orbitrap mass spectrometry (LC-ESI-Orbitrap-MS) analysis was performed using a C18 analytical column (4.6 × 150 mm, particle size 3.5 µm), and the mobile phases used were formic acid (0.1% v/v) in solvent A (water) and formic acid (0.1% v/v) in solvent B (acetonitrile). Linear gradient elution began at 0 min with 5% solvent B and increased to 20 min with 100% solvent B. The sample injection volume was 10 µL, mobile phase flow rate was 0.9 mL min−1, and column temperature was 25 °C. Data processing was performed using XCaliber version 3.0 (Thermo Fisher Scientific Inc., Waltham, MA, USA). Both electrospray ionization modes, namely negative (ESI−, Figure S2) and positive (ESI+, Figure S1), were evaluated; however, the negative electrospray ionization mode was selected for subsequent sample analysis due to its higher ion production compared with the positive mode. Raw data files were converted into mzXML format using the ProteoWizard tool MSConvertGUI software (version 3.0.24164-38d6037). The mzXML files were analyzed using MZmine (version 3.9.0). The aligned peak list, which included the retention time (tR), peak heights, and m/z values for each sample, was subsequently converted to the -quant.csv format. These converted files were uploaded to Mass Bank (https://massbank.eu), an online database dedicated to the annotation of compounds. Secondary metabolites with a matching score greater than 80% in the database were considered, and the quantified and identified secondary metabolites were extracted from the sample chromatogram data for validation. A data-dependent scan (dd-MS2) was employed to obtain high-quality MS/MS data, wherein the top five most intense precursors were automatically selected for MS/MS fragmentation through higher-energy collisional dissociation (HCD). The parameters of dd-MS2 were as follows: resolution, 17,500; automatic gain control target, 1 × 10⁵; Maximum IT, 50 ms; loop count, 5; isolation window, 4 m/z. The Normalized Collision Energy was set to 20, 40, and 60 V.

2.5. Global Natural Product Social Molecular Networking (GNPS) and Metabolite Annotation

The analysis of the Morinda lucida crude extracts was performed using the molecular networking approach, as outlined on the Global Natural Product Social molecular networking website (http://gnps.ucsd.edu, accessed on 7 July 2025). The mass spectroscopic data were converted into the mzXML format using the ProteoWizard tool MSConvertGUI (version 3.0.24164-38d6037) software. Subsequently, the spectral data (mzXML files) were uploaded to Global Natural Product Social molecular networking platform via WinSCP (version 6.3.4 (Build 14955 17 June 2024)) and analyzed using the GNPS platform (http://gnps.ucsd.edu, accessed on 7 July 2025). Following the upload of the spectral files, molecular networking was employed to connect the mass spectra of the compounds based on the similarity of their MS/MS fragment ions. The optimum parameters were as follows: the precursor ion mass tolerance was set to 0.02 Da, and fragment ion mass tolerance was set to 0.02 Da. Molecular networks were constructed with a cosine score exceeding 0.6 and a minimum of four matched fragment ions shared by at least one MS2 spectrum. The results were downloaded, and the generated spectral network was uploaded to Cytoscape (Version 3.91) software for network visualization [17]. Chemical structures were illustrated using ChemDraw 15.0. For compound annotations, the empirical formulas derived from the exact mass attained from the MS2 data of the compounds were utilized to annotate both unmatched and matched nodes, which were then compared with other established natural product dereplication databases, such as the Human Metabolome Database (https://hmdb.ca, accessed on 4 August 2025), the Dictionary of Natural Products (http://dnp.chemnetbase.com/faces/chemical/ChemicalSearch.xhtml, accessed on 8 September 2025), ChemSpider (www.chemspider.com, accessed on 6 October 2025), MassBank (https://massbank.eu, accessed on 10 November 2025), and KNApSAck (www.knapsackfamily.com, accessed on 2 December 2025).

2.6. Antioxidant Assay

2.6.1. Free Radical Scavenging Assay (DPPH)

The antioxidant activity was assessed using the DPPH free radical scavenging method outlined by Mintsa et al. (2022) [18]. One hundred microliters of the leaf, root, and stem bark crude extracts were added in triplicate (n = 3) to the first three wells of a 96-well plate containing 100 µL of distilled water, followed by a two-fold serial dilution. Subsequent to the serial dilutions, 200 µL of DPPH/methanol solution (0.3 M) was introduced into all the wells of the plate. The plates were incubated at room temperature for 30 min, after which the absorbance was measured using a SoftMaxR Pro 6 (version 6.3) microplate reader at a wavelength of 517 nm. Gallic acid, quercetin, and ascorbic acid served as positive controls, which were also tested in triplicate.
DPPH inhibition percentage was calculated using the following Formula (1):
D P P H   R S A   % =   A b s o r b a n c e   o f   D P P H     A b s o r b a n c e   o f   s a m p l e A b s o r b a n c e   o f   D P P H     ×   100  

2.6.2. Reducing Power Assay

The reducing power of the samples was evaluated using a modified method based on the work of Dah-Nouvlessounon et al. (2023) [19]. Fifty microliters of the samples were combined with 0.2 M sodium phosphate buffer (pH 6.6) and 50 µL of 1% aqueous potassium hexacyanoferrate [K3Fe(CN)6] solution. Following a 20 min incubation at 50 °C, 50 µL of a 10% trichloroacetic acid (TCA) solution and 80 µL of each mixture were transferred to a 96-well plate containing 80 µL of distilled water and 16 µL of ferric chloride (FeCl3; 0.1%, w/v). Absorbance was measured using a SoftMaxR Pro 6 (version 6.3) microplate reader at a wavelength of 700 nm. All samples were tested in triplicate (n = 3).

2.7. α-Glucosidase Inhibition Assay

The α-glucosidase inhibition assay was conducted following the method described by Motloung et al. (2020) [20], with minor modifications. In this assay, 50 μL of various concentrations (6.25–100 μg/mL in the reaction mixture) of extracts or standard (acarbose), along with their solvent (control), were combined with 50 μL of a 2 U/mL α-glucosidase enzyme solution (dissolved in cold commercial PBS) in a transparent 96-well plate and incubated at 37 °C for 10 min. Thereafter, 50 μL of 5 mM p-Nitrophenyl α-D-glucopyranoside (dissolved in pre-warmed commercial PBS) was added, and the mixture was incubated for an additional 25 min at 37 °C. Thereafter, absorbance was measured at 405 nm. The enzyme inhibition (%) of the samples was calculated using the following Formula (2):
I n h i b i t i o n   % =   A b s o r b a n c e   o f   c o n t r o l A b s o r b a n c e   o f   t e s t A b s o r b a n c e   o f   c o n t r o l   ×   100  

2.8. Molecular Docking Study

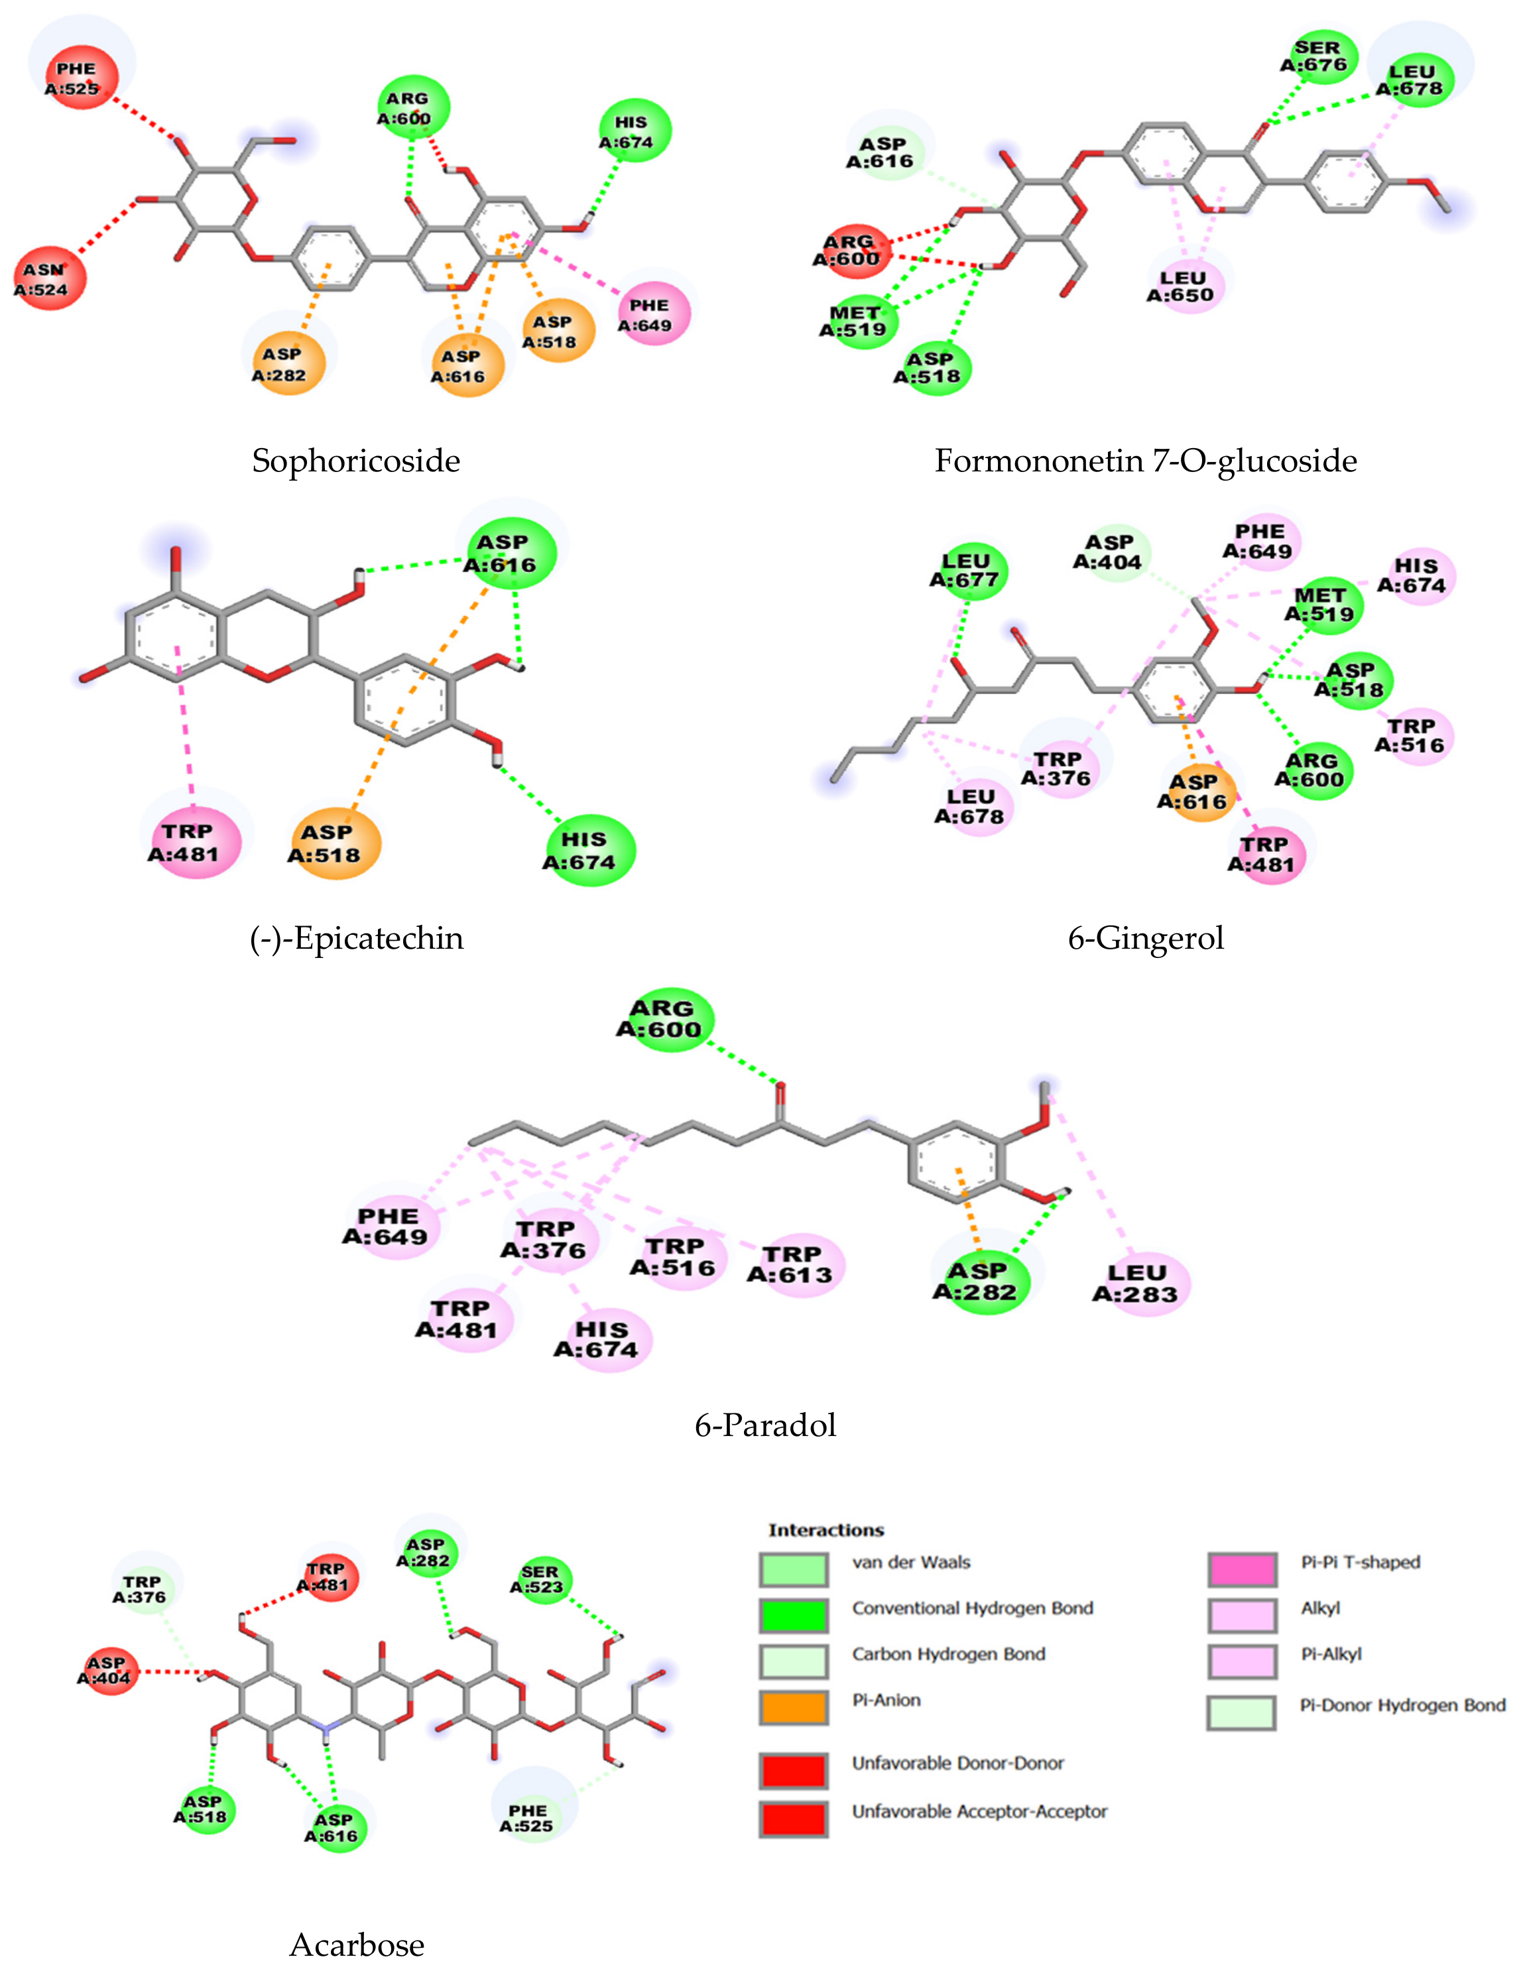
The binding affinities and interaction profiles of the compounds identified in the stem bark (sophoricoside, formononetin 7-O-glucoside, epicatechin, 6-gingerol, 6-paradol) or reference inhibitor drug (Acarbose) with the target enzyme were evaluated through molecular docking simulations. The three-dimensional (3D) structures of the ligands were retrieved from PubChem in SDF format and prepared using the Dock Prep module in UCSF Chimera (version 1.14) [21]. During preparation, all hydrogen atoms were incorporated, Gasteiger charges were assigned, and energy minimization was performed to achieve stable conformations. The crystallographic structure of α-glucosidase (GAA) (PDB ID: 5NN5) was sourced from the Protein Data Bank (PDB). The protein structure was prepared by removing water molecules and any co-crystallized ligands, followed by the addition of polar hydrogens and the assignment of appropriate charges. The active site was defined according to the coordinates of the co-crystallized ligand, and a grid box was generated to encompass the binding pocket. The grid box was centered at X = −14, Y = −31, and Z = 98, with dimensions of 40 × 32 × 31 Å along the X, Y, and Z axes, respectively. Molecular docking was performed using AutoDock (Version 1.5.6 17 September 2014) Vina [22], which employs a Lamarckian genetic algorithm to predict optimal ligand binding conformations. Each ligand was docked independently into the protein’s active site, generating multiple binding poses. The best conformations were selected based on the lowest binding energy values. To validate the docking protocol, a redocking procedure was performed in which the co-crystallized ligand was re-docked into the protein’s binding site under the same docking conditions. The accuracy of the docking method was assessed by calculating the root-mean-square deviation (RMSD) between the experimentally observed and predicted ligand poses. An RMSD value of <2.0 Å was deemed indicative of a reliable docking protocol. In addition, a reference inhibitor (positive control ligand) was included in the docking study to facilitate comparative analysis of binding affinities and interaction patterns with the tested compounds. The binding interactions of the best-ranked docking poses were further analyzed using BIOVIA Discovery Studio Visualizer, which generated two-dimensional (2D) interaction diagrams to identify key interactions, including hydrogen bonds, hydrophobic contacts, and π–π stacking, within the active site.

2.9. Cytotoxicity Testing

2.9.1. Cell Culture

African green monkey (Vero) kidney cells (ATCC CCL-81, RRID: CVCL_0059; Cellonex, South Africa) were cultured in minimal essential medium containing Earle’s balanced salt solution and 2.0 mM L-glutamine (Cytiva HyClone, Marlborough, MA, USA), supplemented with 10% fetal bovine serum and 1% penicillin or streptomycin (Biowest, Nuaille, France). The cells were maintained at 37 °C in an incubator (Nüve, Ankara, Turkey) with an atmosphere of 95% air and 5% CO2. Subsequently, the cells were detached with 0.25% trypsin or ethylenediaminetetraacetic acid (EDTA) (Cytiva HyClone, Marlborough, MA, USA) and subcultured at a ratio of 1:5 upon reaching 70% to 80% confluency. Cell viability was assessed using trypan blue 0.4% (Cytiva Hyclone, Marlborough, MA, USA) on an automatic cell counter (NanoEntek, Gurogu, Seoul, South Korea), and only cell suspensions exhibiting a cell viability of ≥90% were used for the cytotoxicity assay.

2.9.2. Cytotoxicity Assay

The cytotoxicity of the samples was assessed using the MTT method described by Tolosa et al. (2015) [23]. African green monkey kidney (Vero) cells were seeded at a density of 10,000 cells per well in 96-well plates and subsequently treated with a positive control (doxorubicin; Merck, Darmstadt, Germany) and various concentrations of samples. The Vero cells were allowed to adhere overnight under standard cell culture conditions. Initially, the cells were treated with different concentrations of samples (500, 250, 100, and 50 µg/mL) dissolved in dimethyl sulfoxide (DMSO) and diluted in culture medium. The positive control (doxorubicin; Merck, Darmstadt, Germany) was administered at concentrations of 10, 5, 2.5, and 1.25 µM. In each assessment, the concentration of DMSO (negative control) in the medium was ≤0.5%. Following a 48 h incubation of the 96-well plates, the culture medium containing the tested samples was removed and replaced with 200 µL of medium containing thiazolyl blue tetrazolium bromide (30 µL; 5 mg/mL) (Sigma-Aldrich, St. Louis, Missouri, USA) dissolved in PBS. After four hours incubation at 37 °C with 5% CO2, the culture medium was aspirated using a suction pump (Integra Biosciences Corp., Hudson, New Hampshire, USA), and 50 µL of DMSO was added to each well. The absorbance was measured using a SpectraMax iD3 multimode microplate reader (Winooski, VT, USA) at a wavelength of 570 nm. The cell viability was calculated as a percentage relative to the 0.5% DMSO negative control, as described in the following formula:
C e l l   v i a b i l i t y   % =   A b s o r b a n c e   o f   s a m p l e     A b s o r b a n c e   o f   b l a n k A b s o r b a n c e   o f   n e g a t i v e   c o n t r o l   A b s o r b a n c e   o f   b l a n k   ×   100  

2.10. Statistical Analysis

Data obtained for the α-glucosidase inhibition activities were analyzed in triplicate and were reported as the mean ± standard deviation. Acarbose was used as a positive control for the α-glucosidase inhibition assay. Statistical significance (p < 0.05) was determined using the IBM SPSS Statistics (Windows version 29.0) software when comparing the data (n = 3) across groups. One-way analysis of variance (ANOVA) and Tukey post hoc tests were used for multiple comparative analyses. The IC50 values for enzyme inhibition and CC50 values for cytotoxicity in Vero cells were calculated using a non-linear fit of the transformed (Log10) tested concentrations against the corresponding inhibitory or cytotoxic activities, utilizing GraphPad Prism 7 (Windows Version) software. For the antioxidant and cytotoxicity tests, the data were also obtained in triplicate and presented as the mean ± standard deviation. Gallic acid, ascorbic acid, and quercetin were used as reference standards for the antioxidant assay, while doxorubicin was employed as a positive control for the cytotoxicity assay. The IBM SPSS Statistics package, version 22 (Chicago, IL, USA), was used to compute statistical significance (p < 0.05) when comparing the data (n = 3) across samples in the antioxidant and cytotoxicity tests. The ANOVA with Duncan’s Multiple Range Test was used to evaluate differences in the measured variables among the samples in these tests.

3. Results

3.1. Chemical Fingerprint of the Crude Extracts of M. lucida Using 1H-NMR

All crude extracts of M. lucida were analyzed by 1H-NMR spectroscopy, with the annotation of compounds confirmed through one-dimensional (1D) 1H-NMR spectral analysis, comparison with the previously reported data [24,25,26,27,28,29,30,31,32,33,34], and the Human Metabolite Database (https://hmdb.ca). A total of 13 metabolites, including dicarboxylic acids, fatty acids, amino acids, disaccharides, monosaccharides, quinic acids, and flavonoids, were putatively annotated from the crude extracts (refer to Table 1). The 1H-NMR spectra of the extracts were categorized into three regions based on chemical shift: the aliphatic region (0–3 ppm), the sugar region (3–6 ppm), and the aromatic region (6–10 ppm), as shown in Figures S1A–S4. The chemical shifts of the annotated metabolites are presented in Table 1.
Signals corresponding to leucine and valine were identified in the dichloromethane leaf (Figure S1C,D), methanol leaf (Figure S2B,C), and stem bark extracts (Figure S3A); in contrast, betaine was only detected in the root extract (Figure S4). 1H-NMR signals of α-linoleic acid and alanine appeared in the dichloromethane leaf extract (Figure S1B,E), at δ 0.964 (t), 1.277 (m), 1.604 (m), and 5.320 (m) ppm, as well as δ 3.605 (q) ppm, respectively. Proton signals for hexadecanedioic acid were observed in the dichloromethane leaf, methanol leaf, and stem bark extracts at δ 1.262 (m), 1.277 (m), 1.464 (m), and 1.578 (m) ppm; δ 1.279 (m), 1.580 (m), and 1.263–1.280 (m) ppm; and δ 1.263–1.280 (m), and 1.578 (m) ppm, respectively (Figures S1A–S3A). Rhamnose was annotated in the methanol leaf (Figure S2D) and stem bark (Figure S3B) extracts, with signals at δ 3.844–3.852 (m), and 3.928 (m) ppm; and δ 3.841 (m), and 3.848 (m) ppm. Trehalose was detected in the dichloromethane leaf (Figure S1F), stem bark (Figure S3B), and root (Figure S4) extracts, exhibiting signals at δ 3.643 (dd), 3.847 (m), and 3.857 (m) ppm; δ 3.645 (dd), 3.841 (m), and 3.848 (m) ppm; and δ 3.834 (m), 3.845 (m), and 3.662 (m) ppm. Glucose and fructose were exclusively detected in the stem bark (Figure S3B), with signals at δ 3.869–3.923 (dd), and 3.923–3.971 (dd) ppm; and δ 3.923 (dd), and 3.971–4.033 (m) ppm, respectively. Sucrose was observed in both the stem bark (Figure S3B) and root (Figure S4) extracts at δ 3.841 (m), and 3.848 (m) ppm; and δ 3.834 (m), and 3.845 (m) ppm. The 1H-NMR spectra showed similarities and differences among the different crude extracts. Additionally, signals associated with chlorogenic acid were detected in the stem bark extract (Figure S3C,D), with the observed signals at δ 2.032 (m), 3.869 (dd), 3.898 (dd), 5.302 (m), 6.955 (d), and 6.940 (d) ppm. Signals corresponding to quercetin were also detected in the stem bark extract (Figure S3D), with the observed signals at δ 6.889 (d) and 6.906 (d) ppm.

3.2. UHPLC-Q Exactive Orbitrap MS Identification of Compounds in Morinda lucida Extracts

The untargeted screening and characterization of metabolites in Morinda lucida were putatively annotated by comparing their spectroscopic data with values found in published literature and databases to confirm the identity of the metabolites. Spectral data from the untargeted metabolomic analysis of Morinda lucida extracts were acquired using an UHPLC–Q Exactive Orbitrap MS in both positive mode (ESI (+), Figure S5, Supplementary Material) and negative mode (ESI (−), Figure S6, Supplementary Material). The negative mode (ESI (−)) was selected for further sample analysis due to its higher abundance of ions. Details on the UHPLC–Q Exactive Orbitrap MS, retention time (tR in minutes), product ion (m/z), and MS/MS spectra (m/z) are provided in Table 2. A total of 56 metabolites were putatively annotated (see Table 2), with the majority found in the leaf extracts, followed by root and stem bark extracts. Furthermore, this study represents the first comprehensive annotation and reporting of these metabolites in Morinda lucida.

3.2.1. Flavonoids

A total of fifty-six compounds were annotated across various plant parts of Morinda lucida. Compound 1 (Figure S7, Supplementary Material) with tR 3.04 min, was annotated as glabranine, exhibiting a parent ion at m/z 323.26 [M − H] [MassBank-BML00154]. Peak 2 (Figure S8, Supplementary Material) displayed characteristics consistent with apigenin 6-C-glucoside 8-C-arabinoside, with a parent ion at m/z 563.43 [M − H] [35]. This peak appeared at tR 4.11 min, yielding MS/MS fragment ions at m/z 545, 520, and 503. Compounds 3 (Figure S9, Supplementary Material) and 4 (Figure S10, Supplementary Material) exhibited parent ions at m/z 449.32 and m/z 449.32, with characteristic MS/MS fragment ions at m/z 313 and 269, and m/z 447 and 316 [36,37]. Compounds 5 (gossypetin-8-C-glucoside, Figure S11, Supplementary Material), 6 (8-prenylnaringenin, Figure S12, Supplementary Material), 7 (isoschaftoside, Figure S13, Supplementary Material) and 8 (6,4′-dimethoxyisoflavone-7-glucoside, Figure S14, Supplementary Material) produced fragment ions at m/z 324,323 and 316; m/z 339; m/z 563; and m/z 296,207 [38,39,40] (MassBank-BS-BS003443). Luteolin 6-C-glucoside 8-C-arabinoside (9, C23H24O10, Figure S15, Supplementary Material), pinocembrin (10, C27H30O16, Figure S16, Supplementary Material), acacetin-7-O-rutinoside (11, C15H12O4, Figure S17, Supplementary Material), and 3′,4′-dimethoxy-7-hydroxyflavone (12, C28H32O14, Figure S18, Supplementary Material) exhibited molecular ions at m/z 609.41 [M − H]; m/z 255.23 [M − H]; m/z 591.13 [M − H]; and m/z 297.24 [M − H], producing fragment ions at m/z 579, 519 and 487; m/z 217 and 211; m/z 283; and m/z 313 and 311 [35,41,42], [MassBank-BS-BS003750]. Compounds 13 (sophoricoside, Figure S19, Supplementary Material), 14 (kaempferol-7-O-rhamnoside, Figure S20, Supplementary Material), 15 (apigenin 8-C-glucoside, Figure S21, Supplementary Material), 16 (hyperoside, Figure S22, Supplementary Material), 17 (formononetin-7-O-glucoside, Figure S23, Supplementary Material) and 18 (quercetin-3-O-glucoside, Figure S24, Supplementary Material) exhibited molecular ions at m/z 431.23 [M − H], m/z 431.23 [M − H], m/z 431.23 [M − H], m/z 463.32 [M − H], m/z 267.07 [M − H], and m/z 464.09 [M − H], generating product ions at m/z 323, 311 and 238; m/z 283; m/z 341 and 314; m/z 455 and 453; m/z 267; and m/z 463 and 304 [43,44,45,46,47,48]. The molecular formula, C21H20O12, was determined for compound 19 (tR = 1.45 min), which exhibited a molecular ion peak [M − H] at m/z 464.88 (Figure S25, Supplementary Material, [49]). Compound 20 (luteone 7-glucoside) showed a molecular ion peak [M − H] at m/z 515.16, corresponding to the molecular formula C26H28O11. The MS/MS spectrum (Figure S26, Supplementary Material) contained a characteristic fragment at m/z 353. The annotation of this flavonoid was accomplished by comparing the spectral data with existing literature [50]. The UHPLC–Q Exactive Orbitrap MS analysis of compound 21 (tR = 1.96 min, C16H12O3) revealed an [M − H] ion at m/z 251.03 (Figure S27, Supplementary Material), with MS/MS fragments at m/z 209 and 207 [51]. The mass spectra of compounds 22 (Figure S28, Supplementary Material), 23 (Figure S29, Supplementary Material) and 24 (Figure S30, Supplementary Material) exhibited molecular ion peaks at m/z 595.15, 595.27 and 595.15, respectively. These were characterized as eriodictyol-7-O neohesperidoside (C27H32O15), quercetin-3-arabinoglucoside (C26H28O16), and quercetin-3-O-vicianoside (C26H28O16), supported by the presence of characteristic fragments at m/z 595, m/z 595, and m/z 594 and 593 [52,53,54]. Moreover, the UHPLC–Q Exactive Orbitrap MS spectra of compounds 25 (Figure S31, Supplementary Material) and 26 (Figure S32, Supplementary Material) revealed [M − H] ions at m/z 447.09 and 289.18, respectively. These compounds were identified as quercitrin and epicatechin, with characteristic daughter fragments at m/z 455 and 303, and m/z 259 and 243 [53,55].

3.2.2. Terpenoids

In the UHPLC-Q Exactive Orbitrap MS analysis utilizing the negative electrospray ionization mode, eight terpenoids were annotated in Morinda lucida crude extracts. Compound 27 (Figure S33, Supplementary Material) was assigned as 3-O-acetyl-16alpha-hydroxydehydrotrametenolic acid. It revealed its [M − H] ion at m/z 511.33, which generated a fragment ion at m/z 511 [56]. Furthermore, corosolic acid (28), sumaresinolic acid (29), and maslinic acid (30) exhibited characteristic fragmentations at m/z 426 and 418 (Figure S34, Supplementary Material), m/z 463 and 437 (Figure S35, Supplementary Material), and m/z 238 (Figure S36, Supplementary Material). These compounds were previously reported by Liu et al. (2022) [57] and Sánchez-González et al. (2013) [58], respectively. Meanwhile, poricoic acid A (31), alpha-boswellic acid (32), poricoic acid B (33) and medicagenic acid (34) exhibited distinct fragment ions at m/z 405, 377 and 216 (Figure S37, Supplementary Material); m/z 454 and 453 (Figure S38, Supplementary Material); m/z 483 (Figure S39, Supplementary Material); and m/z 485 and 421 (Figure S40, Supplementary Material), respectively [59,60,61,62].

3.2.3. Phenolic Acids and Phenolic Compounds

Compounds 35 (Figure S41, Supplementary Material) and 36 (Figure S42, Supplementary Material), were eluted at 6.20 min and 2.58 min, with the molecular ions [M − H] at m/z 442.07 (C22H18O10) and 295.23 (C16H25NO4), respectively; these were annotated as catechin gallate and esmolol, respectively, by comparing the retention times and MS/MS information with data from the literature [MassBank-BS-BS003891,55]. Compound 37 (Figure S43, Supplementary Material), detected at 1.46 min, with the precursor ion at [M − H] at m/z 293.18 and fragment ions at m/z 248, 237 and 209, was annotated as 6-gingerol [55]. Compounds 38 (Figure S44, Supplementary Material) and 39 (Figure S45, Supplementary Material), with molecular ions of m/z 277.20 [M − H] and m/z 305.92 [M − H] were found at 2.33 and 1.51 min, respectively. These compounds yielded the fragment ions at m/z 283, 233, and 205; m/z 289 and 221, and were annotated as 6-paradol and (−)-epigallocatechin in comparison with data from the literature [49,55].

3.2.4. Fatty Acids

The molecular ion peaks observed at m/z 339.94 [M − H] and m/z 311.22 [M − H]−, along with their corresponding fragment ion signals at m/z 337 and 319, and m/z 293, were annotated as behenic acid (40, Figure S46, Supplementary Material) and arachidic acid (41, Figure S47, Supplementary Material). This identification was achieved through comparative analysis with the retention times (tR) and mass spectral data published in the literature [63]. Eicosadienoic acid (42) and stearic acid (43) displayed mass spectral peaks at m/z 307.19 [M − H] and m/z 283.03 [M − H], respectively. UHPLC–Q Exactive Orbitrap MS revealed chemical product fragment ions at m/z 290 and 289 (Figure S48, Supplementary Material) and m/z 283 (Figure S49, Supplementary Material). These secondary metabolites were previously reported by Servi et al. (2022) [64] and MSBNK-Antwerp_Univ-METOX_N109326_B8BB, respectively.

3.2.5. Alkaloids and Others

Fragmentation analyses of yohimbic acid (44, m/z 321,297 [M − H]; C20H24N2O3) and isomajdine (45, m/z 397,381,285 [M − H]; C23H28N2O6) yielded precursor ions at m/z 339.12 (Figure S50, Supplementary Material; [65]) and m/z 427.18 (Figure S51, Supplementary Material; [66]). Compounds 46 (Figure S52, Supplementary Material) and 47 (Figure S53, Supplementary Material) were putatively annotated as delphinidin 3-galactoside (m/z 464.09 [M − H], [C21H21O12]+) and delphinidin-3-O-sambubioside (m/z 596.16 [M − H], [C26H29O16]+), respectively [67,68]. Additionally, molecular ions at m/z 675.30 [M − H] and m/z 974.90 [M − H] detected at retention times 2.78 min and 10.43 min were annotated as hederagenin base + O-AcetylHex (48, Figure S54, Supplementary Material, [69]) and (49, Figure S55, Supplementary Material, MassBank-RIKEN-PR308930). The annotation of compounds 50 (Figure S56, Supplementary Material), 51 (Figure S57, Supplementary Material) and 52 (Figure S58, Supplementary Material), detected at 1.91 min, 1.46 min and 1.52 min, respectively, revealed precursor ions at m/z 423.17 [M − H], m/z 533.38 [M − H] and m/z 339.07 [M − H] [55,70,71]. Furthermore, compounds 53 (tR = 1.31 min, C14H8O5), 54 (tR = 1.14 min, C20H20O6) and 55 (tR = 8.45 min, C24H34O4) exhibited precursor ions at m/z 255.23, m/z 355.16, m/z 386.88, which yielded characteristic fragment ions at m/z 226; m/z 353, 265 and 226; and m/z 431, respectively. These compounds were putatively annotated as purpurin (Figure S59, Supplementary Material, [72]), licoagrodione (Figure S60, Supplementary Material, [73]), and bufalin (Figure S61, Supplementary Material, [74]). In contrast, compound 56 (chlorogenic acid, C16H18O9), with a precursor ion at m/z 353.11, yielded the characteristic fragments ion at m/z 309, 295, and 283 (Figure S62, Supplementary Material, [50]).

3.3. Molecular Networking of Morinda lucida Metabolites

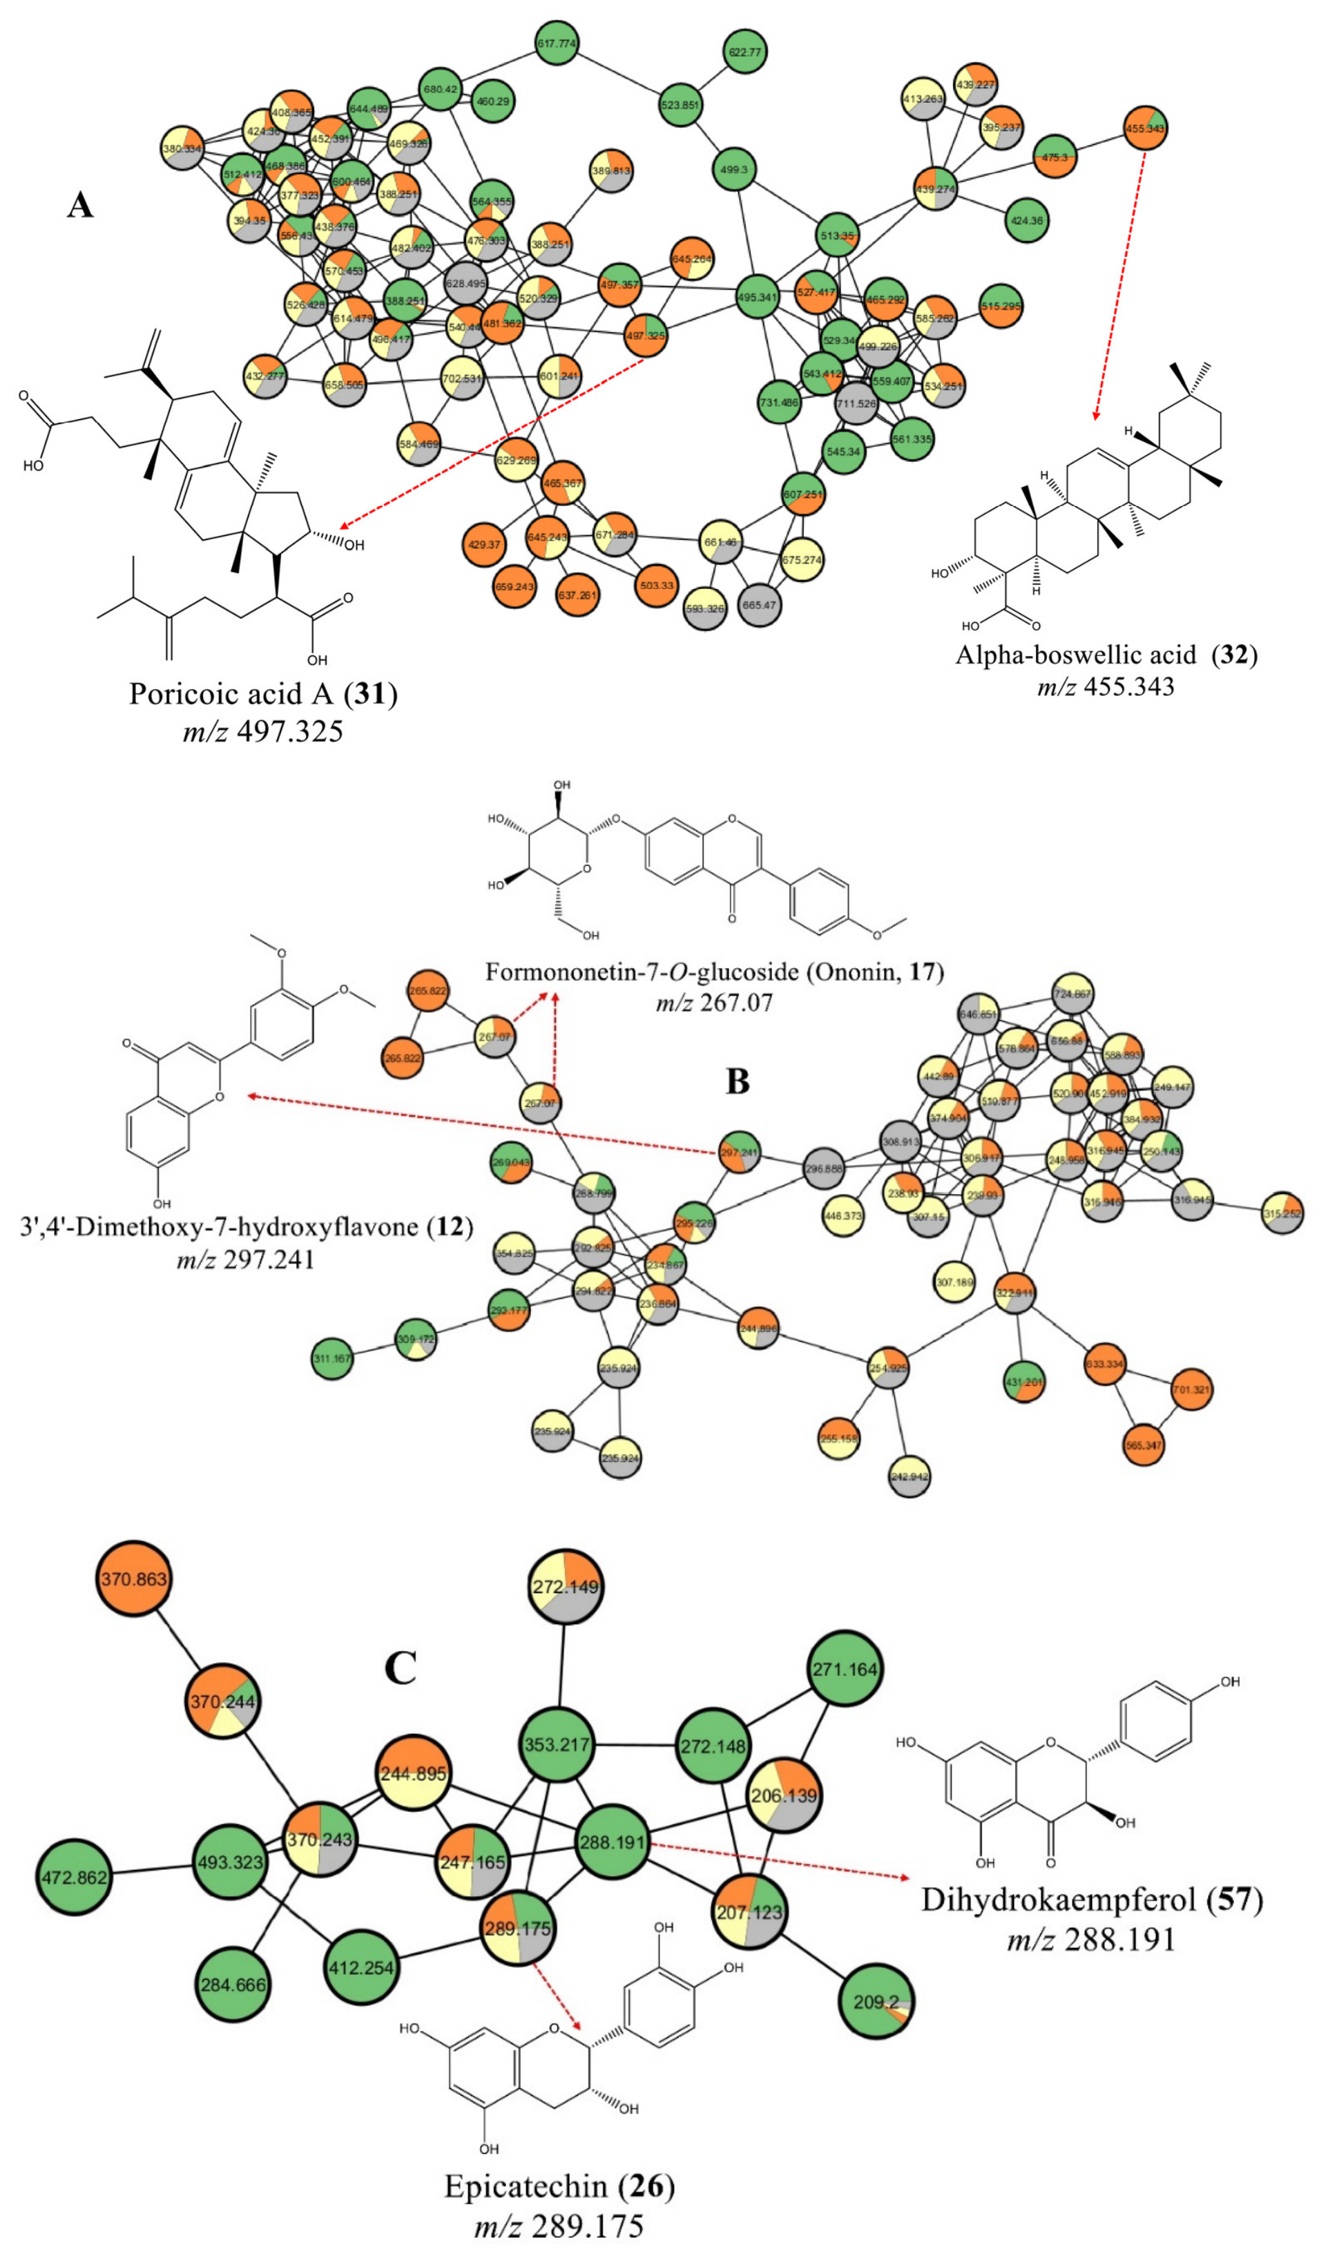
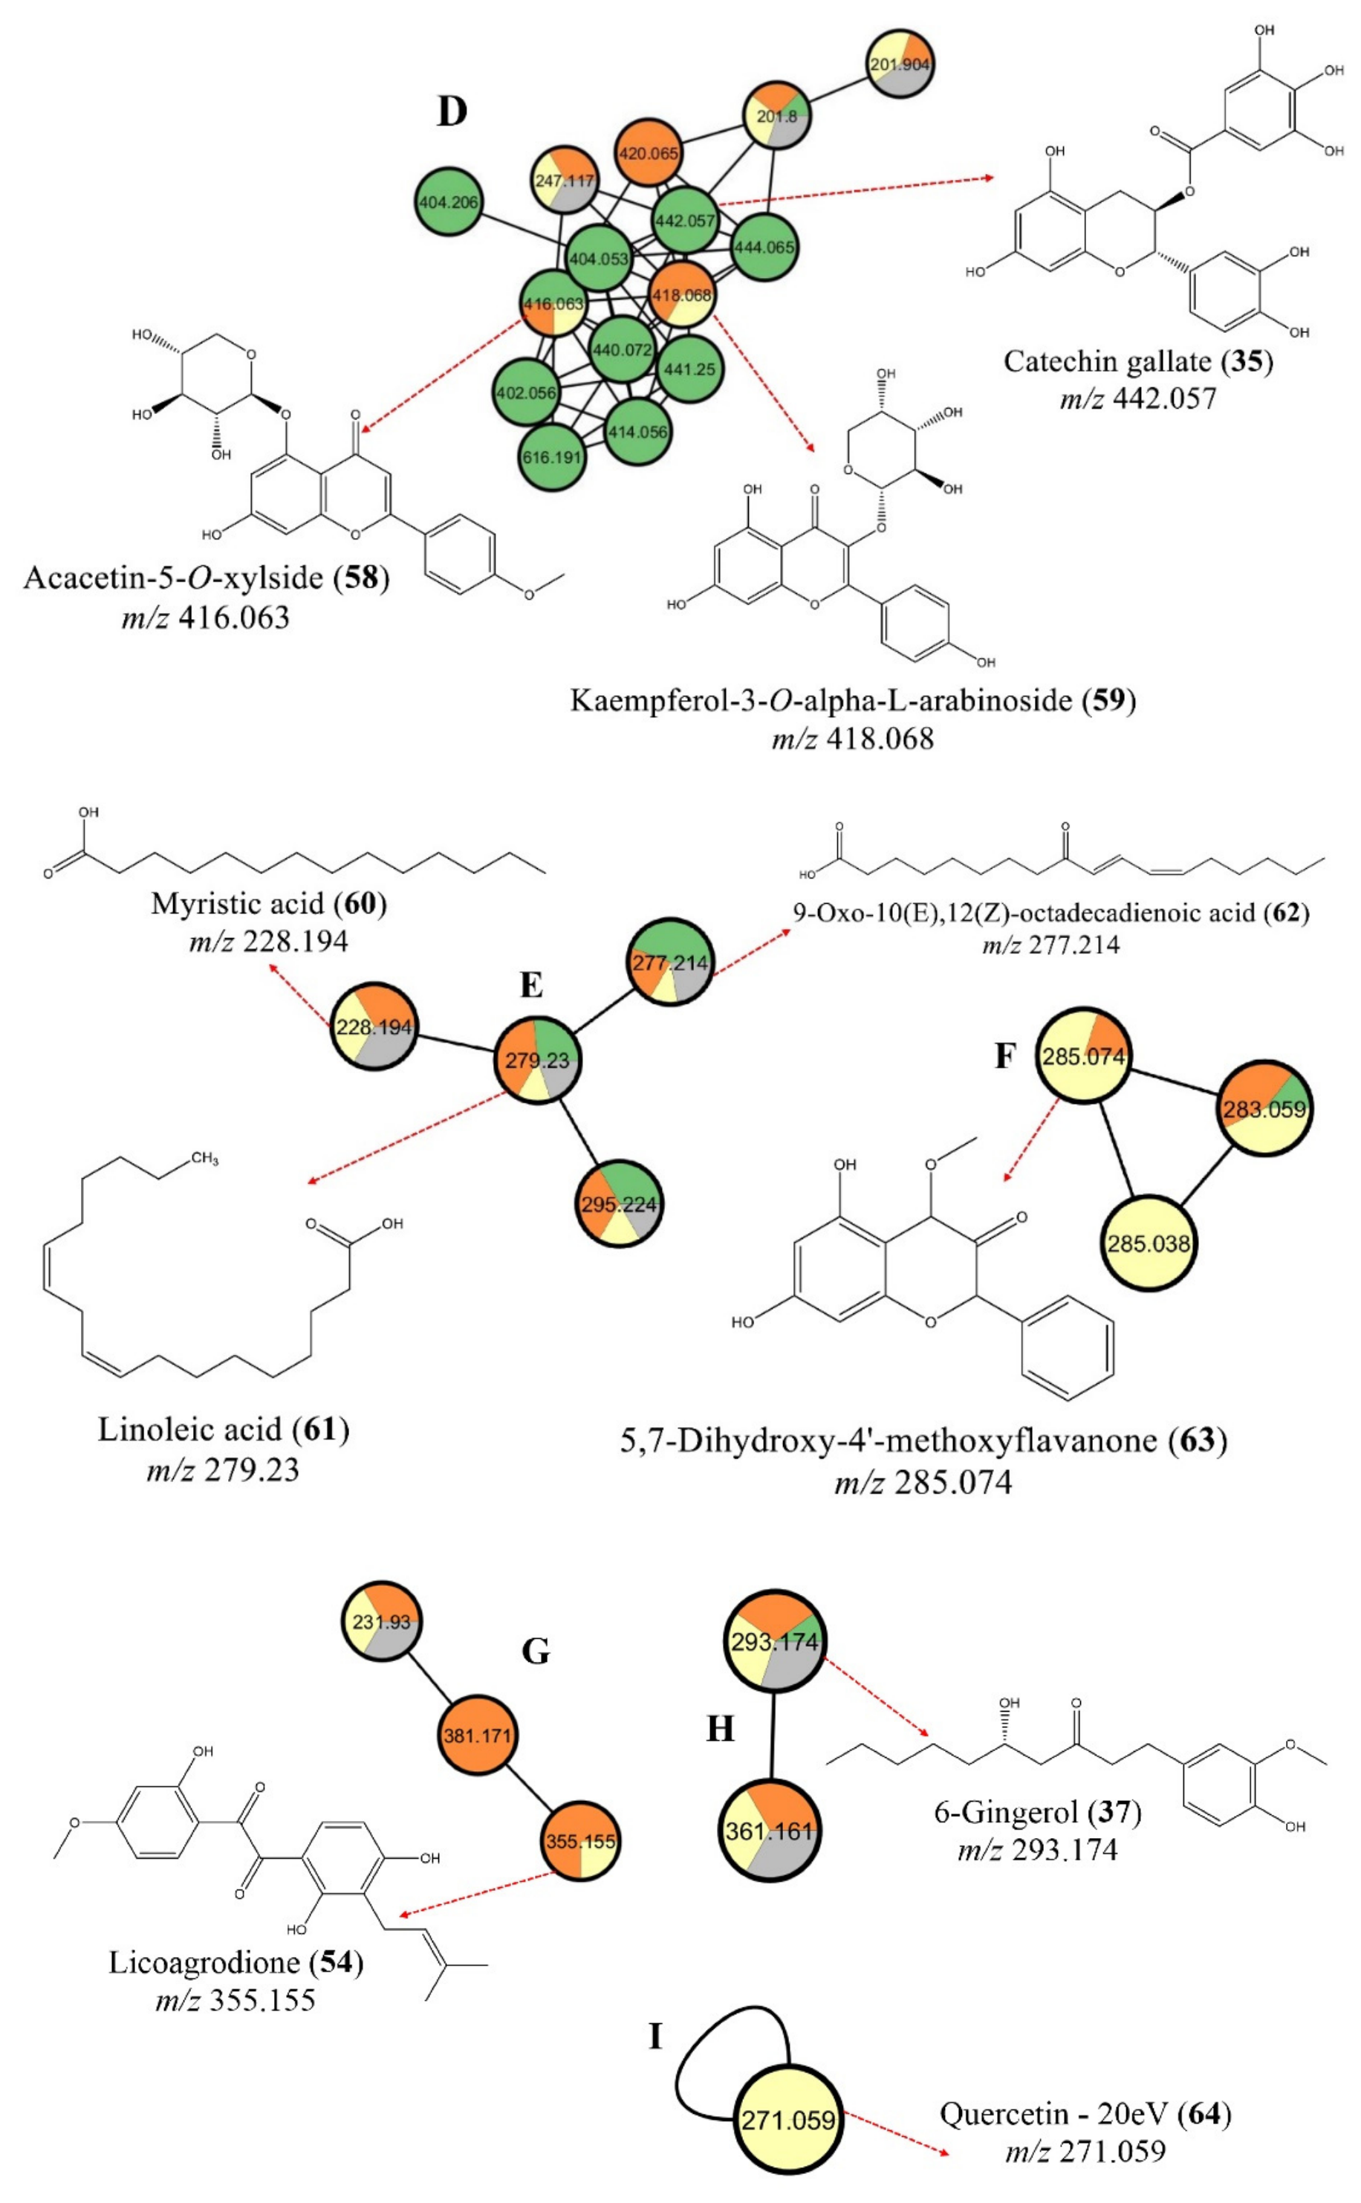
To explore the chemical profiles of Morinda species, various extracts from different plant parts of Morinda lucida, including leaves, root, and stem bark, were analyzed using UHPLC–Q Exactive Orbitrap MS. This analysis was completed by molecular networking in negative ESI mode via the Global Natural Products Social Networking (GNPS) platform (http://gnps.ucsd.edu, accessed on 7 July 2025). The UHPLC–Q Exactive Orbitrap MS chromatograms of both ESI (−/+); Figures S5 and S6) of the M. lucida crude extracts are included in the Supplementary Materials. A detailed molecular network was constructed based on converted MS2 data, which reflected the similarity in metabolite fragmentation patterns. The resulting molecular networks (Clusters AI) were visualized in Cytoscape version 3.9.1 [17], as shown in Figure 1. A total of 850 molecular ions exhibited MS2 spectra across four crude extracts, represented by nodes interconnected by 1258 edges within the molecular network.

3.4. Antioxidant Activity of M. lucida Extracts

As shown in Table 3, the root extract exhibited significant radical scavenging activity, exhibiting an IC50 value of 7.7550 ± 6.9142 µg/mL, while the methanol leaf extract showed the lowest radical scavenging activity, with an IC50 = 48.2661 ± 7.1855 µg/mL. The reducing power activity ranged from 0.0052 ± 0.0025 to 0.0487 ± 0.0212 µg/mL (IC0.5), in the following descending order: root extract > dichloromethane leaf extract > stem bark > methanol leaf extract (Table 3). Furthermore, the root extract exhibited high reducing power activity with an IC0.5 value of 0.0052 ± 0.0025 µg/mL, whereas the methanol leaf extract displayed the lowest reducing power activity (IC0.5 = 0.4146 ± 0.1429 µg/mL), as indicated in Table 3.

3.5. Inhibition of α-Glucosidase Activity of M. lucida Extracts and Computational Docking

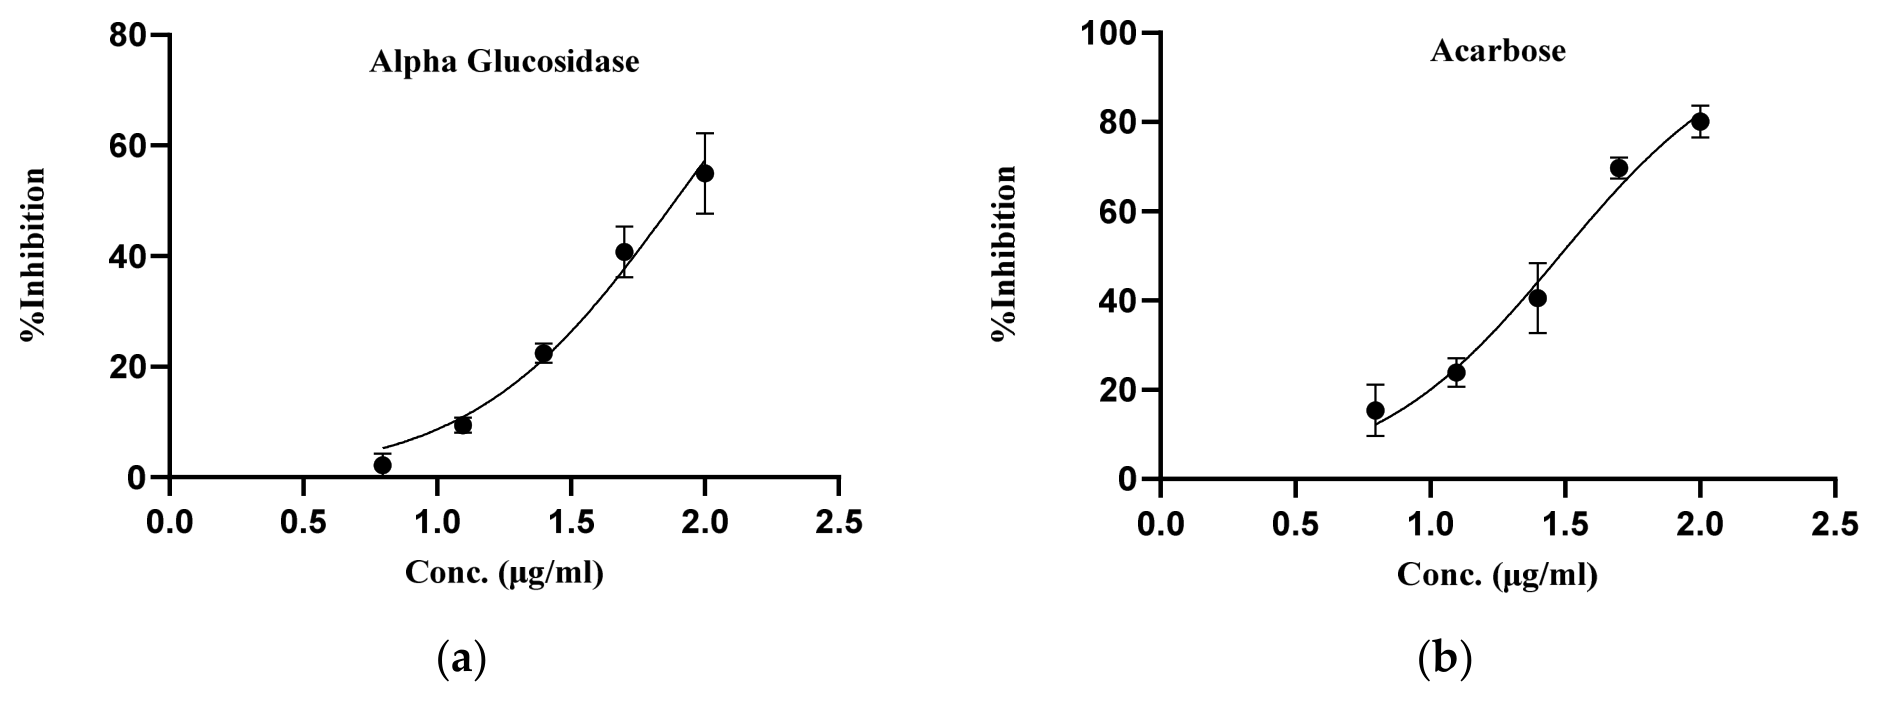
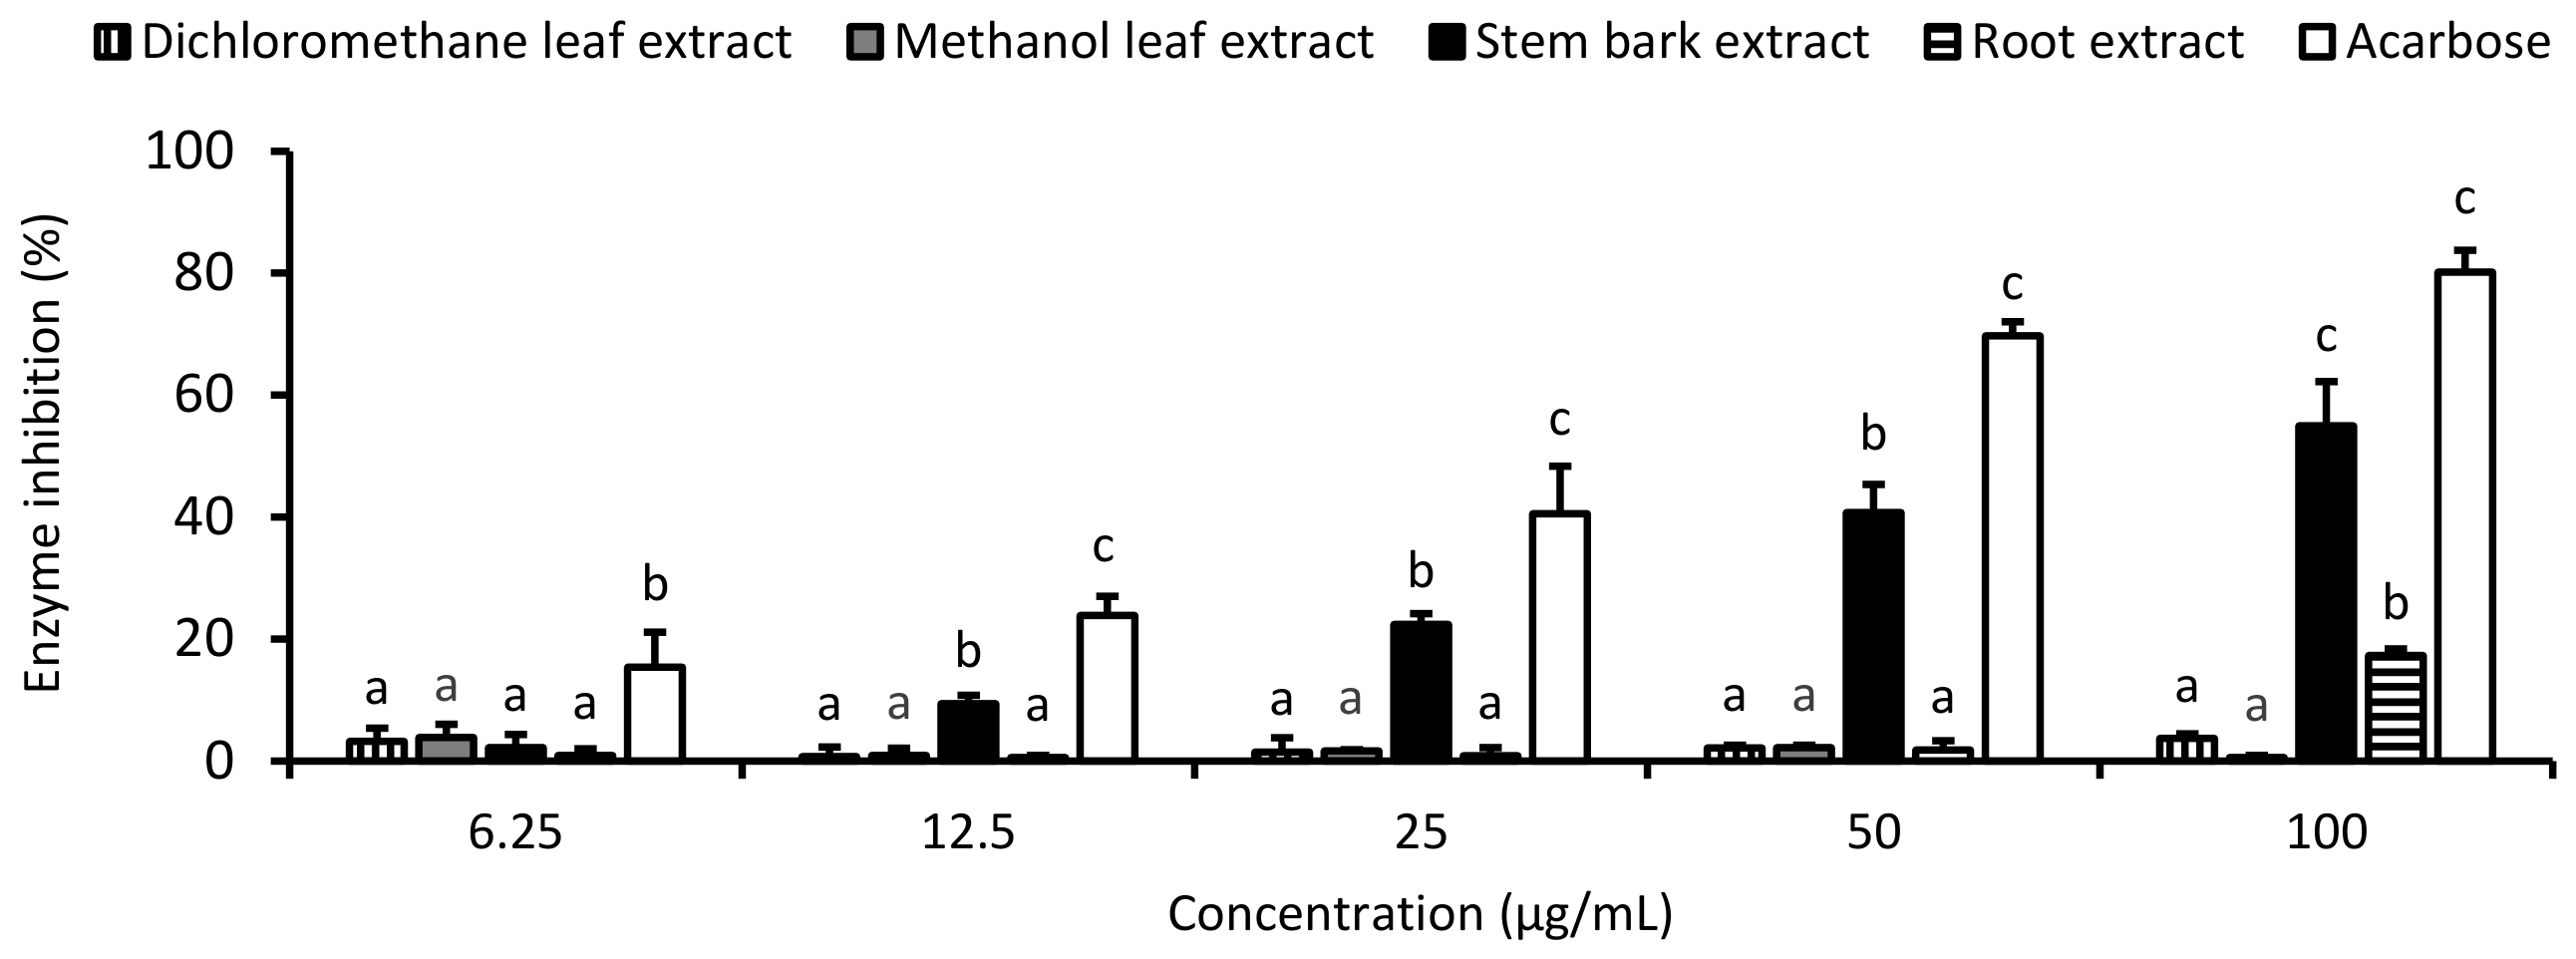
As shown in Figure 2 and Figure 3 and Table 4, the stem bark extract exhibited appreciable α-glucosidase inhibitory activity (IC50 = 79.9 ± 16.1 µg/mL), whereas the other extracts showed no notable α-glucosidase inhibition. However, the inhibitory activity of the stem bark extract was significantly lower (p ˂ 0.05) than that of acarbose (IC50 = 30.1 ± 4.00 µg/mL). In addition, flavonoid glycosides sophoricoside and formononetin 7-O-glucoside, together with epicatechin identified in the stem bark extract, showed notable in silico interactions with the α-glucosidase protein (Estimated Binding Energy = −7.5, −7.8 and −7.6 kcal/mol, respectively), which was comparable to that of acarbose (Estimated Binding Energy = −6.5 kcal/mol) Table 5 and Figure 4. The 3D visualization of the molecular docking analysis against 5NN5 for the isolated compounds are presented in Figure S63 of the Supplementary Material.

3.6. Cytotoxicity of the Crude Extracts of M. lucida

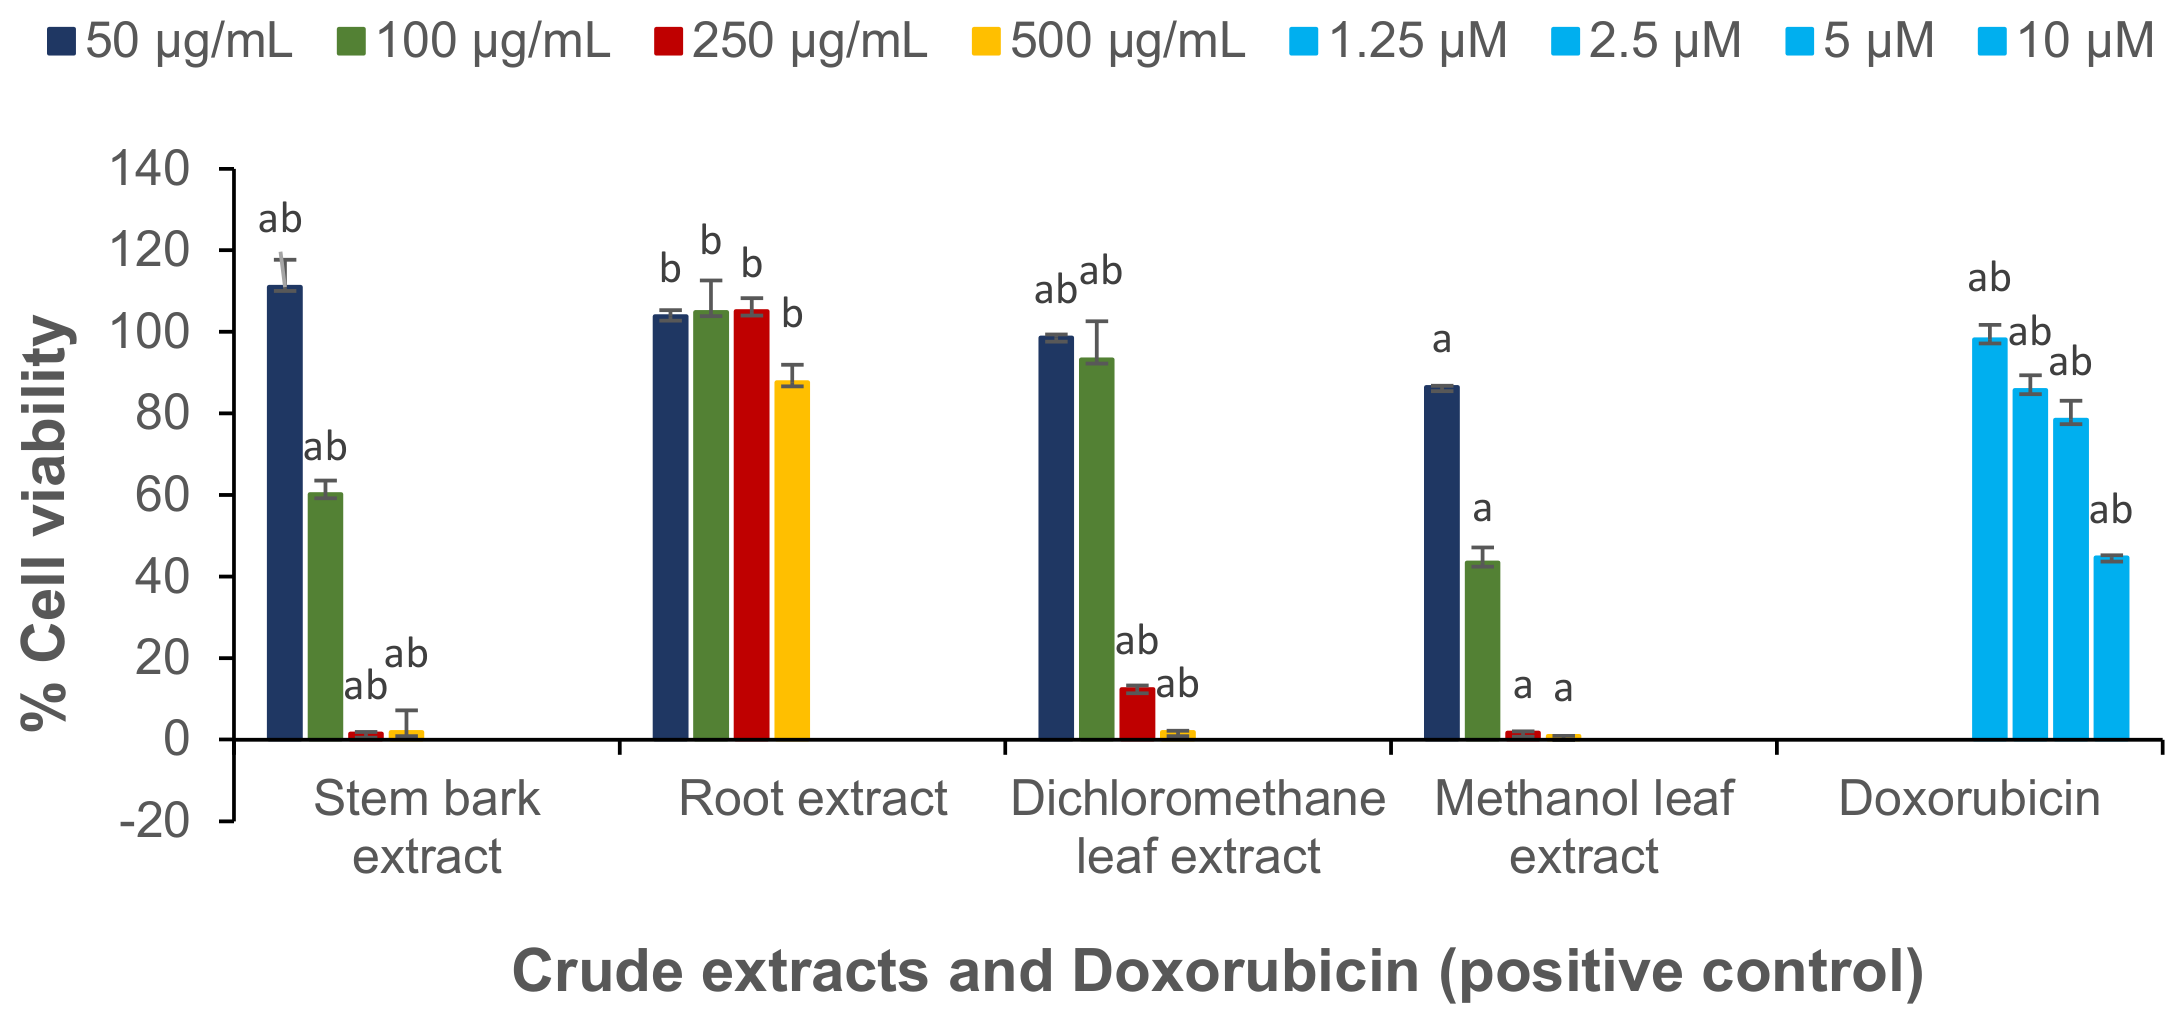
The cytotoxicity of M. lucida crude extracts was evaluated using the MTT assay against African green monkey (Vero) kidney cells (Figure 5). The cytotoxic concentration (CC50 in μg/mL, Table 6) was determined from the percentage of cell viability relative to that of the positive control (doxorubicin, Table 6 and Figure 5). As shown in Figure 5, at 50 μg/mL onward, no toxicity was observed in the root extract. In contrast, the stem bark and leaf extracts exhibited cytotoxicity at concentrations of 250 and 500 μg/mL (Figure 5).

4. Discussion

The study explored the metabolomic profile, antioxidant, α-glucosidase inhibitory, and cytotoxic activities of compounds from different plant parts of Morinda lucida. A wide range of metabolites were putatively annotated from the leaf, root, and stem bark extracts of M. lucida using 1H-NMR, UHPLC–Q Exactive Orbitrap MS, and molecular networking (refer to Table 1 and Table 2 and Figure 1). Most of these metabolites were annotated in the leaf extracts. Metabolomic profiling indicated that different Morinda lucida plant organs produced both similar and distinct chemical compounds.
The combination of GNPS-based molecular networking and manual confirmation facilitated the annotation of unique secondary metabolites from various plant parts of M. lucida. Compounds 5764 were annotated through GNPS, whereas compounds 12, 17, 26, 31, 32, 35, 37, and 54 were manually identified. Clusters A and B (Figure 1) were characterized by precursor ions with m/z values of 497.325 and 455.343; as well as 297.241 and 267.07, which were annotated as poricoic acid A (31) and alpha-boswellic acid (32), and 3′,4′-dimethoxy-7-hydroxyflavone (11) and formononetin-7-O-glucoside (Ononin, 16), respectively. In cluster C, the precursor ions at m/z 289.175 and m/z 288.191 were designated as epicatechin (26) and dihydrokaempferol (57). Cluster D included precursor ions with m/z values of 416.063, 418.068, and 442.057, which were annotated as acacetin-5-O-xyloside (58), kaempferol-3-O-alpha-L-arabinoside (59), and catechin gallate (35), respectively. Myristic acid (60), with a precursor ion at m/z 228.194, was identified in the dichloromethane extracts of leaves, roots, and stem bark (see cluster E, Figure 1). Additionally, linoleic acid (61) and 9-oxo-10(E),12(Z)-octadecadienoic acid (62), with precursor ions at m/z 279.23 and 277.214, were detected in all crude extracts (see cluster E, Figure 1). Compounds 63 (m/z 285.074 [M − H]) and 54 (m/z 355.155 [M − H]), annotated as 5,7-dihydroxy-4′-methoxyflavanone and licoagrodione, were exclusively found in the dichloromethane leaf and stem bark extracts (as shown in clusters F and G, Figure 1). In contrast, cluster H contained the metabolite at m/z 293.174, annotated as 6-gingerol (37), which was only present in the dichloromethane leaf, methanol leaf, stem bark, and root extracts. Cluster I included the precursor ion with m/z 271.059 [M − H], which was annotated as quercetin −20 eV (64).
The results from radical scavenging and reducing power assays showed that the presence of various compounds, including glabranine (1), apigenin 6-C-glucoside 8-C-arabinoside (2), isookanin-7-O-glucoside (3), myricetin-3-O-xyloside (4), isoschaftoside (7), 6,4′-limethoxyisoflavone-7-glucoside (Wistin, 8), luteolin 6-C-glucoside 8-C-arabinoside (9), pinocembrin (10), acacetin-7-O-rutinoside (Linarin, 11), 3′,4′-dimethoxy-7-hydroxyflavone (12), kaempferol-7-O-rhamnoside (14), apigenin 8-C-glucoside (Vitexin, 15), hyperoside (16), formononetin-7-O-glucoside (Ononin, 17), quercetin-3-O-glucoside (Isoquercitrin, 18), myricitrin (19), 7-hydroxy-3-methylflavone (21), eriodictyol-7-O-neohesperidoside (Neoeriocitrin, 22), quercetin-3-arabinoglucoside (Peltatoside, 23), quercetin-3-O-vicianoside (24), quercitrin (25), epicatechin (26), corosolic acid (28), medicagenic acid (34), 6-gingerol (37), (−)-epigallocatechin (39), behenic acid (40), eicosadienoic acid (42), stearic acid (43), arachidic acid (41), chlorogenic acid (56), delphinidin-3-O-sambubioside (47), and 5,7-dihydroxy-4′-methoxyflavanone (63) might have contributed to the antioxidant activities of the crude extracts. These phytochemicals have been previously documented for their antioxidant properties [75,76,77,78,79,80,81,82,83,84,85,86,87,88,89,90,91,92,93,94,95,96,97,98,99,100,101,102,103,104,105,106,107,108]. A study conducted by Nigussie et al. (2023) and Nwozo et al. (2023) indicated that the antioxidant capacities of numerous medicinal plant crude extracts are attributed to the high quality of phenolic compounds, flavonoids, and terpenoids [109,110]. The presence of hydroxyl groups (-OH) in phenolic compounds reacts with reactive nitrogen species (RNS) and oxygen species in a termination reaction, thereby inhibiting the formation of new radicals [111]. Kubiak-Tomaszewska et al. (2022) noted that esterification or blocking of hydroxyl groups (-OH) in the flavonoid structures diminishes their ability to scavenge free radicals or chelate metals [112]. Conversely, Zhou et al. (2022) reported that the varying numbers of unsaturated carbon–carbon double bonds (C=C) in terpenoids contribute to the strong antioxidant capacities of these secondary metabolites [113]. The findings of this study reveal that the IC50 and IC0.5 values of the different crude extracts of M. lucida were significantly lower than those of gallic acid, quercetin, and ascorbic acid, as determined through DPPH (2,2-diphenyl-1-picrylhydrazin) scavenging and reducing power assays. This suggests that M. lucida may serve as a valuable antioxidant in the treatment of free radicals.
Moreover, the results from the α-glucosidase inhibitory assay revealed that the presence of metabolites, including epicatechin (26), formononetin-7-O-glucoside (Ononin, 17), and quercetin −20 eV (64) may have contributed to the α-glucosidase inhibitory activity of the stem bark extract. This is consistent with several studies reporting the anti-diabetic activity of these compounds through α-glucosidase inhibition [114,115,116,117]. Olaokun and Zubair (2023) reported that epicatechin (26), isolated from the ethyl acetate fraction of Ficus lutea leaf extract by silica gel column chromatography, exhibited potent α-glucosidase inhibitory activity (IC50 = 5.72 ± 2.7 µg/mL, [114]). Similarly, Zhang et al. (2022) reported that epicatechin (26), tentatively identified in the ethanol extract of Senegalia catechu, contributed to the inhibition of α-glucosidase activity of this plant species [115]. Dilshad et al. (2023) demonstrated that formononetin-7-O-glucoside (Ononin, 17), identified by reverse-phase ultra-high-performance liquid chromatography–MS (RP-UHPLC–MS), contributed to the inhibition of α-glucosidase activity of the methanolic extract of Typha domingensis [116]. Furthermore, Bouslamti et al. (2023) reported that quercetin −20 eV (64), detected by high-performance liquid chromatography with a diode array detector (HPLC-DAD), contributed to the α-glucosidase inhibitory activity of the hydroethanolic leaf, fruit, and flower extracts of Solanum elaeagnifolium Cav [117]. Molecular docking results support the possible contribution of sophoricoside, formononetin 7-O-glucoside, and epicatechin to the α-glucosidase inhibitory activity of the stem bark.
The results of the cytotoxicity test demonstrated that the stem bark and leaf extracts were more toxic to African green monkey (Vero) kidney cells than the root extract at different concentrations (Figure 5). This might be due to the presence of isoschaftoside (7), formononetin-7-O-glucoside (Ononin, 17), myricitrin (19), quercetin-3-O-vicianoside (24), quercitrin (25), corosolic acid (28), maslinic acid (30), medicagenic acid (34), behenic acid (40), eicosadienoic acid (42), isomajdine (45), delphinidin-3-O-sambubioside (47), bufalin (55), and chlorogenic acid (56), which were detected in the stem bark and root extracts. This is consistent with several studies reporting the cytotoxicity of these natural compounds [90,100,104,118,119,120,121,122,123,124]. According to Ahmadi et al. (2021) and Rasool et al. (2023), no natural products or crude plant extracts should be regarded as safe until they are evaluated for cellular toxicity [125,126]. Furthermore, it is important to assess the cytotoxicity of natural products using more than one cell line, as conclusions regarding the efficacy and safety of a natural product based on a single cell line may be misleading.

5. Conclusions

1H-NMR- and UHPLC–Q Exactive Orbitrap MS-based metabolomics combined with molecular networking and molecular docking analysis were used to annotate metabolites associated with the antioxidant, α-glucosidase inhibitory, and cytotoxic activities of different plant parts of M. lucida. A total of 77 metabolites were annotated using the 1H-NMR, UHPLC–Q Exactive Orbitrap MS, and molecular networking approaches. Phytochemical profiling revealed both similarities and differences in the compounds produced by different plant parts of M. lucida. Additionally, the findings indicated that root extracts exhibited significantly higher antioxidant activities compared with leaf and stem bark extracts. The study also demonstrated that stem bark extracts provided notable inhibition of α-glucosidase, potentially attributed to the identified flavonoid glycosides (sophoricoside and formononetin 7-O-glucoside) and epicatechin. Furthermore, the in silico interactions between these compounds and the α-glucosidase protein were stronger than those of acarbose. The findings of this study indicate that flavonoids, flavonoid glycosides, terpenoids, phenolic compounds, polyphenols, saturated fatty acids, quinic acids, anthocyanins, alkaloids, and bufadienolides contribute to antioxidant and α-glucosidase activities, as well as the cytotoxicity of M. lucida. These findings provide strong scientific support for the use of analytical techniques such as 1H-NMR and UHPLC–Q Exactive Orbitrap MS to expedite drug discovery and development. Further research is recommended to isolate and validate the annotated phytochemicals, investigate phytochemicals in various Morinda species, and assess their bioactivities through in vitro, in vivo, and in silico experiments to identify and develop potential drug candidates.

Supplementary Materials

The following supporting information can be downloaded at https://www.mdpi.com/article/10.3390/metabo16080523/s1, Figure S1: (A) The representative 1H-NMR spectra of the dichloromethane leaf extract. 1, hexadecanedioic acid; (B) The representative 1H-NMR spectra of the dichloromethane leaf extract. 2, α-linoleic acid; (C) The representative 1H-NMR spectra of the dichloromethane leaf extract. 3, leucine; (D) The representative 1H-NMR spectra of the dichloromethane leaf extract. 4, valine; (E) The representative 1H-NMR spectra of the dichloromethane leaf extract. 6, alanine; (F) The representative 1H-NMR spectra of the dichloromethane leaf extract. 9, trehalose; Figure S2: (A) The representative 1H-NMR spectra of the methanol leaf extract. 1, hexadecanedioic acid; (B) The representative 1H-NMR spectra of the methanol leaf extract. 3, leucine; (C) The representative 1H-NMR spectra of the methanol leaf extract. 4, valine; (D) The representative 1H-NMR spectra of the methanol leaf extract. 7, rhamnose; Figure S3: (A) The representative 1H-NMR spectra of the stem bark extract. 1, hexadecanedioic acid; 3, leucine; 4, valine; (B) The representative 1H-NMR spectra of the stem bark extract. 7, rhamnose; 8, sucrose; 9, trehalose; 10, fructose; 11, glucose; (C) The representative 1H-NMR spectra of the stem bark extract. 12, chlorogenic acid; (D) The representative 1H-NMR spectra of the stem bark extract. 12, chlorogenic acid; 13, quercetin; Figure S4: The representative 1H-NMR spectra of the root extract. 5, betaine; 8, sucrose; 9, trehalose; Figure S5: UHPLC–Q/Orbitrap/MS HRMS chromatograms with relative abundance and retention time (min) of (1) dichloromethane leaf; (2) methanol leaf; (3); stem bark and (4) root extracts of Morinda lucida obtained in positive mode electrospray ionization; Figure S6: UHPLC–Q/Orbitrap/MS HRMS chromatograms with relative abundance and retention time (min) of (1) dichloromethane leaf; (2) methanol leaf; (3) stem bark; and (4) root extracts of Morinda lucida obtained in negative mode electrospray ionization; Figure S7: UHPLC–Q/Orbitrap/MS HRMS spectrum showing fragments of glabranine (1); Figure S8: UHPLC–Q/Orbitrap/MS HRMS spectrum showing fragments of apigenin 6-C-glucoside 8-C-arabinoside (2); Figure S9: UHPLC–Q/Orbitrap/MS HRMS spectrum showing fragments of isookanin-7-O-glucoside (3); Figure S10: UHPLC–Q/Orbitrap/MS HRMS spectrum showing fragments of myricetin-3-O-xyloside (4); Figure S11: UHPLC–Q/Orbitrap/MS HRMS spectrum showing fragments of gossypetin-8-C-glucoside (5); Figure S12: UHPLC–Q/Orbitrap/MS HRMS spectrum showing fragments of 8-prenylnaringenin (6); Figure S13: UHPLC–Q/Orbitrap/MS HRMS spectrum showing fragments of isoschaftoside (7); Figure S14: UHPLC–Q/Orbitrap/MS HRMS spectrum showing fragments of 6,4′-dimethoxyisoflavone-7-glucoside (Wistin) (8); Figure S15: UHPLC–Q/Orbitrap/MS HRMS spectrum showing fragments of luteolin 6-C-glucoside 8-C-arabinoside (9); Figure S16: UHPLC–Q/Orbitrap/MS HRMS spectrum showing fragments of pinocembrin (10); Figure S17: UHPLC–Q/Orbitrap/MS HRMS spectrum showing fragments of acacetin-7-O-rutinoside (Linarin) (11); Figure S18: UHPLC–Q/Orbitrap/MS HRMS spectrum showing fragments of 3′,4′-dimethoxy-7-hydroxyflavone (12); Figure S19: UHPLC–Q/Orbitrap/MS HRMS spectrum showing fragments of sophoricoside (13); Figure S20: UHPLC–Q/Orbitrap/MS HRMS spectrum showing fragments of kaempferol-7-O-rhamnoside (14); Figure S21: UHPLC–Q/Orbitrap/MS HRMS spectrum showing fragments of apigenin 8-C-glucoside (Vitexin) (15); Figure S22: UHPLC–Q/Orbitrap/MS HRMS spectrum showing fragments of hyperoside (16); Figure S23: UHPLC–Q/Orbitrap/MS HRMS spectrum showing fragments of formononetin-7-O-glucoside (Ononin) (17); Figure S24: UHPLC–Q/Orbitrap/MS HRMS spectrum showing fragments of quercetin-3-O-glucoside (Isoquercitrin) (18); Figure S25: UHPLC–Q/Orbitrap/MS HRMS spectrum showing fragments of myricitrin (19); Figure S26: UHPLC–Q/Orbitrap/MS HRMS spectrum showing fragments of luteone 7-glucoside (20); Figure S27: UHPLC–Q/Orbitrap/MS HRMS spectrum showing fragments of 7-hydroxy-3-methylflavone (21); Figure S28: UHPLC–Q/Orbitrap/MS HRMS spectrum showing fragments of eriodictyol-7-O-neohesperidoside (Neoeriocitrin) (22); Figure S29: UHPLC–Q/Orbitrap/MS HRMS spectrum showing fragments of quercetin-3-arabinoglucoside (Peltatoside) (23); Figure S30: UHPLC–Q/Orbitrap/MS HRMS spectrum showing fragments of quercetin-3-O-vicianoside (24); Figure S31: UHPLC–Q/Orbitrap/MS HRMS spectrum showing fragments of quercitrin (25); Figure S32: UHPLC–Q/Orbitrap/MS HRMS spectrum showing fragments of epicatechin (26); Figure S33: UHPLC–Q/Orbitrap/MS HRMS spectrum showing fragments of 3-O-acetyl-16alpha-hydroxydehydrotrametenolic acid (27); Figure S34: UHPLC–Q/Orbitrap/MS HRMS spectrum showing fragments of corosolic acid (28); Figure S35: UHPLC–Q/Orbitrap/MS HRMS spectrum showing fragments of sumaresinolic acid (29); Figure S36: UHPLC–Q/Orbitrap/MS HRMS spectrum showing fragments of maslinic acid (30); Figure S37: UHPLC–Q/Orbitrap/MS HRMS spectrum showing fragments of poricoic acid A (31); Figure S38: UHPLC–Q/Orbitrap/MS HRMS spectrum showing fragments of alpha-boswellic acid (32); Figure S39: UHPLC–Q/Orbitrap/MS HRMS spectrum showing fragments of poricoic acid B (33); Figure S40: UHPLC–Q/Orbitrap/MS HRMS spectrum showing fragments of medicagenic acid (34); Figure S41: UHPLC–Q/Orbitrap/MS HRMS spectrum showing fragments of catechin gallate (35); Figure S42: UHPLC–Q/Orbitrap/MS HRMS spectrum showing fragments of esmolol (36); Figure S43: UHPLC–Q/Orbitrap/MS HRMS spectrum showing fragments of 6-gingerol (37); Figure S44: UHPLC–Q/Orbitrap/MS HRMS spectrum showing fragments of 6-paradol (38); Figure S45: UHPLC–Q/Orbitrap/MS HRMS spectrum showing fragments of (−)-epigallocatechin (39); Figure S46: UHPLC–Q/Orbitrap/MS HRMS spectrum showing fragments of behenic acid (40); Figure S47: UHPLC–Q/Orbitrap/MS HRMS spectrum showing fragments of arachidic acid (41); Figure S48: UHPLC–Q/Orbitrap/MS HRMS spectrum showing fragments of eicosadienoic acid (42); Figure S49: UHPLC–Q/Orbitrap/MS HRMS spectrum showing fragments of stearic acid (43); Figure S50: UHPLC–Q/Orbitrap/MS HRMS spectrum showing fragments of yohimbic acid (44); Figure S51: UHPLC–Q/Orbitrap/MS HRMS spectrum showing fragments of isomajdine (45); Figure S52: UHPLC–Q/Orbitrap/MS HRMS spectrum showing fragments of delphinidin 3-galactoside (46); Figure S53: UHPLC–Q/Orbitrap/MS HRMS spectrum showing fragments of delphinidin-3-O-sambubioside (47); Figure S54: UHPLC–Q/Orbitrap/MS HRMS spectrum showing fragments of hederagenin base + O-AcetylHex (48); Figure S55: UHPLC–Q/Orbitrap/MS HRMS spectrum showing fragments of bayogenin base + O-Hex, O-Hex-Hex (49); Figure S56: UHPLC–Q/Orbitrap/MS HRMS spectrum showing fragments of 3-glucosyl-2,3′,4,4′,6- pentahydroxybenzophenone (50); Figure S57: UHPLC–Q/Orbitrap/MS HRMS spectrum showing fragments of 6ʹʹ -O-malonylgenistin (51); Figure S58: UHPLC–Q/Orbitrap/MS HRMS spectrum showing fragments of 6,7-dihydroxycoumarin-6-glucoside (Esculin) (52); Figure S59: UHPLC–Q/Orbitrap/MS HRMS spectrum showing fragments of purpurin (53); Figure S60: UHPLC–Q/Orbitrap/MS HRMS spectrum showing fragments of licoagrodione (54); Figure S61: UHPLC–Q/Orbitrap/MS HRMS spectrum showing fragments of bufalin (55); Figure S62: UHPLC–Q/Orbitrap/MS HRMS spectrum showing fragments of chlorogenic acid (56); Figure S63: 3D visualization for molecular docking against 5NN5 for the isolated compounds.

Author Contributions

Conceptualization, D.T., N.M., I.T.M., and M.M.; methodology, D.T. and C.I.C.; formal analysis, R.C.C. and K.O.; writing—original draft preparation, D.T.; writing—review and editing, D.T., N.M., I.T.M., M.M., C.I.C., R.C.C., and K.O.; funding acquisition, N.M. All authors have read and agreed to the published version of the manuscript.

Funding

This work was financially supported by the German Federal Ministry of Education and Research (BMBF)/Southern African Science Service Centre for Climate Change and Adaptative Land Management (SASSCAL), the National Research Foundation (NRF), and Central University of Technology, Free State’s University Research Grants and Scholarship Committee (RGSC).

Institutional Review Board Statement

Not applicable.

Informed Consent Statement

Not applicable.

Data Availability Statement

Data are contained within the article and Supplementary Materials.

Conflicts of Interest

The authors declare no conflicts of interest.

References

  1. Chokki, M.; Zongo, C.; Dah-Nouvlessounon, D.; Cudălbeanu, M.; Noumavo, P.M.; Ghinea, I.O.; Furdui, B.; Savadogo, A.; Dinica, R.M.; Baba-Moussa, L.; et al. Phytochemical screening and antimicrobial activity of Momordica charantia L. and Morinda lucida Benth extracts from Benin. Afr. J. Microbiol. Res. 2020, 14, 426–435. [Google Scholar] [CrossRef] [Scilit]
  2. Adewole, K.E.; Attah, A.F.; Adebayo, J.O. Morinda lucida Benth (Rubiaceae): A review of its ethnomedicine, phytochemistry and pharmacology. J. Ethnopharm. 2021, 276, 114055. [Google Scholar] [CrossRef] [Scilit]
  3. Del Vecchio, G.; Zhang, L.; Sinan, K.I.; Terzic, M.; Zengin, G.; Bene, K.; Mahomoodally, M.F.; Lucini, L. Different extraction methods shape the phenolic signature and biological activity of Morinda lucida extracts: A novel source of bioactive compounds preparing functional applications. Food Chem. 2025, 462, 140956. [Google Scholar] [CrossRef] [Scilit] [PubMed]
  4. Oladeji, O.S.; Oluyori, A.P.; Dada, A.O. Antiplasmodial activity of Morinda lucida Benth. Leaf and bark extracts against Plasmodium berghei infected mice. Saudi J. Biol. Sci. 2022, 29, 2475–2482. [Google Scholar] [CrossRef] [Scilit] [PubMed]
  5. Mfonku, N.A.; Mbah, J.A.; Kodjio, N.; Gatsing, D.; Zhan, J. Isolation and selective glycosylation of antisalmonellal anthraquinones from the stem bark of Morinda lucida Benth. (Rubiaceae). Phytochem. Lett. 2020, 37, 80–84. [Google Scholar] [CrossRef] [Scilit]
  6. Tlhapi, D.; Malebo, N.; Manduna, I.T.; Lautenschläger, T.; Mawunu, M. A review of medicinal plants used in the management of microbial infections in Angola. Plants 2024, 13, 2991. [Google Scholar] [CrossRef] [Scilit] [PubMed]
  7. Mondal, S.; Das, M.; Debnath, S.; Sarkar, B.K.; Babu, G. An overview of extraction, isolation and characterization techniques of phytocompounds from medicinal plants. Nat. Prod. Res. 2024, 40, 1939–1961. [Google Scholar] [CrossRef] [Scilit] [PubMed]
  8. Suthar, P.; Panwar, A.; Kumar, A.; Sharma, V.; Kumar, S. Isolation and characterization of polyphenols. In Phytochemicals: Extraction, Quantification, Isolation, and Characterization; Kumar, A., Tomer, V., Babele, P.K., Eds.; Methods and Protocols in Food Science; Humana: New York, NY, USA, 2026. [Google Scholar] [CrossRef] [Scilit]
  9. Mutha, R.E.; Kalaskar, M.; Khan, Z.G. Modern analytical techniques for quality control and chemical identification of phytochemicals. In Pharmacognosy and Phytochemistry: Principles, Techniques, and Clinical Applications; Odoh, U.E., Gurav, S.S., Chukwuma, M.O., Eds.; Wiley: Hoboken, NJ, USA, 2025. [Google Scholar]
  10. Budhathoki, R.; Timilsina, A.P.; Regmi, B.P.; Sharma, K.R.; Aryal, N.; Parajuli, N. Metabolome mining of Curcuma longa L. Using HPLC-MS/MS and molecular networking. Metabolites 2023, 13, 898. [Google Scholar] [CrossRef] [Scilit] [PubMed]
  11. Abd Ghafar, S.Z.; Muthukrishnan, S.; Zolkeflee, N.K.Z.; Natrah, I.; Abas, F. Identification of metabolites from Halamphora Sp. and its correlation with quorum sensing inhibitory activity via UHPLC-ESI-MS/MS-based metabolomics and molecular networking. Chem. Biodivers. 2025, 22, e202402282. [Google Scholar] [PubMed]
  12. Li, X.; Wang, P.; Tong, Y.; Liu, J.; Shu, G. UHPLC-Q-Exactive Orbitrap MS/MS-based untargeted metabolomics and molecular networking reveal the differential chemical constituents of the bulbs and flowers of Fritillaria thunbergii. Molecules 2022, 27, 6944. [Google Scholar] [CrossRef] [Scilit] [PubMed]
  13. Perez De Souza, L.; Alseekh, S.; Brotman, Y.; Fernie, A.R. Network-based strategies in metabolomics data analysis and interpretation: From molecular networking to biological interpretation. Expert Rev. Proteom. 2020, 17, 243–255. [Google Scholar] [CrossRef] [Scilit]
  14. Singh, I.S.; Muzyamba, S. GC-MS, GNPS and METLIN assisted phytochemical profiling, bioactivity study and molecular docking analysis of Paropsia brazzeana root bark, a medicinal plant in Zambia. Syst. Rev. Pharm. 2024, 15, 1–14. [Google Scholar]
  15. Kazeem, M.I.; Adamson, J.O.; Ogunwande, I.A. Modes of inhibition of α-amylase and α-glucosidase by aqueous extract of Morinda lucida Benth leaf. BioMed Res. Int. 2013, 2013, 527570. [Google Scholar] [CrossRef] [Scilit] [PubMed]
  16. Adefegha, S.A.; Molehin, O.R. Inhibitory activities of brimstone (Morinda lucida) roots extract on α-amylase and α-glucosidase-in vitro. Vegetos 2017, 30, 105–109. [Google Scholar] [CrossRef] [Scilit]
  17. Spohr, P.; Dinkla, K.; Klau, G.W.; El-Kebir, M. eXamine: Visualizing annotated networks in Cytoscape. F1000Research 2018, 7, 519. [Google Scholar] [CrossRef] [Scilit] [PubMed]
  18. Mintsa, M.E.; N’nang, E.O.; Choque, É.; Siah, A.; Jacquin, J.; Muchembled, J.; Molinié, R.; Roulard, R.; Cailleu, D.; Beniddir, M.A.; et al. Combined LC-MS/MS and molecular networking approach reveals antioxidant and antimicrobial compounds from Erismadelphus exsul bark. Plants 2022, 11, 1505. [Google Scholar] [CrossRef] [Scilit]
  19. Dah-Nouvlessounon, D.; Chokki, M.; Noumavo, A.D.P.; Cârâc, G.; Furdui, B.; Sina, H.; Zongo, C.; Savadogo, A.; Baba-Moussa, L.; Dinica, R.M.; et al. Ethnopharmacological value and biological activities via antioxidant and anti-protein denaturation activity of Morinda lucida Benth and Momordica charantia L. leaves extracts from Benin. Plants 2023, 12, 1228. [Google Scholar] [CrossRef] [Scilit] [PubMed]
  20. Motloung, D.M.; Mashele, S.S.; Matowane, G.R.; Swain, S.S.; Bonnet, S.L.; Noreljaleel, A.E.M.; Oyedemi, S.O.; Chukwuma, C.I. Synthesis, characterization, antidiabetic and antioxidative evaluation of a novel Zn(II)-gallic acid complex with multi-facet activity. J. Pharm. Pharmacol. 2020, 72, 1412–1426. [Google Scholar] [CrossRef] [Scilit] [PubMed]
  21. Pettersen, E.F.; Goddard, T.D.; Huang, C.C.; Meng, E.C.; Couch, G.S.; Croll, T.I.; Morris, J.H.; Ferrin, T.E. UCSF ChimeraX: Structure visualization for researchers, educators, and developers. Protein Sci. 2021, 30, 70–82. [Google Scholar] [PubMed]
  22. Trott, O.; Olson, A.J. AutoDock Vina: Improving the speed and accuracy of docking with a new scoring function, efficient optimization, and multithreading. J. Comput. Chem. 2010, 31, 455–461. [Google Scholar] [PubMed]
  23. Tolosa, L.; Donato, M.T.; Gómez-Lechón, M.J. General cytotoxicity assessment by means of the MTT assay. In Protocols in In Vitro Hepatocyte Research; Vinken, M., Rogiers, V., Eds.; Methods in Molecular Biology; Humana Press: New York, NY, USA, 2015; Volume 1250. [Google Scholar]
  24. Purushothaman, R.; Vishnuram, G.; Ramanathan, T. Antiinflammatory efficacy of n-Hexadecanoic acid from a mangrove plant Excoecaria agallocha L. through in silico, in vitro and in vivo. Pharmacol. Res. Nat. Prod. 2025, 7, 100203. [Google Scholar] [CrossRef] [Scilit]
  25. Hama, J.R.; Fitzsimmons-Thoss, V. Determination of unsaturated fatty acids composition in walnut (Juglans regia L.) oil using NMR spectroscopy. Food Anal. Methods 2022, 15, 1226–1236. [Google Scholar] [CrossRef] [Scilit]
  26. Nkobole, N.; Prinsloo, G. 1H-NMR and LC-MS based metabolomics analysis of wild and cultivated Amaranthus spp. Molecules 2021, 26, 795. [Google Scholar] [CrossRef] [Scilit] [PubMed]
  27. Ain Ibrahim, N.N.; Kamal, N.; Mediani, A.; Sajak, A.A.B.; Lee, S.Y.; Shaari, K.; Rahman, H.A. 1H NMR-based metabolomics approach revealing metabolite variation of black turmeric (Curcuma caesia) extracts and correlation with its antioxidant and α-glucosidase inhibitory activities. Food Technol. Biotechnol. 2023, 61, 104–117. [Google Scholar] [CrossRef] [Scilit]
  28. Shi, J.; Gao, X.; Zhang, A.; Qin, X.; Du, G. Characterization of multiple chemical components of GuiLingJi by UHPLC-MS and 1H-NMR analysis. J. Pharm. Anal. 2022, 12, 460–469. [Google Scholar] [CrossRef] [Scilit] [PubMed]
  29. Hafiz, I.; Insanu, M.; Happyana, N. Comparison of metabolite profiles and bioactivities of three Ziziphus species. J. Appl. Pharm. Sci. 2025, 15, 119–131. [Google Scholar] [CrossRef] [Scilit]
  30. Scettri, A.; Baroldi, I.; Allari, L.; Bolognini, L.; Guardini, K.; Schievano, E. NMR sugar-profile in genuine grape must. Food Chem. 2024, 451, 139374. [Google Scholar] [CrossRef] [Scilit] [PubMed]
  31. Tlhapi, D.B.; Ramaite, I.D.; Anokwuru, C.P. Metabolomic profiling and antioxidant activities of Breonadia salicina using 1H-NMR and UPLC-QTOF-MS analysis. Molecules 2021, 26, 6707. [Google Scholar] [CrossRef] [Scilit] [PubMed]
  32. Kim, H.K.; Choi, Y.H. Identification of primary metabolites in 1H-NMR-based metabolomics of plants. In Natural Product Isolation and Identification: Methods and Protocols; Springer: New York, NY, USA, 2025; pp. 245–257. [Google Scholar]
  33. Zielińska, A.; Siudem, P.; Paradowska, K.; Gralec, M.; Kaźmierski, S.; Wawer, I. Aronia melanocarpa fruits as a rich dietary source of chlorogenic acids and anthocyanins: 1H-NMR, HPLC-DAD, and chemometric studies. Molecules 2020, 25, 3234. [Google Scholar] [CrossRef] [Scilit] [PubMed]
  34. Tavakoli, S.; Khalighi-Sigaroodi, F.; Dehaghi, N.K.; Yaghoobi, M.; Hajiaghaee, R.; Gholami, A.; Ghafarzadegan, R. Isolation and purification of apigenin, quercetin and apigenin 7-O-glycoside from Apium graveolens L., Petroselinum crispum (Mill.) Fuss, Allium cepa L., respectively. J. Med. Plan. 2022, 21, 72–86. [Google Scholar] [CrossRef] [Scilit]
  35. Singh, A.; Kumar, S.; Bajpai, V.; Reddy, T.J.; Rameshkumar, K.B.; Kumar, B. Structural characterization of flavonoid C-and O-glycosides in an extract of Adhatoda vasica leaves by liquid chromatography with quadrupole time-of-flight mass spectrometry. Rapid Comm. Mass Spec. 2015, 29, 1095–1106. [Google Scholar] [CrossRef] [Scilit]
  36. Man, G.; Xu, L.; Wang, Y.; Liao, X.; Xu, Z. Profiling phenolic composition in pomegranate peel from nine selected cultivars using UHPLC-QTOF-MS and UPLC-QQQ-MS. Front. Nutr. 2022, 8, 807447. [Google Scholar] [CrossRef] [Scilit] [PubMed]
  37. Kaur, J.; Dhiman, V.; Bhadada, S.; Katare, O.P.; Ghoshal, G. LC/MS guided identification of metabolites of different extracts of Cissus quadrangularis. Food Chem. Adv. 2022, 1, 100084. [Google Scholar] [CrossRef] [Scilit]
  38. Saleh, M.S.; Jalil, J.; Mustafa, N.H.; Ramli, F.F.; Asmadi, A.Y.; Kamisah, Y. UPLC-MS-based metabolomics profiling for α-glucosidase inhibiting property of Parkia speciosa pods. Life 2021, 11, 78. [Google Scholar] [CrossRef] [Scilit] [PubMed]
  39. Martinez, S.E.; Lakowski, T.M.; Davies, N.M. Enantiospecific analysis of 8-prenylnaringenin in biological fluids by liquid-chromatography-electrospray ionization mass spectrometry: Application to preclinical pharmacokinetic investigations. Chirality 2014, 26, 419–426. [Google Scholar] [CrossRef] [Scilit] [PubMed]
  40. Lima, G.S.; Lima, N.M.; Roque, J.V.; de Aguiar, D.V.; Oliveira, J.V.; Dos Santos, G.F.; Chaves, A.R.; Vaz, B.G. LC-HRMS/MS-based metabolomics approaches applied to the detection of antifungal compounds and a metabolic dynamic assessment of Orchidaceae. Molecules 2022, 27, 7937. [Google Scholar] [CrossRef] [Scilit] [PubMed]
  41. Jose, S.M.; Anilkumar, M. LCMS/MS analysis and evaluation of anti-inflammatory and antioxidant activities of the polyphenol fraction of Litsea quinqueflora (Dennst.) Suresh. Plant Sci. Today 2021, 8, 865–872. [Google Scholar] [CrossRef] [Scilit]
  42. Feng, X.; Li, Y.; Guang, C.; Qiao, M.; Wang, T.; Chai, L.; Qiu, F. Characterization of the in vivo and in vitro metabolites of linarin in rat biosamples and intestinal flora using ultra-high performance liquid chromatography coupled with quadrupole time-of-flight tandem mass spectrometry. Molecules 2018, 23, 2140. [Google Scholar] [CrossRef] [Scilit] [PubMed]
  43. Chang, L.; Ren, Y.; Cao, L.; Sun, Y.; Sun, Q.; Sheng, N.; Yuan, L.; Zhi, X.; Zhang, L. Simultaneous determination and pharmacokinetic study of six flavonoids from Fructus Sophorae extract in rat plasma by LC–MS/MS. J. Chromatogr. B 2012, 904, 59–64. [Google Scholar] [CrossRef] [Scilit]
  44. Jang, G.H.; Kim, H.W.; Lee, M.K.; Jeong, S.Y.; Bak, A.R.; Lee, D.J.; Kim, J.B. Characterization and quantification of flavonoid glycosides in the Prunus genus by UPLC-DAD-QTOF/MS. Saudi J. Biol. Sci. 2018, 25, 1622–1631. [Google Scholar] [CrossRef] [Scilit] [PubMed]
  45. Abd-El-Aziz, N.M.; Hifnawy, M.S.; Lotfy, R.A.; Younis, I.Y. LC/MS/MS and GC/MS/MS metabolic profiling of Leontodon hispidulus, in vitro and in silico anticancer activity evaluation targeting hexokinase 2 enzyme. Sci. Rep. 2024, 14, 6872. [Google Scholar] [CrossRef] [Scilit] [PubMed]
  46. Tine, Y.; Yang, Y.; Renucci, F.; Costa, J.; Wélé, A.; Paolini, J. LC-MS/MS analysis of flavonoid compounds from Zanthoxylum zanthoxyloides extracts and their antioxidant activities. Nat. Prod. Comm. 2017, 12, 1934578X1701201213. [Google Scholar] [CrossRef] [Scilit]
  47. Tava, A.; Biazzi, E.; Ronga, D.; Mella, M.; Doria, F.; D’Addabbo, T.; Candido, V.; Avato, P. Chemical identification of specialized metabolites from sulla (Hedysarum coronarium L.) collected in Southern Italy. Molecules 2021, 26, 4606. [Google Scholar] [CrossRef] [Scilit] [PubMed]
  48. Razgonova, M.; Zakharenko, A.; Pikula, K.; Manakov, Y.; Ercisli, S.; Derbush, I.; Kislin, E.; Seryodkin, I.; Sabitov, A.; Kalenik, T.; et al. LC-MS/MS screening of phenolic compounds in wild and cultivated grapes Vitis amurensis Rupr. Molecules 2021, 26, 3650. [Google Scholar] [CrossRef] [Scilit] [PubMed]
  49. Ali, A.; Bashmil, Y.M.; Cottrell, J.J.; Suleria, H.A.; Dunshea, F.R. LC-MS/MS-QTOF screening and identification of phenolic compounds from Australian grown herbs and their antioxidant potential. Antioxidants 2021, 10, 1770. [Google Scholar] [CrossRef] [Scilit] [PubMed]
  50. Suciati, S.; Laili, E.R.; Haula, H.; Tumewu, L.; Nuengchamnong, N.; Suphrom, N.; Widyawaruyanti, A. Phytoconstituents, antioxidant, and cholinesterase inhibitory activities of the leaves and stem extracts of Artocarpus sericicarpus. Pharmacia 2024, 71, 1–8. [Google Scholar] [CrossRef] [Scilit]
  51. Bhajan, C.; Soulange, J.G.; Sanmukhiya, V.M.R.; Olędzki, R.; Harasym, J. Phytochemical composition and antioxidant properties of Tambourissa ficus, a Mauritian endemic fruit. Appl. Sci. 2023, 13, 10908. [Google Scholar] [CrossRef] [Scilit]
  52. Abdl Aziz, F.T.; Temraz, A.S.; Hassan, M.A. Metabolites profiling by LC-ESI-MS/MS technique and in-vitro antioxidant activity of Bauhinia madagascariensis Desv. and Bauhinia purpurea L. aerial parts cultivated in Egypt: A comparative study. Azhar Int. J. Pharm. Med. Sci. 2024, 4, 169–188. [Google Scholar] [CrossRef] [Scilit]
  53. Kim, Y.; Lim, D.J.; Song, J.S.; Kim, J.A.; Lee, B.H.; Son, Y.K. Identification and comparison of bioactive components of two dryopteris sp. extract using LC-QTOF-MS. Plants 2022, 11, 3233. [Google Scholar] [CrossRef] [Scilit] [PubMed]
  54. Iwashina, T.; Yangzom, R.; Devkota, H.P.; Mizuno, T. Flavonoids from the leaves and flowers of the Himalayan Cathcartia villosa (Papaveraceae). Biochem. Syst. Ecol. 2021, 96, 104267. [Google Scholar] [CrossRef] [Scilit]
  55. Araujo, N.M.P.; Arruda, H.S.; Dos Santos, F.N.; de Morais, D.R.; Pereira, G.A.; Pastore, G.M. LC-MS/MS screening and identification of bioactive compounds in leaves, pulp and seed from Eugenia calycina Cambess. Food Res. Int. 2020, 137, 109556. [Google Scholar] [CrossRef] [Scilit]
  56. Yang, M.; Zhao, Y.; Qin, Y.; Xu, R.; Yang, Z.; Peng, H. Untargeted metabolomics and targeted quantitative analysis of temporal and spatial variations in specialized metabolites accumulation in Poria cocos (Schw.) wolf (Fushen). Front. Plant Sci. 2021, 12, 713490. [Google Scholar] [CrossRef] [Scilit] [PubMed]
  57. Liu, K.; Guo, Y.; Chen, X.; Duan, J.; Li, B.; Liu, M.; Chen, L.; Li, M.; Feng, Y.; Li, H.; et al. Quality control, preparation process optimizing and anti-inflammatory effects of Premna Puberula Pamp. Pectin. Heliyon 2022, 8, e11082. [Google Scholar] [CrossRef] [Scilit] [PubMed]
  58. Sánchez-González, M.; Lozano-Mena, G.; Juan, M.E.; García-Granados, A.; Planas, J.M. Liquid chromatography–mass spectrometry determination in plasma of maslinic acid, a bioactive compound from Olea europaea L. Food Chem. 2013, 141, 4375–4381. [Google Scholar] [CrossRef] [Scilit] [PubMed]
  59. Li, B.; Fan, S.; Hu, J.; Ma, Y.; Feng, Y.; Wang, F.; Wang, X.; Niu, L. Phytochemical analysis using UPLC-MS/MS combined with network pharmacology methods to explore the biomarkers for the quality control of Lingguizhugan decoction. Evid.-Based Complement. Altern. Med. 2021, 2021, 7849032. [Google Scholar] [CrossRef] [Scilit]
  60. Mannino, G.; Occhipinti, A.; Maffei, M.E. Quantitative determination of 3-O-acetyl-11-keto-β-boswellic acid (AKBA) and other boswellic acids in Boswellia sacra Flueck (syn. B. carteri Birdw) and Boswellia serrata Roxb. Molecules 2016, 21, 1329. [Google Scholar] [CrossRef] [Scilit]
  61. Desmiaty, Y.; Saputri, F.C.; Hanafi, M.; Prastiwi, R.; Elya, B. Anti-elastase, anti-tyrosinase and anti-oxidant of Rubus fraxinifolius stem methanolic extract. Pharmacogn. J. 2020, 12, 271–275. [Google Scholar] [CrossRef] [Scilit]
  62. Pollier, J.; Morreel, K.; Geelen, D.; Goossens, A. Metabolite profiling of triterpene saponins in Medicago truncatula hairy roots by liquid chromatography Fourier transform ion cyclotron resonance mass spectrometry. J. Nat. Prod. 2011, 74, 1462–1476. [Google Scholar] [CrossRef] [Scilit] [PubMed]
  63. Isaac, G.; Jones, M.D.; Bajrami, B.; Obeid, W.; Langridge, J.; Hatcher, P. Fast and simple free fatty acids analysis using UPC2/MS. Target. Metabolomics Lipidom. 2014, 67. [Google Scholar]
  64. Servi, H.; Kisa, Ö.; Aysal, A.I.; Genç, G.E.; Şatana, D. Chemical profile by LC-Q-TOF-MS of Nigella sativa seed extracts and in vitro antimicrobial activity on bacteria which are determined resistance gene and isolated from nosocomial infection. J. Res. Pharm. 2022, 26, 287–297. [Google Scholar] [CrossRef] [Scilit]
  65. Kumar, S.; Singh, A.; Bajpai, V.; Srivastava, M.; Singh, B.P.; Kumar, B. Structural characterization of monoterpene indole alkaloids in ethanolic extracts of Rauwolfia species by liquid chromatography with quadrupole time-of-flight mass spectrometry. J. Pharm. Anal. 2016, 6, 363–373. [Google Scholar] [CrossRef] [Scilit] [PubMed]
  66. Picardo, M.; Sanchís, J.; Núñez, O.; Farré, M. Suspect screening of natural toxins in surface and drinking water by high performance liquid chromatography and high-resolution mass spectrometry. Chemosphere 2020, 261, 127888. [Google Scholar] [CrossRef] [Scilit] [PubMed]
  67. Bjorøy, Ø.; Fossen, T.; Andersen, Ø.M. Anthocyanin 3-galactosides from Cornus alba ‘Sibirica’ with glucosidation of the B-ring. Phytochemistry 2007, 68, 640–645. [Google Scholar] [CrossRef] [Scilit] [PubMed]
  68. Cahlíková, L.; Ali, B.H.; Havlíková, L.; Ločárek, M.; Siatka, T.; Opletal, L.; Blunden, G. Anthocyanins of Hibiscus sabdiffera calyces from Sudan. Nat. Prod. Commun. 2015, 10, 1934578X1501000120. [Google Scholar] [CrossRef] [Scilit]
  69. Muribeca, A.D.J.B.; Gomes, P.W.P.; Paes, S.S.; Da Costa, A.P.A.; Gomes, P.W.P.; Viana, J.D.S.; Reis, J.D.E.; Pamplona, S.D.G.S.R.; Silva, C.; Bauermeister, A.; et al. Antibacterial activity from Momordica charantia L. leaves and flavones enriched phase. Pharmaceutics 2022, 14, 1796. [Google Scholar] [CrossRef] [Scilit] [PubMed]
  70. Kiani, H.S.; Ahmad, W.; Nawaz, S.; Farah, M.A.; Ali, A. Optimized extraction of polyphenols from unconventional edible plants: LC-MS/MS profiling of polyphenols, biological functions, molecular docking, and pharmacokinetics study. Molecules 2023, 28, 6703. [Google Scholar] [CrossRef] [Scilit]
  71. Smitha, C.K.; Udayan, P.S. GC-MS and HR-LCMS fingerprinting of various parts of Oroxylum indicum (L.) Vent. A comparative phytochemical study based on plant part substitution approach. J. Pharmacog. Phytochem. 2020, 9, 1817–1824. [Google Scholar]
  72. Gao, M.; Yang, J.; Wang, Z.; Yang, B.; Kuang, H.; Liu, L.; Wang, L.; Yang, C. Simultaneous determination of purpurin, munjistin and mollugin in rat plasma by ultra-high performance liquid chromatography-tandem mass spectrometry: Application to a pharmacokinetic study after oral administration of Rubia cordifolia L. extract. Molecules 2016, 21, 717. [Google Scholar] [CrossRef] [Scilit] [PubMed]
  73. Swati, D.; Vishwatej, P.; Vinay, S.; Bhupesh, P. LC-MS analysis of Kigelia Pinnata (JACQ) DC. Root bark- A multi-potent medicinal plant. Ayushdhara 2023, 10, 60–67. [Google Scholar] [CrossRef] [Scilit]
  74. Khattab, O.M.; El-Kersh, D.M.; Khalifa, S.A.; Yosri, N.; El-Seedi, H.R.; Farag, M.A. Comparative MS-and NMR-based metabolome mapping of Egyptian red and white Squill bulbs F. Liliaceae and in relation to their cytotoxic effect. Plants 2023, 12, 2078. [Google Scholar] [CrossRef] [Scilit] [PubMed]
  75. Abd Elkarim, A.S.; Ahmed, A.H.; Taie, H.A.; Elgamal, A.M.; Shabana, M.A.E.S. Synadenium grantii hook f.: HPLC/QTOF-MS/MS tentative identification of the phytoconstituents, antioxidant, antimicrobial and antibiofilm evaluation of the aerial parts. Rasayan J. Chem. 2021, 14, 811–828. [Google Scholar] [CrossRef] [Scilit]
  76. Tuberoso, C.I.G.; Montoro, P.; Piacente, S.; Corona, G.; Deiana, M.; Dessì, M.A.; Pizza, C.; Cabras, P. Flavonoid characterization and antioxidant activity of hydroalcoholic extracts from Achillea ligustica All. J. Pharm. Biomed. Anal. 2009, 50, 440–448. [Google Scholar] [CrossRef] [Scilit] [PubMed]
  77. Wolniak, M.; Tomczykowa, M.; Tomczyk, M.; Gudej, J.; Wawer, I. Antioxidant activity of extracts and flavonoids from Bidens tripartita. Acta Pol. Pharm. 2007, 64, 441–447. [Google Scholar] [PubMed]
  78. Gil, K.A.; Wojdyło, A.; Nowicka, P.; Montoro, P.; Tuberoso, C.I.G. Effect of apple juice enrichment with selected plant materials: Focus on bioactive compounds and antioxidant activity. Foods 2022, 12, 105. [Google Scholar] [CrossRef] [Scilit] [PubMed]
  79. Leong, A.C.N.; Kinjo, Y.; Tako, M.; Iwasaki, H.; Oku, H.; Tamaki, H. Flavonoid glycosides in the shoot system of Okinawa Taumu (Colocasia esculenta S.). Food Chem. 2010, 119, 630–635. [Google Scholar] [CrossRef] [Scilit]
  80. Zhang, Y.J.; Li, J.X.; Hao, K.X.; Zhong, R.F.; Li, Y.M.; Jiang, J.G.; Zhu, W. Identification of polyphenols in Mallotus peltatus (Geiseler) Mull. Arg. based on UPLC-MS/MS and their protective effects on H2O2-induced liver injury. J. Food Biochem. 2025, 2025, 9941885. [Google Scholar] [CrossRef] [Scilit]
  81. Rivero-Cruz, J.F.; Granados-Pineda, J.; Pedraza-Chaverri, J.; Pérez-Rojas, J.M.; Kumar-Passari, A.; Diaz-Ruiz, G.; Rivero-Cruz, B.E. Phytochemical constituents, antioxidant, cytotoxic, and antimicrobial activities of the ethanolic extract of Mexican brown propolis. Antioxidants 2020, 9, 70. [Google Scholar] [CrossRef] [Scilit] [PubMed]
  82. Aderogba, M.A.; Kapche, G.D.; Mabusela, W.T. Isolation and characterization of antioxidative constituents of Ceiba pentandra (KAPOK) leaves extract. Nig. J. Nat. Prod. Med. 2013, 17, 86–90. [Google Scholar]
  83. Tlhapi, D.; Malebo, N.; Manduna, I.T.; Mawunu, M.; Chokwe, R.C. Phytochemical screening and biological activities of Lippia multiflora Moldenke. Molecules 2025, 30, 2882. [Google Scholar] [CrossRef] [Scilit] [PubMed]
  84. Wu, C.L.; Chang, H.T.; Hsui, Y.R.; Hsu, Y.W.; Liu, J.Y.; Wang, S.Y.; Chang, S.T. Antioxidant-enriched leaf water extracts of Cinnamomum osmophloeum from eleven provenances and their bioactive flavonoid glycosides. BioResources 2013, 8, 571–580. [Google Scholar]
  85. Farooq, M.U.; Mumtaz, M.W.; Mukhtar, H.; Rashid, U.; Akhtar, M.T.; Raza, S.A.; Nadeem, M. UHPLC-QTOF-MS/MS based phytochemical characterization and anti-hyperglycemic prospective of hydro-ethanolic leaf extract of Butea monosperma. Sci. Rep. 2020, 10, 3530. [Google Scholar] [CrossRef] [Scilit] [PubMed]
  86. Abdelaziz, S.; Al Yousef, H.M.; Al-Qahtani, A.S.; Hassan, W.H.; Fantoukh, O.I.; El-Sayed, M.A. Phytochemical profile, antioxidant and cytotoxic potential of Parkinsonia aculeata L. growing in Saudi Arabia. Saudi Pharm. J. 2020, 28, 1129–1137. [Google Scholar] [CrossRef] [Scilit] [PubMed]
  87. Kakouri, E.; Trigas, P.; Daferera, D.; Skotti, E.; Tarantilis, P.A.; Kanakis, C. Chemical characterization and antioxidant activity of nine Hypericum species from Greece. Antioxidants 2023, 12, 899. [Google Scholar] [CrossRef] [Scilit] [PubMed]
  88. Barrientos, R.E.; Ahmed, S.; Cortés, C.; Fernández-Galleguillos, C.; Romero-Parra, J.; Simirgiotis, M.J.; Echeverría, J. Chemical fingerprinting and biological evaluation of the endemic Chilean fruit Greigia sphacelata (Ruiz and Pav.) Regel (Bromeliaceae) by UHPLC-PDA-orbitrap-mass spectrometry. Molecules 2020, 25, 3750. [Google Scholar] [CrossRef] [Scilit] [PubMed]
  89. Razola-Díaz, M.D.C.; Aznar-Ramos, M.J.; Benítez, G.; Gómez-Caravaca, A.M.; Verardo, V. Exploring the potential of phenolic and antioxidant compounds in new Rosaceae fruits. J. Sci. Food Agri. 2024, 104, 3705–3718. [Google Scholar] [CrossRef] [Scilit]
  90. Oriola, A.O.; Miya, G.M.; Singh, M.; Oyedeji, A.O. Flavonol glycosides from Eugenia uniflora leaves and their in vitro cytotoxcity, antioxidant and anti-inflammatory activities. Sci. Pharm. 2023, 91, 42. [Google Scholar]
  91. Parveen, S.; Ansari, M.H.R.; Parveen, R.; Khan, W.; Ahmad, S.; Husain, S.A. Chromatography based metabolomics and in silico screening of Gymnema sylvestre leaf extract for its antidiabetic potential. Evid.-Based Complement. Altern. Med. 2019, 2019, 7523159. [Google Scholar] [CrossRef] [Scilit]
  92. Phahlane, C.J.; Laurie, S.M.; Shoko, T.; Manhivi, V.E.; Sivakumar, D. An evaluation of phenolic compounds, carotenoids, and antioxidant properties in leaves of South African cultivars, Peruvian 199062.1 and USA’s Beauregard. Front. Nutr. 2021, 8, 773550. [Google Scholar] [PubMed]
  93. Guillen-Poot, M.A.; Valencia-Chan, L.S.; Moo-Puc, R.E.; Richomme-Peniguel, P.; Rupasinghe, H.V.; Peña-Rodríguez, L.M. Exploring the potential health benefits of plants and fruits traditionally consumed in the Yucatan Peninsula. J. Diabetes Treat. 2022, 7, 10111. [Google Scholar] [CrossRef] [Scilit]
  94. Zdunić, G.; Aradski, A.A.; Gođevac, D.; Živković, J.; Laušević, S.D.; Milošević, D.K.; Šavikin, K. In vitro hypoglycemic, antioxidant and antineurodegenerative activity of chokeberry (Aronia melanocarpa) leaves. Indust. Crops Prod. 2020, 148, 112328. [Google Scholar] [CrossRef] [Scilit]
  95. Chociej, P.; Foss, K.; Jabłońska, M.; Ustarbowska, M.; Sawicki, T. The profile and content of polyphenolic compounds and antioxidant and anti-glycation properties of root extracts of selected medicinal herbs. Plant Foods Hum. Nutr. 2024, 79, 468–473. [Google Scholar] [CrossRef] [Scilit] [PubMed]
  96. Qian, Z.M.; Cheng, X.J.; Wang, Q.; Huang, Q.; Jin, L.L.; Ma, Y.F.; Xie, J.S.; Li, D.Q. On-line pre-column FRAP-based antioxidant reaction coupled with HPLC-DAD-TOF/MS for rapid screening of natural antioxidants from different parts of Polygonum viviparum. RSC Adv. 2023, 13, 9585–9594. [Google Scholar] [CrossRef] [Scilit] [PubMed]
  97. dos Santos, A.E.; Simas, N.K.; Kuster, R.M. Phytochemical profiling, antioxidant, and phytotoxic potentials of Erythrina speciosa Andrews leaves. Ciênc. Nat. 2024, 46, e86537. [Google Scholar] [CrossRef] [Scilit]
  98. Jug, U.; Naumoska, K.; Vovk, I. (−)-Epigallocatechin—An important contributor to the antioxidant activity of Japanese knotweed rhizome bark extract as determined by antioxidant activity-guided fractionation. Antioxidants 2021, 10, 133. [Google Scholar] [CrossRef] [Scilit] [PubMed]
  99. Kharyal, S.; Puri, R. Analysis of antioxidant, antidiabetic potential, and corosolic acid content in Prunus padus leaves. Def. Life Sci. J. 2022, 7, 282–287. [Google Scholar] [CrossRef] [Scilit]
  100. Bharati, S.; Maharjan, B.; Shrestha, T.; Shrestha, S.S.; Sut, S.; Devkota, H.P.; Shrestha, R.L.S.; Dall’Acqua, S. LC-DAD-MSn and HR-LC-QTOF analysis of Ziziphus budhensis leaves and evaluation of their in vitro and in vivo biological activities. Chem. Biodivers. 2025, 22, e202402835. [Google Scholar] [PubMed]
  101. Chen, M.; Lin, E.; Xiao, R.; Li, Z.; Liu, B.; Wang, J. Structural characteristic, strong antioxidant, and anti-gastric cancer investigations on an oleoresin from ginger (Zingiber officinale var. roscoe). Foods 2024, 13, 1498. [Google Scholar] [CrossRef] [Scilit] [PubMed]
  102. Wang, S.; Chang, Y.; Xu, J.; Zhao, C.; Song, Y.; Liu, M.; Tian, C. Comparative study of anti-inflammatory, antioxidant and antibacterial activities of epigallocatechin gallate, epigallocatechin, epicatechin gallate and epicatechin in vitro. Pharmacol. Res. Mod. Chin. Med. 2025, 15, 100599. [Google Scholar] [CrossRef] [Scilit]
  103. Kazlauskienė, D.; Kasparavičienė, G.; Nenortienė, P.; Marksa, M.; Jukilaitytė, J.; Velžienė, S.; Ževžikovas, A. Determination of fatty acid composition and antioxidant activity in vegetable oils. Chemija 2021, 32, 17–27. [Google Scholar] [CrossRef] [Scilit]
  104. Bahadır Semerci, A.; Yıldırım, M.; Oztay, F.; Sagıroglu, M.; Tunç, K. Evaluation of fatty acid contents and biological activities of Jurinea turcica. Chem. Biodivers. 2024, 21, e202300084. [Google Scholar] [PubMed]
  105. Sarikurkcu, C.; Sahinler, S.S.; Ceylan, O.; Tepe, B. Onosma pulchra: Phytochemical composition, antioxidant, skin-whitening and anti-diabetic activity. Indust. Crops Prod. 2020, 154, 112632. [Google Scholar] [CrossRef] [Scilit]
  106. Muzammil, S.; Wang, Y.; Siddique, M.H.; Zubair, E.; Hayat, S.; Zubair, M.; Roy, A.; Mumtaz, R.; Azeem, M.; Emran, T.B.; et al. Polyphenolic composition, antioxidant, antiproliferative and antidiabetic activities of Coronopus didymus leaf extracts. Molecules 2022, 27, 6263. [Google Scholar] [CrossRef] [Scilit] [PubMed]
  107. Malebo, N.J.; Manduna, I.T.; Mawunu, M.; Chokwe, R.C.; Tlhapi, B. Identification of antioxidant, antimicrobial, and cytotoxic compounds from Hymenocardia acida Tul. using ultra-high-performance liquid chromatography-quadrupole exactive-orbitrap-mass spectrometry and molecular networking approach. Chem. Biodivers. 2026, 23, e02485. [Google Scholar] [PubMed]
  108. Minh, T.N.; Van, T.M.; Khanh, T.D.; Xuan, T.D. Isolation and identification of constituents exhibiting antioxidant, antibacterial, and antihyperuricemia activities in Piper methysticum root. Foods 2022, 11, 3889. [Google Scholar] [CrossRef] [Scilit] [PubMed]
  109. Nigussie, G.; Siyadatpanah, A.; Norouzi, R.; Debebe, E.; Alemayehu, M.; Dekebo, A. Antioxidant potential of Ethiopian medicinal plants and their phytochemicals: A review of pharmacological evaluation. Evid.-Based Complement. Altern. Med. 2023, 2023, 1901529. [Google Scholar] [CrossRef] [Scilit]
  110. Nwozo, O.S.; Effiong, E.M.; Aja, P.M.; Awuchi, C.G. Antioxidant, phytochemical, and therapeutic properties of medicinal plants: A review. Int. J. Food Prop. 2023, 26, 359–388. [Google Scholar] [CrossRef] [Scilit]
  111. Mehmood, A.; Javid, S.; Khan, M.F.; Ahmad, K.S.; Mustafa, A. In vitro total phenolics, total flavonoids, antioxidant and antibacterial activities of selected medicinal plants using different solvent systems. BMC Chem. 2022, 16, 64. [Google Scholar] [CrossRef] [Scilit] [PubMed]
  112. Kubiak-Tomaszewska, G.; Roszkowski, P.; Grosicka-Maciąg, E.; Strzyga-Łach, P.; Struga, M. Effect of hydroxyl groups esterification with fatty acids on the cytotoxicity and antioxidant activity of flavones. Molecules 2022, 27, 420. [Google Scholar] [CrossRef] [Scilit] [PubMed]
  113. Zhou, X.; Zheng, T.; Xie, Y.; Zou, S.; Xu, S.; Lai, M.; Zuo, Z. Astaxanthin accumulation in Microcystis aeruginosa under different light quality. Bioresour. Technol. 2022, 346, 126629. [Google Scholar] [CrossRef] [Scilit] [PubMed]
  114. Olaokun, O.O.; Zubair, M.S. Antidiabetic activity, molecular docking, and ADMET properties of compounds isolated from bioactive ethyl acetate fraction of Ficus lutea leaf extract. Molecules 2023, 28, 7717. [Google Scholar] [CrossRef] [Scilit] [PubMed]
  115. Zhang, K.; Chen, X.L.; Zhao, X.; Ni, J.Y.; Wang, H.L.; Han, M.; Zhang, Y.M. Antidiabetic potential of Catechu via assays for α-glucosidase, α-amylase, and glucose uptake in adipocytes. J. Ethnopharmacol. 2022, 291, 115118. [Google Scholar] [CrossRef] [Scilit] [PubMed]
  116. Dilshad, R.; Khan, K.U.R.; Ahmad, S.; Shaik Mohammad, A.A.; Sherif, A.E.; Rao, H.; Ahmad, M.; Ghalloo, B.A.; Begum, M.Y. Phytochemical characterization of Typha domingensis and the assessment of therapeutic potential using in vitro and in vivo biological activities and in silico studies. Front. Chem. 2023, 11, 1273191. [Google Scholar] [CrossRef] [Scilit] [PubMed]
  117. Bouslamti, M.; Loukili, E.H.; Elrherabi, A.; El Moussaoui, A.; Chebaibi, M.; Bencheikh, N.; Nafidi, H.A.; Bin Jardan, Y.A.; Bourhia, M.; Bnouham, M.; et al. Phenolic profile, inhibition of α-amylase and α-glucosidase enzymes, and antioxidant properties of Solanum elaeagnifolium Cav. (Solanaceae): In vitro and in silico investigations. Processes 2023, 11, 1384. [Google Scholar] [CrossRef] [Scilit]
  118. Sowa, I.; Mołdoch, J.; Dresler, S.; Kubrak, T.; Soluch, A.; Szczepanek, D.; Strzemski, M.; Paduch, R.; Wójciak, M. Phytochemical profiling, antioxidant activity, and protective effect against H2O2-induced oxidative stress of Carlina vulgaris extract. Molecules 2023, 28, 5422. [Google Scholar] [CrossRef] [Scilit] [PubMed]
  119. Sharma, U.; Sharma, B.; Mishra, A.; Sahu, A.; Mathkor, D.M.; Haque, S.; Raina, D.; Ramniwas, S.; Gupta, M.; Tuli, H.S. Ononin: A comprehensive review of anticancer potential of natural isoflavone glycoside. J. Biochem. Mol. Toxicol. 2024, 38, e23735. [Google Scholar] [CrossRef] [Scilit] [PubMed]
  120. Chouman, A.; El-Lakany, A.; Aboul-Ela, M.; Hijazi, M.A. Review on phenolic constituents and pharmacological activities of genus Ononis. J. Appl. Pharm. Sci. 2025, 15, 027–036. [Google Scholar]
  121. Jelača, S.; Dajić-Stevanović, Z.; Vuković, N.; Kolašinac, S.; Trendafilova, A.; Nedialkov, P.; Stanković, M.; Tanić, N.; Tanić, N.T.; Acović, A.; et al. Beyond traditional use of Alchemilla vulgaris: Genoprotective and antitumor activity in vitro. Molecules 2022, 27, 8113. [Google Scholar] [CrossRef] [Scilit] [PubMed]
  122. Chen, J.; Li, G.; Sun, C.; Peng, F.; Yu, L.; Chen, Y.; Tan, Y.; Cao, X.; Tang, Y.; Xie, X.; et al. Chemistry, pharmacokinetics, pharmacological activities, and toxicity of Quercitrin. Phytother. Res. 2022, 36, 1545–1575. [Google Scholar] [CrossRef] [Scilit] [PubMed]
  123. Coronel-Pastor, L.; Villarreal, M.L.; Zamilpa, A.; Herrera-Ruiz, M.; González-Cortazar, M.; Alvarez, L.; Perea-Arango, I.; Moreno-Anzúrez, N.E.; Rodríguez Monroy, M.; Arellano-García, J.D.J. Fractions and compounds obtained from transformed plant cell cultures of Lopezia racemosa show anti-inflammatory and cytotoxic activities. Plants 2025, 14, 2585. [Google Scholar] [CrossRef] [Scilit] [PubMed]
  124. Ozga, T.; Herbette, G.; Carriere Richez, P.; Clerc, P.; Haddad, J.; El Kalamouni, C.; Bignon, J.; Marcellin-Gros, R.; Ferreira Queiroz, E.; Wolfender, J.L.; et al. Phytochemical and metabolomic investigation of a popular traditional plant from La Réunion: Psiloxylon mauritianum. Appl. Sci. 2025, 15, 496. [Google Scholar] [CrossRef] [Scilit]
  125. Ahmadi, A.; Gandomi, H.; Derakhshandeh, A.; Misaghi, A.; Noori, N. Phytochemical composition and in vitro safety evaluation of Ziziphora clinopodioides Lam. ethanolic extract: Cytotoxicity, genotoxicity and mutagenicity assessment. J. Ethnopharm. 2021, 266, 113428. [Google Scholar] [CrossRef] [Scilit]
  126. Rasool, N.; Omer, M.O.; Javeed, A.; Nawaz, M.; Rasheed, M.A.; Imran, M.; Hussain, M.; Dawood, A.F.; Mushtaq, Z.; Al Jbawi, E. Phytochemical properties and in-vitro cytotoxicity, genotoxicity and mutagenicity assessment of ethanolic and aqueous extracts of Argyrolobium roseum (Camb.). Int. J. Food Prop. 2023, 26, 1457–1469. [Google Scholar] [CrossRef] [Scilit]
Figure 1. Molecular network of Morinda lucida crude extracts. Nodes of cluster (A) (lipids and lipid-like molecules), cluster (B) (phenylpropanoids and polyketides), cluster (C) (phenylpropanoids and polyketides), cluster (D) (phenylpropanoids and polyketides), cluster (E) (lipids and lipid-like molecules), cluster (F) (phenylpropanoids and polyketides), cluster (G) (phenylpropanoids and polyketides), cluster (H) (benzenoids), and cluster (I) (phenylpropanoids and polyketides) were labeled with the precursor mass. Nodes represent annotated compounds and are colored according to the respective crude extracts: dichloromethane leaf crude extract—orange nodes, methanol leaf crude extract—green nodes, root crude extract—gray nodes, and stem bark crude extract—yellow nodes.
Metabolites 16 00523 g001aMetabolites 16 00523 g001b
Figure 2. Dose-dependent α-glucosidase-inhibitory action of Morinda lucida extracts and Acarbose (standard drug). Data are presented as mean ± standard deviation (SD) of triplicate experiments. For each concentration, statistical multiple comparisons (Tukey and one-way ANOVA; IBM SPSS) were performed between the different treatment groups. The letters at the top of the error bars of the different treatments represent a significant difference (p < 0.05) when there are no letters that are common to the compared groups.
Metabolites 16 00523 g002
Figure 3. IC50 inhibition curves for the α-glucosidase inhibition by (a) stem bark extract and (b) Acarbose.
Metabolites 16 00523 g003
Figure 4. Images showing the interactions between identified compounds and α-glucosidase protein.
Metabolites 16 00523 g004
Figure 5. Cytotoxicity of Morinda lucida extracts against Vero cells at different concentrations of 50, 100, 250, and 500 μg/mL. Mean differences between extracts and doxorubicin were evaluated using one-way ANOVA with DMRT. Different letters indicate significant differences among extracts; the difference with p < 0.05 was considered statistically significant. Error bars indicate the SD of triplicate (n = 3) values obtained from a single experiment. All tests were performed in triplicate (n = 3), and the data are presented as the mean ± SD of two independent experiments. Data for the positive control (doxorubicin) at different concentrations (1.25, 2.5, 5, and 10) are shown for comparison.
Metabolites 16 00523 g005
Table 1. Characteristic signals of the putatively annotated metabolites in the 1H-NMR spectra of Morinda lucida extracts: s = singlet; d = doublet; dd = doublet of doublets; m = multiplet; q = quartet.
Compounds No.MetabolitesChemical Shifts
(δ ppm) and
Multiplicity
(Experiment)
Chemical Shifts
(δ ppm) and
Multiplicity
(Literature)
Human
Metabolome
Database
Crude
Extracts
References
1Hexadecanedioic
acid
1.262 (m),
1.277 (m),
1.263–1.280 (m),
1.279 (m),
1.464 (m),
1.578 (m),
1.580 (m),
1.649–1.657 (m)
1.26 (m),
1.57 (m)
1.25 (m),
1.27 (m),
1.56 (m),
1.64 (m),
1.65 (m)
Dichloromethane leaf,
Methanol leaf, Stem bark
[24]
2α-Linoleic acid0.964 (t),
1.277 (m),
1.604 (m),
5.320 (m)
0.96 (t),
1.27 (m),
5.32 (m)
1.61 (m),
5.33 (m)
Dichloromethane leaf[25]
3Leucine0.947 (dd),
0.978 (dd),
0.989 (dd),
0.996 (dd),
0.967–0.987 (m),
1.009 (dd),
2.321 (m)
0.94 (dd),
1.00 (dd)
0.99 (dd),
1.00 (dd),
2.34 (dd)
Dichloromethane leaf,
Methanol leaf, Stem bark
[26]
4Valine0.904 (m),
0.906 (m),
0.956 (m),
0.964 (m),
0.965 (m)
0.996 (d),
1.030 (d),
2.030 (m),
2.034 (m),
2.037 (m)
0.95 (m),
1.02 (d)
0.90 (m),
0.95 (m),
1.02 (d),
2.04 (m),
Dichloromethane leaf,
Methanol leaf, Stem bark
[27]
5Betaine3.304 (s)3.278 (s)3.32 (s)Root[28]
6Alanine3.605 (q)3.60(q)3.60 (q)Dichloromethane leaf[29]
7Rhamnose3.841 (m),
3.848 (m)
3.84 (m),
3.85 (m),
3.84 (m),
3.85 (m),
Methanol leaf, Stem bark[30]
8Sucrose3.841 (m),
3.848 (m),
3.834 (m),
3.845 (m)
3.83 (m),
3.86 (m)
3.83 (m),
3.86 (m)
Stem bark,
Root
[31]
9Trehalose3.643 (dd),
3.645 (dd),
3.834 (m),
3.841 (m),
3.845 (m),
3.847 (m),
3.848 (m),
3.857 (m),
3.662 (m)
3.64 (dd),
3.83 (m),
3.85 (m),
3.6 (m)
3.65 (dd),
3.84 (m),
3.85 (m)
Dichloromethane leaf,
Stem bark,
Root
[32]
10Fructose3.923 (dd),
3.971–4.033 (m)
3.93–3.98 (dd),
3.98–4.08 (m)
3.95–3.99 (m), 3.99–4.10 (m)Stem bark[32]
11Glucose3.869–3.923 (dd),
3.923–3.971 (dd)
3.86–3.92 (dd)3.86–3.93 (dd),
3.93–3.98 (dd)
Stem bark[32]
12Chlorogenic
acid
2.032 (m),
3.869 (dd),
3.898 (dd),
5.302 (m),
6.955 (d),
6.940 (d)
2.03 (m),
3.88 (dd),
6.95 (d),
6.96 (d)
2.02 (m),
3.86 (dd),
3.89 (dd),
5.36 (m),
6.93 (d),
6.95 (d)
Stem bark[33]
13Quercetin6.889 (d),
6.906 (d)
6.88 (d),
6.90 (d)
6.89 (d),
6.90 (d)
Stem bark[34]
Table 2. Putative annotation of compounds from crude extracts of M. lucida by UHPLC-Q Exactive Orbitrap MS in the negative ion mode (DCM leaf—dichloromethane leaf extract; MeOH leaf—methanol leaf extract; stem bark—stem bark extract; root—root extract; X—compound absent in the extract; and √—compound present in the extract).
Compound
No.
tR
(min)
Theoretical
Mass
[M − H]
(m/z)
Observed
Mass
[M − H]
(m/z)
Molecular
Formula
MS2 Fragment
Ions
(m/z)
Compound
Name
Compound
Class
DCM
Leaf
MeOH
Leaf
RootStem BarkReferences
13.04323.12323.26C20H20O4323GlabranineFlavonoidXXXMassBank-BML00154
24.11563.13563.43C26H28O14545,520,503Apigenin 6-C-glucoside 8-C-arabinosideFlavonoidXXX[35]
33.34449.11449.32C21H22O11313,269isookanin-7-O-glucosideFlavonoidXXX[36]
41.50449.07449.32C20H18O12447,316Myricetin-3-O-xylosideFlavonoidXXX[37]
53.13479.08479.28C21H20O13324,323,316Gossypetin-8-C-glucosideFlavonoid glycosideXXX[38]
61.52339.12339.20C20H20O53398-PrenylnaringeninPrenylated flavonoidXXX[39]
72.35563.14563.01C26H28O14563IsoschaftosideFlavonoidXXX[40]
88.89459.13459.76C23H24O10296,2076,4′-Dimethoxyisoflavone-7-glucoside (Wistin)FlavonoidXXXMassBank- BS-BS003443
92.41609.14609.41C27H30O16579,519,487Luteolin 6-C-glucoside 8-C-arabinosideFlavonoidXXX[35]
101.31255.06255.23C15H12O4217,211PinocembrinFlavonoidXXX[41]
111.79591.13591.13C28H32O14283Acacetin-7-O-rutinoside (Linarin)Flavone glycosideXXX[42]
122.96297.24297.24C17H14O5313,3113′,4′-Dimethoxy-7-hydroxyflavoneFlavonoidXMassBank-BS-BS003750
130.35431.20431.23C21H20O10323,311,238SophoricosideIsoflavone glycosideX[43]
140.40431.10431.23C21H20O10283Kaempferol-7-O-rhamnosideFlavonoidXXX[44]
150.40431.09431.23C21H20O10341,314Apigenin 8-C-glucoside (Vitexin)FlavonoidXX[45]
167.46463.05463.32C21H20O12455,453HyperosideFlavonoidXX[46]
172.12267.02267.07C22H22O9267Formononetin-7-O-glucoside (Ononin)Isoflavone glycosideX[47]
182.06464.38464.09C21H20O12463,304Quercetin-3-O-glucoside (Isoquercitrin)FlavonoidXXX[48]
191.45464.09464.88C21H20O12464MyricitrinFlavonoidXX[49]
201.49515.16515.16C26H28O11353Luteone 7-glucosideFlavonoidXXX[50]
211.96251.07251.03C16H12O3209,2077-Hydroxy-3-MethylflavoneFlavonoidXXX[51]
221.68595.16595.15C27H32O15595Eriodictyol-7-O-neohesperidoside
(Neoeriocitrin)
FlavonoidXXX[52]
230.48595.12595.27C26H28O16595Quercetin-3-arabinoglucoside
(Peltatoside)
FlavonoidXXX[53]
241.68595.13595.15C26H28O16594,593Quercetin-3-O-vicianosideFlavonoidXX[54]
251.97447.09447.09C21H20O11455,303QuercitrinFlavonoidXXX[46]
260.60289.10289.18C15H14O6259,243EpicatechinFlavonoid[55]
272.54511.33511.33C32H48O55113-O-Acetyl-16alpha-hydroxydehydrotrametenolic acidTriterpenoidXX[56]
281.45471.42471.38C30H48O4426,418Corosolic acidPentacyclic triterpenoidXXX[57]
292.06471.34471.07C30H48O4463,437Sumaresinolic acidPentacyclic triterpenoidXXX[57]
303.34471.34471.34C30H48O4238Maslinic acidPentacyclic triterpenoidXX[58]
314.86497.32497.31C31H46O5405,377,216Poricoic acid ATricyclic triterpenoidXX[59]
321.45455.35455.30C30H48O3454,453Alpha-boswellic acidPentacyclic terpenoidXX[60]
331.50483.31483.12C30H44O5483Poricoic acid BTriterpenoidXXX[61]
341.55501.32501.11C30H46O6485,421Medicagenic acidTriterpenoidXXX[62]
356.20442.09442.07C22H18O10440,313,293Catechin gallatePolyphenolXXXMassBank-BS-BS003891
362.58295.17295.23C16H25NO4-EsmololPhenolic compound[55]
371.46293.17293.18C17H26O4248,237,2096-GingerolPhenolic compound[55]
382.33277.18277.20C17H26O3283,233,2056-ParadolPhenolic ketone[55]
391.51305.06305.92C15H14O7289,221(−)-EpigallocatechinPolyphenolXXX[49]
401.55339.32339.94C22H44O2337,319Behenic acidSaturated fatty acidXXX[63]
411.16311.29311.22C20H40O2293Arachidic acidSaturated fatty acidXXX[63]
421.83307.26307.19C20H36O2290,289Eicosadienoic acidPolyunsaturated fatty acidXX[64]
432.33283.26283.03C18H36O2283Stearic acidSaturated fatty acidXXXMSBNK-Antwerp_Univ-METOX_N109326_B8BB
440.23339.17339.12C20H24N2O3321,297Yohimbic acidMonoterpene indole alkaloidsXXX[65]
450.65427.18427.18C23H28N2O6397,381,285IsomajdineIndole AlkaloidXXX[66]
462.06464.08464.09[C21H21O12]+463,337Delphinidin 3-galactosideAnthocyaninXX[67]
471.76596.17596.16[C26H29O16]+595,593Delphinidin-3-O-sambubiosideAnthocyaninXX[68]
482.78675.411675.30C38H60O10635,619Hederagenin base + O-AcetylHexSaponinXXX[69]
4910.43974.55974.90C48H78O20718,645,511Bayogenin base + O-Hex, O-Hex-HexSaponinXXXMassBank-RIKEN-PR308930
501.91423.09423.17C19H20O113133-Glucosyl-2,3′,4,4′,6- pentahydroxybenzophenoneGlycosideXXX[55]
511.46533.12533.38C24H22O135336ʹʹ -O-MalonylgenistinGlycosyloxy isoflavoneXXX[70]
521.52339.06339.07C15H16O93386,7-Dihydroxycoumarin-6-glucoside (Esculin)Coumarin glucosideXXX[71]
531.31255.03255.23C14H8O5226PurpurinAnthraquinoneXXX[72]
541.14355.14355.16C20H20O6353,265,226LicoagrodioneStilbenoidXX[73]
558.45386.53386.88C24H34O4431BufalinBufadienolideXX[74]
561.49353.50353.11C16H18O9309,295,283Chlorogenic acidQuinic acidXXX[50]
Table 3. Antioxidant activity of Morinda lucida extracts.
SamplesDPPH IC50 (µg/mL)Reducing Power IC0.5 (µg/mL)
Dichloromethane leaf extract12.2042 ± 5.0489 ab0.0487 ± 0.0212 a
Methanol leaf extract48.2661 ± 7.1855 d0.4146 ± 0.1429 a
Root extract7.7550 ± 6.9142 a0.0052 ± 0.0025 a
Stem bark extract18.7235 ± 18.3297 abc0.1979 ± 0.0361 a
Gallic acid24.8936 ± 24.8680 abcd5.4730 ± 9.2647 a
Quercetin37.3613 ± 21.3565 bcd3.7606 ± 2.9793 a
Ascorbic acid44.3083 ± 9.8132 cd0.2366 ± 0.3453 a
Notes: Values are expressed as mean ± standard deviation of three replicates (n = 3). Different letters indicate significant differences among extracts using one-way analysis of variance (ANOVA); Duncan’s Multiple Range Test (DMRT); at p < 0.05.
Table 4. IC50 values for the α-glucosidase inhibition of extracts and Acarbose.
Dichloromethane Leaf
Extract
Methanol Leaf ExtractStem Bark ExtractRoot
Extract
Acarbose
IC50 values (µg/mL)NA-NDNA-ND79.9 ± 16.1 aNA-ND30.1 ± 4.00 b
“NA-ND” means “no activity-not determined”. Data are shown as mean ± SD of a triplicate experiment. For each concentration, statistical multiple comparisons (Tukey and one-way ANOVA; IBM SPSS) were performed between the different treatment groups. The superscript letters next to the IC50 values of the different treatments represent a significant difference (p < 0.05) when there are no letters that are common to the compared groups.
Table 5. Molecular docking scores.
ProteinsCompoundsEstimated Binding Energy (kcal/mol)Hydrogen Bonds
(Distance Å)
Electrostatic
Interactions
Hydrophobic
Interaction
α-glucosidase (GAA–5NN5)Sophoricoside−7.5ARG600 (2.34577)
HIS674 (2.42431)
ASP282
ASP518
ASP616
ASP616
PHE649
Formononetin 7-O-glucoside (Ononin)−7.8SER676 (2.9883)
LEU678 (3.081)
ASP518 (2.97188)
MET519 (2.75112)
MET519 (2.98221)
ASP616 (3.03683)
LEU650 (x2)
LEU678
(-)-Epicatechin−7.6ASP616 (2.52276)
HIS674 (2.27707)
ASP616 (2.75691)
ASP518
ASP616
TRP481
6-Gingerol−6.1ARG600 (2.80342)
LEU677 (3.05526)
ASP518 (1.95766)
MET519 (3.07399)
ASP404 (3.39197)
TRP481LEU677
LEU678
TRP376 (x2)
TRP516 PHE649 HIS674
6-Paradol−6.1ARG600 (2.95729)
ASP282 (2.03181)
ASP282LEU283
TRP376
TRP481 TRP516
TRP613
PHE649 (x2) HIS674
Acarbose−6.5ASP616 (2.46815)
ASP616 (2.85218)
ASP518 (1.80743)
ASP282 (2.56368)
SER523 (2.3205)
TRP376 (3.27691)
PHE525 (2.82991)
Table 6. Inhibitory concentrations (CC50 in µg/mL) of Morinda lucida extracts and doxorubicin (positive control) in Vero monkey kidney cell lines.
SamplesVero IC50 (µg/mL)
Dichloromethane leaf extract169.00 ± 1.61 d
Methanol leaf extract91.30 ± 1.75 b
Root extract> 500
Stem bark extract101.80 ± 4.69 c
Doxorubicin (positive control)9.16 ± 1.54 a
Notes: The values above are presented as mean ± SD of three replicates (n = 3). Different letters indicate significant differences among extracts using one-way ANOVA; DMRT; at p < 0.05.
Disclaimer/Publisher’s Note: The statements, opinions and data contained in all publications are solely those of the individual author(s) and contributor(s) and not of MDPI and/or the editor(s). MDPI and/or the editor(s) disclaim responsibility for any injury to people or property resulting from any ideas, methods, instructions or products referred to in the content.