Article

Comprehensive Urinary Bile Acid Profiling in Patients Investigated for Inborn Errors of Bile Acid Synthesis Using LC–MS/MS


1
Department of Medical Biochemistry, Faculty of Medicine, Hacettepe University, 06100 Ankara, Türkiye
2
Scientific and Technological Research Center, Sinop University, 57000 Sinop, Türkiye
3
Department of Pediatrics, Division of Gastroenterology, Hepatology and Nutrition, Faculty of Medicine, Hacettepe University, 06100 Ankara, Türkiye
4
Department of Pediatric Basic Sciences, Institute of Child Health, Hacettepe University, 06100 Ankara, Türkiye
5
Department of Pediatrics, Division of Pediatric Metabolism and Nutrition, Faculty of Medicine, Hacettepe University, 06100 Ankara, Türkiye
6
Clinical Chemistry Laboratory, Hacettepe University Hospitals, 06100 Ankara, Türkiye
*
Author to whom correspondence should be addressed.
Metabolites 2026, 16(10), 753; https://doi.org/10.3390/metabo16100753 (registering DOI)
Submission received: 3 September 2026 / Revised: 4 October 2026 / Accepted: 5 October 2026 / Published: 8 October 2026
(This article belongs to the Section Endocrinology and Clinical Metabolic Research)

Abstract

Background/Objectives: This study examined urinary cholanoid profiles in a descriptive case series evaluated for suspected inborn errors of bile acid synthesis (IEBAS) or unexplained cholestasis. Methods: Urinary excretion of 66 bile acid metabolites was measured using liquid chromatography–tandem mass spectrometry (LC-MS/MS), and concentrations were interpreted as semi-quantitative estimates. In addition, cholesterol, cholestanol, and 7-dehydrocholesterol were analyzed by gas chromatography–mass spectrometry (GC-MS). Results: Five patients had genetically confirmed IEBAS: 3β-hydroxy-Δ5-C27-steroid dehydrogenase (HSD3B7) deficiency in 2 patients and cerebrotendinous xanthomatosis (CTX) in 3 patients. Two patients were subsequently diagnosed with biliary atresia and progressive familial intrahepatic cholestasis type 1. Other patients remained without a definitive etiological diagnosis. Of the two patients with genetically confirmed HSD3B7 deficiency, patient 1 showed a predominance of 3β-hydroxy-Δ5 bile acids (63.9% of total urinary bile acids), including sulfated dihydroxy-, glycine-conjugated dihydroxy-, and trihydroxy-Δ5 species. Patient 2 had an atypical urinary bile acid profile, with the 3β-hydroxy-Δ5 fraction dominated by a monohydroxy species. CTX patients had profiles with a different bile acid group composition; hydroxylated bile acids were reported in 2 patients, whereas no numerical result was reported for 1 patient. The 3β-hydroxy-Δ5 bile acid levels in 1 CTX patient were within the observed control range. Two patients also had differential profiles for hydroxylated and 3β-hydroxy-Δ5 bile acids, which provided biochemical findings for further etiological evaluation. The species assigned to glycoursodeoxycholic acid predominated in the urinary profiles of the five patients receiving ursodeoxycholic acid. Conclusions: Urinary cholanoid profiling may provide complementary biochemical information alongside the available clinical and genetic findings in the evaluation of suspected IEBAS.

1. Introduction

Patients with progressive cholestatic liver disease of unknown etiology should be evaluated for inborn errors of bile acid synthesis (IEBAS), as these rare metabolic disorders represent potentially treatable causes of otherwise unexplained cholestasis. These disorders result from pathogenic genetic variants that affect enzymes responsible for primary bile acid synthesis. Bile acid biosynthesis is a complex process involving at least 17 hepatic enzymes located in the endoplasmic reticulum, mitochondria, cytoplasm, and peroxisomes, with extensive trafficking of intermediates between these subcellular compartments [1]. Four major pathways of bile acid biosynthesis have been identified, namely the classical or neutral pathway, the alternative or acidic pathway, the Yamasaki pathway, and the 25-hydroxylation pathway. However, the precise order of reactions within these biosynthetic pathways remains unclear, as many intermediates can serve as substrates for more than one enzyme [2,3]. To date, 12 inherited metabolic disorders have been recognized as inborn errors of bile acid synthesis (IEBAS). These include Cerebrotendinous Xanthomatosis (CTX), 3β-hydroxy-Δ5-C27-steroid Dehydrogenase/Isomerase Deficiency (HSD3B7), Δ4-3-oxosteroid-5β-reductase Deficiency, Oxysterol 7α-hydroxylase Deficiency, Cholesterol 7α-hydroxylase Deficiency, and several defects localized in peroxisomes, namely α-methylacyl-CoA Racemase (AMACR) Deficiency, Acyl-CoA Oxidase 2 Deficiency, D-bifunctional Protein Deficiency, ATP-binding Cassette Subfamily D Member 3 Deficiency, Sterol Carrier Protein X (SCPx) Deficiency, Bile acid-CoA:amino acid N-acyltransferase deficiency, and Bile acid-CoA ligase deficiency [4].
Early diagnosis and appropriate treatment are crucial to prevent liver failure and associated neurological symptoms [5,6,7]. The characteristic clinical presentation of patients with IEBAS includes cholestasis, hepatomegaly, pale stools, elevated serum direct bilirubin levels, and normal gamma-glutamyltransferase and total bile acid levels. Defective enzyme function leads to overproduction of hepatotoxic atypical bile acids derived from accumulating metabolic intermediates, along with a deficiency of primary bile acids, resulting in impaired bile flow [8]. When IEBAS is suspected, mass spectrometry is considered the most appropriate screening method for detecting bile acid intermediates in plasma and urine [9,10,11,12].
In this study, urinary excretion profiles of 66 different bile acid species were investigated by LC–MS/MS in 12 patients evaluated for suspected IEBAS or unexplained cholestasis and in 50 healthy controls. Classical, hydroxylated, 3β-hydroxy-Δ5, 3-oxo-Δ4 and short- and long-chain bile acids were analyzed in dried urine spots. In addition, plasma cholesterol, 7-dehydrocholesterol and 5α-cholestanol were analyzed by GC–MS. The aim was to characterize urinary cholanoid profiles and assess their relationship with the available clinical and genetic findings.

2. Materials and Methods

2.1. Patient Characteristics and Sample Collection

This descriptive case series included 12 patients who met at least one of the following inclusion criteria: clinical suspicion of an IEBAS or unexplained cholestasis. Eligible patients were enrolled consecutively between September 2018 and September 2019. Patients 3–5 were investigated for clinically suspected cerebrotendinous xanthomatosis (CTX) despite routine liver biochemical parameters being within reference ranges. Definitive etiological diagnoses had not been established at enrollment or at the time of urinary bile acid profiling. The diagnoses reported for patients 1–5, 8, and 9 were established during subsequent clinical and/or genetic investigations.
The control group comprised 50 healthy volunteers without evidence of chronic liver disease. Controls were not age-matched and served as a descriptive comparison group; age-specific reference intervals for urinary bile acids were not established. Urine samples from patients and controls were collected and stored at −80 °C until analysis. Plasma samples were used for measurement of cholesterol, 7-dehydrocholesterol, and 5α-cholestanol. Urinary bile acid profiles were assessed cross-sectionally. Reference intervals for ALT, AST, GGT, direct bilirubin, and total bilirubin were obtained from the respective clinical laboratory reports and applied individually, as presented in Table 1.
The study was conducted in accordance with the Declaration of Helsinki (as revised in 2013) and was approved by the Ethics Committee of Hacettepe University (approval no. GO-18/255-04; 1 September 2018). Written informed consent was obtained from all study participants or their parents/legal guardians, as applicable.
Patient 1: The 8-year-old male patient was born to consanguineous parents. He presented at 40 days of age with jaundice, intramuscular bleeding following an antipyretic injection, and hepatomegaly. At 7 months of age, laboratory evaluation revealed elevated aspartate aminotransferase (AST), alanine aminotransferase (ALT), total and direct bilirubin, activated partial thromboplastin time (aPTT), and international normalized ratio (INR), with normal gamma-glutamyltransferase (GGT) levels. A liver biopsy showed giant cell transformation of hepatocytes, marked cholestasis, and pericellular fibrosis. Histopathological findings were reported as consistent with neonatal hepatitis or bile duct paucity, provided that extrahepatic biliary atresia was excluded. The distribution of cholestasis was not described, and the fibrosis stage was not specified in the biopsy report. At 4 years of age, the patient was admitted to our hospital with cirrhosis and portal hypertension, and jaundice improved following ursodeoxycholic acid (UDCA) treatment. Genetic analysis revealed no pathogenic variants in ATP8B1, ABCB11, or ABCB4 genes, associated with progressive familial intrahepatic cholestasis types 1–3 (PFIC1–3), respectively. UDCA treatment was discontinued 2 weeks prior to sample collection. The recorded UDCA regimen was 15 mg/kg/day (Table 2).
Patient 2: The 15-year-old male patient was born to consanguineous parents. He was admitted to the hospital at 2 months of age with jaundice, dark urine, pale stools, and hepatomegaly. Laboratory evaluation revealed elevated AST, ALT, and direct bilirubin levels with normal GGT. Hepatobiliary scintigraphy excluded biliary atresia. UDCA treatment was initiated, and the patient was followed with a preliminary diagnosis of neonatal cholestatic hepatitis of unknown etiology. One year later, jaundice was resolved, laboratory parameters normalized and UDCA treatment was discontinued. A liver biopsy performed at 2 years of age was reported as showing mild chronic hepatitis with stage 3 fibrosis. During follow-up, transaminase and direct bilirubin levels increased again. A subsequent liver biopsy showed chronic hepatitis with periportal bridging fibrosis. An IEBAS was suspected on the basis of persistently normal GGT despite elevated direct bilirubin, parental consanguinity, and the previously observed favorable response to UDCA therapy. The UDCA regimen was recorded as 10 mg/kg twice daily (Table 2). UDCA treatment was discontinued 2 weeks prior to sample collection.
Patient 3: The 9-year-old boy experienced a seizure at 3.5 years of age and had subsequently been followed for developmental delay and loss of previously acquired skills. Tendon xanthomas were noted on clinical examination, and the overall clinical presentation was considered consistent with CTX. Routine biochemical parameters were within reference ranges; however, plasma cholestanol concentration measured in this study was 7.95 µg/mL. Chenodeoxycholic acid (CDCA) treatment (10 mg/kg/day) was started based on clinical suspicion of CTX before the results of genetic analysis became available. CDCA treatment was suspended for the two weeks prior to urine sample collection and subsequently resumed. DNA sequencing of exons 1–9 of the CYP27A1 gene revealed c.508_509ins16, p.(Glu170ValfsTer16) and a deletion mutation. The patient was diagnosed as compound heterozygous for CTX.
Patients 4 and 5: Two sisters, aged 14 and 17 years, were born to consanguineous parents. Both had learning difficulties at school and had undergone bilateral cataract surgery at 8 and 14 years of age, respectively. Juvenile cataract is a characteristic clinical feature of CTX [13]. Routine biochemical parameters were within reference ranges; elevated plasma cholestanol had previously been reported by the referring center. CDCA treatment (10 mg/kg/day) was started based on clinical suspicion of CTX before the results of genetic analysis became available. CDCA treatment was suspended for the two weeks prior to urine sample collection and subsequently resumed. Genetic analysis revealed that both patients were homozygous for the c.646G>C (p.(Ala216Pro), rs201346271) variant, leading to a diagnosis of CTX.
Patient 6: No underlying etiological cause could be established in this patient, who presented with progressive cholestatic hepatitis with normal GGT levels. UDCA treatment (15 mg/kg/day) was initiated. UDCA treatment was discontinued 2 weeks prior to sample collection (Table 2).
Patient 7: The patient was admitted to our hospital at 7 months of age with jaundice. Laboratory evaluation showed elevated direct bilirubin, AST, ALT and INR with normal GGT levels. There was no history of parental consanguinity. UDCA treatment (10 mg/kg twice daily) was initiated. UDCA treatment was discontinued 2 weeks prior to sample collection (Table 2). The patient was subsequently lost to follow-up, and the etiology of the jaundice remained undetermined.
Patient 8: The patient was admitted to our hospital at 2 months of age with jaundice and acholic stools. ALT, AST, direct and total bilirubin levels were elevated, as shown in Table 1. The UDCA (10 mg/kg twice daily) regimen was initiated (Table 2). A Kasai portoenterostomy was performed following a diagnosis of biliary atresia.
Patient 9: The 8-month-old patient presented with direct hyperbilirubinemia and was diagnosed with progressive familial intrahepatic cholestasis type 1 (PFIC1) during follow-up. Recorded UDCA regimens were 30 mg/kg/day and, subsequently, 22 mg/kg/day (Table 2).
Patients 10–12: Clinical and laboratory investigations showed progressive cholestatic hepatitis with normal or mildly elevated GGT levels. No definitive etiological diagnosis was established. The recorded UDCA regimens were 7.5 mg/kg twice daily for patients 10 and 12, and 10 mg/kg twice daily for patient 11 (Table 2).
The demographic characteristics and biochemical data of the patient and control groups are summarized in Table 1.
Table 2 summarizes bile acid treatment in relation to urine collection, including the compound administered, daily dose, treatment interruption interval before sampling, and treatment status at the time of sampling.

2.2. Genetic Analyses

Molecular genetic testing included analysis of HSD3B7 in patients 1 and 2 and CYP27A1 in patients 3–5. HSD3B7 sequence variants were described according to the reference transcript NM_025193.4. For patients 1 and 2, genomic DNA was analyzed using a targeted next-generation sequencing panel comprising AMACR, AKR1D1, CYP27A1, and HSD3B7. Sequencing was performed on an Illumina MiSeq platform (San Diego, CA, USA) and covered the coding exons and exon–intron boundaries of the analyzed genes. Identified sequence variants were interpreted in accordance with the American College of Medical Genetics and Genomics (ACMG) criteria.
For patients 3–5, genomic DNA isolated from peripheral blood was analyzed. The coding exons 1–9 of CYP27A1 were amplified by PCR and subjected to DNA sequencing. The results specified the genomic reference sequence NG_007959.1 and the CYP27A1 transcript NM_000784; a transcript version number was not provided. In patient 3, copy-number analysis of CYP27A1 was additionally performed by multiplex ligation-dependent probe amplification (MLPA; assay designation reported as MRCH P300/EK1). Variant interpretation referenced the Human Gene Mutation Database (HGMD) and, for patient 3, MutationTaster. Formal ACMG/AMP pathogenicity categories were not provided. The molecular genetic findings are presented in Section 3, and the diagnostic status of each patient is summarized in Table 1.

2.3. Materials

Commercially available reference bile acids (Table A1): GCA, TCA, CA, GCDCA, TCDCA, CDCA, GUDCA, TUDCA, UDCA, GDCA, TDCA, DCA, TLCA and LCA were purchased from Toronto Research Chemicals (Toronto, ON, Canada). GHCA, HCA and GLCA, deuterium standards CA-d4, GCA-d4, TCA-d4, GCDCA-d4, TCDCA-d4, CDCA-3S-d5, GCDCA-3S-d5, TCDCA-3S-d5 were obtained from Steraloids Inc. (Newport, RI, USA) and Cambridge Isotope Laboratories (Tewksbury, MA, USA), respectively. Commercially unavailable bile acid types (Appendix A) TCA-3S, CA-3S, GCDCA-3S, TCDCA-3S, CDCA-3S, GUDCA-3S, TUDCA-3S, UDCA-3S, GDCA-3S, TDCA-3S, DCA-3S, GLCA-3S, TLCA-3S, LCA-3S, GCA-1β-ol, TCA-1β-ol, CA-1β-ol, GCA-6α-ol, CA-6α-ol, CDCA-1β-ol, G-Δ5-3β,7α,12α-(OH)3, T-Δ5-3β,7α,12α-(OH)3, Δ5-3β,7α,12α-(OH)3, T-Δ5-3β,7α,12α-(OH)3-3S, Δ5-3β,7α,12α-(OH)3-3S, G-Δ5-3β,7α-(OH)2, T-Δ5-3β,7α-(OH)2, Δ5-3β,7α-(OH)2, G-Δ5-3β,7α-(OH)2-3S, T-Δ5-3β,7α-(OH)2-3S, Δ5-3β,7α-(OH)2-3S, G-Δ5-3β-OH, T-Δ5-3β-OH, Δ5-3β-OH, G-Δ5-3β-OH-3S, T-Δ5-3β-OH-3S, Δ5-3β-OH-3S, Δ5-3β,12α-(OH)2, GCA-Δ4-3-one, TCA-Δ4-3-one, CA-Δ4-3-one, GCDCA-Δ4-3-one, TCDCA-Δ4-3-one, CDCA-Δ4-3-one, CA-Δ4-6-3-one, CDCA-Δ4-6-3-one, nor-CA, C27-DHCA, C27-THCA were specially synthesized by Prof. Tsuyoshi Murai (Faculty of Pharmaceutical Sciences, Health Sciences University of Hokkaido, Hokkaido, Japan) and Prof. Takashi Iida (Nihon University College of Humanities and Sciences, Department of Chemistry, Tokyo, Japan) and were kindly provided by Hiroshi Nittono (Junshin Clinic Bile Acid Institute, Tokyo, Japan). 7-dehydrocholesterol, cholestanol (5α-cholestan-3β-ol or dihydrocholesterol), cholesterol (Cholest-5-en-3β-ol) and Coprostanol (5β-cholestan-3β-ol) standards for GC–MS analysis were obtained from Sigma Chemical Co. (St. Louis, MO, USA).

2.4. LC–MS/MS Analysis

A mixed standard solution containing 66 bile acid species was prepared at 10,000 pmol/mL in 20% acetonitrile. Five-point calibration standards were prepared at 50, 100, 200, 500, 1000 pmol/mL. The stable isotope-labeled internal standards CA-d4, GCA-d4, TCA-d4, GCDCA-d4, TCDCA-d4, CDCA-3S-d5, GCDCA-3S-d5, and TCDCA-3S-d5 were used for normalization. The mixed internal-standard working solution contained each internal standard at 1000 pmol/mL. For sample extraction, 50 µL of the internal-standard working solution was added to the ethanol extraction solvent before the 2-h incubation. Internal standards were therefore introduced during extraction and were not applied directly to the filter paper with the urine sample. The internal standard assigned to each of the 66 analytes is provided in Table A1. Calibration curves were constructed using the peak-area ratio of each analyte to its assigned internal standard and fitted by unweighted linear regression.
Urine samples were stored at −80 °C until analysis. Dried urine spots were prepared from the stored urine immediately before analysis and were not stored in dried form. For each analysis, 500 µL of urine was applied to a 40-mm-diameter circle on Advantec No. 63 filter paper (Advantec MFS, Dublin, CA, USA) and allowed to dry for 4–5 h at room temperature in a climate-controlled laboratory. The spots were protected from light during drying and relative humidity was not recorded. Each dried urine spot was divided into four equal sections, and one quarter was transferred to a screw-cap vial containing 3 mL of 50% ethanol supplemented with deuterium-labeled internal standards. Samples were incubated at 25 °C for 2 h. After extraction, separate 1-mL aliquots were obtained for bile acid analysis and creatinine measurement. The aliquot used for bile acid analysis was evaporated to dryness, and the residue was reconstituted in 1 mL of sterile water with ultrasonication before LC–MS/MS analysis. Creatinine was measured using a Beckman Coulter AU680 analyzer (Fullerton, CA, USA).
Chromatographic separation was performed using an Inert Sustain C18 column (150 × 2.1 mm i.d., 3 µm; GL Sciences Inc., Tokyo, Japan). Mobile phase A consisted of 10 mM ammonium acetate in water, and mobile phase B consisted of acetonitrile containing 0.01% (w/v) formic acid. The flow rate was 0.20 mL/min, the column temperature was maintained at 40 °C, and the injection volume was 20 µL. The gradient program was as follows: 0.00–0.50 min, 10% B; 0.50–5.00 min, 10–22% B; 5.00–36.00 min, 22–60% B; 36.00–46.00 min, 60–98% B; 46.00–50.00 min, 98% B; 50.00–50.01 min, 98–10% B; and 50.01–60.00 min, 10% B. The injection volume was 20 µL. The total analytical cycle was therefore 60 min per injection, including re-equilibration at the initial mobile phase composition from 50.01 to 60.00 min, with no additional post-run interval.
The LC system comprised LC-20AD pumps operated in binary-gradient mode and a CTO-10ASvp column oven (Shimadzu Corporation, Kyoto, Japan). The autosampler was maintained at 4 °C. Mass spectrometry analysis was performed using a Shimadzu 8040 triple-quadrupole mass spectrometer (Shimadzu, Kyoto, Japan) equipped with an electrospray ionization source. Classical, hydroxylated, 3β-hydroxy-Δ5-, 3-oxo-Δ4-, and short- and long-chain bile acids were analyzed in negative-ion mode using multiple reaction monitoring (MRM). The nebulizing and drying gas flow rates were 3 and 15 L/min, respectively. The desolvation line and heat-block temperatures were 250 and 400 °C, respectively. No interface temperature was specified in the analytical method. The interface voltage was 3.5 kV, collision-induced dissociation gas pressure was 230 kPa, detector voltage was 2.30 kV, and conversion-dynode voltage was 6.0 kV. The dwell time was 10 ms per MRM transition. Compound-specific retention times, MRM transitions, collision energies, and coefficients of determination (r2) are provided in Table 3 [12,14].
Data acquisition, peak integration, and calibration were performed using Shimadzu LabSolutions LCMS software (version 5.60 SP2). Chromatographic peaks were initially integrated using the software default settings and subsequently inspected visually. No predefined numerical acceptance criteria were applied to peak integration or calibration curves. Calibration standards were analyzed within a single analytical batch, and study samples were analyzed as single injections. No dedicated quality-control samples were included in the LC–MS/MS analytical batch. The injection sequence consisted of calibration standards followed by control and patient samples.
The dried urine spot extraction procedure and LC–MS/MS method were adapted from previously published procedures [12,14]. Analytical evaluation in the present study was limited to the five-point calibration curves and their coefficients of determination reported in Table 3. Urinary bile acid concentrations obtained using this method provide semi-quantitative estimates rather than fully validated quantitative measurements.

2.5. GC–MS Analysis

Stock solutions of 7-dehydrocholesterol and 5α-cholestanol were prepared in heptane at concentrations of 624 and 643 µmol/L, respectively, whereas the cholesterol stock solution was prepared in methanol at 1164 µmol/L. Coprostanol (5β-cholestan-3β-ol) was used as an internal standard. Six-point calibration was performed separately for each sterol. The plasma-equivalent calibration concentrations were 11.64, 23.28, 46.56, 93.12, 186.24, and 372.48 mg/dL for cholesterol and 0.3, 0.6, 1.2, 2.4, 4.8, and 9.6 µg/mL for both 7-dehydrocholesterol and 5α-cholestanol. Calibrators were subjected to the same hydrolysis, extraction, evaporation, and derivatization procedures as the study samples. For sample preparation, 100 µL of plasma and 100 µL of coprostanol internal standard solution (0.5 mg/mL in methanol; 50 µg per vial) were added to 3 mL of 0.32 M potassium hydroxide in ethanol. Samples were incubated at 55 °C for 120 min for alkaline hydrolysis. After cooling, 3 mL of water and 2 mL of heptane were added, and the samples were mixed for 10 min. The organic phase was transferred to a glass vial and evaporated to dryness under a stream of nitrogen. The dried extract was derivatized with 50 µL pyridine and 100 µL bis(trimethylsilyl) trifluoroacetamide containing +10% trimethylchlorosilane. Samples were incubated at 80 °C for 1 h before GC–MS. Sterol analysis was performed using a Shimadzu QP2010 GC–MS system (Shimadzu, Kyoto, Japan) operated in electron ionization mode and equipped with an Rtx-1701 capillary column (30 m × 0.25 mm i.d., 0.25 µm film thickness; Restek, Bellefonte, PA, USA). A 1-µL aliquot was injected in split mode at a split ratio of 50:1, with the injector maintained at 300 °C. Helium was used as the carrier gas under linear-velocity control. The oven temperature was maintained at 90 °C for 3 min, increased at 25 °C/min to 260 °C and held for 28 min, then increased at 1 °C/min to 275 °C and held for 13 min. The total run time was 65.8 min. The column head pressure was 49.2 kPa, with a total flow of 43.8 mL/min, a column flow of 0.78 mL/min, a linear velocity of 32.7 cm/s, and a purge flow of 4.0 mL/min. The ion-source and interface temperatures were 200 and 230 °C, respectively. Data were acquired in selected-ion monitoring (SIM) mode. The monitored ions were m/z 306.4 for 5α-cholestanol, m/z 325.4 for 7-dehydrocholesterol, and m/z 329.4 for cholesterol [15]. GC–MS data acquisition and processing were performed using Shimadzu GCMSsolution software (version 4.44). For both calibrators and study samples, coprostanol was added before alkaline hydrolysis and extraction. The analytical response for each sterol was expressed as the analyte-to-coprostanol peak-area ratio multiplied by 100. Separate calibration curves were constructed for cholesterol, 7-dehydrocholesterol, and 5α-cholestanol. Study-specific validation data for accuracy, intra- and inter-assay precision, selectivity, extraction recovery, limits of quantification, and analyte stability were not available.

2.6. Statistical Analysis

Statistical analyses were performed using IBM SPSS Statistics for Windows (version 22.0; IBM Corp., Armonk, NY, USA). Analyses were descriptive because of the clinical heterogeneity of the cohort and the small number of patients within individual diagnostic categories; therefore, no inferential comparisons between patients and controls were performed. Control age, clinical biochemical variables, and plasma sterol concentrations are presented as mean ± standard deviation, whereas individual patient values are reported separately. Categorical variables are summarized as counts and, where appropriate, percentages. Table 4 presents urinary bile acid concentrations and their relative contributions to total urinary bile acids. For each individual, the percentage contribution of a bile acid group was calculated as the concentration of that group divided by total urinary bile acid concentration × 100. Control concentrations and percentages are reported as arithmetic means calculated among individuals with an available positive numerical result for the corresponding bile acid group. Because the number of contributing control samples varied among bile acid groups, the mean percentages across groups are not expected to sum to 100%. In Supplementary Table S1, bile acid concentrations in controls and patients are summarized as arithmetic mean (minimum–maximum) together with the frequency of available positive numerical results, expressed as n/N (%), where N = 50 for controls and N = 12 for patients. When n = 1, the single observed value is reported without a range; when n = 0, the concentration is indicated as unavailable and the frequency as 0/N (0%). Zero-coded entries and observations without a numerical result were excluded from summary calculations, without imputation. Zero-coded entries were not interpreted as analytically confirmed zero concentrations. Group totals were calculated as the sum of available numerical results for the constituent bile acids; when none of the constituent analytes had an available numerical result, the group total was considered unavailable. Analyte-specific validated limits of detection (LOD) and lower limits of quantification (LLOQ) were not established in this study. Consequently, the dataset does not permit distinction between the true absence of an analyte and a signal below the analytical detection or quantification limit. Detection frequencies therefore represent the frequency of recorded positive numerical results rather than analytically validated detection rates. Minimum–maximum values represent the observed range among participants with available positive numerical results and were used only for descriptive comparison of individual patient profiles. These ranges were not interpreted as population-based reference intervals or diagnostic cutoffs. Because percentage contributions are compositional variables sharing total urinary bile acids as a common denominator, they were interpreted together with the corresponding absolute concentrations. In particular, a low absolute concentration may constitute a relatively large percentage when the total urinary bile acid concentration is low. Conversely, marked accumulation of a treatment-related or otherwise dominant bile acid species may reduce the proportional contribution of other components without a corresponding reduction in their absolute concentrations. Additional descriptive analyses were performed to explore selected biochemical patterns. The 3β-hydroxy-Δ5/classical bile acid concentration ratio was calculated for patients 1 and 2, and the 3-oxo-Δ4/classical bile acid concentration ratio for patients 3–5. Ratios were calculated only when both group totals were available, and the denominator was greater than zero. These ratios are dimensionless descriptive measures and were not interpreted using validated diagnostic thresholds. In an exploratory analysis, analytes assigned as UDCA, GUDCA, TUDCA, and their 3-sulfate conjugates were excluded from patient and control profiles. Group concentrations and their percentage contributions to the retained total urinary bile acid concentration were then recalculated and are presented in the second block of Table 4. Patient group totals were derived from the individual-species concentrations reported in Supplementary Table S1. For controls, recalculation was performed at the individual-participant level before group averaging, using the same inclusion rules as in the primary analysis. This exploratory omission was based on the reported analyte assignments and should not be interpreted as complete removal of all UDCA-derived metabolites or as a formal correction for treatment effects. For patients 1 and 3–5, the plasma cholestanol-to-cholesterol mass ratio was calculated after converting cholesterol concentrations from mg/dL to µg/mL. Cholestanol concentration (µg/mL) was then divided by cholesterol concentration (µg/mL).

2.7. Use of Generative Artificial Intelligence

OpenAI ChatGPT (GPT-6) was used for language editing, manuscript formatting, and graphical refinement of Figure 1. The authors reviewed and verified the scientific accuracy of all outputs and take full responsibility for the final content.

3. Results

Five patients had molecularly confirmed inborn errors of bile acid synthesis: HSD3B7 deficiency in patients 1 and 2 and cerebrotendinous xanthomatosis (CTX) in patients 3–5. Patient 8 had biliary atresia, and patient 9 had progressive familial intrahepatic cholestasis type 1. No definitive etiological diagnosis was established in patients 6, 7, or 10–12. The enzyme deficiencies considered in patients 6 and 7 were based on biochemical findings and remained unconfirmed. Molecular genetic analysis identified homozygous HSD3B7 variants in patients 1 and 2: NM_025193.4:c.598C>T (p.(Gln200Ter)) and NM_025193.4:c.45_46del (p.(Gly17LeufsTer26)), respectively. According to the respective laboratory reports, the variant identified in patient 1 was classified as likely pathogenic and that identified in patient 2 as pathogenic according to ACMG criteria. Patient 3 was heterozygous for a CYP27A1 insertion reported as c.508_509ins16 (p.(Glu170ValfsTer16)). Subsequent multiplex ligation-dependent probe amplification (MLPA) demonstrated a heterozygous single-copy loss of exon 6, reported as “rsa 2q35 (CYP27A1 exon 6)x1.” The father was heterozygous for p.(Glu170ValfsTer16), whereas the mother was reported to be homozygous for the CYP27A1 exon 6 deletion. These parental findings support the presence of the two CYP27A1 variants in trans in patient 3 and are consistent with compound heterozygosity. Patients 4 and 5 were homozygous for the CYP27A1 variant c.646G>C (p.(Ala216Pro); rs201346271). This variant was identified as disease-causing for CTX based on information available in the Human Gene Mutation Database (HGMD).
Results for the 66 urinary bile acid species analyzed by LC–MS/MS are reported as semi-quantitative estimates normalized to urinary creatinine (µmol/mmol creatinine). Calibration curves covered the range of 50–1000 pmol/mL, and the corresponding coefficients of determination (r2) are presented in Table 3. Bile acid species were classified into five groups: classical, hydroxylated, 3β-hydroxy-Δ5-, 3-oxo-Δ4-, and short- and long-chain bile acids. For each profile, both group concentrations and their percentage contributions to total urinary bile acids were evaluated. Plasma cholesterol measured by GC–MS is reported in mg/dL, whereas 5α-cholestanol and 7-dehydrocholesterol are reported in µg/mL (Table 4). Individual urinary bile acid results for patients and controls are provided in Supplementary Table S1.
In patient 1, the total concentration of 3β-hydroxy-Δ5 bile acids was 21.011 µmol/mmol Cr, corresponding to 63.9% of total urinary bile acids. The predominant species included Δ5-3β,7α-(OH)2-3S (14.549 µmol/mmol Cr), G-Δ5-3β,7α-(OH)2 (4.394 µmol/mmol Cr), and Δ5-3β,7α,12α-(OH)3 (1.816 µmol/mmol Cr) (Table 4 and Supplementary Table S1).
In patient 2, the total 3β-hydroxy-Δ5 bile acid concentration was 0.158 µmol/mmol Cr, corresponding to 22.1% of total urinary bile acids. Δ5-3β-OH was present at 0.141 µmol/mmol Cr. Total urinary bile acids were 0.72 µmol/mmol Cr, which fell within the observed range among controls. The 3β-hydroxy-Δ5/classical bile acid concentration ratios were 1.799 in patient 1 and 0.301 in patient 2. In patient 2, Δ5-3β,7α-(OH)2-3S was reported at 0.001 µmol/mmol Cr, whereas no numerical results were recorded for G-Δ5-3β,7α-(OH)2-3S or Δ5-3β,7α,12α-(OH)3-3S (Supplementary Table S1). Thus, patient 2 did not show the marked predominance of sulfated dihydroxy-Δ5 bile acids observed in patient 1, representing an atypical urinary biochemical profile in the context of the molecularly confirmed HSD3B7 diagnosis.
Patient 3, who had compound-heterozygous CYP27A1 variants and a confirmed diagnosis of CTX, had urinary CDCA-1β-ol and CA-Δ4,6-3-one concentrations of 0.128 and 0.163 µmol/mmol Cr, respectively (Supplementary Table S1). The total hydroxylated and 3-oxo-Δ4 bile acid concentrations were 0.133 and 0.170 µmol/mmol Cr, corresponding to 19.7% and 25.1% of total urinary bile acids, respectively. Classical bile acids accounted for 50.7% of the urinary bile acid profile. Total urinary bile acids were 0.68 µmol/mmol Cr, within the observed control range (Table 4). The 3-oxo-Δ4/classical bile acid ratio was 0.496. The 3β-hydroxy-Δ5 bile acid concentration was 0.031 µmol/mmol Cr, also within the observed control range.
In siblings 4 and 5, with confirmed CTX, CA-Δ4,6-3-one concentrations were 0.307 and 0.214 µmol/mmol Cr, respectively, whereas G-Δ5-3β-OH-3S concentrations were 0.069 and 0.045 µmol/mmol Cr (Supplementary Table S1). Both G-Δ5-3β-OH-3S concentrations were within the observed control range (0.002–0.122 µmol/mmol Cr), with positive numerical results reported in 38 of 50 controls (Supplementary Table S1). Patient 4 additionally had TCA-1β-ol at 0.149 µmol/mmol Cr. In patient 4, the 3-oxo-Δ4, 3β-hydroxy-Δ5, and hydroxylated bile acid groups accounted for 36.2%, 30.2%, and 17.1% of total urinary bile acids, respectively. In patient 5, the 3-oxo-Δ4 and 3β-hydroxy-Δ5 groups accounted for 21.6% and 13.6%, respectively; no numerical result was reported for the hydroxylated bile acid group. Total urinary bile acid concentrations were 0.99 and 1.14 µmol/mmol Cr in patients 4 and 5, respectively, both within the observed control range. The corresponding 3-oxo-Δ4 group concentrations were 0.357 and 0.247 µmol/mmol Cr, and the 3β-hydroxy-Δ5 group concentrations were 0.298 and 0.156 µmol/mmol Cr. The 3-oxo-Δ4/classical bile acid ratios were 2.204 and 0.334, respectively (Table 4). The plasma cholestanol/cholesterol mass ratios were 3.11 × 10⁻³, 2.58 × 10⁻³, and 2.01 × 10⁻³ in patients 3, 4, and 5, respectively. For descriptive comparison, the corresponding ratio in patient 1 with HSD3B7 deficiency was 2.57 × 10⁻³. These ratios were calculated from the individual sterol concentrations reported in Table 4. In controls, the plasma cholestanol/cholesterol mass ratio was (1.28 ± 0.33) × 10−3 (mean ± SD; n = 46), calculated from individual paired concentrations after conversion to the same mass concentration units.
In patient 6, urinary TCA-1β-ol and CA-Δ4,6-3-one concentrations were 1.45 and 0.437 µmol/mmol Cr, respectively (Supplementary Table S1). Hydroxylated and 3-oxo-Δ4 bile acids accounted for 47.5% and 13.4% of total urinary bile acids, respectively, whereas classical bile acids accounted for 38.4% (Table 4).
In patient 7, Δ5-3β-OH was detected at 1.346 µmol/mmol Cr. The 3β-hydroxy-Δ5 and classical bile acid groups accounted for 18.1% and 68.9% of total urinary bile acids, respectively (Table 4 and Supplementary Table S1). C27-DHCA and C27-THCA were also reported at concentrations of 0.059 and 0.073 µmol/mmol Cr, respectively.
Patients 8–12 were receiving UDCA at the time of urine collection (Table 2). GUDCA was the predominant assigned species in patients 8–11, and classical bile acids comprised the largest proportion of their urinary profiles. Patient 8 also had detectable CA-Δ4,6-3-one and GCA-6α-ol, whereas GCA-6α-ol was additionally detected in patient 11. CA-Δ4,6-3-one was detected in patients 9 and 10. Patient 12 had a lower GUDCA concentration than patients 8–11, although GUDCA remained the predominant assigned species; T-Δ5-3β-OH-3S and CA-Δ4,6-3-one were also detected. Group concentrations and percentage contributions are presented in Table 4, and individual bile acid species are detailed in Supplementary Table S1.
In the exploratory analysis excluding species assigned as UDCA, GUDCA, TUDCA, and their 3-sulfate conjugates, the retained classical bile acid concentrations in patients 8–12 were 1.091, 31.614, 15.866, 7.594, and 0.380 µmol/mmol Cr, respectively (second block of Table 4). In patient 8, the 3-oxo-Δ4 group was the largest retained group at 1.276 µmol/mmol Cr, of which CA-Δ4,6-3-one accounted for 0.904 µmol/mmol Cr. Classical bile acids remained the largest retained group in patients 9–11. In patient 12, the retained classical, 3-oxo-Δ4, and 3β-hydroxy-Δ5 bile acid concentrations were 0.380, 0.220, and 0.161 µmol/mmol of Cr, respectively.

4. Discussion

Inborn errors of bile acid synthesis (IEBAS) encompass a heterogeneous group of disorders with clinical manifestations ranging from neonatal or infantile cholestatic liver disease to later-onset neurological involvement. Importantly, several of these disorders are amenable to specific treatment, making timely recognition clinically relevant. In this descriptive case series, urinary profiles of 66 bile acid species were characterized in 12 patients evaluated for suspected IEBAS or unexplained cholestasis and compared descriptively with those of 50 healthy controls. Five patients had genetically confirmed IEBAS: HSD3B7 deficiency in patients 1 and 2 and cerebrotendinous xanthomatosis (CTX) in patients 3–5. Patient 8 had biliary atresia and patient 9 had progressive familial intrahepatic cholestasis type 1 (PFIC1), whereas no definitive etiological diagnosis was established in patients 6, 7, and 10–12. The findings therefore illustrate the range of urinary bile acid patterns encountered during the diagnostic evaluation of patients with confirmed, suspected, or alternative causes of cholestatic disease.

4.1. 3β-Hydroxy-Δ5-Steroid Dehydrogenase Deficiency (HSD3B7)

In patient 1 with genetically confirmed HSD3B7 deficiency, the urinary bile acid profile was characterized by prominent 3β-hydroxy-Δ5 metabolites, including sulfated dihydroxy-Δ5, glycine-conjugated dihydroxy-Δ5, and trihydroxy-Δ5 bile acids. Such metabolites are well-established biochemical features of 3β-hydroxy-Δ5-C27-steroid dehydrogenase/isomerase deficiency [9,11].
The HSD3B7 gene encodes 3β-hydroxy-Δ5-C27-steroid dehydrogenase/isomerase, which catalyzes oxidation of the 3β-hydroxyl group of 7α-hydroxycholesterol to a 3-oxo group together with isomerization of the Δ5 double bond to Δ4, yielding 7α-hydroxy-4-cholesten-3-one [16]. Subsequent reactions involving Δ4-3-oxosteroid 5β-reductase and 3α-hydroxysteroid dehydrogenase establish the 3α-hydroxy-5β configuration characteristic of primary bile acids. Loss of HSD3B7 activity disrupts this early steroid-ring modification step and results in accumulation of bile acid intermediates retaining the 3β-hydroxy-Δ5 configuration, including 3β,7α-dihydroxy-5-cholenoic acid and 3β,7α,12α-trihydroxy-5-cholenoic acid [9]. These C24 bile acids may subsequently undergo sulfation at the 3β-hydroxyl group and glycine or taurine conjugation at the side-chain carboxyl group [17].
Accordingly, patients with HSD3B7 deficiency typically show reduced formation of conventional primary bile acids together with urinary accumulation of sulfated and conjugated 3β-hydroxy-Δ5 intermediates [9,18]. In patient 1, the total 3β-hydroxy-Δ5 bile acid concentration was 21.011 µmol/mmol Cr and constituted the predominant abnormal metabolite group. The presence and distribution of the individual sulfated dihydroxy-, glycine-conjugated dihydroxy-, and trihydroxy-Δ5 species were consistent with the expected biochemical phenotype and provided metabolic characterization complementary to the molecular diagnosis.
The concentrations assigned to GDCA-3S and TDCA-3S in patient 1 (3.62 and 4.84 µmol/mmol Cr, respectively; Supplementary Table S1) should, however, be interpreted cautiously because of possible analytical interference from structurally related isomers. For this reason, interpretation was based primarily on the genetically established diagnosis, the overall 3β-hydroxy-Δ5 bile acid pattern, the absolute concentration of this metabolite group, and the distribution of individual metabolites within the group rather than on any single isomeric species.
In patient 2, the 3β-hydroxy-Δ5 bile acid concentration was 0.158 µmol/mmol Cr, accounting for 22.1% of a total urinary bile acid concentration of 0.715 µmol/mmol Cr. This concentration was slightly higher than the highest observed value among controls with available numerical results (0.128 µmol/mmol Cr), although the control range was descriptive and was not established as a reference interval. In contrast to patient 1, however, patient 2 showed an atypical biochemical phenotype, with the monohydroxy species Δ5-3β-OH predominating within the 3β-hydroxy-Δ5 fraction. The diagnosis of HSD3B7 deficiency was established by the identification of a homozygous pathogenic HSD3B7 variant.
Predominance of 3β-monohydroxy-Δ5-C24 bile acids is not specific to a single bile acid synthesis defect. Kimura et al. reported excessive urinary 3β-monohydroxy-Δ5-C24 bile acids in HSD3B7 deficiency and emphasized that this pattern does not necessarily indicate primary oxysterol 7α-hydroxylase deficiency [19]. Similarly, Mizuochi et al. described substantial urinary Δ5-3β-OH excretion in a patient with HSD3B7 deficiency [20]. These observations support the possibility of biochemical heterogeneity within genetically confirmed HSD3B7 deficiency and underscore the importance of interpreting urinary bile acid profiles together with molecular findings rather than assigning a diagnosis on the basis of a single metabolite species.
The classical bile acid concentration in patient 2 was 0.525 µmol/mmol Cr, accounting for 73.4% of total urinary bile acids. The signal assigned to GUDCA contributed 0.433 µmol/mmol Cr, corresponding to 82.5% of the classical fraction and 60.6% of total urinary bile acids (Table 4 and Supplementary Table S1). However, chromatographic separation of GUDCA from GCDCA and GDCA was not verified; therefore, contributions from incompletely resolved isomers cannot be excluded. Although UDCA treatment had been discontinued 2 weeks before sampling, this signal cannot be confidently attributed to residual treatment. After omission of UDCA-assigned species, the retained classical bile acid concentration was approximately 0.09 µmol/mmol Cr, representing 32.4% of the retained total, whereas the 3β-hydroxy-Δ5 fraction increased from 22.1% to 56.2%. The absolute concentration of 3β-hydroxy-Δ5 bile acids remained unchanged at 0.158 µmol/mmol Cr. This percentage increase reflects the reduced denominator and, given the uncertainty in the excluded analyte assignments, does not independently establish a characteristic HSD3B7 biochemical profile.

4.2. Sterol 27-Hydroxylase Deficiency [Cerebrotendinous Xanthomatosis (CTX)]

Patients 3–5 had genetically confirmed CTX but showed heterogeneous urinary bile acid profiles. Hydroxylated bile acids were detected in patients 3 and 4, whereas no numerical result was available for this group in patient 5. CA-Δ4,6-3-one was detected in all 12 patients and reached its highest concentration in patient 8 with biliary atresia; therefore, the presence of this metabolite was not specific to CTX in the present series.
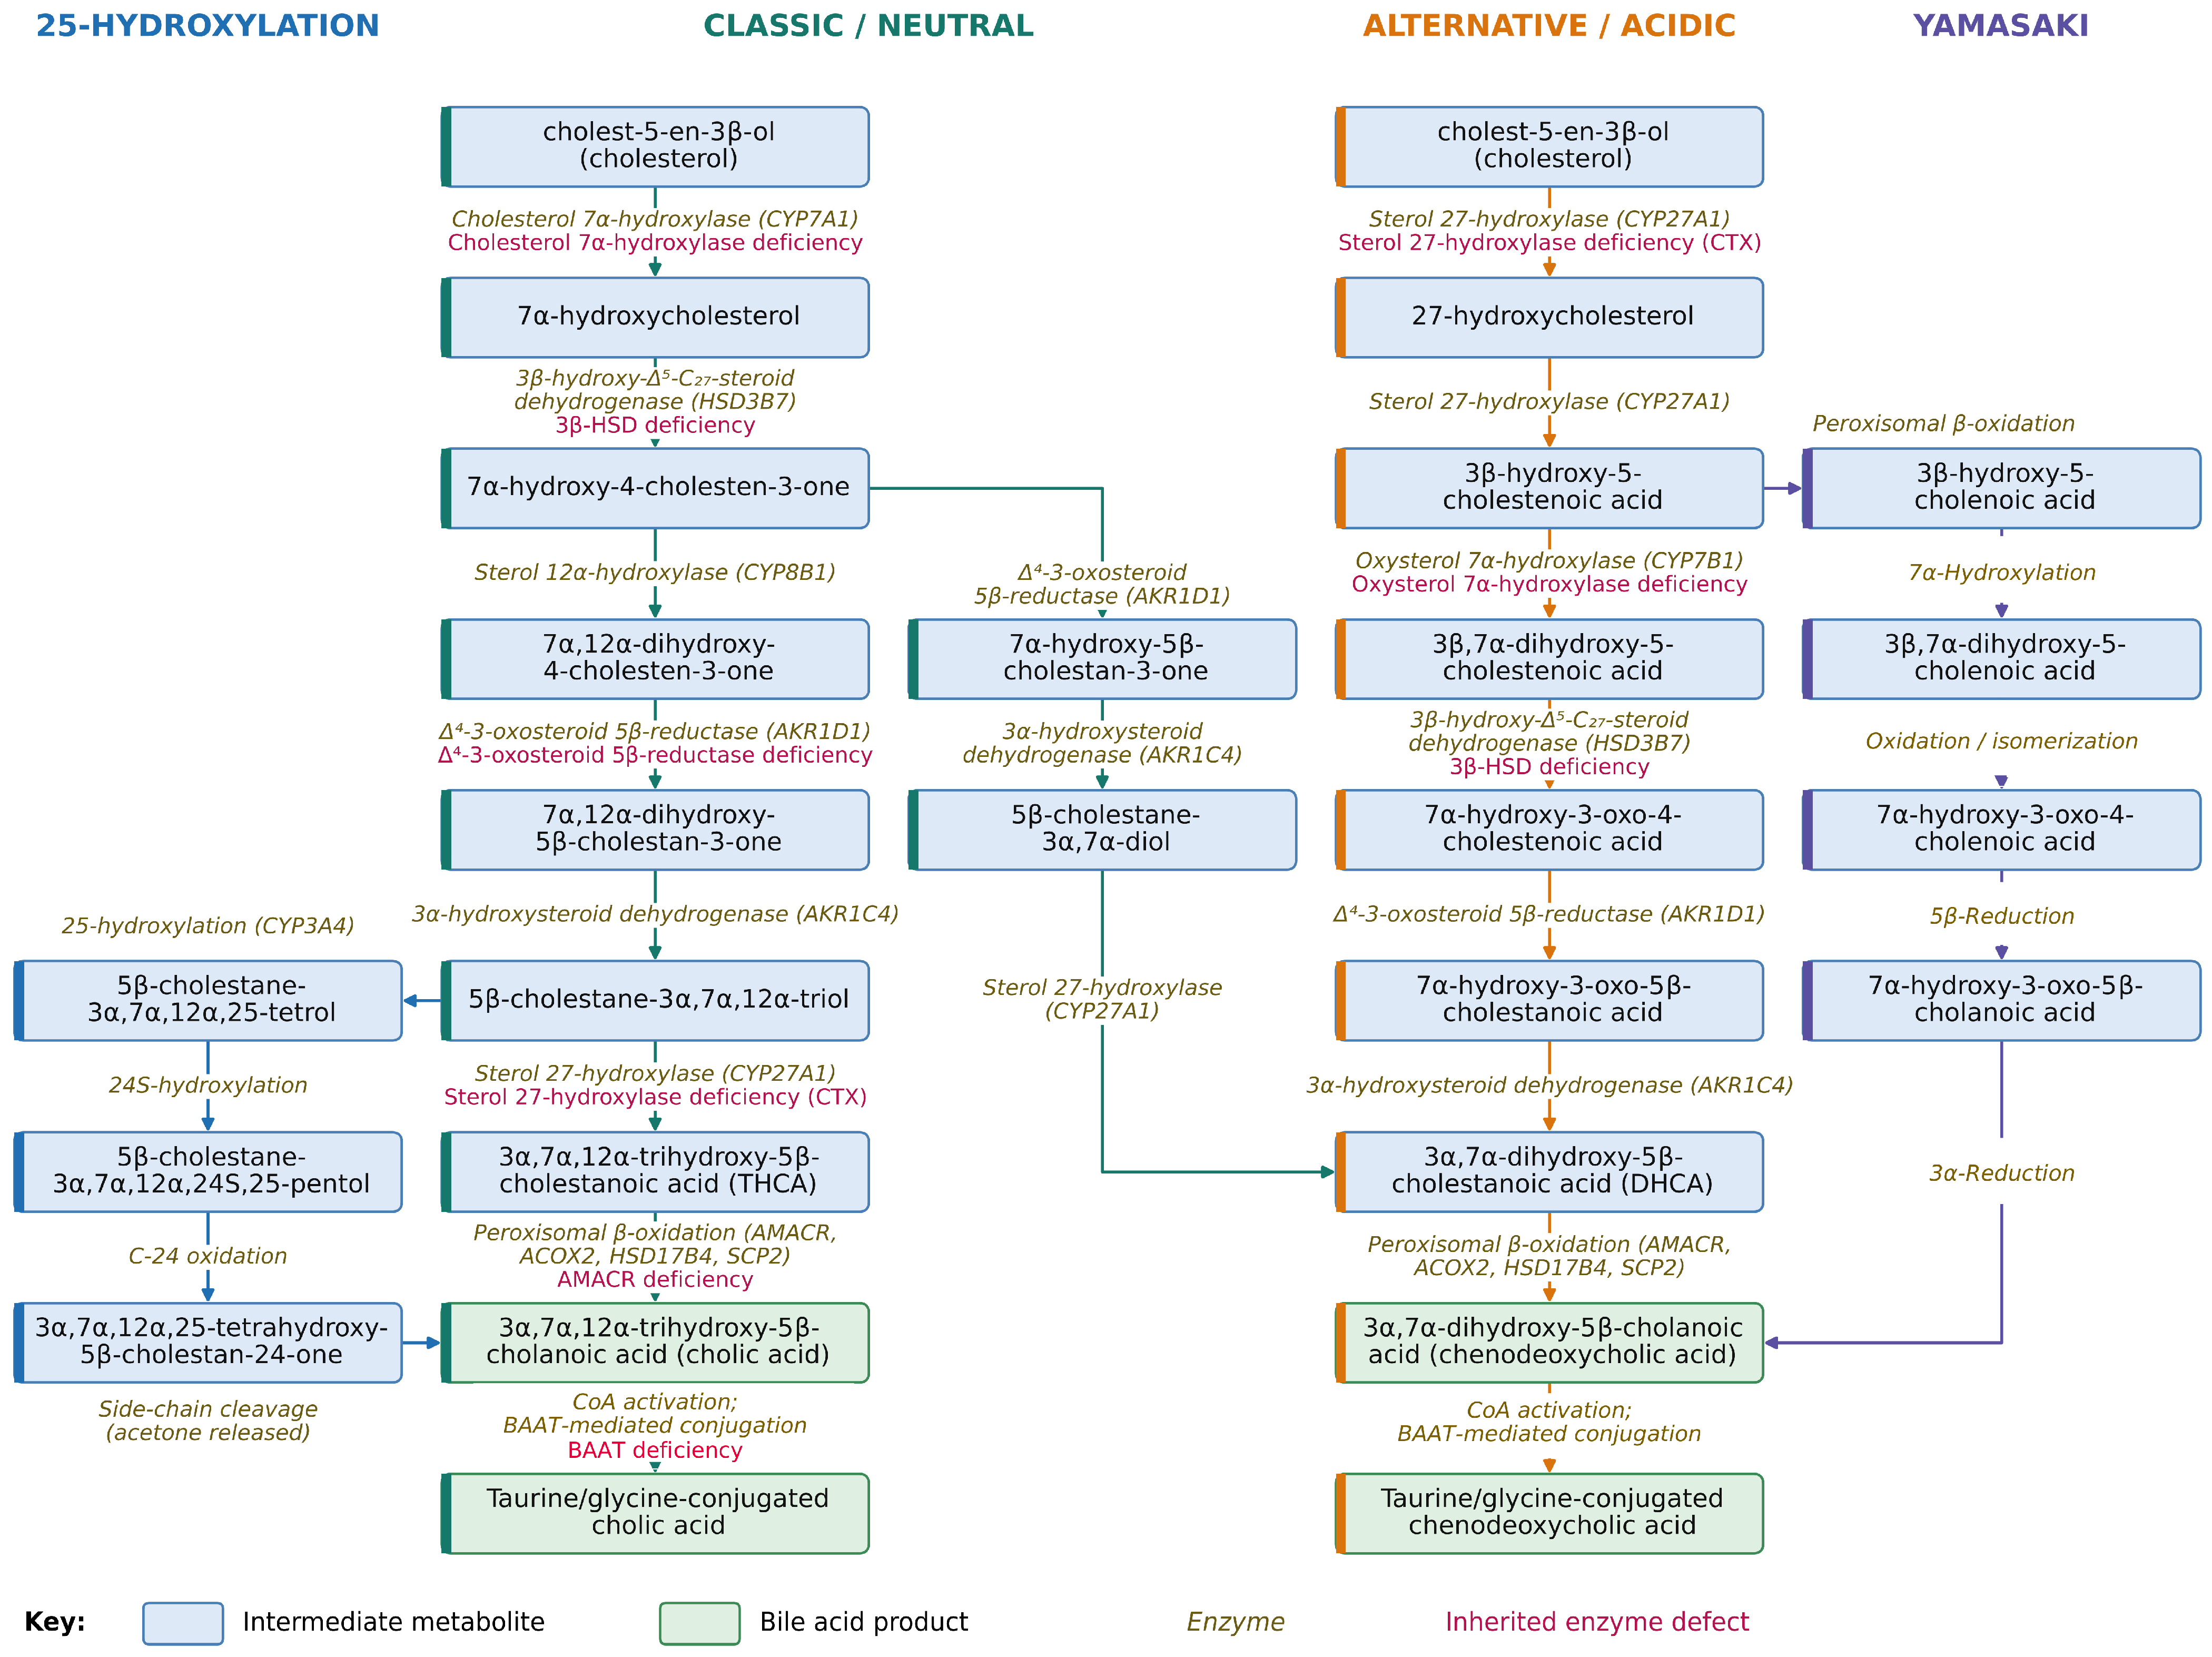
Sterol 27-hydroxylase is a mitochondrial enzyme encoded by CYP27A1 and participates in both the classical/neutral and alternative/acidic pathways of bile acid synthesis by catalyzing sterol 27-hydroxylation (Figure 1) [21]. Its deficiency causes CTX, an autosomal recessive disorder characterized by progressive neurological dysfunction, juvenile cataracts, tendon xanthomas, and other systemic manifestations [22,23,24]. In CTX, impairment of CYP27A1 activity reduces primary bile acid synthesis and promotes accumulation of sterol intermediates, cholestanol, and bile alcohols [7]. Bile alcohol glucuronides represent an important biochemical feature of CTX [25], although these metabolites were not included in the analytical panel used in the present study.
Plasma cholestanol concentrations were 7.95, 4.16, and 3.44 µg/mL in patients 3–5, respectively, compared with a control mean of 2.68 ± 0.99 µg/mL. However, patient 1 with HSD3B7 deficiency had a plasma cholestanol concentration of 5.43 µg/mL, exceeding the concentrations observed in patients 4 and 5 (Table 4). Thus, cholestanol concentration alone did not discriminate CTX from other disorders in this small cohort. This is consistent with previous observations that increased plasma cholestanol is not specific for CTX and may occur in other liver diseases [26]. The diagnoses of CTX in patients 3–5 were therefore based primarily on their clinical phenotypes and CYP27A1 findings, with plasma sterol and urinary bile acid measurements providing complementary biochemical characterization.
Patient 6 showed a different clinical situation. Classical, hydroxylated, and 3-oxo-Δ4 bile acids accounted for 38.4%, 47.5%, and 13.4% of total urinary bile acids, respectively (Table 4). Although this distribution raised CTX among the biochemical differential considerations, the patient remained without a definitive etiological diagnosis. No plasma sample was available for cholestanol measurement, and molecular confirmation was not obtained. In addition, patient 6 was only 4 months old; therefore, the urinary bile acid profile must be interpreted in the context of developmental variation associated with infancy as well as the underlying cholestatic liver disease.

4.3. Biochemical Hypotheses in Patient 7 with Unresolved Cholestasis

The urinary bile acid profile of patient 7 prompted consideration of defects affecting early steps of bile acid synthesis, including CYP7B1, CYP7A1, and HSD3B7, although no definitive etiological diagnosis was established. Δ5-3β-OH was the predominant component of the 3β-hydroxy-Δ5 bile acid group, with a concentration of 1.346 µmol/mmol Cr, whereas the total 3β-hydroxy-Δ5 concentration was 1.781 µmol/mmol Cr. C27-DHCA and C27-THCA were also detected, raising peroxisomal disorders as an additional biochemical consideration because cholestanoic acid intermediates may accumulate in disorders of peroxisomal bile acid metabolism [11].
Oxysterol 7α-hydroxylase, encoded by CYP7B1, catalyzes 7α-hydroxylation of oxysterol intermediates in the alternative/acidic pathway, whereas cholesterol 7α-hydroxylase, encoded by CYP7A1, catalyzes the initial 7α-hydroxylation of cholesterol in the classical/neutral pathway (Figure 1). The relative contribution of these pathways varies with age, with the alternative pathway having greater importance during early life [7,27]. Consequently, interpretation of an unusual monohydroxy-Δ5 bile acid profile in a 7-month-old infant requires particular caution.
Although the findings in patient 7 generated biochemical hypotheses, none of the observed metabolites or group distributions were considered diagnostic of a specific enzyme defect. The patient was subsequently lost to follow-up, precluding further molecular or biochemical clarification. This case illustrates the value of broad bile acid profiling for generating differential diagnostic hypotheses, while also demonstrating the limitations of assigning a specific defect in the absence of confirmatory molecular or longitudinal evidence.

4.4. Influence of Bile Acid Treatment on Urinary Profiles

Patients 8–12 were receiving UDCA at the time of urine collection (Table 2), and their urinary profiles were dominated by species assigned to UDCA metabolism, particularly GUDCA. The clinical diagnoses in these patients were heterogeneous: patient 8 had biliary atresia, patient 9 had PFIC1, and patients 10–12 remained without a definitive etiological diagnosis. Consequently, the predominance of UDCA-related species was interpreted primarily in the context of documented treatment rather than as a disease-specific metabolic pattern.
Free bile acids and their conjugated derivatives were reported as separate analytes in this study. Notably, no positive numerical results were reported for unconjugated UDCA, CDCA, or DCA in any of the 62 participants, including patients 8–12, who were receiving UDCA at sampling. The species assigned to GUDCA was present in all five UDCA-treated patients and predominated in their measured urinary profiles.
This observation aligns with clinical urinary profiling studies which demonstrate that both endogenous and exogenous bile acids undergo rapid and extensive hepatic and renal biotransformation. Following intestinal absorption and first-pass hepatic extraction, administered UDCA is efficiently converted into glycine- and taurine-conjugated UDCA, as well as its sulfate and N-acetylglucosamine conjugates. Because renal excretion overwhelmingly favors these highly water-soluble conjugated species, unconjugated UDCA, CDCA, and DCA remain at negligible levels or fall below the limit of quantification in urine [28]. These findings support the interpretation that measurement of unconjugated UDCA alone does not capture the full spectrum of urinary UDCA derivatives. The absence of reported positive numerical results for unconjugated UDCA, CDCA, and DCA was therefore considered alongside the findings for conjugated species. Since analyte-specific limits of detection and quantification were not established, this observation was not interpreted as evidence that the unconjugated species were absent from the samples or had undergone complete conversion.
The exploratory analysis excluding species assigned as UDCA, GUDCA, TUDCA, and their 3-sulfate conjugates provided a descriptive view of the remaining measured bile acid components (second block of Table 4). Importantly, this analysis does not reconstruct an untreated metabolic profile, because bile acid therapy may alter endogenous bile acid synthesis, pool composition, and feedback regulation. Similarly, ratios between atypical and classical bile acid groups were interpreted together with their absolute concentrations. For example, the relatively high 3-oxo-Δ4/classical ratio in patient 4 occurred in the setting of a low absolute classical bile acid concentration. In controls, a positive numerical result assigned to GUDCA was recorded in all 50 individuals, with a mean concentration of 0.515 µmol/mmol Cr, compared with 0.001 µmol/mmol Cr for GCDCA and 0.008 µmol/mmol Cr for GCA (Supplementary Table S1). Because chromatographic separation of GUDCA, GCDCA, and GDCA was not verified, the apparent predominance of GUDCA cannot be confidently interpreted as a biological finding. Omission of UDCA-assigned species reduced the mean control total from 0.59 to 0.08 µmol/mmol Cr, predominantly through removal of the GUDCA-assigned signal. If this signal includes contributions from other isomers, those contributions would also be excluded. Accordingly, the retained totals and percentages in Table 4 depend on the original analyte assignments and should not be interpreted as a verified non-UDCA bile acid profile.
Treatment status is particularly relevant when urinary bile acid profiling is used during the diagnostic evaluation of suspected IEBAS. Long-term cholic acid treatment has been associated with suppression of atypical urinary bile acid metabolites, with increases reported during periods of poor adherence [29]. UDCA treatment has likewise been shown to alter urinary bile acid composition [30].
The present study was not designed to determine an appropriate diagnostic washout interval, because serial sampling before and after treatment withdrawal was not performed. Moreover, withdrawal of bile acid therapy may carry clinical risks. In the RESTORE trial involving patients with CTX aged ≥16 years, withdrawal of chenodeoxycholic acid resulted in increases in disease biomarkers, and rescue treatment was required in a substantial proportion of participants [31]. Similarly, deterioration in liver biochemistry has been reported following UDCA withdrawal in patients with primary sclerosing cholangitis [32]. Therefore, routine withdrawal of clinically necessary bile acid therapy solely to facilitate urinary profiling cannot be recommended on the basis of the present data. When treatment interruption is considered for a specific diagnostic purpose, the potential benefit should be weighed against the clinical status of the individual patient and undertaken with appropriate monitoring.

4.5. Strengths and Limitations

The strength of the present study is the comprehensive targeted assessment of 66 urinary bile acid species encompassing classical, hydroxylated, 3β-hydroxy-Δ5-, 3-oxo-Δ4, and short- and long-chain bile acids. This broad analytical coverage enabled characterization of individual bile acid species as well as their distribution across metabolite groups and allowed the biochemical findings to be interpreted alongside clinical and molecular data. The inclusion of genetically confirmed HSD3B7 deficiency and CTX cases also provided an opportunity to examine biochemical heterogeneity even within established disorders.
However, certain limitations should nevertheless be considered. First, the study comprised a small and clinically heterogeneous cohort, reflecting the rarity of IEBAS, precluding meaningful disease-specific statistical comparisons. Second, the age difference between patients and controls represents a limitation. Urinary bile acid composition undergoes developmental changes during infancy, including variation in hydroxylated and unsaturated ketonic bile acid species. Urinary creatinine excretion is also influenced by age, body size, and muscle mass; therefore, normalization to creatinine does not eliminate age-related differences. For this reason, profiles from infants were interpreted descriptively in the context of age, cholestasis, and treatment, with the older controls serving as a comparison group rather than as a source of age-specific reference intervals. Third, bile acid therapy may represent a potential confounder. The urinary profiles were assessed cross-sectionally and reported urinary bile acid concentrations should be regarded as semi-quantitative estimates.
Incomplete chromatographic discrimination of certain structurally isomeric bile acids limits unequivocal species-level assignment, including GCDCA-3S/GDCA-3S and GCDCA/GUDCA/GDCA. This uncertainty also affects analyses that selectively omit an affected species. In particular, the predominance of the GUDCA-assigned signal in controls and in the classical fraction of patient 2 limits interpretation of the exploratory analysis excluding UDCA-assigned species. The retained totals, relative group contributions, and comparisons based on these quantities are therefore conditional on the original assignments. The molecularly established diagnoses are independent of this analytical uncertainty, but biochemical interpretations involving the affected signals and derived proportions require caution. This study was designed to characterize biochemical profiles that complement, rather than replace, clinical and molecular evaluation.

5. Conclusions

In this descriptive case series, comprehensive urinary bile acid profiling provided biochemical information that complemented clinical and molecular findings in patients with genetically confirmed IEBAS, as well as in patients with other or unresolved causes of cholestasis. These findings support the use of urinary bile acid profiling as a complementary biochemical approach for identifying characteristic metabolic patterns and guiding molecular investigation in patients with suspected bile acid synthesis disorders.
However, this study was not designed to establish diagnostic sensitivity, specificity, or clinically validated decision thresholds. Larger studies including genetically characterized cohorts, appropriate reference populations, and fully validated quantitative analytical methods are needed to define the diagnostic performance of comprehensive urinary bile acid profiling and to determine its clinical utility for treatment assessment and longitudinal monitoring.

Supplementary Materials

The following supporting information can be downloaded at: https://www.mdpi.com/article/10.3390/metabo16100753/s1, Table S1: Individual urinary bile acid species in patients investigated for inborn errors of bile acid synthesis or unexplained cholestasis and healthy controls.

Author Contributions

Conceptualization, U.B.O., İ.L. and H.D.; methodology, U.B.O., İ.L. and H.Ö.; supervision, U.B.O., İ.L. and T.C.; resources, U.B.O. and İ.L.; investigation, U.B.O., İ.L., D.D.G. and B.G.; data curation, U.B.O., İ.L., D.D.G. and B.G.; formal analysis and interpretation, U.B.O., İ.L., B.G., H.D. and H.Ö.; literature search, U.B.O., İ.L., D.D.G., E.G., B.G., H.D., H.Ö. and T.C.; writing—original draft preparation, U.B.O., İ.L., D.D.G., E.G., H.D. and H.Ö.; writing—review and editing, U.B.O., İ.L., D.D.G., E.G., B.G., H.D., H.Ö. and T.C. All authors have read and agreed to the published version of the manuscript.

Funding

This research was funded by Hacettepe University Scientific Research Projects Coordination Unit, grant number THD-2018-16921.

Institutional Review Board Statement

The study was conducted in accordance with the Declaration of Helsinki and approved by the Ethics Committee of Hacettepe University (approval code GO-18/255-04; approval date: 1 September 2018).

Informed Consent Statement

Written informed consent was obtained from all study participants or their parents/legal guardians, as applicable.

Data Availability Statement

The data presented in this study are available from the corresponding author upon reasonable request.

Acknowledgments

We are grateful to Hiroshi Nittono (Junshin Clinic Bile Acid Institute, Tokyo, Japan), Tsuyoshi Murai (Faculty of Pharmaceutical Sciences, Health Sciences University of Hokkaido, Hokkaido, Japan), and Takashi Iida (Department of Chemistry, College of Humanities and Sciences, Nihon University, Tokyo, Japan) for their excellent technical support in bile acid analysis.

Conflicts of Interest

The authors declare no conflicts of interest.

Appendix A

Table A1. Bile acid species, abbreviations, and internal standards assigned to each analyte.
AbbreviationBile Acid Species/Chemical NameAssigned Internal Standard
Classical bile acids
GCAGlycocholic acidGCA-d4
TCATaurocholic acidTCA-d4
CACholic acidCA-d4
GCDCAGlycochenodeoxycholic acidGCDCA-d4
TCDCATaurochenodeoxycholic acidTCDCA-d4
CDCAChenodeoxycholic acidCA-d4
GUDCAGlycoursodeoxycholic acidGCDCA-d4
TUDCATauroursodeoxycholic acidTCDCA-d4
UDCAUrsodeoxycholic acidCA-d4
GDCAGlycodeoxycholic acidGCDCA-d4
TDCATaurodeoxycholic acidTCDCA-d4
DCADeoxycholic acidCA-d4
GLCAGlycolithocholic acidGCDCA-d4
TLCATaurolithocholic acidTCDCA-d4
LCALithocholic acidCA-d4
GHCAGlycohyocholic acidGCA-d4
HCAHyocholic acidCA-d4
Internal standards
CA-d4Cholic acid; 2,2,4,4-d4
GCA-d4Glycocholic acid; 2,2,4,4-d4
TCA-d4Taurocholic acid sodium salt; 2,2,4,4-d4
GCDCA-d4Glycochenodeoxycholic acid sodium salt; 2,2,4,4-d4
TCDCA-d4Taurochenodeoxycholic acid sodium salt; 2,2,4,4-d4
CDCA-3S-d5Chenodeoxycholic acid 3-sulfate-d5
GCDCA-3S-d5Glycochenodeoxycholic acid 3-sulfate-d5
TCDCA-3S-d5Taurochenodeoxycholic acid 3-sulfate-d5
3-sulfated bile acids
TCA-3STaurocholic acid 3-sulfateTCDCA-3S-d5
CA-3SCholic acid 3-sulfateCDCA-3S-d5
GCDCA-3SGlycochenodeoxycholic acid 3-sulfateGCDCA-3S-d5
TCDCA-3STaurochenodeoxycholic acid 3-sulfateTCDCA-3S-d5
CDCA-3SChenodeoxycholic acid 3-sulfateCDCA-3S-d5
GUDCA-3SGlycoursodeoxycholic acid 3-sulfateGCDCA-3S-d5
TUDCA-3STauroursodeoxycholic acid 3-sulfateTCDCA-3S-d5
UDCA-3SUrsodeoxycholic acid 3-sulfateCDCA-3S-d5
GDCA-3SGlycodeoxycholic acid 3-sulfateGCDCA-3S-d5
TDCA-3STaurodeoxycholic acid 3-sulfateTCDCA-3S-d5
DCA-3SDeoxycholic acid 3-sulfateCDCA-3S-d5
GLCA-3SGlycolithocholic acid 3-sulfateGCDCA-3S-d5
TLCA-3STaurolithocholic acid 3-sulfateTCDCA-3S-d5
LCA-3SLithocholic acid 3-sulfateCDCA-3S-d5
Hydroxylated bile acids
GCA-1β-ol1β-hydroxy-glycocholic acidGCA-d4
TCA-1β-ol1β-hydroxy-taurocholic acidTCA-d4
CA-1β-ol1β-hydroxy-cholic acidCA-d4
GCA-6α-ol6α-hydroxy-glycocholic acidGCA-d4
CA-6α-ol6α-hydroxy-cholic acidCA-d4
CDCA-1β-ol1β-hydroxy-chenodeoxycholic acidCA-d4
3β-hydroxy-Δ5 bile acids
G-Δ5-3β,7α,12α-(OH)33β,7α,12α-trihydroxy-5-cholenoic acid N-(carboxymethyl)amideGCA-d4
T-Δ5-3β,7α,12α-(OH)33β,7α,12α-trihydroxy-5-cholenoic acid N-(2-sulfoethyl)amideTCA-d4
Δ5-3β,7α,12α-(OH)33β,7α,12α-trihydroxy-5-cholenoic acidCA-d4
T-Δ5-3β,7α,12α-(OH)3-3S3β,7α,12α-trihydroxy-5-cholenoic acid N-(2-sulfoethyl)amide 3-sulfateTCDCA-3S-d5
Δ5-3β,7α,12α-(OH)3-3S3β,7α,12α-trihydroxy-5-cholenoic acid 3-sulfateCDCA-3S-d5
G-Δ5-3β,7α-(OH)23β,7α-dihydroxy-5-cholenoic acid N-(carboxymethyl)amideGCDCA-d4
T-Δ5-3β,7α-(OH)23β,7α-dihydroxy-5-cholenoic acid N-(2-sulfoethyl)amideTCDCA-d4
Δ5-3β,7α-(OH)23β,7α-dihydroxy-5-cholenoic acidCA-d4
G-Δ5-3β,7α-(OH)2-3S3β,7α-dihydroxy-5-cholenoic acid N-(carboxymethyl)amide 3-sulfateGCDCA-3S-d5
T-Δ5-3β,7α-(OH)2-3S3β,7α-dihydroxy-5-cholenoic acid N-(2-sulfoethyl)amide 3-sulfateTCDCA-3S-d5
Δ5-3β,7α-(OH)2-3S3β,7α-dihydroxy-5-cholenoic acid 3-sulfateCDCA-3S-d5
G-Δ5-3β-OH3β-hydroxy-5-cholenoic acid N-(carboxymethyl)amideGCDCA-d4
T-Δ5-3β-OH3β-hydroxy-5-cholenoic acid N-(2-sulfoethyl)amideTCDCA-d4
Δ5-3β-OH3β-hydroxy-5-cholenoic acidCA-d4
G-Δ5-3β-OH-3S3β-hydroxy-5-cholenoic acid N-(carboxymethyl)amide 3-sulfateGCDCA-3S-d5
T-Δ5-3β-OH-3S3β-hydroxy-5-cholenoic acid N-(2-sulfoethyl)amide 3-sulfateTCDCA-3S-d5
Δ5-3β-OH-3S3β-hydroxy-5-cholenoic acid 3-sulfateCDCA-3S-d5
Δ5-3β,12α-(OH)23β,12α-dihydroxy-5-cholenoic acidCA-d4
3-oxo-Δ4 bile acids
GCA-Δ4-3-one7α,12α-dihydroxy-3-oxo-4-cholenoic acid N-(carboxymethyl)amideGCA-d4
TCA-Δ4-3-one7α,12α-dihydroxy-3-oxo-4-cholenoic acid N-(2-sulfoethyl)amideTCA-d4
CA-Δ4-3-one7α,12α-dihydroxy-3-oxo-4-cholenoic acidCA-d4
GCDCA-Δ4-3-one7α-hydroxy-3-oxo-4-cholenoic acid N-(carboxymethyl)amideGCDCA-d4
TCDCA-Δ4-3-one7α-hydroxy-3-oxo-4-cholenoic acid N-(2-sulfoethyl)amideTCDCA-d4
CDCA-Δ4-3-one7α-hydroxy-3-oxo-4-cholenoic acidCA-d4
3-oxo-Δ4,6 bile acids
CA-Δ4,6-3-one12α-hydroxy-3-oxo-4,6-choladienoic acidCA-d4
CDCA-Δ4,6-3-one3-oxo-4,6-choladienoic acidCA-d4
Short- and long-chain bile acids
nor-CAnor-cholic acidCA-d4
C27-DHCA3α,7α-dihydroxy-5β-cholestanoic acidCA-d4
C27-THCA3α,7α,12α-trihydroxy-5β-cholestanoic acidCA-d4

References

  1. Chiang, J.Y. Regulation of bile acid synthesis. Front. Biosci. 1998, 3, D176–D193. [Google Scholar] [CrossRef] [Scilit] [PubMed]
  2. Li, T.; Chiang, J.Y. Nuclear receptors in bile acid metabolism. Drug Metab. Rev. 2013, 45, 145–155. [Google Scholar] [CrossRef] [Scilit] [PubMed]
  3. Russell, D.W. The enzymes, regulation, and genetics of bile acid synthesis. Annu. Rev. Biochem. 2003, 72, 137–174. [Google Scholar] [CrossRef] [Scilit]
  4. Mizuochi, T.; Takei, H.; Nittono, H.; Kimura, A. Inborn errors of bile acid metabolism in Japan. Pediatr. Int. 2023, 65, e15490. [Google Scholar] [CrossRef] [Scilit] [PubMed]
  5. Sundaram, S.S.; Bove, K.E.; Lovell, M.A.; Sokol, R.J. Mechanisms of disease: Inborn errors of bile acid synthesis. Nat. Clin. Pract. Gastroenterol. Hepatol. 2008, 5, 456–468. [Google Scholar] [CrossRef] [Scilit] [PubMed]
  6. Chiang, J.Y. Bile acid metabolism and signaling. Compr. Physiol. 2013, 3, 1191–1212. [Google Scholar] [CrossRef] [Scilit]
  7. Setchell, K.D.R.; Heubi, J.E. Disorders of bile acid synthesis and metabolism in children. In Liver Disease in Children, 5th ed.; Suchy, F.J., Sokol, R.J., Balistreri, W.F., Eds.; Cambridge University Press: Cambridge, UK, 2021; pp. 593–610. [Google Scholar]
  8. Donazzolo, E.; Gucciardi, A.; Mazzier, D.; Peggion, C.; Pirillo, P.; Naturale, M.; Moretto, A.; Giordano, G. Improved synthesis of glycine, taurine and sulfate conjugated bile acids as reference compounds and internal standards for ESI-MS/MS urinary profiling of inborn errors of bile acid synthesis. Chem. Phys. Lipids 2017, 204, 43–56. [Google Scholar] [CrossRef] [Scilit] [PubMed]
  9. Clayton, P.T.; Leonard, J.V.; Lawson, A.M.; Setchell, K.D.; Andersson, S.; Egestad, B.; Sjövall, J. Familial giant cell hepatitis associated with synthesis of 3 beta, 7 alpha-dihydroxy- and 3 beta,7 alpha,12 alpha-trihydroxy-5-cholenoic acids. J. Clin. Investig. 1987, 79, 1031–1038. [Google Scholar] [CrossRef] [Scilit] [PubMed]
  10. Nittono, H.; Takei, H.; Unno, A.; Kimura, A.; Shimizu, T.; Kurosawa, T.; Tohma, S.; Une, M. Diagnostic determination system for high-risk screening for inborn errors of bile acid metabolism based on an analysis of urinary bile acids using gas chromatography-mass spectrometry: Results for 10 years in Japan. Pediatr. Int. 2009, 51, 535–543. [Google Scholar] [CrossRef] [Scilit] [PubMed]
  11. Haas, D.; Gan-Schreier, H.; Langhans, C.-D.; Rohrer, T.; Engelmann, G.; Heverin, M.; Russell, D.W.; Clayton, P.T.; Hoffmann, G.F.; Okun, J.G. Differential diagnosis in patients with suspected bile acid synthesis defects. World J. Gastroenterol. 2012, 18, 1067–1076. [Google Scholar] [CrossRef] [Scilit] [PubMed]
  12. Naritaka, N.; Suzuki, M.; Takei, H.; Chen, H.; Oh, S.; Kaewplang, P.; Zhang, C.; Murai, T.; Kurosawa, T.; Kimura, A.; et al. Use of dried urine spots for screening of inborn errors of bile acid synthesis. Pediatr. Int. 2019, 61, 489–494. [Google Scholar] [CrossRef] [Scilit] [PubMed]
  13. Sasamura, A.; Akazawa, S.; Haraguchi, A.; Horie, I.; Ando, T.; Abiru, N.; Takei, H.; Nittono, H.; Une, M.; Kurosawa, T.; et al. Late-onset cerebrotendinous xanthomatosis with a novel mutation in the CYP27A1 gene. Intern. Med. 2018, 57, 1611–1616. [Google Scholar] [CrossRef] [Scilit]
  14. Muto, A.; Takei, H.; Unno, A.; Murai, T.; Kurosawa, T.; Ogawa, S.; Iida, T.; Ikegawa, S.; Mori, J.; Ohtake, A.; et al. Detection of Δ4-3-oxo-steroid 5β-reductase deficiency by LC-ESI-MS/MS measurement of urinary bile acids. J. Chromatogr. B Anal. Technol. Biomed. Life Sci. 2012, 900, 24–31. [Google Scholar] [CrossRef] [Scilit] [PubMed]
  15. DeBarber, A.E.; Luo, J.; Star-Weinstock, M.; Purkayastha, S.; Geraghty, M.T.; Chiang, J.P.W.; Merkens, L.S.; Pappu, A.S.; Steiner, R.D. A blood test for cerebrotendinous xanthomatosis with potential for disease detection in newborns. J. Lipid Res. 2014, 55, 146–154. [Google Scholar] [CrossRef] [Scilit] [PubMed]
  16. Wikvall, K. Purification and properties of a 3 beta-hydroxy-delta 5-C27-steroid oxidoreductase from rabbit liver microsomes. J. Biol. Chem. 1981, 256, 3376–3380. [Google Scholar] [CrossRef] [Scilit]
  17. Vaz, F.M.; Ferdinandusse, S. Bile acid analysis in human disorders of bile acid biosynthesis. Mol. Asp. Med. 2017, 56, 10–24. [Google Scholar] [CrossRef] [Scilit] [PubMed]
  18. Heubi, J.E.; Setchell, K.D.R.; Bove, K.E. Inborn errors of bile acid metabolism. Semin. Liver Dis. 2007, 27, 282–294. [Google Scholar] [CrossRef] [Scilit] [PubMed]
  19. Kimura, A.; Nittono, H.; Mizuochi, T.; Ueki, I.; Kurosawa, T.; Muto, A.; Takei, H. Neonatal cholestasis with increased 3β-monohydroxy-Δ5 bile acids in serum and urine: Not necessarily primary oxysterol 7α-hydroxylase deficiency. Clin. Chim. Acta 2012, 413, 1700–1704. [Google Scholar] [CrossRef] [Scilit] [PubMed]
  20. Mizuochi, T.; Kimura, A.; Ueki, I.; Takahashi, T.; Hashimoto, T.; Takao, A.; Seki, Y.; Takei, H.; Nittono, H.; Kurosawa, T.; et al. Molecular genetic and bile acid profiles in two Japanese patients with 3β-hydroxy-Δ5-C27-steroid dehydrogenase/isomerase deficiency. Pediatr. Res. 2010, 68, 258–263. [Google Scholar] [CrossRef] [Scilit] [PubMed]
  21. Clayton, P.T.; Verrips, A.; Sistermans, E.; Mann, A.; Mieli-Vergani, G.; Wevers, R. Mutations in the sterol 27-hydroxylase gene (CYP27A) cause hepatitis of infancy as well as cerebrotendinous xanthomatosis. J. Inherit. Metab. Dis. 2002, 25, 501–513. [Google Scholar] [CrossRef] [Scilit] [PubMed]
  22. Pierre, G.; Setchell, K.; Blyth, J.; Preece, M.A.; Chakrapani, A.; McKiernan, P. Prospective treatment of cerebrotendinous xanthomatosis with cholic acid therapy. J. Inherit. Metab. Dis. 2008, 31, S241–S245. [Google Scholar] [CrossRef] [Scilit] [PubMed]
  23. Verrips, A.; Hoefsloot, L.H.; Steenbergen, G.C.H.; Theelen, J.P.; Wevers, R.A.; Gabreëls, F.J.M.; van Engelen, B.G.M.; van den Heuvel, L.P. Clinical and molecular genetic characteristics of patients with cerebrotendinous xanthomatosis. Brain 2000, 123, 908–919. [Google Scholar] [CrossRef] [Scilit] [PubMed]
  24. Van Bogaert, L.; Scherer, H.J.; Froehlich, A.; Epstein, E. Une deuxième observation de cholestérinose tendineuse symétrique avec symptômes cérébraux. Ann. Med. 1937, 42, 69–101. [Google Scholar]
  25. Batta, A.K.; Salen, G.; Shefer, S.; Tint, G.S.; Batta, M. Increased plasma bile alcohol glucuronides in patients with cerebrotendinous xanthomatosis: Effect of chenodeoxycholic acid. J. Lipid Res. 1987, 28, 1006–1012. [Google Scholar] [CrossRef] [Scilit]
  26. Koopman, B.J.; van der Molen, J.C.; Wolthers, B.G.; de Jager, A.E.; Waterreus, R.J.; Gips, C.H. Capillary gas chromatographic determination of cholestanol/cholesterol ratio in biological fluids: Its potential usefulness for the follow-up of some liver diseases and its lack of specificity in diagnosing CTX. Clin. Chim. Acta 1984, 137, 305–315. [Google Scholar] [CrossRef] [Scilit] [PubMed]
  27. Setchell, K.D.; Schwarz, M.; O’COnnell, N.C.; Lund, E.G.; Davis, D.L.; Lathe, R.; Thompson, H.R.; Tyson, R.W.; Sokol, R.J.; Russell, D.W. Identification of a new inborn error in bile acid synthesis: Mutation of the oxysterol 7α-hydroxylase gene causes severe neonatal liver disease. J. Clin. Investig. 1998, 102, 1690–1703. [Google Scholar] [CrossRef] [Scilit] [PubMed]
  28. Takei, H.; Murai, T.; Kurosawa, T.; Iida, T.; Nittono, H.; Fujishiro, M.; Lee, X.-P.; Sato, J.; Sato, K. Transition of urinary ursodeoxycholic acid 7β-N-acetylglucosaminide and 3α-sulfate from neonates to adolescents using LC/ESI-MS/MS analysis. Showa Univ. J. Med. Sci. 2017, 29, 391–402. [Google Scholar] [CrossRef] [Scilit][Green Version]
  29. Gonzales, E.; Matarazzo, L.; Franchi-Abella, S.; Dabadie, A.; Cohen, J.; Habes, D.; Hillaire, S.; Guettier, C.; Taburet, A.-M.; Myara, A.; et al. Cholic acid for primary bile acid synthesis defects: A life-saving therapy allowing a favorable outcome in adulthood. Orphanet J. Rare Dis. 2018, 13, 190. [Google Scholar] [CrossRef] [Scilit] [PubMed]
  30. Batta, A.K.; Salen, G.; Arora, R.; Shefer, S.; Tint, S.G.; Abroon, J.; Eskreis, D.; Katz, S. Effect of ursodeoxycholic acid on bile acid metabolism in primary biliary cirrhosis. Hepatology 1989, 10, 414–419. [Google Scholar] [CrossRef] [Scilit] [PubMed]
  31. Kisanuki, Y.Y.; Nobrega, P.R.; Himes, R.; Jayadev, S.; Bernat, J.A.; Prakash, V.; Gibson, J.B.; Larson, A.; Sgobbi, P.; DeBarber, A.E.; et al. Efficacy, safety, and tolerability of chenodeoxycholic acid (CDCA) in adult patients with cerebrotendinous xanthomatosis (RESTORE): A randomized withdrawal, double-blind, placebo-controlled, crossover phase-3 study. Genet. Med. 2025, 27, 101449. [Google Scholar] [CrossRef] [Scilit] [PubMed]
  32. Wunsch, E.; Trottier, J.; Milkiewicz, M.; Raszeja-Wyszomirska, J.; Hirschfield, G.M.; Barbier, O.; Milkiewicz, P. Prospective evaluation of ursodeoxycholic acid withdrawal in patients with primary sclerosing cholangitis. Hepatology 2014, 60, 931–940. [Google Scholar] [CrossRef] [Scilit]
Figure 1. Bile acid synthesis pathways. Schematic representation of the classical/neutral and alternative/acidic pathways [6], together with the 25-hydroxylation and Yamasaki routes. Blue boxes represent intermediate metabolites, and green boxes indicate bile acid products. Arrows show the direction of the depicted conversions; enzyme names or reaction types are indicated alongside the arrows. Red labels identify inherited enzyme deficiencies. CTX, cerebrotendinous xanthomatosis; 3β-HSD, 3β-hydroxy-Δ5-C27-steroid dehydrogenase/isomerase; BAAT, bile acid CoA–amino acid N-acyltransferase; THCA, trihydroxycholestanoic acid; DHCA, dihydroxycholestanoic acid.
Metabolites 16 00753 g001
Table 1. Demographic characteristics and biochemical findings of the patients and controls are summarized in this table.
Controls,
n = 50
P1P2P3P4P5P6P7P8P9P10P11P12
Diagnostic status HSD3B7
(A)
HSD3B7
(A)
CTX
(A)
CTX
(A)
CTX
(A)
UnresolvedUnre-solvedBiliary atresia
(B)
PFIC1
(B)
UnresolvedUnresolvedUnresolved
Gender24:26 (F/M)MMMFFFMMFMMF
Age9.84 ± 4.728 y15 y9 y14 y17 y4 m7 m2 m8 m12 y8 m1 y
ALT (U/L)
(r.r. < 39)
17.68 ± 10.2591951161314250120285671278683
AST (U/L)
(r.r. < 56)
25.24 ± 8.952755624202646917144716453281190
GGT (U/L)
(r.r. 3–22)
n.d.156.1129646
(r.r. 12–122)
60
(r.r. 12–122)
104
(r.r. 12–122)
40
(r.r. 12–122)
5866
(r.r. 12–122)
29
D-Bil (mg/dL)
(r.r. 0–0.2)
0.11 ± 0.053.924.640.150.100.094.03.603.913.110.3317.980.28
T-Bil (mg/dL)
(r.r. 0.3–1.2)
0.50 ± 0.226.786.780.690.510.408.67.097.475.421.0725.071.2
Reference intervals were taken from the clinical laboratory reports. The GGT interval of 12–122 U/L applies to P6, P7, P8, P9, and P11 and is shown in their respective cells; the row-heading interval of 3–22 U/L applies to the other patients. For the other biochemical parameters, the intervals are shown in the row headings. Values above the applicable reference range are indicated in bold. Control-group age and biochemical data are presented as mean ± SD; sex distribution is reported as female/male counts. Individual patient data are shown as observed values. A, genetically confirmed IEBAS (HSD3B7 deficiency in P1 and P2; CTX in P3–P5); B, received another diagnosis. Unresolved indicates that no definitive etiological diagnosis was established. n, number of participants; P, patient; F, female; M, male; y, years; m, months; r.r., reference range; ALT, alanine aminotransferase; AST, aspartate aminotransferase; GGT, gamma-glutamyltransferase; D-Bil, direct bilirubin; T-Bil, total bilirubin; CTX, cerebrotendinous xanthomatosis; PFIC1, progressive familial intrahepatic cholestasis type 1; n.d., not determined.
Table 2. Bile acid treatment in relation to urine collection.
PatientCompoundDaily DoseTreatment DurationInterruption
Interval
Treatment Status at Sampling
1UDCA15 mg/kg/day2 years2 weeksUDCA discontinued
2UDCA10 mg/kg, twice daily2 years2 weeksUDCA discontinued
3CDCA10 mg/kg/day1 year2 weeksCDCA discontinued
4CDCA10 mg/kg/day1 year2 weeksCDCA discontinued
5CDCA10 mg/kg/day1 year2 weeksCDCA discontinued
6UDCA15 mg/kg/day1 month2 weeksUDCA discontinued
7UDCA10 mg/kg, twice daily1 month2 weeksUDCA discontinued
8UDCA10 mg/kg, twice daily1 weekNot interruptedReceiving UDCA
9UDCA30 mg/kg/day; subsequently 22 mg/kg/day3 weeksNot interruptedReceiving UDCA
10UDCA7.5 mg/kg, twice daily5 yearsNot interruptedReceiving UDCA
11UDCA10 mg/kg, twice daily4 monthsNot interruptedReceiving UDCA
12UDCA7.5 mg/kg, twice daily1 weekNot interruptedReceiving UDCA
UDCA, ursodeoxycholic acid; CDCA, chenodeoxycholic acid. Treatment duration represents the approximate duration of treatment for each patient, as determined from the available retrospective clinical records. The interruption interval denotes the time between treatment discontinuation and urine collection.
Table 3. Retention times (RT), multiple reaction monitoring (MRM) transitions, collision energies (eV), and coefficients of determination (r2) for the bile acid species analyzed by LC–MS/MS.
Bile Acid SpeciesAbbreviationRT (min)Precursor Ion (m/z)Product Ion (m/z)Collision Energy (eV)Coefficient of Determination (r2)
Classical bile acids
Glycocholic acidGCA24.88464.1074.00390.998
Taurocholic acidTCA25.97514.00124.00510.997
Cholic acidCA25.59407.00343.40330.997
Taurocholic acid 3-sulfateTCA-3S20.37296.7096.90380.999
Cholic acid 3-sulfateCA-3S21.10487.1096.90460.999
Glycochenodeoxycholic acidGCDCA28.87448.3074.00420.997
Taurochenodeoxycholic acidTCDCA29.30498.00124.10510.995
Chenodeoxycholic acidCDCA32.79391.10373.20320.997
Glycochenodeoxycholic acid 3-sulfateGCDCA-3S22.90263.8096.90400.999
Taurochenodeoxycholic acid 3-sulfateTCDCA-3S23.26288.5096.90390.997
Chenodeoxycholic acid 3-sulfateCDCA-3S25.47471.1096.80550.999
Glycoursodeoxycholic acidGUDCA29.15448.3073.80420.994
Tauroursodeoxycholic acidTUDCA29.44498.30123.90510.996
Ursodeoxycholic acidUDCA26.52391.10373.50320.998
Glycoursodeoxycholic acid 3-sulfateGUDCA-3S18.84263.6096.90400.999
Tauroursodeoxycholic acid 3-sulfateTUDCA-3S23.33288.5096.90390.995
Ursodeoxycholic acid 3-sulfateUDCA-3S21.24471.1097.00550.998
Glycodeoxycholic acidGDCA28.20448.3074.00420.995
Taurodeoxycholic acidTDCA29.52498.00124.10510.993
Deoxycholic acidDCA32.74391.10345.40350.999
Glycodeoxycholic acid 3-sulfateGDCA-3S22.90263.6097.00400.999
Taurodeoxycholic acid 3-sulfateTDCA-3S23.84288.5097.00390.998
Deoxycholic acid 3-sulfateDCA-3S26.35471.1096.80550.999
Glycolithocholic acidGLCA35.32432.1073.90390.997
Taurolithocholic acidTLCA37.11482.10124.00490.995
Lithocholic acidLCA43.55375.40375.10100.999
Glycolithocholic acid 3-sulfateGLCA-3S25.65255.6097.00400.997
Taurolithocholic acid 3-sulfateTLCA-3S27.46280.5096.90370.998
Lithocholic acid 3-sulfateLCA-3S31.31455.1096.90440.997
Glycohyocholic acidGHCA23.85464.3074.00390.998
Hyocholic acidHCA25.08407.20389.10340.997
Hydroxylated bile acids
1β-hydroxy-glycocholic acidGCA-1β-ol16.35480.2074.00430.998
1β-hydroxy-taurocholic acidTCA-1β-ol17.03530.10124.00540.998
1β-hydroxy-cholic acidCA-1β-ol16.45423.10263.30370.999
6α-hydroxy-glycocholic acidGCA-6α-ol18.90480.2074.00420.999
6α-hydroxy-cholic acidCA-6α-ol19.27423.10313.30370.999
1β-hydroxy-chenodeoxycholic acidCDCA-1β-ol20.07407.20389.30350.995
3β-hydroxy-Δ5 bile acids
3β,7α,12α-trihydroxy-5-cholenoic acid N-(carboxymethyl)amideG-Δ5-3β,7α,12α-(OH)320.00462.1074.00380.999
3β,7α,12α-trihydroxy-5-cholenoic acid N-(2-sulfoethyl) amideT-Δ5-3β,7α,12α-(OH)320.80512.10124.00510.999
3β,7α,12α-trihydroxy-5-cholenoic acidΔ5-3β,7α,12α-(OH)320.72405.20289.30310.999
3β,7α,12α-trihydroxy-5-cholenoic acid N-(2-sulfoethyl) amide 3-sulfateT-Δ5-3β,7α,12α-(OH)3-3S19.35295.7096.90340.998
3β,7α,12α-trihydroxy-5-cholenoic acid 3-sulfateΔ5-3β,7α,12α-(OH)3-3S19.71485.1097.00490.995
3β,7α-dihydroxy-5-cholenoic acid N-(carboxymethyl)amideG-Δ5-3β,7α-(OH)223.72446.2074.00380.998
3β,7α-dihydroxy-5-cholenoic acid N-(2-sulfoethyl) amideT-Δ5-3β,7α-(OH)224.92496.10124.00420.998
3β,7α-dihydroxy-5-cholenoic acidΔ5-3β,7α-(OH)226.07389.10357.30350.993
3β,7α-dihydroxy-5-cholenoic acid N-(carboxymethyl) amide 3-sulfateG-Δ5-3β,7α-(OH)2-3S21.37262.6097.00240.999
3β,7α-dihydroxy-5-cholenoic acid N-(2-sulfoethyl) amide 3-sulfateT-Δ5-3β,7α-(OH)2-3S27.38287.5097.00420.998
3β,7α-dihydroxy-5-cholenoic acid 3-sulfateΔ5-3β,7α-(OH)2-3S24.09469.1096.90480.999
3β-hydroxy-5-cholenoic acid N-(carboxymethyl)amideG-Δ5-3β-OH30.14430.4074.00320.997
3β-hydroxy-5-cholenoic acid N-(2-sulfoethyl) amideT-Δ5-3β-OH31.44480.10124.00490.999
3β-hydroxy-5-cholenoic acidΔ5-3β-OH38.41373.20355.20260.992
3β-hydroxy-5-cholenoic acid N-(carboxymethyl) amide 3-sulfateG-Δ5-3β-OH-3S23.47254.9096.90290.999
3β-hydroxy-5-cholenoic acid N-(2-sulfoethyl) amide 3-sulfateT-Δ5-3β-OH-3S24.52279.5096.90250.998
3β-hydroxy-5-cholenoic acid 3-sulfateΔ5-3β-OH-3S28.75453.1096.90420.998
3β,12α-dihydroxy-5-cholenoic acidΔ5-3β,12α-(OH)225.98389.10287.30330.999
3-oxo-Δ4 bile acids
7α,12α-dihydroxy-3-oxo-4-cholenoic acid N-(carboxymethyl)amideGCA-Δ4-3-one20.58460.1074.00370.998
7α,12α-dihydroxy-3-oxo-4-cholenoic acid N-(2-sulfoethyl) amideTCA-Δ4-3-one21.45510.10124.00500.999
7α,12α-dihydroxy-3-oxo-4-cholenoic acidCA-Δ4-3-one21.31403.10123.10390.999
7α-hydroxy-3-oxo-4-cholenoic acid N-(carboxymethyl)amideGCDCA-Δ4-3-one25.03444.1074.00350.999
7α-hydroxy-3-oxo-4-cholenoic acid N-(2-sulfoethyl) amideTCDCA-Δ4-3-one26.23494.10124.00440.999
7α-hydroxy-3-oxo-4-cholenoic acidCDCA-Δ4-3-one27.60387.10369.30270.997
12α-hydroxy-3-oxo-4,6-choladienoic acidCA-Δ4,6-3-one26.35385.10341.30270.997
3-oxo-4,6-choladienoic acidCDCA-Δ4,6-3-one37.16369.10325.30280.999
Short- and long-chain bile acids
nor-cholic acidnor-CA21.60393.20329.30350.999
3α,7α-dihydroxy-5β-cholestanoic acidC27-DHCA44.05433.20415.40450.991
3α,7α,12α-trihydroxy-5β-cholestanoic acidC27-THCA34.92449.20431.30420.999
m/z, mass-to-charge ratio. Isomers with identical or closely similar MRM transitions: GCDCA-3S/GDCA-3S; TCDCA-3S/TUDCA-3S/TDCA-3S; TCDCA/TUDCA/TDCA; GCDCA/GUDCA/GDCA. Their separation was not verified.
Table 4. Urinary bile acid profiles measured by LC–MS/MS and plasma cholesterol, cholestanol, and 7-dehydrocholesterol concentrations measured by GC–MS.
Urinary Bile AcidsControl GroupP1P2P3P4P5P6P7P8P9P10P11P12
All bile acid species
Total bile acids
(µmol/mmol Cr; %)
0.59
(100.00)
32.86
(100.00)
0.72
(100.00)
0.68
(100.00)
0.99
(100.00)
1.14
(100.00)
3.28
(100.00)
9.85
(100.00)
47.87
(100.00)
113.37
(100.00)
60.99
(100.00)
30.69
(100.00)
3.53
(100.00)
Classical bile acids
(µmol/mmol Cr; %)
0.55
(91.70)
11.68
(35.50)
0.53
(73.40)
0.34
(50.70)
0.16
(16.50)
0.74
(64.80)
1.26
(38.40)
6.78
(68.90)
46.07
(96.30)
112.67
(99.40)
59.56
(97.70)
29.30
(95.50)
3.14
(89.20)
Hydroxylated bile acids
(µmol/mmol Cr; %)
0.03
(4.10)
0.03
(0.10)
0.01
(0.70)
0.13
(19.70)
0.17
(17.10)
—1.56
(47.50)
0.39
(3.90)
0.16
(0.30)
0.23
(0.20)
0.59
(0.90)
0.76
(2.40)
0.01
(0.10)
3β-hydroxy-Δ5 bile acids
(µmol/mmol Cr; %)
0.02
(4.70)
21.01
(63.90)
0.16
(22.10)
0.03
(4.50)
0.30
(30.20)
0.16
(13.60)
0.02
(0.70)
1.79
(18.10)
0.36
(0.70)
0.15
(0.10)
0.17
(0.30)
0.53
(1.70)
0.16
(4.50)
3-oxo-Δ4 bile acids
(µmol/mmol Cr; %)
0.03
(6.90)
0.14
(0.40)
0.03
(3.80)
0.17
(25.10)
0.36
(36.20)
0.25
(21.60)
0.44
(13.40)
0.77
(7.70)
1.28
(2.70)
0.33
(0.30)
0.68
(1.10)
0.09
(0.30)
0.22
(6.20)
Short- and long-chain bile acids (µmol/mmol Cr; %)0.02
(2.30)
0.01
(0.10)
—————0.15
(1.40)
———0.01
(0.10)
0.01
(0.10)
After omission of UDCA-assigned species
Total bile acids
(µmol/mmol Cr; %)
0.08
(100.00)
32.69
(100.00)
0.28
(100.00)
0.35
(100.00)
0.97
(100.00)
0.47
(100.00)
2.14
(100.00)
5.46
(100.00)
2.89
(100.00)
32.32
(100.00)
17.30
(100.00)
8.98
(100.00)
0.77
(100.00)
Classical bile acids
(µmol/mmol Cr; %)
0.04
(58.60)
11.50
(35.20)
0.09
(32.40)
0.02
(5.60)
0.14
(14.90)
0.07
(15.00)
0.12
(5.80)
2.38
(43.60)
1.09
(37.70)
31.61
(97.80)
15.87
(91.70)
7.59
(84.50)
0.38
(49.20)
Hydroxylated bile acids
(µmol/mmol Cr; %)
0.03
(14.20)
0.03
(0.10)
0.01
(1.80)
0.13
(37.60)
0.17
(17.50)
—1.56
(72.70)
0.39
(7.10)
0.16
(5.60)
0.23
(0.70)
0.58
(3.40)
0.76
(8.50)
0.01
(0.60)
3β-hydroxy-Δ5 bile acids
(µmol/mmol Cr; %)
0.02
(31.80)
21.01
(64.30)
0.16
(56.20)
0.03
(8.80)
0.30
(30.80)
0.16
(32.90)
0.02
(1.10)
1.78
(32.60)
0.36
(12.50)
0.15
(0.50)
0.17
(1.00)
0.53
(5.90)
0.16
(20.80)
3-oxo-Δ4 bile acids
(µmol/mmol Cr; %)
0.03
(20.50)
0.14
(0.40)
0.03
(9.60)
0.17
(48.00)
0.36
(36.90)
0.25
(52.10)
0.44
(20.40)
0.77
(14.00)
1.28
(44.10)
0.33
(1.00)
0.68
(3.90)
0.09
(1.00)
0.22
(28.50)
Short- and long-chain bile acids (µmol/mmol Cr; %)0.02
(6.70)
0.01
(0.00)
—————0.14
(2.60)
———0.01
(0.10)
0.01
(0.90)
Cholesterol
(mg/dL)
210.00 ± 66.54
(n = 46)
211.23272.89255.39161.17171.00**255.80159.43*241.35277.07
Cholestanol
(µg/mL)
2.68 ± 0.99
(n = 46)
5.431.727.954.163.44**2.723.47*2.773.96
7-dehydrocholesterol
(µg/mL)
0.93 ± 0.45
(n = 46)
<0.301.840.63<0.30<0.30**0.550.37*0.490.67
Diagnostic status HSD3B7
(A)
HSD3B7
(A)
CTX
(A)
CTX
(A)
CTX
(A)
UnresolvedUnresolvedBiliary atresia
(B)
PFIC1
(B)
UnresolvedUnresolvedUnresolved
Urinary bile acids: semi-quantitative concentrations (µmol/mmol Cr), with percentages of total bile acids in parentheses. Plasma cholesterol: mg/dL; cholestanol and 7-dehydrocholesterol: µg/mL. Patient values are individual observations. Control bile acid values are arithmetic means of included positive results; percentages were calculated individually before averaging. Control n/50: total 50/50, classical 50/50, hydroxylated 17/50, 3β-hydroxy-Δ5 45/50, 3-oxo-Δ4 19/50, and short-/long-chain 1/50. Mean percentages across these subsets need not sum to 100. Control plasma sterols are mean ± SD. 7-Dehydrocholesterol levels for P1, P4, and P5 were below the lowest GC–MS calibration standard and are reported as <0.30 µg/mL. The value of 0.30 µg/mL denotes the lowest calibration standard, not a validated lower limit of quantification. Treatment: Table 2; individual metabolites: Supplementary Table S1. Analyte-specific detection and quantification limits were not validated. The second block excludes UDCA, GUDCA, TUDCA, and their 3-sulfates; percentages use the retained total of each individual. Bold indicates bile acid group headings.* No plasma samples. A, genetically confirmed IEBAS; B, received another diagnosis; unresolved, no definitive etiological diagnosis. Cr, creatinine; n, included observations; P, patient; 3β-HSD, 3β-hydroxy-Δ5-C27-steroid dehydrogenase/isomerase; CTX, cerebrotendinous xanthomatosis; PFIC1, progressive familial intrahepatic cholestasis type 1; SD, standard deviation; —, no numerical group result; non-detection and below-quantification results are not distinguished.
Disclaimer/Publisher’s Note: The statements, opinions and data contained in all publications are solely those of the individual author(s) and contributor(s) and not of MDPI and/or the editor(s). MDPI and/or the editor(s) disclaim responsibility for any injury to people or property resulting from any ideas, methods, instructions or products referred to in the content.