Abstract
Background: Metabolic syndrome (MS) is a major public health concern linked to an elevated risk of type 2 diabetes and cardiovascular disease. Simple, reliable screening tools are needed for early identification, especially in working populations. Objective: To compare the diagnostic accuracy of body mass index (BMI), waist-to-height ratio (WtHR), triglyceride–glucose index (TyG), and waist–triglyceride index (WTI) for detecting MS based on NCEP ATP III and IDF criteria in a large cohort of Spanish workers. Methods: This cross-sectional study analyzed data from 386,924 Spanish workers. MS was diagnosed using NCEP ATP III and IDF definitions. The four indexes were evaluated by sex using a receiver operating characteristic (ROC) curve analysis. Area under the curve (AUC), optimal cut-off points, and Youden’s index were calculated. Results: TyG and WTI had the highest AUC values in men (0.911 and 0.901, respectively) for NCEP ATP III-defined MS, while WtHR and WTI achieved the best performance in women (0.955 and 0.953, respectively). WtHR outperformed BMI in all subgroups. Optimal cut-off values were identified according to sex and the definition of MS: TyG (8.95 men, 8.51 women), WtHR (0.54 men, 0.51 women), and WTI (170.6 men, 96.5 women), supporting their practical implementation in occupational health programs. All indexes showed significant discriminatory capacity (p < 0.001). Conclusions: TyG, WtHR, and WTI are more effective than BMI in detecting MS among Spanish workers, with sex-specific patterns. Their ease of use and diagnostic strength support their adoption in occupational health programs for early cardiometabolic risk detection.
1. Introduction
Metabolic syndrome (MS) is a cluster of interrelated cardiometabolic risk factors, including abdominal obesity, hypertension, dyslipidemia, and hyperglycemia, that significantly increase the risk of type 2 diabetes mellitus (T2DM), cardiovascular disease (CVD), and premature mortality [1]. As the prevalence of MS continues to rise globally, particularly in working-age populations, its early identification has become a critical objective in preventive healthcare strategies [2]. In Europe, estimates suggest that MS affects approximately 25% of adults, with significant geographic and sociodemographic variability [3].
The two most commonly used criteria for diagnosing MS are those proposed by the National Cholesterol Education Program Adult Treatment Panel III (NCEP ATP III) and the International Diabetes Federation (IDF). While both definitions include similar components, the IDF places greater emphasis on central obesity as a requisite criterion [4]. Consequently, the choice of definition may influence MS prevalence rates and its association with anthropometric and metabolic indicators.
Traditionally, body mass index (BMI) has been widely used as a surrogate marker for adiposity and cardiometabolic risk. However, BMI lacks the capacity to reflect fat distribution, particularly visceral adiposity, which plays a central role in the pathogenesis of MS [5]. Accordingly, waist-to-height ratio (WtHR) has emerged as a more reliable measure of central adiposity and metabolic risk across various populations [6].
Beyond anthropometric indicators, newer composite indexes such as the triglyceride–glucose (TyG) index and the waist–triglyceride index (WTI) have gained prominence due to their ability to capture both lipid and glycemic dysregulation, reflecting underlying insulin resistance [7,8]. The TyG index, in particular, has shown strong correlations with hyperinsulinemia and has been validated against the hyperinsulinemic-euglycemic clamp method [9]. Similarly, WTI integrates abdominal adiposity with triglyceride levels, offering a practical proxy for metabolic dysfunction [10].
Recent large-scale studies have assessed the diagnostic performance of these indexes in different populations. For instance, a cross-sectional analysis in Korean adults reported high sensitivity and specificity for the TyG index in detecting MS [11], while European cohorts have highlighted the superior predictive capacity of WtHR over BMI [12]. However, few studies have systematically compared the discriminatory capacity of these indicators within large, occupationally active European populations using both NCEP ATP III and IDF criteria.
Given the pressing need for simple, low-cost screening tools that can be implemented in workplace health programs, understanding which indexes best identify individuals at risk for MS is essential. This is particularly relevant for Spain, where occupational health surveillance covers a substantial proportion of the adult population, offering an opportunity for early detection and intervention [13].
The present study aimed to compare the diagnostic performance of four anthropometric and metabolic indexes—BMI, WtHR, TyG, and WTI—in identifying MS according to both NCEP ATP III and IDF criteria in a large cohort of Spanish workers. Additionally, we explored sex-specific differences and optimal cut-off points to inform clinical and public health strategies. By evaluating both traditional and novel markers within a real-world occupational context, this study contributes to the refinement of MS screening protocols and supports evidence-based policy development.
To our knowledge, this is the first study to simultaneously compare BMI, WtHR, TyG, and WTI for diagnosing MS in a large-scale European working population, with sex-stratified analysis and dual diagnostic criteria (NCEP ATP III and IDF). This unique approach enhances both the novelty and applicability of the findings. We selected these four indexes due to their widespread use, simplicity, and ability to reflect distinct dimensions of MS—adiposity (BMI, WtHR), and insulin resistance/lipid dysfunction (TyG, WTI).
2. Methods
2.1. Study Design and Population
This cross-sectional study analyzed data from a large cohort of Spanish workers who underwent routine occupational health assessments between 2021 and 2023. Participants were recruited from multiple companies across various economic sectors in Spain, including industry, services, and public administration. All participants provided informed consent prior to data collection, and the study protocol complied with the principles of the Declaration of Helsinki. The dataset was anonymized and approved by an independent ethics committee.
Inclusion criteria were: (i) age between 18 and 69 years, (ii) complete anthropometric, biochemical, and sociodemographic data, and (iii) no previously diagnosed cardiovascular or metabolic disease. Individuals with missing values for key variables such as triglycerides, fasting glucose, waist circumference, or height were excluded from the analysis.
2.2. Anthropometric and Biochemical Measurements
Trained personnel conducted all measurements following standardized protocols. Body weight and height were measured with calibrated electronic scales and stadiometers, respectively, and used to calculate body mass index (BMI) as weight in kilograms divided by height in meters squared (kg/m2). Waist circumference was measured at the midpoint between the lower rib and iliac crest. The waist-to-height ratio (WtHR) was calculated as waist circumference (cm) divided by height (cm). Blood pressure was recorded using an automated sphygmomanometer after a 5-min rest.
Fasting blood samples were drawn in the morning after an overnight fast of at least 8 h. Serum glucose, total cholesterol, HDL-cholesterol, LDL-cholesterol, and triglycerides were analyzed in accredited clinical laboratories using enzymatic methods.
The triglyceride–glucose (TyG) index was calculated as follows:
TyG = ln(triglycerides [mg/dL] × glucose [mg/dL]/2) [14]
The waist–triglyceride index (WTI) was defined as
WTI = waist circumference [cm] × triglycerides [mg/dL] [15]
2.3. Definition of Metabolic Syndrome
Metabolic syndrome (MS) was diagnosed using two internationally recognized criteria: the National Cholesterol Education Program Adult Treatment Panel III (NCEP ATP III) [16] and the International Diabetes Federation (IDF) [17].
According to the NCEP ATP III, MS was defined by the presence of three or more of the following criteria:
- Waist circumference ≥102 cm (men) or ≥88 cm (women)
- Triglycerides ≥150 mg/dL
- HDL-cholesterol <40 mg/dL (men) or <50 mg/dL (women)
- Blood pressure ≥130/85 mmHg or on antihypertensive treatment
- Fasting glucose ≥100 mg/dL or diagnosed diabetes
The IDF criteria require the presence of central obesity (waist circumference ≥94 cm in men or ≥80 cm in women, for European populations) plus any two of the remaining four components.
2.4. Lifestyle and Sociodemographic Variables
Information on physical activity, smoking, Mediterranean diet adherence, age, sex, and occupational social class was obtained through structured questionnaires. Physical activity was determined using the standardized IPAQ questionnaire [18]. Adherence to the Mediterranean diet was assessed using a brief dietary screener validated in the Spanish population [19]. Social class was classified into I (high), II (intermediate), and III (manual workers) according to the Spanish adaptation of the British Registrar General’s classification [20].
2.5. Statistical Analysis
Continuous variables were presented as mean ± standard deviation (SD) and categorical variables as absolute and relative frequencies. Between-group comparisons were performed using the Student’s t-test or Mann–Whitney U test for continuous variables and χ2 test for categorical variables.
To assess the discriminatory ability of BMI, WtHR, TyG, and WTI for MS, a receiver operating characteristic (ROC) curve analysis was conducted. Area under the curve (AUC) values were calculated with 95% confidence intervals (CI), and the optimal cut-off values were identified using Youden’s index. Analyses were stratified by sex and MS definition (NCEP ATP III and IDF). AUC values were interpreted as follows: 0.5–0.6 = poor; 0.6–0.7 = fair; 0.7–0.8 = acceptable; 0.8–0.9 = excellent; >0.9 = outstanding [21].
All statistical analyses were performed using SPSS version 29.0 (IBM Corp., Armonk, NY, USA). A two-tailed p-value < 0.05 was considered statistically significant.
This flowchart outlines the selection and classification process of the study population. A total of 407,822 Spanish workers undergoing occupational health assessments were initially considered for analysis. After excluding 20,898 individuals due to missing data or age criteria outside the predefined range, 386,924 participants were retained for the final analysis (Figure 1).
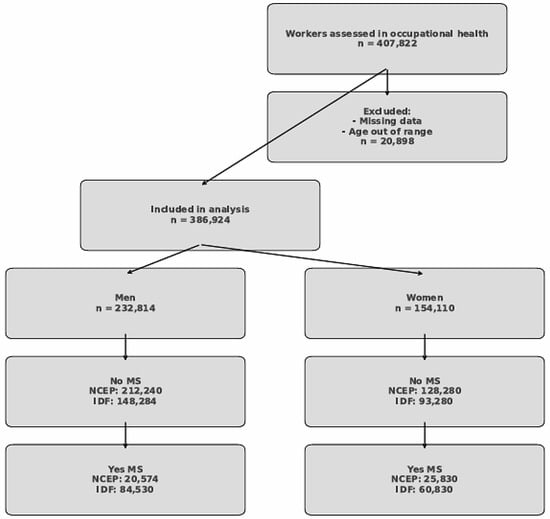
Figure 1.
Flowchart of study population selection and classification by sex and metabolic syndrome status.
The analytical cohort was subsequently stratified by sex: 232,814 men and 154,110 women. Each sex-specific subgroup was further divided based on the presence or absence of metabolic syndrome (MS) according to two established diagnostic criteria: the National Cholesterol Education Program Adult Treatment Panel III (NCEP ATP III) and the International Diabetes Federation (IDF).
Among men, 212,240 were classified as free of MS according to the NCEP criteria, whereas 20,574 met the diagnostic threshold for MS. In contrast, using the IDF criteria, only 148,284 men were considered metabolically healthy, while a larger subset (84,530 men) fulfilled the MS definition, reflecting the greater sensitivity of the IDF criteria.
Among women, 128,280 did not meet the NCEP criteria for MS, while 25,830 did. When applying the IDF definition, 93,280 women were considered free of MS, whereas 60,830 were classified as having MS. These differences underscore the variability in MS prevalence depending on the diagnostic definition applied, particularly among women.
This structured selection and classification allowed for a robust comparative analysis of anthropometric and metabolic indexes in relation to metabolic syndrome diagnosis, with stratification by sex and MS definition enhancing the interpretability and clinical relevance of the findings.
3. Results
Table 1 presents a comprehensive overview of the baseline sociodemographic, anthropometric, clinical, and lifestyle characteristics of the study population, stratified by sex. Statistically significant differences were observed between men (n = 232,814) and women (n = 154,110) across nearly all variables (p < 0.001), underscoring notable sex-specific patterns relevant to cardiometabolic risk.

Table 1.
Baseline sociodemographic, clinical, and lifestyle characteristics of Spanish workers by sex.
Men exhibited significantly higher values in height, weight, waist circumference, and systolic and diastolic blood pressure. Additionally, they had higher mean levels of triglycerides and fasting glucose, whereas women showed higher HDL-cholesterol and slightly higher LDL-cholesterol values. These differences align with known physiological variations and their implications for differential metabolic syndrome (MS) risk profiles.
Regarding age distribution, the cohorts were similarly composed, with the highest representation in the 30–39 and 40–49-year age groups. Educational attainment and occupational social class also varied significantly: a greater proportion of men had had only a primary education and belonged to social class III (manual workers), whereas women were more likely to have had a university education and belong to higher social classes (I and II). These findings reflect underlying socioeconomic disparities that may influence health outcomes.
Lifestyle habits further differentiated the sexes. Women reported higher levels of physical activity and greater adherence to the Mediterranean diet, both protective factors against MS. Moreover, smoking prevalence was significantly higher among men. Such behavioral differences are critical to consider when interpreting the prevalence and risk stratification of metabolic disorders.
Overall, Table 1 highlights clear sex-based differences in metabolic and lifestyle determinants. These findings support the rationale for stratified analyses in the diagnostic assessment of metabolic syndrome and suggest the need for tailored public health strategies that address both biological and sociocultural determinants of cardiometabolic health.
Table 2 evaluates four key anthropometric and metabolic indexes—BMI, waist-to-height ratio (WtHR), triglyceride–glucose index (TyG), and waist–triglyceride index (WTI)—across MS status and sex. Across all indexes, subjects with MS exhibited significantly higher mean values compared to those without MS (p < 0.001). Among men and women alike, BMI and WtHR were considerably elevated in MS-positive groups, especially under IDF criteria, which tend to identify more cases due to lower thresholds.
Table 2.
Distribution of anthropometric and metabolic indexes and the prevalence of abnormal values by sex and metabolic syndrome status.
Importantly, the proportion of individuals exceeding standard cut-off values was also notably higher in the MS groups. For example, over 90% of women with MS (IDF) had a high WtHR, and more than 80% of men with MS (NCEP ATP III) had a high TyG index. These findings suggest a strong discriminatory potential of these indexes in identifying MS, particularly the TyG and WTI, which reflect combined dyslipidemic and glycemic burden.
Figure 2 graphically summarizes the area under the curve (AUC) of the four indexes (BMI, WtHR, TyG, and WTI) for identifying MS by sex and definition. The visual comparison underscores the superior diagnostic performance of TyG and WTI in men and of WtHR and WTI in women, especially under the NCEP ATP III criteria. The graphical trends support the tabular findings and emphasize the potential of using simple, calculated indexes for an early detection of MS in large populations.
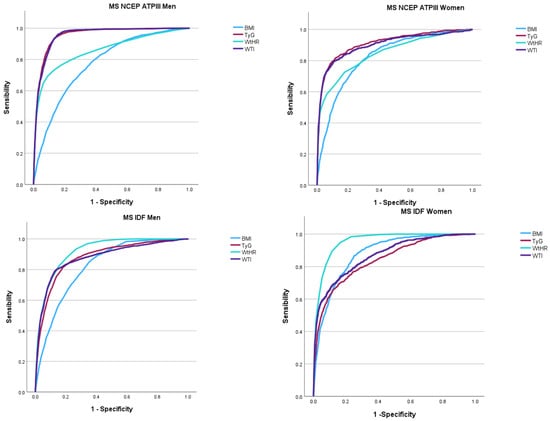
Figure 2.
Area under the curve (AUC) of BMI, WtHR, TyG, and WTI for identifying metabolic syndrome based on NCEP ATP III and IDF criteria in men and women. MS: Metabolic syndrome. NCEP ATPII: National Cholesterol Education Program Adult Treatment Panel III. IDF: International Diabetes Federation.
Table 3 displays the diagnostic performance of BMI, WtHR, TyG, and WTI in identifying MS according to receiver operating characteristic (ROC) curve analyses. For men, the TyG index showed the highest AUC (0.911) for MS (NCEP ATP III), followed closely by WTI (0.901), indicating an excellent discriminatory capacity. In women, the highest AUCs were for WtHR (0.955) and WTI (0.953) under the NCEP ATP III definition, suggesting a superior performance of central adiposity-based indexes.
Table 3.
Diagnostic accuracy of anthropometric and metabolic indexes for metabolic syndrome (NCEP ATP III and IDF) according to sex: ROC curve analysis.
For MS defined by IDF, WtHR had the best performance in both sexes (AUC = 0.919 in men and 0.955 in women), reinforcing its utility as a screening tool. The optimal cut-off values, with balanced sensitivity and specificity, were also provided for each index, offering practical guidance for clinical use.
Optimal cut-off values were identified as follows: TyG (8.95 men, 8.51 women), WtHR (0.54 men, 0.51 women), and WTI (170.6 men, 96.5 women), supporting their practical implementation in occupational health programs.
As the AUCs were very similar, we used DeLong’s test to evaluate statistical differences (Supplementary Material). Pairwise comparisons using DeLong’s test revealed statistically significant differences between most AUCs (p < 0.001), confirming the superior diagnostic accuracy of TyG and WTI in men, and WtHR and WTI in women, particularly under the NCEP ATP III criteria.
This statistical confirmation reinforces our findings that TyG and WTI—indexes integrating metabolic and central adiposity components—outperform traditional measures like BMI in men. Similarly, the superior performance of WtHR and WTI in women suggests that central fat distribution, more than general adiposity or lipid–glucose parameters alone, may be key in identifying metabolic syndrome risk in this group.
4. Discussion
This large-scale cross-sectional study evaluated and compared the diagnostic capacity of four anthropometric and metabolic indexes—BMI, WtHR, TyG, and WTI—for identifying metabolic syndrome (MS) based on NCEP ATP III and IDF definitions in a large occupational cohort of Spanish workers. We selected these four indexes due to their widespread use, simplicity, and ability to reflect distinct dimensions of MS—adiposity (BMI, WtHR), and insulin resistance/lipid dysfunction (TyG, WTI). While derivatives such as TyG-BMI or TyG-WHtR have shown promise [22], our goal was to focus on core markers to maximize translational value. Future work will expand to include these advanced indexes. The results demonstrate that indexes reflecting central adiposity and insulin resistance (particularly WtHR, TyG, and WTI) outperform BMI in distinguishing individuals with MS, with slight variations by sex and diagnostic criteria.
Among men, TyG and WTI were the most effective tools, with AUCs exceeding 0.90, while WtHR and WTI showed superior performance in women, especially under IDF criteria. These findings are consistent with recent evidence highlighting the TyG index as a powerful evaluator of adverse cardiometabolic outcomes, such as metabolic syndrome, coronary heart disease, and type 2 diabetes [23,24].
The outstanding AUCs (>0.9) observed may partially reflect the large sample size, which increases statistical power and reduces variability. Such performance may not be replicated in smaller cohorts.
The WTI, a novel index combining waist circumference and triglyceride levels, also showed high diagnostic accuracy across sex and diagnostic criteria. Studies have confirmed its usefulness in capturing the combined effects of abdominal adiposity and dyslipidemia, particularly in Mediterranean and East Asian populations [24,25]. In the present study, WTI achieved comparable or superior AUC values to TyG, emphasizing its potential as a robust and practical marker for workplace screening.
WtHR also proved highly effective, particularly in women, where it exceeded an AUC of 0.95 under IDF criteria. This aligns with recent findings from the SIMETAP-AO study, which demonstrated the strong association between high WtHR and cardiometabolic abnormalities in Spanish primary care settings [25]. Importantly, WtHR is simple to obtain, requires only two anthropometric measurements, and does not depend on blood testing—making it especially advantageous for large-scale screening.
By contrast, although BMI remains widely used, its performance was consistently lower than that of the other indexes. BMI fails to capture fat distribution or distinguish between lean and fat mass, which limits its sensitivity in identifying individuals at cardiometabolic risk. Our findings are in line with several recent investigations reporting that BMI-based classifications may underestimate risk in individuals with central obesity or metabolic dysfunction [26].
Sex differences were also evident. Men generally exhibited higher TyG and WTI values and had stronger associations between these indexes and MS. Conversely, WtHR and BMI performed better in women. These differences likely reflect distinct patterns in fat distribution, insulin sensitivity, and hormonal regulation. Women are more likely to accumulate subcutaneous fat, which is metabolically less harmful, while men tend to exhibit greater visceral adiposity, closely linked to insulin resistance [27].
Although stratified analyses were primarily based on significant sex-based physiological and metabolic differences, future studies should consider global models with interaction terms and subsequent stratification by both sex and age to improve applicability and parsimony in clinical settings.
The TyG index, calculated from fasting triglycerides and glucose, is a recognized surrogate of insulin resistance. Its strong correlation with clamp-derived insulin sensitivity has been repeatedly demonstrated [23,26], and it has recently been associated with incident cardiovascular events in hypertensive and coronary populations [28]. In our study, TyG consistently outperformed BMI and showed comparable results to WTI, reinforcing its clinical value as a screening tool.
Similarly, recent studies have identified WTI as a promising index for assessing the risk of developing metabolic syndrome and chronic kidney disease [29,30]. Its simplicity, combining routine measurements (waist circumference and triglycerides), makes it highly applicable in occupational health programs and routine primary care settings. Notably, WTI avoids the need for insulin measurements, often unavailable in large-scale or resource-limited screenings.
Differences in metabolic levels between physical and non-physical laborers within sex groups may contribute to variability in MS risk [31]. Although occupational type was recorded, detailed stratified analyses by job activity were beyond this study’s scope. Future research should evaluate how occupational physical demands modulate the predictive capacity of metabolic indices.
From a public health perspective, the results of this study provide compelling evidence for the incorporation of WtHR, TyG, and WTI into workplace health assessments, especially considering their simplicity, reproducibility, and superior predictive value compared to BMI. Previous studies have emphasized the benefit of using non-invasive or low-cost metrics to detect high-risk individuals early and initiate preventive strategies [32,33].
The proposed cut-off values are easily derived from routine health checks, making them practical for workplace-based screenings. Their implementation could enhance early detection and personalized interventions for MS risk, especially in resource-limited settings.
5. Strengths
The strengths of the study include the use of a very large, representative cohort that was thoroughly characterized both clinically and sociodemographically.
Another notable strength of the study is the sex-stratified analysis, along with the application of two validated and widely recognized definitions of metabolic disease.
In addition, the inclusion of multiple validated indices in a single comparative analysis not only enriches the interpretation of the findings but also considerably enhances the practical applicability of our results.
6. Limitations
One of the main limitations of this study is its cross-sectional design, which precludes any causal inference. Since data were collected at a single point in time, it is not possible to determine the temporal sequence between exposure and outcome variables, nor to exclude the potential influence of unmeasured confounding factors.
Given the occupational nature of the cohort, a healthy worker effect cannot be ruled out, which may lead to an underestimation of MS prevalence and limit generalizability to high-risk or non-working populations. This may also influence the optimal cut-off values reported and potentially overestimate the diagnostic performance of the evaluated indices.
While we identified optimal cut-off points for each index, these require validation in external and longitudinal cohorts.
Although direct insulin resistance measures (e.g., HOMA-IR or euglycemic-hyperinsulinemic clamp) were unavailable, the TyG index has demonstrated strong correlation with these gold standards, making it a validated surrogate marker [22,23]. However, we acknowledge that the absence of these reference methods may limit a direct comparison of metabolic indexes.
We did not perform age-specific stratification within sex groups, which could have revealed age-related variability in index performance. Future analyses should evaluate whether diagnostic cut-offs or index effectiveness vary across age strata.
Although cost-effectiveness was not directly assessed, all four indexes require minimal resources and are highly feasible in occupational settings. Formal economic evaluations should be undertaken in future research.
7. Conclusions
In conclusion, this study confirms that indexes reflecting central adiposity and metabolic dysregulation—particularly TyG, WtHR, and WTI—outperform BMI in identifying individuals with metabolic syndrome in a large sample of Spanish workers. TyG and WTI were the most accurate in men, while WtHR and WTI performed best in women.
Sex differences may reflect hormonal modulation of fat deposition and insulin sensitivity. Women generally exhibit more subcutaneous fat and estrogen-mediated insulin sensitivity, favoring the performance of central adiposity-based indexes like WtHR. Conversely, men accumulate more visceral fat, amplifying the utility of lipid–glucose indexes such as TyG and WTI.
These indexes serve as effective tools for identifying prevalent cases of MS in occupational settings. Given the cross-sectional design, their predictive value for future cardiometabolic outcomes requires further longitudinal validation.
Supplementary Materials
The following supporting information can be downloaded at: https://www.mdpi.com/article/10.3390/metabo15080495/s1, Table S1. Pairwise comparison of areas under the curve (AUC) for the diagnosis of metabolic syndrome using the DeLong test, stratified by sex and diagnostic criteria (NCEP ATP III and IDF).
Author Contributions
Conceptualization: Á.A.L.-G. and J.I.R.-M.; data collection and analysis: J.J.G.M. and P.J.T.L.; data curation: J.J.G.M. and M.D.M.J.; methodology: C.B.-C. and P.J.T.L.; validation: P.R.S. and M.D.M.J.; formal analysis: Á.A.L.-G.; investigation: J.J.G.M.; draft: J.J.G.M., P.J.T.L., P.R.S. and C.B.-C.; revision: J.I.R.-M. and Á.A.L.-G. All authors have read and agreed to the published version of the manuscript.
Funding
This study did not receive financial support from any external sources.
Institutional Review Board Statement
The research was conducted in strict accordance with the ethical principles outlined in the Declaration of Helsinki (2013) and conformed to all relevant ethical standards for human research. Participant anonymity and data confidentiality were safeguarded throughout the investigation. Ethical clearance was obtained from the Research Ethics Committee of the Balearic Islands (CEI-IB) under protocol number IB 4383/20, dated 23 November 2020. All personal data were pseudonymized, and access to identifiable information was restricted exclusively to the principal investigator. The study complied with the provisions of Spain’s Organic Law 3/2018 of 5 December, concerning the protection of personal data and digital rights. In accordance with this legal framework, all participants retained the right to access, rectify, erase, or object to the processing of their personal information at any time.
Informed Consent Statement
Written informed consent was obtained from all individuals prior to their participation in the study.
Data Availability Statement
The data collected and analyzed in this study are securely stored within a restricted-access database managed by ADEMA University School. All data handling complies with institutional and legal data protection requirements, under the supervision of the designated Data Protection Officer, Dr. Ángel Arturo López González.
Conflicts of Interest
The authors report no conflicts of interest in connection with this research.
References
- Strauss, M.; Lavie, C.J.; Lippi, G.; Brzęk, A.; Vollenberg, R.; Sanchis-Gomar, F.; Leischik, R. A systematic review of prevalence of metabolic syndrome in occupational groups-Does occupation matter in the global epidemic of metabolic syndrome? Prog. Cardiovasc. Dis. 2022, 75, 69–77. [Google Scholar] [CrossRef] [PubMed]
- Fahed, G.; Aoun, L.; Bou Zerdan, M.; Allam, S.; Bou Zerdan, M.; Bouferraa, Y.; Assi, H.I. Metabolic Syndrome: Updates on Pathophysiology and Management in 2021. Int. J. Mol. Sci. 2022, 23, 786. [Google Scholar] [CrossRef] [PubMed] [PubMed Central]
- Scuteri, A.; Laurent, S.; Cucca, F.; Cockcroft, J.; Cunha, P.G.; Mañas, L.R.; Raso, F.U.M.; Muiesan, M.L.; Ryliškytė, L.; Rietzschel, E.; et al. Metabolic syndrome across Europe: Different clusters of risk factors. Eur. J. Prev. Cardiol. 2015, 22, 486–491. [Google Scholar] [CrossRef] [PubMed] [PubMed Central]
- Alberti, K.G.; Eckel, R.H.; Grundy, S.M.; Zimmet, P.Z.; Cleeman, J.I.; Donato, K.A.; Fruchart, J.-C.; James, W.P.T.; Loria, C.M.; Smith, S.C. Harmonizing the metabolic syndrome: A joint interim statement of the International Diabetes Federation Task Force on Epidemiology and Prevention; National Heart, Lung, and Blood Institute; American Heart Association; World Heart Federation; International Atherosclerosis Society; and International Association for the Study of Obesity. Circulation 2009, 120, 1640–1645. [Google Scholar] [CrossRef] [PubMed]
- Wu, Y.; Li, D.; Vermund, S.H. Advantages and Limitations of the Body Mass Index (BMI) to Assess Adult Obesity. Int. J. Environ. Res. Public Health 2024, 21, 757. [Google Scholar] [CrossRef] [PubMed] [PubMed Central]
- Martínez Jover, A.; López González, A.A.; Tomás Gil, P.; Coll Villalonga, J.L.; Martí Lliteras, P.; Ramírez Manent, J.I. Variables influencing the appearance of metabolic syndrome with three different definitions in 418.343 spanish workers. Acad. J. Health Sci. 2023, 38, 129–135. [Google Scholar] [CrossRef]
- Fiorentino, T.V.; Marini, M.A.; Succurro, E.; Andreozzi, F.; Sesti, G. Relationships of surrogate indexes of insulin resistance with insulin sensitivity assessed by euglycemic hyperinsulinemic clamp and subclinical vascular damage. BMJ Open Diabetes Res. Care 2019, 7, e000911. [Google Scholar] [CrossRef] [PubMed] [PubMed Central]
- Ferguson, C.C.; Knol, L.L.; Ellis, A.C. Visceral adiposity index and its association with Dietary Approaches to Stop Hypertension (DASH) diet scores among older adults: National Health and Nutrition Examination Surveys 2011–2014. Clin. Nutr. 2021, 40, 4085–4089. [Google Scholar] [CrossRef] [PubMed]
- Ramdas Nayak, V.K.; Satheesh, P.; Shenoy, M.T.; Kalra, S. Triglyceride Glucose (TyG) Index: A surrogate biomarker of insulin resistance. J. Pak. Med. Assoc. 2022, 72, 986–988. [Google Scholar] [CrossRef] [PubMed]
- Gu, T.; Yang, Q.; Ying, G.; Jin, B. Lack of association between insulin resistance as estimated by homeostasis model assessment and stroke risk: A systematic review and meta-analysis. Med. Hypotheses 2020, 141, 109700. [Google Scholar] [CrossRef] [PubMed]
- Lim, J.; Kim, J.; Koo, S.H.; Kwon, G.C. Comparison of triglyceride glucose index, and related parameters to predict insulin resistance in Korean adults: An analysis of the 2007–2010 Korean National Health and Nutrition Examination Survey. PLoS ONE 2019, 14, e0212963. [Google Scholar] [CrossRef] [PubMed] [PubMed Central]
- Arsenault, B.J.; Carpentier, A.C.; Poirier, P.; Després, J.P. Adiposity, type 2 diabetes and atherosclerotic cardiovascular disease risk: Use and abuse of the body mass index. Atherosclerosis 2024, 394, 117546. [Google Scholar] [CrossRef] [PubMed]
- Biffi, A.; Fernando, F.; Palermi, S.; Sirico, F.; Bonatesta, L.; Cavarretta, E.; D’Ascenzi, F.; Niebauer, J. Cardiovascular disease prevention in the worksite: Where are we? Int. J. Cardiol. 2022, 368, 104–107. [Google Scholar] [CrossRef] [PubMed]
- Aguiló Juanola, M.C.; López-González, A.A.; Tomás-Gil, P.; Paublini, H.; Tárraga-López, P.J.; Ramírez-Manent, J.I. Influence of tobacco consumption on the values of different insulin resistance risk scales and non-alcoholic fatty liver disease and hepatic fibrosis scales in 418,343 spanish people. Acad. J. Health Sci. 2024, 39, 9–15. [Google Scholar] [CrossRef]
- Li, Z.; Xu, Z.; Xuan, C.; Xu, H. Association between waist triglyceride index, body mass index, dietary inflammatory index, and triglyceride- glucose index with chronic kidney disease: The 1999–2018 cohort study from NHANES. Front. Endocrinol. 2024, 15, 1390725. [Google Scholar] [CrossRef] [PubMed] [PubMed Central]
- Sastre-Alzamora, T.; Tomás-Gil, P.; Paublini, H.; Pallarés, L.; Ramírez-Manent, J.I.; López-González, A.A. Relationship between heart age and cardiometabolic risk scales in 139634 Spanish workers. Acad. J. Health Sci. 2024, 39, 141–148. [Google Scholar] [CrossRef]
- Ahmed, M.; Kumari, N.; Mirgani, Z.; Saeed, A.; Ramadan, A.; Ahmed, M.H.; Almobarak, A.O. Metabolic syndrome; Definition, Pathogenesis, Elements, and the Effects of medicinal plants on it’s elements. J. Diabetes Metab. Disords 2022, 21, 1011–1022, Erratum in: J. Diabetes Metab. Disords 2022, 21, 1217. https://doi.org/10.1007/s40200-022-01035-x. [Google Scholar] [CrossRef] [PubMed] [PubMed Central]
- Mestre Font, M.; Busquets-Cortés, C.; Ramírez-Manent, J.I.; Vallejos, D.; Sastre Alzamora, T.; López-González, A.A. Influence of sociodemographic variables and healthy habits on the values of cardiometabolic risk scales in 386924 spanish workers. Acad. J. Health Sci. 2024, 39, 112–121. [Google Scholar] [CrossRef]
- Mattavelli, E.; Olmastroni, E.; Bonofiglio, D.; Catapano, A.L.; Baragetti, A.; Magni, P. Adherence to the Mediterranean Diet: Impact of Geographical Location of the Observations. Nutrients 2022, 14, 2040. [Google Scholar] [CrossRef] [PubMed] [PubMed Central]
- Vicente-Herrero, M.T.; Egea-Sancho, M.; de la Torre, M.V.R.I.; López-González, A.A. Relación de los índices de adiposidad visceral (VAI) y adiposidad disfuncional (DAI) con las escalas de riesgo de resistencia a la insulina y prediabetes. Acad. J. Health Sci. 2024, 39, 25–31. [Google Scholar] [CrossRef]
- Nahm, F.S. Receiver operating characteristic curve: Overview and practical use for clinicians. Korean J. Anesthesiol. 2022, 75, 25–36. [Google Scholar] [CrossRef] [PubMed] [PubMed Central]
- Zhang, P.; Mo, D.; Zeng, W.; Dai, H. Association between triglyceride-glucose related indices and all-cause and cardiovascular mortality among the population with cardiovascular-kidney-metabolic syndrome stage 0-3: A cohort study. Cardiovasc. Diabetol. 2025, 24, 92. [Google Scholar] [CrossRef] [PubMed] [PubMed Central]
- Cui, C.; Qi, Y.; Song, J.; Shang, X.; Han, T.; Han, N.; Yue, S.; Zha, Y.; Xu, Z.; Li, J.; et al. Comparison of triglyceride glucose index and modified triglyceride glucose indices in prediction of cardiovascular diseases in middle aged and older Chinese adults. Cardiovasc. Diabetol. 2024, 23, 185. [Google Scholar] [CrossRef] [PubMed] [PubMed Central]
- Wasana, K.G.P.; Silva, N.D.; Attanayake, A.P.; Weerarathna, T.P. Association of hypertriglyceridemic waist phenotype with metabolic syndrome traits and its diagnostic potential to predict metabolic syndrome in adults with excess body weight: A community-based cross-sectional study. J. Hum. Nutr. Diet. 2024, 37, 1130–1140. [Google Scholar] [CrossRef] [PubMed]
- Ruiz-García, A.; Serrano-Cumplido, A.; Escobar-Cervantes, C.; Arranz-Martínez, E.; Pallarés-Carratalá, V. Prevalence Rates of Abdominal Obesity, High Waist-to-Height Ratio and Excess Adiposity, and Their Associated Cardio-Kidney-Metabolic Factors: SIMETAP-AO Study. Nutrients 2024, 16, 3948. [Google Scholar] [CrossRef] [PubMed] [PubMed Central]
- Li, C.; Zhao, S.; Li, Y.; He, S.; Jian, W.; Liu, Y.; Cheng, Z.; Peng, H. Triglyceride-glucose index predicts adverse cardiovascular events in patients with H-type hypertension combined with coronary heart disease: A retrospective cohort study. Cardiovasc. Diabetol. 2025, 24, 45. [Google Scholar] [CrossRef] [PubMed] [PubMed Central]
- Shi, J.; Chen, Z.; Zhang, Y. Associations between body fat anthropometric indices and mortality among individuals with metabolic syndrome. Lipids Health Dis. 2024, 23, 306. [Google Scholar] [CrossRef] [PubMed] [PubMed Central]
- Wu, Y.; Liu, C.; Cao, J. Association between triglyceride-glucose index and its composite obesity indexes and cardio-renal disease: Analysis of the NHANES 2013–2018 cycle. Front. Endocrinol. 2025, 16, 1505808. [Google Scholar] [CrossRef] [PubMed] [PubMed Central]
- Li, Y.; Zheng, R.; Li, S.; Cai, R.; Ni, F.; Zheng, H.; Hu, R.; Sun, T. Association Between Four Anthropometric Indexes and Metabolic Syndrome in US Adults. Front. Endocrinol. 2022, 13, 889785. [Google Scholar] [CrossRef] [PubMed] [PubMed Central]
- Silveira, E.A.; Mendonça, C.R.; Delpino, F.M.; Elias Souza, G.V.; Pereira de Souza Rosa, L.; de Oliveira, C.; Noll, M. Sedentary behavior, physical inactivity, abdominal obesity and obesity in adults and older adults: A systematic review and meta-analysis. Clin. Nutr. ESPEN 2022, 50, 63–73. [Google Scholar] [CrossRef] [PubMed]
- Li, H.; Lynn, H.S.; Zipunnikov, V. Sex and Age Differences in Association between Physical Activity and Metabolic Syndrome: Results from NHANES 2003–2006. Healthcare 2023, 11, 1059. [Google Scholar] [CrossRef] [PubMed] [PubMed Central]
- Wang, C.; Liao, P.; Tang, C.; Chen, C.; Zhang, X. The predictive value of the triglyceride glucose index combined with cystatin C for the prognosis of patients with acute coronary syndrome. Front. Endocrinol. 2024, 15, 1423227. [Google Scholar] [CrossRef] [PubMed] [PubMed Central]
- Liu, P.J.; Lou, H.P.; Zhu, Y.N. Screening for Metabolic Syndrome Using an Integrated Continuous Index Consisting of Waist Circumference and Triglyceride: A Preliminary Cross-sectional Study. Diabetes Metab. Syndr. Obes. 2020, 13, 2899–2907. [Google Scholar] [CrossRef] [PubMed] [PubMed Central]
Disclaimer/Publisher’s Note: The statements, opinions and data contained in all publications are solely those of the individual author(s) and contributor(s) and not of MDPI and/or the editor(s). MDPI and/or the editor(s) disclaim responsibility for any injury to people or property resulting from any ideas, methods, instructions or products referred to in the content. |
© 2025 by the authors. Licensee MDPI, Basel, Switzerland. This article is an open access article distributed under the terms and conditions of the Creative Commons Attribution (CC BY) license (https://creativecommons.org/licenses/by/4.0/).