

Metabolomics in Parkinson’s Disease and Correlation with Disease State


Abstract
1. Introduction
2. Discussion
2.1. Metabolic Pathways Affected in Parkinson’s Disease
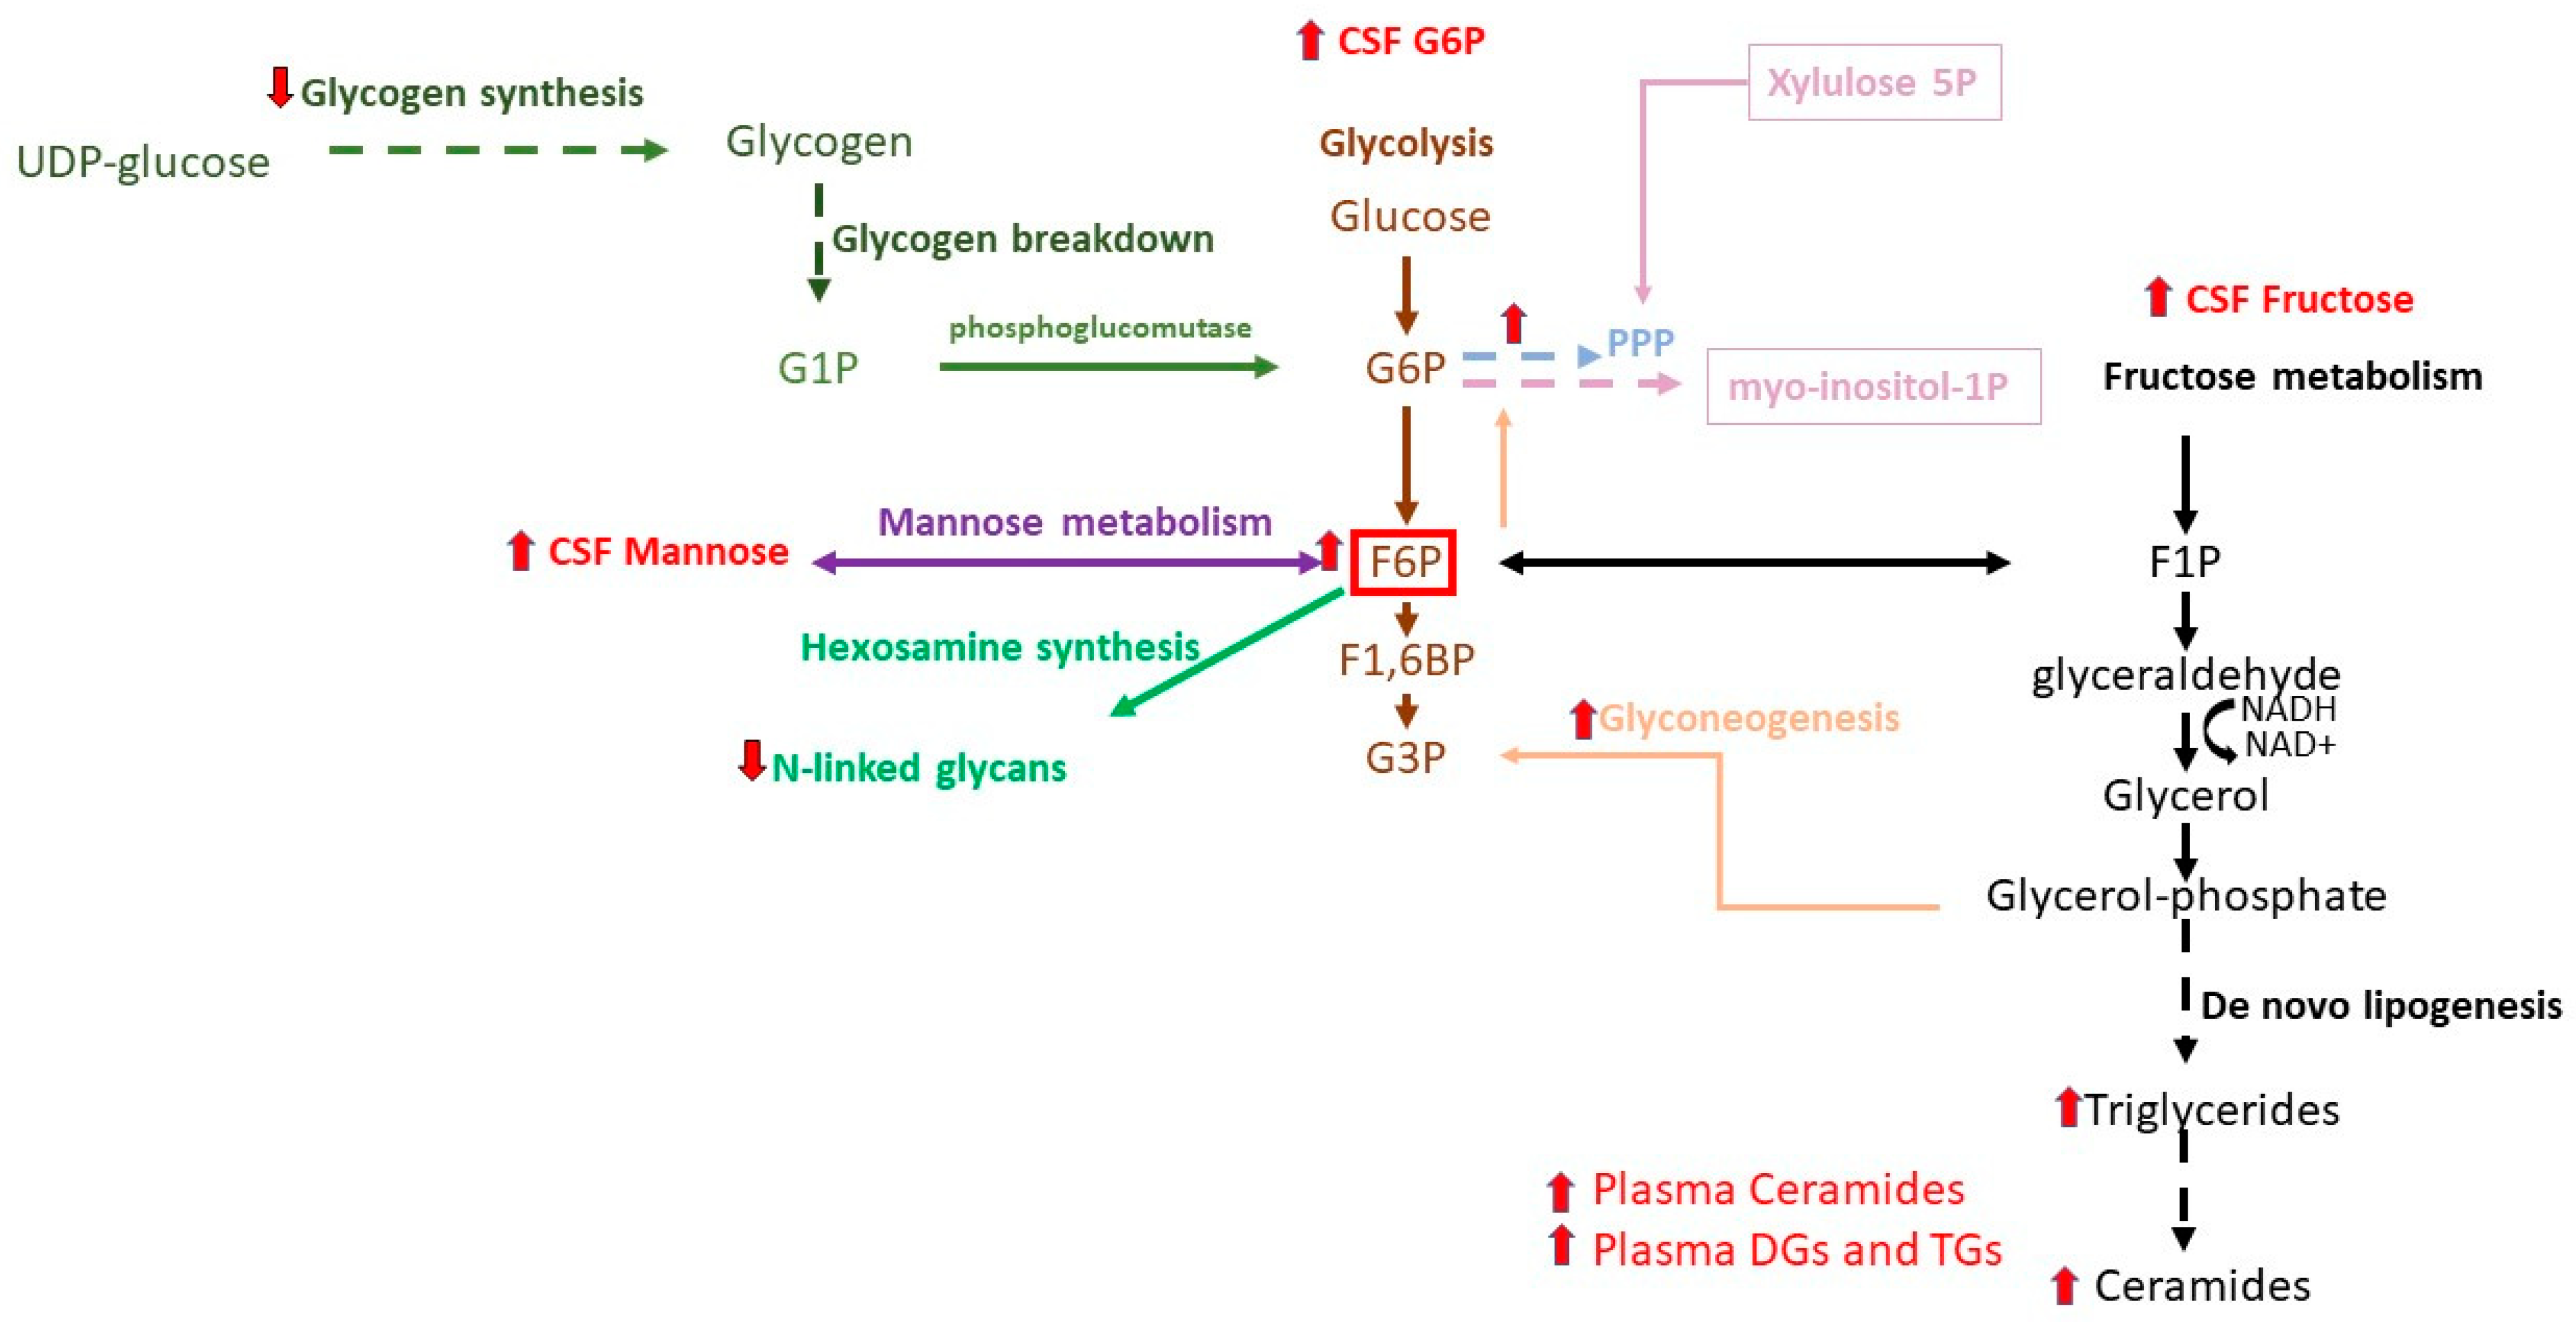
2.1.1. Glycolysis, TCA Cycle, Galactose, and Mannose
2.1.2. Pentose Phosphate Pathway
2.1.3. Redox Metabolites
2.1.4. Tryptophan and Kynurenine Metabolic Network
2.1.5. Amino Acids
2.1.6. Lipid Pathways
2.1.7. Gut Microbiota Metabolites
2.2. Differences in Metabolomic Profiles According to Motor Symptoms
2.2.1. Motor Progression and Dyskinesia
2.2.2. Gait and Balance
2.2.3. Dysphagia
2.2.4. Restless Leg Syndrome
2.3. Differences in Metabolomic Profiles According to Non-Motor Symptoms
2.3.1. Prodromal Symptoms
2.3.2. Depression
2.3.3. Circadian Dysfunction and Sleep Disturbance in PD
2.3.4. Cognitive Decline
3. Conclusions
Funding
Institutional Review Board Statement
Informed Consent Statement
Data Availability Statement
Conflicts of Interest
Abbreviations
References
- Dorsey, E.R.; Constantinescu, R.; Thompson, J.P.; Biglan, K.M.; Holloway, R.G.; Kieburtz, K.; Marshall, F.J.; Ravina, B.M.; Schifitto, G.; Siderowf, A.; et al. Projected number of people with Parkinson disease in the most populous nations, 2005 through 2030. Neurology 2007, 68, 384–386. [Google Scholar] [CrossRef]
- Dorsey, E.R.; Sherer, T.; Okun, M.S.; Bloem, B.R. The Emerging Evidence of the Parkinson Pandemic. J. Park. Dis. 2018, 8, S3–S8. [Google Scholar] [CrossRef]
- GBD 2016 Neurology Collaborators. Global, regional, and national burden of Parkinson’s disease, 1990–2016: A systematic analysis for the Global Burden of Disease Study 2016. Lancet Neurol. 2018, 17, 939–953. [Google Scholar] [CrossRef] [PubMed]
- Jagadeesan, A.J.; Murugesan, R.; Vimala Devi, S.; Meera, M.; Madhumala, G.; Vishwanathan Padmaja, M.; Ramesh, A.; Banerjee, A.; Sushmitha, S.; Khokhlov, A.N.; et al. Current trends in etiology, prognosis and therapeutic aspects of Parkinson’s disease: A review. Acta Biomed. 2017, 88, 249–262. [Google Scholar]
- Palacios, N.; Gao, X.; Schwarzschild, M.; Ascherio, A. Declining quality of life in Parkinson disease before and after diagnosis. J. Park. Dis. 2012, 2, 153–160. [Google Scholar] [CrossRef]
- Zarow, C.; Lyness, S.A.; Mortimer, J.A.; Chui, H.C. Neuronal loss is greater in the locus coeruleus than nucleus basalis and substantia nigra in Alzheimer and Parkinson diseases. Arch. Neurol. 2003, 60, 337–341. [Google Scholar] [CrossRef]
- Moore, D.J.; West, A.B.; Dawson, V.L.; Dawson, T.M. Molecular pathophysiology of Parkinson’s disease. Annu. Rev. Neurosci. 2005, 28, 57–87. [Google Scholar] [CrossRef]
- Sulzer, D.; Surmeier, D.J. Neuronal vulnerability, pathogenesis, and Parkinson’s disease. Mov. Disord. 2013, 28, 41–50. [Google Scholar] [CrossRef]
- Jankovic, J.; Tan, E.K. Parkinson’s disease: Etiopathogenesis and treatment. J. Neurol. Neurosurg. Psychiatry 2020, 91, 795–808. [Google Scholar] [CrossRef]
- Magalhaes, J.; Gegg, M.E.; Migdalska-Richards, A.; Doherty, M.K.; Whitfield, P.D.; Schapira, A.H. Autophagic lysosome reformation dysfunction in glucocerebrosidase deficient cells: Relevance to Parkinson disease. Hum. Mol. Genet. 2016, 25, 3432–3445. [Google Scholar] [CrossRef]
- Roh, J.H.; Lee, S.; Yoon, J.H. Metabolic Syndrome and Parkinson’s Disease Incidence: A Nationwide Study Using Propensity Score Matching. Metab. Syndr. Relat. Disord. 2021, 19, 1–7. [Google Scholar] [CrossRef]
- Soni, R.; Shah, J. Deciphering Intertwined Molecular Pathways Underlying Metabolic Syndrome Leading to Parkinson’s Disease. ACS Chem. Neurosci. 2022, 13, 2240–2251. [Google Scholar] [CrossRef] [PubMed]
- Newgard, C.B. Metabolomics and Metabolic Diseases: Where Do We Stand? Cell Metab. 2017, 25, 43–56. [Google Scholar] [CrossRef]
- Duarte, J.M.; Lei, H.; Mlynarik, V.; Gruetter, R. The neurochemical profile quantified by in vivo 1H NMR spectroscopy. Neuroimage 2012, 61, 342–362. [Google Scholar] [CrossRef]
- Smolinska, A.; Blanchet, L.; Buydens, L.M.; Wijmenga, S.S. NMR and pattern recognition methods in metabolomics: From data acquisition to biomarker discovery: A review. Anal. Chim. Acta 2012, 750, 82–97. [Google Scholar] [CrossRef]
- Chekmeneva, E.; Dos Santos Correia, G.; Gomez-Romero, M.; Stamler, J.; Chan, Q.; Elliott, P.; Nicholson, J.K.; Holmes, E. Ultra-Performance Liquid Chromatography-High-Resolution Mass Spectrometry and Direct Infusion-High-Resolution Mass Spectrometry for Combined Exploratory and Targeted Metabolic Profiling of Human Urine. J. Proteome Res. 2018, 17, 3492–3502. [Google Scholar] [CrossRef]
- Luo, X.; Liu, Y.; Balck, A.; Klein, C.; Fleming, R.M.T. Identification of metabolites reproducibly associated with Parkinson’s Disease via meta-analysis and computational modelling. NPJ Park. Dis. 2024, 10, 126. [Google Scholar] [CrossRef]
- Li, X.; Fan, X.; Yang, H.; Liu, Y. Review of Metabolomics-Based Biomarker Research for Parkinson’s Disease. Mol. Neurobiol. 2022, 59, 1041–1057. [Google Scholar] [CrossRef]
- Shao, Y.; Li, T.; Liu, Z.; Wang, X.; Xu, X.; Li, S.; Xu, G.; Le, W. Comprehensive metabolic profiling of Parkinson’s disease by liquid chromatography-mass spectrometry. Mol. Neurodegener. 2021, 16, 4. [Google Scholar] [CrossRef]
- Gatarek, P.; Sekulska-Nalewajko, J.; Bobrowska-Korczaka, B.; Pawelczyk, M.; Jastrzebski, K.; Glabinski, A.; Kaluzna-Czaplinska, J. Plasma Metabolic Disturbances in Parkinson’s Disease Patients. Biomedicines 2022, 10, 3005. [Google Scholar] [CrossRef]
- De Bartolo, M.I.; Belvisi, D.; Mancinelli, R.; Costanzo, M.; Caturano, C.; Leodori, G.; Berardelli, A.; Fabbrini, G.; Vivacqua, G. A systematic review of salivary biomarkers in Parkinson’s disease. Neural Regen. Res. 2024, 19, 2613–2625. [Google Scholar] [CrossRef]
- Lautrup, S.; Sinclair, D.A.; Mattson, M.P.; Fang, E.F. NAD(+) in Brain Aging and Neurodegenerative Disorders. Cell Metab. 2019, 30, 630–655. [Google Scholar] [CrossRef]
- de Lope, E.G.; Loo, R.T.J.; Rauschenberger, A.; Ali, M.; Pavelka, L.; Marques, T.M.; Gomes, C.P.C.; Kruger, R.; Glaab, E.; Consortium, N.-P. Comprehensive blood metabolomics profiling of Parkinson’s disease reveals coordinated alterations in xanthine metabolism. NPJ Park. Dis. 2024, 10, 68. [Google Scholar] [CrossRef]
- Salim, S.; Ahmad, F.; Banu, A.; Mohammad, F. Gut microbiome and Parkinson’s disease: Perspective on pathogenesis and treatment. J. Adv. Res. 2023, 50, 83–105. [Google Scholar] [CrossRef]
- Aanerud, J.; Borghammer, P.; Chakravarty, M.M.; Vang, K.; Rodell, A.B.; Jonsdottir, K.Y.; Moller, A.; Ashkanian, M.; Vafaee, M.S.; Iversen, P.; et al. Brain energy metabolism and blood flow differences in healthy aging. J. Cereb. Blood Flow. Metab. 2012, 32, 1177–1187. [Google Scholar] [CrossRef]
- Meles, S.K.; Renken, R.J.; Pagani, M.; Teune, L.K.; Arnaldi, D.; Morbelli, S.; Nobili, F.; van Laar, T.; Obeso, J.A.; Rodriguez-Oroz, M.C.; et al. Abnormal pattern of brain glucose metabolism in Parkinson’s disease: Replication in three European cohorts. Eur. J. Nucl. Med. Mol. Imaging 2020, 47, 437–450. [Google Scholar] [CrossRef]
- Borghammer, P.; Chakravarty, M.; Jonsdottir, K.Y.; Sato, N.; Matsuda, H.; Ito, K.; Arahata, Y.; Kato, T.; Gjedde, A. Cortical hypometabolism and hypoperfusion in Parkinson’s disease is extensive: Probably even at early disease stages. Brain Struct. Funct. 2010, 214, 303–317. [Google Scholar] [PubMed]
- Firbank, M.J.; Yarnall, A.J.; Lawson, R.A.; Duncan, G.W.; Khoo, T.K.; Petrides, G.S.; O’Brien, J.T.; Barker, R.A.; Maxwell, R.J.; Brooks, D.J.; et al. Cerebral glucose metabolism and cognition in newly diagnosed Parkinson’s disease: ICICLE-PD study. J. Neurol. Neurosurg. Psychiatry 2017, 88, 310–316. [Google Scholar] [CrossRef]
- Xu, Y.; Wei, X.; Liu, X.; Liao, J.; Lin, J.; Zhu, C.; Meng, X.; Xie, D.; Chao, D.; Fenoy, A.J.; et al. Low Cerebral Glucose Metabolism: A Potential Predictor for the Severity of Vascular Parkinsonism and Parkinson’s Disease. Aging Dis. 2015, 6, 426–436. [Google Scholar] [CrossRef]
- Eidelberg, D.; Moeller, J.R.; Dhawan, V.; Spetsieris, P.; Takikawa, S.; Ishikawa, T.; Chaly, T.; Robeson, W.; Margouleff, D.; Przedborski, S.; et al. The metabolic topography of parkinsonism. J. Cereb. Blood Flow. Metab. 1994, 14, 783–801. [Google Scholar] [CrossRef]
- Niethammer, M.; Eidelberg, D. Metabolic brain networks in translational neurology: Concepts and applications. Ann. Neurol. 2012, 72, 635–647. [Google Scholar] [CrossRef]
- Teune, L.K.; Renken, R.J.; Mudali, D.; De Jong, B.M.; Dierckx, R.A.; Roerdink, J.B.; Leenders, K.L. Validation of parkinsonian disease-related metabolic brain patterns. Mov. Disord. 2013, 28, 547–551. [Google Scholar] [CrossRef]
- Meyer, P.T.; Hellwig, S. Update on SPECT and PET in parkinsonism—Part 1: Imaging for differential diagnosis. Curr. Opin. Neurol. 2014, 27, 390–397. [Google Scholar] [CrossRef]
- Teune, L.K.; Bartels, A.L.; de Jong, B.M.; Willemsen, A.T.; Eshuis, S.A.; de Vries, J.J.; van Oostrom, J.C.; Leenders, K.L. Typical cerebral metabolic patterns in neurodegenerative brain diseases. Mov. Disord. 2010, 25, 2395–2404. [Google Scholar] [CrossRef]
- Komici, K.; Femminella, G.D.; Bencivenga, L.; Rengo, G.; Pagano, G. Diabetes Mellitus and Parkinson’s Disease: A Systematic Review and Meta-Analyses. J. Park. Dis. 2021, 11, 1585–1596. [Google Scholar] [CrossRef] [PubMed]
- Jeong, S.M.; Han, K.; Kim, D.; Rhee, S.Y.; Jang, W.; Shin, D.W. Body mass index, diabetes, and the risk of Parkinson’s disease. Mov. Disord. 2020, 35, 236–244. [Google Scholar] [CrossRef]
- De Pablo-Fernandez, E.; Goldacre, R.; Pakpoor, J.; Noyce, A.J.; Warner, T.T. Association between diabetes and subsequent Parkinson disease: A record-linkage cohort study. Neurology 2018, 91, e139–e142. [Google Scholar] [CrossRef]
- Sandyk, R. The relationship between diabetes mellitus and Parkinson’s disease. Int. J. Neurosci. 1993, 69, 125–130. [Google Scholar] [CrossRef]
- Mollenhauer, B.; Zimmermann, J.; Sixel-Doring, F.; Focke, N.K.; Wicke, T.; Ebentheuer, J.; Schaumburg, M.; Lang, E.; Friede, T.; Trenkwalder, C.; et al. Baseline predictors for progression 4 years after Parkinson’s disease diagnosis in the De Novo Parkinson Cohort (DeNoPa). Mov. Disord. 2019, 34, 67–77. [Google Scholar] [CrossRef]
- Pagano, G.; Polychronis, S.; Wilson, H.; Giordano, B.; Ferrara, N.; Niccolini, F.; Politis, M. Diabetes mellitus and Parkinson disease. Neurology 2018, 90, e1654–e1662. [Google Scholar] [CrossRef]
- Li, W.; Risacher, S.L.; Huang, E.; Saykin, A.J.; Alzheimer’s Disease Neuroimaging, I. Type 2 diabetes mellitus is associated with brain atrophy and hypometabolism in the ADNI cohort. Neurology 2016, 87, 595–600. [Google Scholar] [CrossRef]
- Kepes, Z.; Aranyi, C.; Forgacs, A.; Nagy, F.; Kukuts, K.; Hascsi, Z.; Esze, R.; Somodi, S.; Kaplar, M.; Varga, J.; et al. Glucose-level dependent brain hypometabolism in type 2 diabetes mellitus and obesity. Eur. J. Hybrid. Imaging 2021, 5, 3. [Google Scholar] [CrossRef]
- Sundermann, E.E.; Thomas, K.R.; Bangen, K.J.; Weigand, A.J.; Eppig, J.S.; Edmonds, E.C.; Wong, C.G.; Bondi, M.W.; Delano-Wood, L. Prediabetes Is Associated with Brain Hypometabolism and Cognitive Decline in a Sex-Dependent Manner: A Longitudinal Study of Nondemented Older Adults. Front. Neurol. 2021, 12, 551975. [Google Scholar] [CrossRef]
- Girona, J.; Rodriguez-Borjabad, C.; Ibarretxe, D.; Vallve, J.C.; Ferre, R.; Heras, M.; Rodriguez-Calvo, R.; Guaita-Esteruelas, S.; Martinez-Micaelo, N.; Plana, N.; et al. The Circulating GRP78/BiP Is a Marker of Metabolic Diseases and Atherosclerosis: Bringing Endoplasmic Reticulum Stress into the Clinical Scenario. J. Clin. Med. 2019, 8, 1793. [Google Scholar] [CrossRef]
- Hallqvist, J.; Bartl, M.; Dakna, M.; Schade, S.; Garagnani, P.; Bacalini, M.G.; Pirazzini, C.; Bhatia, K.; Schreglmann, S.; Xylaki, M.; et al. Plasma proteomics identify biomarkers predicting Parkinson’s disease up to 7 years before symptom onset. Nat. Commun. 2024, 15, 4759. [Google Scholar] [CrossRef]
- Bartl, M.; Nilsson, J.; Dakna, M.; Weber, S.; Schade, S.; Xylaki, M.; Fernandes Gomes, B.; Ernst, M.; Muntean, M.L.; Sixel-Doring, F.; et al. Lysosomal and synaptic dysfunction markers in longitudinal cerebrospinal fluid of de novo Parkinson’s disease. NPJ Park. Dis. 2024, 10, 102. [Google Scholar] [CrossRef]
- Blazquez, E.; Hurtado-Carneiro, V.; LeBaut-Ayuso, Y.; Velazquez, E.; Garcia-Garcia, L.; Gomez-Oliver, F.; Ruiz-Albusac, J.M.; Avila, J.; Pozo, M.A. Significance of Brain Glucose Hypometabolism, Altered Insulin Signal Transduction, and Insulin Resistance in Several Neurological Diseases. Front. Endocrinol. 2022, 13, 873301. [Google Scholar] [CrossRef]
- Sertbas, M.; Ulgen, K.; Cakir, T. Systematic analysis of transcription-level effects of neurodegenerative diseases on human brain metabolism by a newly reconstructed brain-specific metabolic network. FEBS Open Bio 2014, 4, 542–553. [Google Scholar] [CrossRef] [PubMed]
- Supandi, F.; van Beek, J. Computational prediction of changes in brain metabolic fluxes during Parkinson’s disease from mRNA expression. PLoS ONE 2018, 13, e0203687. [Google Scholar] [CrossRef]
- Zagare, A.; Preciat, G.; Nickels, S.L.; Luo, X.; Monzel, A.S.; Gomez-Giro, G.; Robertson, G.; Jaeger, C.; Sharif, J.; Koseki, H.; et al. Omics data integration suggests a potential idiopathic Parkinson’s disease signature. Commun. Biol. 2023, 6, 1179. [Google Scholar] [CrossRef]
- Bowen, B.C.; Block, R.E.; Sanchez-Ramos, J.; Pattany, P.M.; Lampman, D.A.; Murdoch, J.B.; Quencer, R.M. Proton MR spectroscopy of the brain in 14 patients with Parkinson disease. AJNR Am. J. Neuroradiol. 1995, 16, 61–68. [Google Scholar]
- Ahmed, S.S.; Santosh, W.; Kumar, S.; Christlet, H.T. Metabolic profiling of Parkinson’s disease: Evidence of biomarker from gene expression analysis and rapid neural network detection. J. Biomed. Sci. 2009, 16, 63. [Google Scholar] [CrossRef]
- Liguori, C.; Stefani, A.; Fernandes, M.; Cerroni, R.; Mercuri, N.B.; Pierantozzi, M. Biomarkers of Cerebral Glucose Metabolism and Neurodegeneration in Parkinson’s Disease: A Cerebrospinal Fluid-Based Study. J. Park. Dis. 2022, 12, 537–544. [Google Scholar] [CrossRef]
- Otto, C.; Kalantzis, R.; Kubler-Weller, D.; Kuhn, A.A.; Bold, T.; Regler, A.; Strathmeyer, S.; Wittmann, J.; Ruprecht, K.; Heelemann, S. Comprehensive analysis of the cerebrospinal fluid and serum metabolome in neurological diseases. J. Neuroinflamm. 2024, 21, 234. [Google Scholar] [CrossRef]
- Ohman, A.; Forsgren, L. NMR metabonomics of cerebrospinal fluid distinguishes between Parkinson’s disease and controls. Neurosci. Lett. 2015, 594, 36–39. [Google Scholar] [CrossRef]
- Abdo, W.F.; De Jong, D.; Hendriks, J.C.; Horstink, M.W.; Kremer, B.P.; Bloem, B.R.; Verbeek, M.M. Cerebrospinal fluid analysis differentiates multiple system atrophy from Parkinson’s disease. Mov. Disord. 2004, 19, 571–579. [Google Scholar] [CrossRef]
- Li, X.Y.; Xue, T.; Lai, H.; Dai, J.; Peng, F.; Xu, F.; Zhu, J.; Li, X.; Hu, J.; Li, W.; et al. Pyruvate is modified by tea/coffee metabolites and reversely correlated with multiple system atrophy and Parkinson’s disease. Heliyon 2024, 10, e26588. [Google Scholar] [CrossRef]
- Trupp, M.; Jonsson, P.; Ohrfelt, A.; Zetterberg, H.; Obudulu, O.; Malm, L.; Wuolikainen, A.; Linder, J.; Moritz, T.; Blennow, K.; et al. Metabolite and peptide levels in plasma and CSF differentiating healthy controls from patients with newly diagnosed Parkinson’s disease. J. Park. Dis. 2014, 4, 549–560. [Google Scholar] [CrossRef]
- Nagesh Babu, G.; Gupta, M.; Paliwal, V.K.; Singh, S.; Chatterji, T.; Roy, R. Serum metabolomics study in a group of Parkinson’s disease patients from northern India. Clin. Chim. Acta 2018, 480, 214–219. [Google Scholar] [CrossRef]
- Lewitt, P.A.; Li, J.; Lu, M.; Beach, T.G.; Adler, C.H.; Guo, L.; Arizona Parkinson’s Disease, C. 3-hydroxykynurenine and other Parkinson’s disease biomarkers discovered by metabolomic analysis. Mov. Disord. 2013, 28, 1653–1660. [Google Scholar] [CrossRef]
- Luan, H.; Liu, L.F.; Tang, Z.; Zhang, M.; Chua, K.K.; Song, J.X.; Mok, V.C.; Li, M.; Cai, Z. Comprehensive urinary metabolomic profiling and identification of potential noninvasive marker for idiopathic Parkinson’s disease. Sci. Rep. 2015, 5, 13888. [Google Scholar] [CrossRef]
- Pathan, M.; Wu, J.; Lakso, H.A.; Forsgren, L.; Ohman, A. Plasma Metabolite Markers of Parkinson’s Disease and Atypical Parkinsonism. Metabolites 2021, 11, 860. [Google Scholar] [CrossRef]
- LeWitt, P.A.; Li, J.; Wu, K.H.; Lu, M. Diagnostic metabolomic profiling of Parkinson’s disease biospecimens. Neurobiol. Dis. 2023, 177, 105962. [Google Scholar] [CrossRef]
- Trezzi, J.P.; Galozzi, S.; Jaeger, C.; Barkovits, K.; Brockmann, K.; Maetzler, W.; Berg, D.; Marcus, K.; Betsou, F.; Hiller, K.; et al. Distinct metabolomic signature in cerebrospinal fluid in early parkinson’s disease. Mov. Disord. 2017, 32, 1401–1408. [Google Scholar] [CrossRef]
- Wuolikainen, A.; Jonsson, P.; Ahnlund, M.; Antti, H.; Marklund, S.L.; Moritz, T.; Forsgren, L.; Andersen, P.M.; Trupp, M. Multi-platform mass spectrometry analysis of the CSF and plasma metabolomes of rigorously matched amyotrophic lateral sclerosis, Parkinson’s disease and control subjects. Mol. Biosyst. 2016, 12, 1287–1298. [Google Scholar] [CrossRef]
- Muftuoglu, M.; Elibol, B.; Dalmizrak, O.; Ercan, A.; Kulaksiz, G.; Ogus, H.; Dalkara, T.; Ozer, N. Mitochondrial complex I and IV activities in leukocytes from patients with parkin mutations. Mov. Disord. 2004, 19, 544–548. [Google Scholar] [CrossRef]
- Paul, K.C.; Zhang, K.; Walker, D.I.; Sinsheimer, J.; Yu, Y.; Kusters, C.; Del Rosario, I.; Folle, A.D.; Keener, A.M.; Bronstein, J.; et al. Untargeted serum metabolomics reveals novel metabolite associations and disruptions in amino acid and lipid metabolism in Parkinson’s disease. Mol. Neurodegener. 2023, 18, 100. [Google Scholar] [CrossRef]
- Dahabiyeh, L.A.; Nimer, R.M.; Wells, J.D.; Abu-Rish, E.Y.; Fiehn, O. Diagnosing Parkinson’s disease and monitoring its progression: Biomarkers from combined GC-TOF MS and LC-MS/MS untargeted metabolomics. Heliyon 2024, 10, e30452. [Google Scholar] [CrossRef]
- Umhau, J.C.; Petrulis, S.G.; Diaz, R.; Rawlings, R.; George, D.T. Blood glucose is correlated with cerebrospinal fluid neurotransmitter metabolites. Neuroendocrinology 2003, 78, 339–343. [Google Scholar] [CrossRef]
- Beard, E.; Lengacher, S.; Dias, S.; Magistretti, P.J.; Finsterwald, C. Astrocytes as Key Regulators of Brain Energy Metabolism: New Therapeutic Perspectives. Front. Physiol. 2021, 12, 825816. [Google Scholar] [CrossRef]
- Aldana, B.I. Microglia-Specific Metabolic Changes in Neurodegeneration. J. Mol. Biol. 2019, 431, 1830–1842. [Google Scholar] [CrossRef] [PubMed]
- Suzuki, A.; Stern, S.A.; Bozdagi, O.; Huntley, G.W.; Walker, R.H.; Magistretti, P.J.; Alberini, C.M. Astrocyte-neuron lactate transport is required for long-term memory formation. Cell 2011, 144, 810–823. [Google Scholar] [CrossRef]
- Toomey, C.E.; Heywood, W.E.; Evans, J.R.; Lachica, J.; Pressey, S.N.; Foti, S.C.; Al Shahrani, M.; D’Sa, K.; Hargreaves, I.P.; Heales, S.; et al. Mitochondrial dysfunction is a key pathological driver of early stage Parkinson’s. Acta Neuropathol. Commun. 2022, 10, 134. [Google Scholar] [CrossRef]
- Willkommen, D.; Lucio, M.; Moritz, F.; Forcisi, S.; Kanawati, B.; Smirnov, K.S.; Schroeter, M.; Sigaroudi, A.; Schmitt-Kopplin, P.; Michalke, B. Metabolomic investigations in cerebrospinal fluid of Parkinson’s disease. PLoS ONE 2018, 13, e0208752. [Google Scholar] [CrossRef]
- Vannucci, S.J.; Simpson, I.A. Developmental switch in brain nutrient transporter expression in the rat. Am. J. Physiol. Endocrinol. Metab. 2003, 285, E1127–E1134. [Google Scholar] [CrossRef]
- Brekke, E.M.; Walls, A.B.; Schousboe, A.; Waagepetersen, H.S.; Sonnewald, U. Quantitative importance of the pentose phosphate pathway determined by incorporation of 13C from [2-13C]- and [3-13C]glucose into TCA cycle intermediates and neurotransmitter amino acids in functionally intact neurons. J. Cereb. Blood Flow. Metab. 2012, 32, 1788–1799. [Google Scholar] [CrossRef]
- Dunn, L.; Allen, G.F.; Mamais, A.; Ling, H.; Li, A.; Duberley, K.E.; Hargreaves, I.P.; Pope, S.; Holton, J.L.; Lees, A.; et al. Dysregulation of glucose metabolism is an early event in sporadic Parkinson’s disease. Neurobiol. Aging 2014, 35, 1111–1115. [Google Scholar] [CrossRef]
- Kim, H.; Kang, H.; Lee, Y.; Park, C.H.; Jo, A.; Khang, R.; Shin, J.H. Identification of transketolase as a target of PARIS in substantia nigra. Biochem. Biophys. Res. Commun. 2017, 493, 1050–1056. [Google Scholar] [CrossRef]
- Tu, D.; Gao, Y.; Yang, R.; Guan, T.; Hong, J.S.; Gao, H.M. The pentose phosphate pathway regulates chronic neuroinflammation and dopaminergic neurodegeneration. J. Neuroinflamm. 2019, 16, 255. [Google Scholar] [CrossRef]
- Yang, S.; Qin, C.; Hu, Z.W.; Zhou, L.Q.; Yu, H.H.; Chen, M.; Bosco, D.B.; Wang, W.; Wu, L.J.; Tian, D.S. Microglia reprogram metabolic profiles for phenotype and function changes in central nervous system. Neurobiol. Dis. 2021, 152, 105290. [Google Scholar] [CrossRef]
- Schipper, H.M.; Kwok, C.S.; Rosendahl, S.M.; Bandilla, D.; Maes, O.; Melmed, C.; Rabinovitch, D.; Burns, D.H. Spectroscopy of human plasma for diagnosis of idiopathic Parkinson’s disease. Biomark. Med. 2008, 2, 229–238. [Google Scholar] [CrossRef]
- Ravina, B.; Eberly, S.; Oakes, D.; Lang, A.E.; Dodelet, V.; Roos, P.; Harman, J.; Shoulson, I.; Schipper, H.M. Plasma near-infrared spectroscopy for diagnosis of idiopathic Parkinson’s disease: The SPIN-PD study. Biomark. Med. 2015, 9, 89–97. [Google Scholar] [CrossRef]
- Green, H.F.; Khosousi, S.; Svenningsson, P. Plasma IL-6 and IL-17A Correlate with Severity of Motor and Non-Motor Symptoms in Parkinson’s Disease. J. Park. Dis. 2019, 9, 705–709. [Google Scholar] [CrossRef]
- Li, D.; Song, X.; Huang, H.; Huang, H.; Ye, Z. Association of Parkinson’s disease-related pain with plasma interleukin-1, interleukin-6, interleukin-10, and tumour necrosis factor-alpha. Neurosci. Lett. 2018, 683, 181–184. [Google Scholar] [CrossRef]
- Dufek, M.; Rektorova, I.; Thon, V.; Lokaj, J.; Rektor, I. Interleukin-6 May Contribute to Mortality in Parkinson’s Disease Patients: A 4-Year Prospective Study. Park. Dis. 2015, 2015, 898192. [Google Scholar] [CrossRef]
- Perry, T.L.; Yong, V.W. Idiopathic Parkinson’s disease, progressive supranuclear palsy and glutathione metabolism in the substantia nigra of patients. Neurosci. Lett. 1986, 67, 269–274. [Google Scholar] [CrossRef]
- Pearce, R.K.; Owen, A.; Daniel, S.; Jenner, P.; Marsden, C.D. Alterations in the distribution of glutathione in the substantia nigra in Parkinson’s disease. J. Neural Transm. 1997, 104, 661–677. [Google Scholar] [CrossRef]
- Sofic, E.; Lange, K.W.; Jellinger, K.; Riederer, P. Reduced and oxidized glutathione in the substantia nigra of patients with Parkinson’s disease. Neurosci. Lett. 1992, 142, 128–130. [Google Scholar] [CrossRef]
- Damier, P.; Hirsch, E.C.; Zhang, P.; Agid, Y.; Javoy-Agid, F. Glutathione peroxidase, glial cells and Parkinson’s disease. Neuroscience 1993, 52, 1–6. [Google Scholar] [CrossRef]
- Sian, J.; Dexter, D.T.; Lees, A.J.; Daniel, S.; Jenner, P.; Marsden, C.D. Glutathione-related enzymes in brain in Parkinson’s disease. Ann. Neurol. 1994, 36, 356–361. [Google Scholar] [CrossRef]
- Yuan, Y.; Tong, Q.; Zhang, L.; Jiang, S.; Zhou, H.; Zhang, R.; Zhang, S.; Xu, Q.; Li, D.; Zhou, X.; et al. Plasma antioxidant status and motor features in de novo Chinese Parkinson’s disease patients. Int. J. Neurosci. 2016, 126, 641–646. [Google Scholar]
- Muller, T.; Muhlack, S. Cysteinyl-glycine reduction as marker for levodopa-induced oxidative stress in Parkinson’s disease patients. Mov. Disord. 2011, 26, 543–546. [Google Scholar] [CrossRef]
- Muller, T.; Muhlack, S. Levodopa-related cysteinyl-glycine and cysteine reduction with and without catechol-O-methyltransferase inhibition in Parkinson’s disease patients. J. Neural Transm. 2014, 121, 643–648. [Google Scholar] [CrossRef]
- Muhlack, S.; Kinkel, M.; Herrman, L.; Muller, T. Levodopa, placebo and rotigotine change biomarker levels for oxidative stress. Neurol. Res. 2017, 39, 381–386. [Google Scholar] [CrossRef] [PubMed]
- Bogdanov, M.; Matson, W.R.; Wang, L.; Matson, T.; Saunders-Pullman, R.; Bressman, S.S.; Flint Beal, M. Metabolomic profiling to develop blood biomarkers for Parkinson’s disease. Brain 2008, 131, 389–396. [Google Scholar] [CrossRef]
- Yakhine-Diop, S.M.S.; Morales-Garcia, J.A.; Niso-Santano, M.; Gonzalez-Polo, R.A.; Uribe-Carretero, E.; Martinez-Chacon, G.; Durand, S.; Maiuri, M.C.; Aiastui, A.; Zulaica, M.; et al. Metabolic alterations in plasma from patients with familial and idiopathic Parkinson’s disease. Aging 2020, 12, 16690–16708. [Google Scholar] [CrossRef]
- Savio, L.E.B.; Leite-Aguiar, R.; Alves, V.S.; Coutinho-Silva, R.; Wyse, A.T.S. Purinergic signaling in the modulation of redox biology. Redox Biol. 2021, 47, 102137. [Google Scholar] [CrossRef]
- Bortolotti, M.; Polito, L.; Battelli, M.G.; Bolognesi, A. Xanthine oxidoreductase: One enzyme for multiple physiological tasks. Redox Biol. 2021, 41, 101882. [Google Scholar] [CrossRef]
- Bachmann, C.G.; Guth, N.; Helmschmied, K.; Armstrong, V.W.; Paulus, W.; Happe, S. Homocysteine in restless legs syndrome. Sleep. Med. 2008, 9, 388–392. [Google Scholar] [CrossRef]
- Muller, T.; Jugel, C.; Ehret, R.; Ebersbach, G.; Bengel, G.; Muhlack, S.; Klostermann, F. Elevation of total homocysteine levels in patients with Parkinson’s disease treated with duodenal levodopa/carbidopa gel. J. Neural Transm. 2011, 118, 1329–1333. [Google Scholar] [CrossRef]
- Mazzoli, A.; Spagnuolo, M.S.; Nazzaro, M.; Gatto, C.; Iossa, S.; Cigliano, L. Fructose Removal from the Diet Reverses Inflammation, Mitochondrial Dysfunction, and Oxidative Stress in Hippocampus. Antioxidants 2021, 10, 487. [Google Scholar] [CrossRef]
- Roede, J.R.; Uppal, K.; Park, Y.; Lee, K.; Tran, V.; Walker, D.; Strobel, F.H.; Rhodes, S.L.; Ritz, B.; Jones, D.P. Serum metabolomics of slow vs. rapid motor progression Parkinson’s disease: A pilot study. PLoS ONE 2013, 8, e77629. [Google Scholar] [CrossRef]
- Kalecky, K.; Bottiglieri, T. Targeted metabolomic analysis in Parkinson’s disease brain frontal cortex and putamen with relation to cognitive impairment. NPJ Park. Dis. 2023, 9, 84. [Google Scholar] [CrossRef]
- Ostrakhovitch, E.A.; Song, E.S.; Macedo, J.K.A.; Gentry, M.S.; Quintero, J.E.; van Horne, C.; Yamasaki, T.R. Analysis of circulating metabolites to differentiate Parkinson’s disease and essential tremor. Neurosci. Lett. 2022, 769, 136428. [Google Scholar] [CrossRef]
- Mischley, L.K.; Shankland, E.; Liu, S.Z.; Bhayana, S.; Fox, D.J.; Marcinek, D.J. ATP and NAD(+) Deficiency in Parkinson’s Disease. Nutrients 2023, 15, 943. [Google Scholar] [CrossRef]
- Berven, H.; Kverneng, S.; Sheard, E.; Sognen, M.; Af Geijerstam, S.A.; Haugarvoll, K.; Skeie, G.O.; Dolle, C.; Tzoulis, C. NR-SAFE: A randomized, double-blind safety trial of high dose nicotinamide riboside in Parkinson’s disease. Nat. Commun. 2023, 14, 7793. [Google Scholar] [CrossRef] [PubMed]
- Wakade, C.; Chong, R.; Seamon, M.; Purohit, S.; Giri, B.; Morgan, J.C. Low-Dose Niacin Supplementation Improves Motor Function in US Veterans with Parkinson’s Disease: A Single-Center, Randomized, Placebo-Controlled Trial. Biomedicines 2021, 9, 1881. [Google Scholar] [CrossRef]
- Fukushima, T. Niacin metabolism and Parkinson’s disease. Environ. Health Prev. Med. 2005, 10, 3–8. [Google Scholar] [CrossRef]
- Wakade, C.; Chong, R.; Bradley, E.; Thomas, B.; Morgan, J. Upregulation of GPR109A in Parkinson’s disease. PLoS ONE 2014, 9, e109818. [Google Scholar] [CrossRef]
- Bender, D.A.; Earl, C.J.; Lees, A.J. Niacin depletion in Parkinsonian patients treated with L-dopa, benserazide and carbidopa. Clin. Sci. 1979, 56, 89–93. [Google Scholar] [CrossRef]
- Alisky, J.M. Niacin improved rigidity and bradykinesia in a Parkinson’s disease patient but also caused unacceptable nightmares and skin rash—A case report. Nutr. Neurosci. 2005, 8, 327–329. [Google Scholar] [CrossRef]
- Zhao, X.; Zhang, M.; Li, C.; Jiang, X.; Su, Y.; Zhang, Y. Benefits of Vitamins in the Treatment of Parkinson’s Disease. Oxid. Med. Cell Longev. 2019, 2019, 9426867. [Google Scholar] [CrossRef]
- Wakade, C.; Chong, R.; Bradley, E.; Morgan, J.C. Low-dose niacin supplementation modulates GPR109A, niacin index and ameliorates Parkinson’s disease symptoms without side effects. Clin. Case Rep. 2015, 3, 635–637. [Google Scholar] [CrossRef]
- Cuenoud, B.; Ipek, O.; Shevlyakova, M.; Beaumont, M.; Cunnane, S.C.; Gruetter, R.; Xin, L. Brain NAD Is Associated With ATP Energy Production and Membrane Phospholipid Turnover in Humans. Front. Aging Neurosci. 2020, 12, 609517. [Google Scholar] [CrossRef]
- Perez, M.J.; Baden, P.; Deleidi, M. Progresses in both basic research and clinical trials of NAD+ in Parkinson’s disease. Mech. Ageing Dev. 2021, 197, 111499. [Google Scholar] [CrossRef]
- Keeney, P.M.; Xie, J.; Capaldi, R.A.; Bennett, J.P., Jr. Parkinson’s disease brain mitochondrial complex I has oxidatively damaged subunits and is functionally impaired and misassembled. J. Neurosci. 2006, 26, 5256–5264. [Google Scholar] [CrossRef]
- Yoshida, M.; Satoh, A.; Lin, J.B.; Mills, K.F.; Sasaki, Y.; Rensing, N.; Wong, M.; Apte, R.S.; Imai, S.I. Extracellular Vesicle-Contained eNAMPT Delays Aging and Extends Lifespan in Mice. Cell Metab. 2019, 30, 329–342 e325. [Google Scholar] [CrossRef]
- Quijada, H.; Bermudez, T.; Kempf, C.L.; Valera, D.G.; Garcia, A.N.; Camp, S.M.; Song, J.H.; Franco, E.; Burt, J.K.; Sun, B.; et al. Endothelial eNAMPT amplifies pre-clinical acute lung injury: Efficacy of an eNAMPT-neutralising monoclonal antibody. Eur. Respir. J. 2021, 57, 2002536. [Google Scholar] [CrossRef]
- Santiago, J.A.; Littlefield, A.M.; Potashkin, J.A. Integrative transcriptomic meta-analysis of Parkinson’s disease and depression identifies NAMPT as a potential blood biomarker for de novo Parkinson’s disease. Sci. Rep. 2016, 6, 34579. [Google Scholar] [CrossRef]
- Hatano, T.; Saiki, S.; Okuzumi, A.; Mohney, R.P.; Hattori, N. Identification of novel biomarkers for Parkinson’s disease by metabolomic technologies. J. Neurol. Neurosurg. Psychiatry 2016, 87, 295–301. [Google Scholar] [CrossRef]
- Havelund, J.F.; Andersen, A.D.; Binzer, M.; Blaabjerg, M.; Heegaard, N.H.H.; Stenager, E.; Faergeman, N.J.; Gramsbergen, J.B. Changes in kynurenine pathway metabolism in Parkinson patients with L-DOPA-induced dyskinesia. J. Neurochem. 2017, 142, 756–766. [Google Scholar] [CrossRef]
- Paulus, W.; Jellinger, K. The neuropathologic basis of different clinical subgroups of Parkinson’s disease. J. Neuropathol. Exp. Neurol. 1991, 50, 743–755. [Google Scholar] [CrossRef]
- Buddhala, C.; Loftin, S.K.; Kuley, B.M.; Cairns, N.J.; Campbell, M.C.; Perlmutter, J.S.; Kotzbauer, P.T. Dopaminergic, serotonergic, and noradrenergic deficits in Parkinson disease. Ann. Clin. Transl. Neurol. 2015, 2, 949–959. [Google Scholar] [CrossRef]
- Sellgren, C.M.; Kegel, M.E.; Bergen, S.E.; Ekman, C.J.; Olsson, S.; Larsson, M.; Vawter, M.P.; Backlund, L.; Sullivan, P.F.; Sklar, P.; et al. A genome-wide association study of kynurenic acid in cerebrospinal fluid: Implications for psychosis and cognitive impairment in bipolar disorder. Mol. Psychiatry 2016, 21, 1342–1350. [Google Scholar] [CrossRef]
- Olsson, S.K.; Sellgren, C.; Engberg, G.; Landen, M.; Erhardt, S. Cerebrospinal fluid kynurenic acid is associated with manic and psychotic features in patients with bipolar I disorder. Bipolar Disord. 2012, 14, 719–726. [Google Scholar] [CrossRef]
- Savitz, J.; Dantzer, R.; Wurfel, B.E.; Victor, T.A.; Ford, B.N.; Bodurka, J.; Bellgowan, P.S.; Teague, T.K.; Drevets, W.C. Neuroprotective kynurenine metabolite indices are abnormally reduced and positively associated with hippocampal and amygdalar volume in bipolar disorder. Psychoneuroendocrinology 2015, 52, 200–211. [Google Scholar] [CrossRef]
- Tong, Q.; Zhang, L.; Yuan, Y.; Jiang, S.; Zhang, R.; Xu, Q.; Ding, J.; Li, D.; Zhou, X.; Zhang, K. Reduced plasma serotonin and 5-hydroxyindoleacetic acid levels in Parkinson’s disease are associated with nonmotor symptoms. Parkinsonism Relat. Disord. 2015, 21, 882–887. [Google Scholar] [CrossRef]
- Tohgi, H.; Abe, T.; Takahashi, S.; Takahashi, J.; Hamato, H. Concentrations of serotonin and its related substances in the cerebrospinal fluid of parkinsonian patients and their relations to the severity of symptoms. Neurosci. Lett. 1993, 150, 71–74. [Google Scholar] [CrossRef]
- Valdiglesias, V.; Marcos-Perez, D.; Lorenzi, M.; Onder, G.; Gostner, J.M.; Strasser, B.; Fuchs, D.; Bonassi, S. Immunological alterations in frail older adults: A cross sectional study. Exp. Gerontol. 2018, 112, 119–126. [Google Scholar] [CrossRef]
- Solvang, S.H.; Nordrehaug, J.E.; Tell, G.S.; Nygard, O.; McCann, A.; Ueland, P.M.; Midttun, O.; Meyer, K.; Vedeler, C.A.; Aarsland, D.; et al. The kynurenine pathway and cognitive performance in community-dwelling older adults. The Hordaland Health Study. Brain Behav. Immun. 2019, 75, 155–162. [Google Scholar] [CrossRef]
- Chang, K.H.; Cheng, M.L.; Tang, H.Y.; Huang, C.Y.; Wu, Y.R.; Chen, C.M. Alternations of Metabolic Profile and Kynurenine Metabolism in the Plasma of Parkinson’s Disease. Mol. Neurobiol. 2018, 55, 6319–6328. [Google Scholar] [CrossRef]
- Iwaoka, K.; Otsuka, C.; Maeda, T.; Yamahara, K.; Kato, K.; Takahashi, K.; Takahashi, K.; Terayama, Y. Impaired metabolism of kynurenine and its metabolites in CSF of parkinson’s disease. Neurosci. Lett. 2020, 714, 134576. [Google Scholar] [CrossRef]
- Heilman, P.L.; Wang, E.W.; Lewis, M.M.; Krzyzanowski, S.; Capan, C.D.; Burmeister, A.R.; Du, G.; Escobar Galvis, M.L.; Brundin, P.; Huang, X.; et al. Tryptophan Metabolites Are Associated With Symptoms and Nigral Pathology in Parkinson’s Disease. Mov. Disord. 2020, 35, 2028–2037. [Google Scholar] [CrossRef]
- Ogawa, T.; Matson, W.R.; Beal, M.F.; Myers, R.H.; Bird, E.D.; Milbury, P.; Saso, S. Kynurenine pathway abnormalities in Parkinson’s disease. Neurology 1992, 42, 1702–1706. [Google Scholar] [CrossRef]
- Hartai, Z.; Klivenyi, P.; Janaky, T.; Penke, B.; Dux, L.; Vecsei, L. Kynurenine metabolism in plasma and in red blood cells in Parkinson’s disease. J. Neurol. Sci. 2005, 239, 31–35. [Google Scholar] [CrossRef]
- Darlington, L.G.; Forrest, C.M.; Mackay, G.M.; Smith, R.A.; Smith, A.J.; Stoy, N.; Stone, T.W. On the Biological Importance of the 3-hydroxyanthranilic Acid: Anthranilic Acid Ratio. Int. J. Tryptophan Res. 2010, 3, 51–59. [Google Scholar] [CrossRef]
- Picca, A.; Calvani, R.; Landi, G.; Marini, F.; Biancolillo, A.; Gervasoni, J.; Persichilli, S.; Primiano, A.; Urbani, A.; Bossola, M.; et al. Circulating amino acid signature in older people with Parkinson’s disease: A metabolic complement to the EXosomes in PArkiNson Disease (EXPAND) study. Exp. Gerontol. 2019, 128, 110766. [Google Scholar] [CrossRef]
- Kumari, S.; Kumaran, S.S.; Goyal, V.; Sharma, R.K.; Sinha, N.; Dwivedi, S.N.; Srivastava, A.K.; Jagannathan, N.R. Identification of potential urine biomarkers in idiopathic parkinson’s disease using NMR. Clin. Chim. Acta 2020, 510, 442–449. [Google Scholar] [CrossRef]
- Walker, A.K.; Wing, E.E.; Banks, W.A.; Dantzer, R. Leucine competes with kynurenine for blood-to-brain transport and prevents lipopolysaccharide-induced depression-like behavior in mice. Mol. Psychiatry 2019, 24, 1523–1532. [Google Scholar] [CrossRef]
- Molsberry, S.; Bjornevik, K.; Hughes, K.C.; Zhang, Z.J.; Jeanfavre, S.; Clish, C.; Healy, B.; Schwarzschild, M.; Ascherio, A. Plasma Metabolomic Markers of Insulin Resistance and Diabetes and Rate of Incident Parkinson’s Disease. J. Park. Dis. 2020, 10, 1011–1021. [Google Scholar] [CrossRef]
- Hu, L.; Dong, M.X.; Huang, Y.L.; Lu, C.Q.; Qian, Q.; Zhang, C.C.; Xu, X.M.; Liu, Y.; Chen, G.H.; Wei, Y.D. Integrated Metabolomics and Proteomics Analysis Reveals Plasma Lipid Metabolic Disturbance in Patients With Parkinson’s Disease. Front. Mol. Neurosci. 2020, 13, 80. [Google Scholar] [CrossRef]
- Zhang, J.; Liu, L.; Zhang, L.; Chen, S.; Chen, Y.; Cai, C. Targeted fatty acid metabolomics to discover Parkinson’s disease associated metabolic alteration. J. Mass. Spectrom. 2021, 56, e4781. [Google Scholar] [CrossRef]
- Fernandez-Irigoyen, J.; Cartas-Cejudo, P.; Iruarrizaga-Lejarreta, M.; Santamaria, E. Alteration in the Cerebrospinal Fluid Lipidome in Parkinson’s Disease: A Post-Mortem Pilot Study. Biomedicines 2021, 9, 491. [Google Scholar] [CrossRef]
- Chang, K.H.; Cheng, M.L.; Tang, H.Y.; Huang, C.Y.; Wu, H.C.; Chen, C.M. Alterations of Sphingolipid and Phospholipid Pathways and Ornithine Level in the Plasma as Biomarkers of Parkinson’s Disease. Cells 2022, 11, 395. [Google Scholar] [CrossRef]
- Sinclair, E.; Trivedi, D.K.; Sarkar, D.; Walton-Doyle, C.; Milne, J.; Kunath, T.; Rijs, A.M.; de Bie, R.M.A.; Goodacre, R.; Silverdale, M.; et al. Metabolomics of sebum reveals lipid dysregulation in Parkinson’s disease. Nat. Commun. 2021, 12, 1592. [Google Scholar] [CrossRef]
- Meoni, G.; Tenori, L.; Schade, S.; Licari, C.; Pirazzini, C.; Bacalini, M.G.; Garagnani, P.; Turano, P.; Consortium, P.-A.; Trenkwalder, C.; et al. Metabolite and lipoprotein profiles reveal sex-related oxidative stress imbalance in de novo drug-naive Parkinson’s disease patients. NPJ Park. Dis. 2022, 8, 14. [Google Scholar] [CrossRef]
- Gonzalez-Riano, C.; Saiz, J.; Barbas, C.; Bergareche, A.; Huerta, J.M.; Ardanaz, E.; Konjevod, M.; Mondragon, E.; Erro, M.E.; Chirlaque, M.D.; et al. Prognostic biomarkers of Parkinson’s disease in the Spanish EPIC cohort: A multiplatform metabolomics approach. NPJ Park. Dis. 2021, 7, 73. [Google Scholar] [CrossRef]
- Schulte, E.C.; Altmaier, E.; Berger, H.S.; Do, K.T.; Kastenmuller, G.; Wahl, S.; Adamski, J.; Peters, A.; Krumsiek, J.; Suhre, K.; et al. Alterations in Lipid and Inositol Metabolisms in Two Dopaminergic Disorders. PLoS ONE 2016, 11, e0147129. [Google Scholar] [CrossRef]
- Dong, M.X.; Wei, Y.D.; Hu, L. Lipid metabolic dysregulation is involved in Parkinson’s disease dementia. Metab. Brain Dis. 2021, 36, 463–470. [Google Scholar] [CrossRef]
- Dong, M.X.; Hu, L.; Wei, Y.D.; Chen, G.H. Metabolomics profiling reveals altered lipid metabolism and identifies a panel of lipid metabolites as biomarkers for Parkinson’s disease related anxiety disorder. Neurosci. Lett. 2021, 745, 135626. [Google Scholar] [CrossRef]
- Alecu, I.; Bennett, S.A.L. Dysregulated Lipid Metabolism and Its Role in alpha-Synucleinopathy in Parkinson’s Disease. Front. Neurosci. 2019, 13, 328. [Google Scholar] [CrossRef]
- Glaab, E.; Trezzi, J.P.; Greuel, A.; Jager, C.; Hodak, Z.; Drzezga, A.; Timmermann, L.; Tittgemeyer, M.; Diederich, N.J.; Eggers, C. Integrative analysis of blood metabolomics and PET brain neuroimaging data for Parkinson’s disease. Neurobiol. Dis. 2019, 124, 555–562. [Google Scholar] [CrossRef]
- Troisi, J.; Landolfi, A.; Vitale, C.; Longo, K.; Cozzolino, A.; Squillante, M.; Savanelli, M.C.; Barone, P.; Amboni, M. A metabolomic signature of treated and drug-naive patients with Parkinson’s disease: A pilot study. Metabolomics 2019, 15, 90. [Google Scholar] [CrossRef]
- Chen, S.J.; Chen, C.C.; Liao, H.Y.; Lin, Y.T.; Wu, Y.W.; Liou, J.M.; Wu, M.S.; Kuo, C.H.; Lin, C.H. Association of Fecal and Plasma Levels of Short-Chain Fatty Acids With Gut Microbiota and Clinical Severity in Patients With Parkinson Disease. Neurology 2022, 98, e848–e858. [Google Scholar] [CrossRef]
- de Lau, L.M.; Bornebroek, M.; Witteman, J.C.; Hofman, A.; Koudstaal, P.J.; Breteler, M.M. Dietary fatty acids and the risk of Parkinson disease: The Rotterdam study. Neurology 2005, 64, 2040–2045. [Google Scholar] [CrossRef]
- Kamel, F.; Goldman, S.M.; Umbach, D.M.; Chen, H.; Richardson, G.; Barber, M.R.; Meng, C.; Marras, C.; Korell, M.; Kasten, M.; et al. Dietary fat intake, pesticide use, and Parkinson’s disease. Parkinsonism Relat. Disord. 2014, 20, 82–87. [Google Scholar] [CrossRef]
- Taghizadeh, M.; Tamtaji, O.R.; Dadgostar, E.; Daneshvar Kakhaki, R.; Bahmani, F.; Abolhassani, J.; Aarabi, M.H.; Kouchaki, E.; Memarzadeh, M.R.; Asemi, Z. The effects of omega-3 fatty acids and vitamin E co-supplementation on clinical and metabolic status in patients with Parkinson’s disease: A randomized, double-blind, placebo-controlled trial. Neurochem. Int. 2017, 108, 183–189. [Google Scholar] [CrossRef]
- Block, M.L.; Hong, J.S. Microglia and inflammation-mediated neurodegeneration: Multiple triggers with a common mechanism. Prog. Neurobiol. 2005, 76, 77–98. [Google Scholar] [CrossRef]
- Chang, P.K.; Khatchadourian, A.; McKinney, R.A.; Maysinger, D. Docosahexaenoic acid (DHA): A modulator of microglia activity and dendritic spine morphology. J. Neuroinflamm. 2015, 12, 34. [Google Scholar] [CrossRef]
- Coulombe, K.; Kerdiles, O.; Tremblay, C.; Emond, V.; Lebel, M.; Boulianne, A.S.; Plourde, M.; Cicchetti, F.; Calon, F. Impact of DHA intake in a mouse model of synucleinopathy. Exp. Neurol. 2018, 301, 39–49. [Google Scholar] [CrossRef]
- Chitre, N.M.; Wood, B.J.; Ray, A.; Moniri, N.H.; Murnane, K.S. Docosahexaenoic acid protects motor function and increases dopamine synthesis in a rat model of Parkinson’s disease via mechanisms associated with increased protein kinase activity in the striatum. Neuropharmacology 2020, 167, 107976. [Google Scholar] [CrossRef] [PubMed]
- Zardini Buzatto, A.; Tatlay, J.; Bajwa, B.; Mung, D.; Camicioli, R.; Dixon, R.A.; Li, L. Comprehensive Serum Lipidomics for Detecting Incipient Dementia in Parkinson’s Disease. J. Proteome Res. 2021, 20, 4053–4067. [Google Scholar] [CrossRef]
- Lopez de Frutos, L.; Almeida, F.; Murillo-Saich, J.; Conceicao, V.A.; Guma, M.; Queheberger, O.; Giraldo, P.; Miltenberger-Miltenyi, G. Serum Phospholipid Profile Changes in Gaucher Disease and Parkinson’s Disease. Int. J. Mol. Sci. 2022, 23, 10387. [Google Scholar] [CrossRef]
- Wood, P.L.; Tippireddy, S.; Feriante, J.; Woltjer, R.L. Augmented frontal cortex diacylglycerol levels in Parkinson’s disease and Lewy Body Disease. PLoS ONE 2018, 13, e0191815. [Google Scholar] [CrossRef]
- Cryan, J.F.; O’Riordan, K.J.; Sandhu, K.; Peterson, V.; Dinan, T.G. The gut microbiome in neurological disorders. Lancet Neurol. 2020, 19, 179–194. [Google Scholar] [CrossRef]
- Anis, E.; Xie, A.; Brundin, L.; Brundin, P. Digesting recent findings: Gut alpha-synuclein, microbiome changes in Parkinson’s disease. Trends Endocrinol. Metab. 2022, 33, 147–157. [Google Scholar] [CrossRef]
- Li, P.; Killinger, B.A.; Ensink, E.; Beddows, I.; Yilmaz, A.; Lubben, N.; Lamp, J.; Schilthuis, M.; Vega, I.E.; Woltjer, R.; et al. Gut Microbiota Dysbiosis Is Associated with Elevated Bile Acids in Parkinson’s Disease. Metabolites 2021, 11, 29. [Google Scholar] [CrossRef]
- Toh, T.S.; Chong, C.W.; Lim, S.Y.; Bowman, J.; Cirstea, M.; Lin, C.H.; Chen, C.C.; Appel-Cresswell, S.; Finlay, B.B.; Tan, A.H. Gut microbiome in Parkinson’s disease: New insights from meta-analysis. Park. Relat. Disord. 2022, 94, 1–9. [Google Scholar] [CrossRef]
- Hirayama, M.; Ohno, K. Parkinson’s Disease and Gut Microbiota. Ann. Nutr. Metab. 2021, 77 (Suppl. S2), 28–35. [Google Scholar] [CrossRef]
- Yang, X.; Ai, P.; He, X.; Mo, C.; Zhang, Y.; Xu, S.; Lai, Y.; Qian, Y.; Xiao, Q. Parkinson’s Disease Is Associated with Impaired Gut-Blood Barrier for Short-Chain Fatty Acids. Mov. Disord. 2022, 37, 1634–1643. [Google Scholar] [CrossRef]
- Okuzumi, A.; Hatano, T.; Ueno, S.I.; Ogawa, T.; Saiki, S.; Mori, A.; Koinuma, T.; Oji, Y.; Ishikawa, K.I.; Fujimaki, M.; et al. Metabolomics-based identification of metabolic alterations in PARK2. Ann. Clin. Transl. Neurol. 2019, 6, 525–536. [Google Scholar] [CrossRef]
- Zhao, H.; Wang, C.; Zhao, N.; Li, W.; Yang, Z.; Liu, X.; Le, W.; Zhang, X. Potential biomarkers of Parkinson’s disease revealed by plasma metabolic profiling. J. Chromatogr. B Analyt Technol. Biomed. Life Sci. 2018, 1081–1082, 101–108. [Google Scholar] [CrossRef]
- Poewe, W.; Seppi, K.; Tanner, C.M.; Halliday, G.M.; Brundin, P.; Volkmann, J.; Schrag, A.E.; Lang, A.E. Parkinson disease. Nat. Rev. Dis. Primers 2017, 3, 17013. [Google Scholar] [CrossRef]
- Gelb, D.J.; Oliver, E.; Gilman, S. Diagnostic criteria for Parkinson disease. Arch. Neurol. 1999, 56, 33–39. [Google Scholar] [CrossRef]
- Postuma, R.B.; Berg, D.; Stern, M.; Poewe, W.; Olanow, C.W.; Oertel, W.; Obeso, J.; Marek, K.; Litvan, I.; Lang, A.E.; et al. MDS clinical diagnostic criteria for Parkinson’s disease. Mov. Disord. 2015, 30, 1591–1601. [Google Scholar] [CrossRef]
- Postuma, R.B.; Poewe, W.; Litvan, I.; Lewis, S.; Lang, A.E.; Halliday, G.; Goetz, C.G.; Chan, P.; Slow, E.; Seppi, K.; et al. Validation of the MDS clinical diagnostic criteria for Parkinson’s disease. Mov. Disord. 2018, 33, 1601–1608. [Google Scholar] [CrossRef]
- Zhang, L.; Li, T.N.; Yuan, Y.S.; Jiang, S.M.; Tong, Q.; Wang, M.; Wang, J.W.; Chen, H.J.; Ding, J.; Xu, Q.R.; et al. The Neural Basis of Postural Instability Gait Disorder Subtype of Parkinson’s Disease: A PET and fMRI Study. CNS Neurosci. Ther. 2016, 22, 360–367. [Google Scholar] [CrossRef]
- Eggers, C.; Schwartz, F.; Pedrosa, D.J.; Kracht, L.; Timmermann, L. Parkinson’s disease subtypes show a specific link between dopaminergic and glucose metabolism in the striatum. PLoS ONE 2014, 9, e96629. [Google Scholar] [CrossRef]
- Holtbernd, F.; Eidelberg, D. Functional brain networks in movement disorders: Recent advances. Curr. Opin. Neurol. 2012, 25, 392–401. [Google Scholar] [CrossRef]
- Kish, S.J. Biochemistry of Parkinson’s disease: Is a brain serotonergic deficiency a characteristic of idiopathic Parkinson’s disease? Adv. Neurol. 2003, 91, 39–49. [Google Scholar]
- Pasquini, J.; Ceravolo, R.; Qamhawi, Z.; Lee, J.Y.; Deuschl, G.; Brooks, D.J.; Bonuccelli, U.; Pavese, N. Progression of tremor in early stages of Parkinson’s disease: A clinical and neuroimaging study. Brain 2018, 141, 811–821. [Google Scholar] [CrossRef]
- Cummings, K.A.; Popescu, G.K. Glycine-dependent activation of NMDA receptors. J. Gen. Physiol. 2015, 145, 513–527. [Google Scholar] [CrossRef]
- Zhang, F.; Liu, M.; Tuo, J.; Zhang, L.; Zhang, J.; Yu, C.; Xu, Z. Levodopa-induced dyskinesia: Interplay between the N-methyl-D-aspartic acid receptor and neuroinflammation. Front. Immunol. 2023, 14, 1253273. [Google Scholar] [CrossRef] [PubMed]
- Ahmed, I.; Bose, S.K.; Pavese, N.; Ramlackhansingh, A.; Turkheimer, F.; Hotton, G.; Hammers, A.; Brooks, D.J. Glutamate NMDA receptor dysregulation in Parkinson’s disease with dyskinesias. Brain 2011, 134, 979–986. [Google Scholar] [CrossRef]
- LeWitt, P.A.; Li, J.; Lu, M.; Guo, L.; Auinger, P.; Parkinson Study Group, D.I. Metabolomic biomarkers as strong correlates of Parkinson disease progression. Neurology 2017, 88, 862–869. [Google Scholar] [CrossRef]
- Zhang, M.; Chen, H.; Liu, G.; Wang, X.; Wang, Z.; Feng, T.; Zhang, Y. Lower serum triglyceride levels linked to more severe motor performance in Parkinson’s disease. Neurol. Sci. 2022, 43, 5343–5353. [Google Scholar] [CrossRef]
- Lejeune, F.-X.; Ichou, F.; Cemenen, E.; Colsch, B.; Mauger, F.; Peltier, C.; Moszer, I.; Gilson, E.; Pierre-Jea, M.; Le Floch, E.; et al. A Multimodal Omics Exploration of the Motor and Non-Motor Symptoms of Parkinson’s Disease. Int. J. Transl. Med. 2022, 2, 97–112. [Google Scholar] [CrossRef]
- Luca, M.; Chattipakorn, S.C.; Sriwichaiin, S.; Luca, A. Cognitive-Behavioural Correlates of Dysbiosis: A Review. Int. J. Mol. Sci. 2020, 21, 4834. [Google Scholar] [CrossRef]
- Kori, M.; Aydin, B.; Unal, S.; Arga, K.Y.; Kazan, D. Metabolic Biomarkers and Neurodegeneration: A Pathway Enrichment Analysis of Alzheimer’s Disease, Parkinson’s Disease, and Amyotrophic Lateral Sclerosis. OMICS 2016, 20, 645–661. [Google Scholar] [CrossRef]
- Manyam, B.V.; Giacobini, E.; Ferraro, T.N.; Hare, T.A. Cerebrospinal fluid as a reflector of central cholinergic and amino acid neurotransmitter activity in cerebellar ataxia. Arch. Neurol. 1990, 47, 1194–1199. [Google Scholar] [CrossRef]
- Zuo, L.J.; Piao, Y.S.; Li, L.X.; Yu, S.Y.; Guo, P.; Hu, Y.; Lian, T.H.; Wang, R.D.; Yu, Q.J.; Jin, Z.; et al. Phenotype of postural instability/gait difficulty in Parkinson disease: Relevance to cognitive impairment and mechanism relating pathological proteins and neurotransmitters. Sci. Rep. 2017, 7, 44872. [Google Scholar] [CrossRef]
- Muller, M.L.; Albin, R.L.; Kotagal, V.; Koeppe, R.A.; Scott, P.J.; Frey, K.A.; Bohnen, N.I. Thalamic cholinergic innervation and postural sensory integration function in Parkinson’s disease. Brain 2013, 136, 3282–3289. [Google Scholar] [CrossRef]
- Mancini, M.; Chung, K.; Zajack, A.; Martini, D.N.; Ramsey, K.; Lapidus, J.; Horak, F.B.; Nutt, J.G. Effects of augmenting cholinergic neurotransmission on balance in Parkinson’s disease. Park. Relat. Disord. 2019, 69, 40–47. [Google Scholar] [CrossRef]
- Gurevich, T.; Balash, Y.; Merims, D.; Peretz, C.; Herman, T.; Hausdorff, J.M.; Giladi, N. Effect of rivastigmine on mobility of patients with higher-level gait disorder: A pilot exploratory study. Drugs R D 2014, 14, 57–62. [Google Scholar] [CrossRef]
- Henderson, E.J.; Lord, S.R.; Brodie, M.A.; Gaunt, D.M.; Lawrence, A.D.; Close, J.C.; Whone, A.L.; Ben-Shlomo, Y. Rivastigmine for gait stability in patients with Parkinson’s disease (ReSPonD): A randomised, double-blind, placebo-controlled, phase 2 trial. Lancet Neurol. 2016, 15, 249–258. [Google Scholar] [CrossRef] [PubMed]
- Claus, I.; Muhle, P.; Suttrup, J.; Labeit, B.; Suntrup-Krueger, S.; Dziewas, R.; Warnecke, T. Predictors of Pharyngeal Dysphagia in Patients with Parkinson’s Disease. J. Park. Dis. 2020, 10, 1727–1735. [Google Scholar] [CrossRef]
- Wang, P.; Wang, B.; Chen, X.; Xiong, B.; Xie, F.; Wu, S.; Tang, Y.; Chen, S.; Ding, X.; Liu, P.; et al. Six-Year Follow-Up of Dysphagia in Patients with Parkinson’s Disease. Dysphagia 2022, 37, 1271–1278. [Google Scholar] [CrossRef]
- Kobylecki, C.; Shiderova, I.; Boca, M.; Michou, E. Falls risk is predictive of dysphagia in Parkinson’s disease. Neurol. Sci. 2022, 43, 1415–1417. [Google Scholar] [CrossRef]
- Terada, S.; Matsumoto, H.; Nishi, K.; Kogo, M.; Nomura, N.; Tashima, N.; Morimoto, C.; Sunadome, H.; Nagasaki, T.; Oguma, T.; et al. Association of lower plasma citric acid with prolonged cough: The Nagahama study. Sci. Rep. 2023, 13, 13921. [Google Scholar] [CrossRef]
- Homem, S.G.; Moreira, E.A.M.; da Silva, A.F.; Barni, G.C.; da Rosa, J.S.; Oliveira, D.L.; Tomio, C.; de Freitas, M.B.; Portari, G.V.; Furkim, A.M.; et al. Relationship between oropharyngeal dysphagia, nutritional status, antioxidant vitamins and the inflammatory response in adults and elderly: A cross-sectional study. Clin. Nutr. ESPEN 2020, 38, 211–217. [Google Scholar] [CrossRef]
- Gossard, T.R.; Trotti, L.M.; Videnovic, A.; St Louis, E.K. Restless Legs Syndrome: Contemporary Diagnosis and Treatment. Neurotherapeutics 2021, 18, 140–155. [Google Scholar] [CrossRef]
- Piao, Y.S.; Lian, T.H.; Hu, Y.; Zuo, L.J.; Guo, P.; Yu, S.Y.; Liu, L.; Jin, Z.; Zhao, H.; Li, L.X.; et al. Restless legs syndrome in Parkinson disease: Clinical characteristics, abnormal iron metabolism and altered neurotransmitters. Sci. Rep. 2017, 7, 10547. [Google Scholar] [CrossRef]
- Marano, M.; Pozzilli, V.; Magliozzi, A.; Tabacco, G.; Naciu, A.M.; Palermo, A.; Di Lazzaro, V. Leg restlessness and hyperparathyroidism in Parkinson’s disease, a further clue to RLS pathogenesis? Front. Neurol. 2023, 14, 1113913. [Google Scholar] [CrossRef]
- Riek, H.C.; Brien, D.C.; Coe, B.C.; Huang, J.; Perkins, J.E.; Yep, R.; McLaughlin, P.M.; Orange, J.B.; Peltsch, A.J.; Roberts, A.C.; et al. Cognitive correlates of antisaccade behaviour across multiple neurodegenerative diseases. Brain Commun. 2023, 5, fcad049. [Google Scholar] [CrossRef]
- Waldthaler, J.; Stock, L.; Student, J.; Sommerkorn, J.; Dowiasch, S.; Timmermann, L. Antisaccades in Parkinson’s Disease: A Meta-Analysis. Neuropsychol. Rev. 2021, 31, 628–642. [Google Scholar] [CrossRef]
- Liu, J.; Chen, Q.; Su, R. Interplay of human gastrointestinal microbiota metabolites: Short-chain fatty acids and their correlation with Parkinson’s disease. Medicine 2024, 103, e37960. [Google Scholar] [CrossRef]
- Cryan, J.F.; O’Riordan, K.J.; Cowan, C.S.M.; Sandhu, K.V.; Bastiaanssen, T.F.S.; Boehme, M.; Codagnone, M.G.; Cussotto, S.; Fulling, C.; Golubeva, A.V.; et al. The Microbiota-Gut-Brain Axis. Physiol. Rev. 2019, 99, 1877–2013. [Google Scholar] [CrossRef]
- O’Riordan, K.J.; Collins, M.K.; Moloney, G.M.; Knox, E.G.; Aburto, M.R.; Fulling, C.; Morley, S.J.; Clarke, G.; Schellekens, H.; Cryan, J.F. Short chain fatty acids: Microbial metabolites for gut-brain axis signalling. Mol. Cell Endocrinol. 2022, 546, 111572. [Google Scholar] [CrossRef]
- Romano, S.; Savva, G.M.; Bedarf, J.R.; Charles, I.G.; Hildebrand, F.; Narbad, A. Meta-analysis of the Parkinson’s disease gut microbiome suggests alterations linked to intestinal inflammation. NPJ Park. Dis. 2021, 7, 27. [Google Scholar] [CrossRef]
- Huang, B.; Chau, S.W.H.; Liu, Y.; Chan, J.W.Y.; Wang, J.; Ma, S.L.; Zhang, J.; Chan, P.K.S.; Yeoh, Y.K.; Chen, Z.; et al. Gut microbiome dysbiosis across early Parkinson’s disease, REM sleep behavior disorder and their first-degree relatives. Nat. Commun. 2023, 14, 2501. [Google Scholar] [CrossRef]
- Aarsland, D.; Pahlhagen, S.; Ballard, C.G.; Ehrt, U.; Svenningsson, P. Depression in Parkinson disease—Epidemiology, mechanisms and management. Nat. Rev. Neurol. 2011, 8, 35–47. [Google Scholar] [CrossRef]
- Marsh, L. Depression and Parkinson’s disease: Current knowledge. Curr. Neurol. Neurosci. Rep. 2013, 13, 409. [Google Scholar] [CrossRef]
- Chikatimalla, R.; Dasaradhan, T.; Koneti, J.; Cherukuri, S.P.; Kalluru, R.; Gadde, S. Depression in Parkinson’s Disease: A Narrative Review. Cureus 2022, 14, e27750. [Google Scholar] [CrossRef] [PubMed]
- Nilsson, F.M.; Kessing, L.V.; Bolwig, T.G. Increased risk of developing Parkinson’s disease for patients with major affective disorder: A register study. Acta Psychiatr. Scand. 2001, 104, 380–386. [Google Scholar] [CrossRef]
- Mayeux, R.; Stern, Y.; Cote, L.; Williams, J.B. Altered serotonin metabolism in depressed patients with parkinson’s disease. Neurology 1984, 34, 642–646. [Google Scholar] [CrossRef]
- Trullas, R.; Skolnick, P. Functional antagonists at the NMDA receptor complex exhibit antidepressant actions. Eur. J. Pharmacol. 1990, 185, 1–10. [Google Scholar] [CrossRef]
- Mally, J.; Szalai, G.; Stone, T.W. Changes in the concentration of amino acids in serum and cerebrospinal fluid of patients with Parkinson’s disease. J. Neurol. Sci. 1997, 151, 159–162. [Google Scholar] [CrossRef]
- Jimenez-Jimenez, F.J.; Alonso-Navarro, H.; Garcia-Martin, E.; Agundez, J.A.G. Cerebrospinal and blood levels of amino acids as potential biomarkers for Parkinson’s disease: Review and meta-analysis. Eur. J. Neurol. 2020, 27, 2336–2347. [Google Scholar] [CrossRef]
- Mitani, H.; Shirayama, Y.; Yamada, T.; Maeda, K.; Ashby, C.R., Jr.; Kawahara, R. Correlation between plasma levels of glutamate, alanine and serine with severity of depression. Prog. Neuropsychopharmacol. Biol. Psychiatry 2006, 30, 1155–1158. [Google Scholar] [CrossRef]
- Tong, Q.; Xu, Q.; Xia, Q.; Yuan, Y.; Zhang, L.; Sun, H.; Shan, H.; Zhang, K. Correlations between plasma levels of amino acids and nonmotor symptoms in Parkinson’s disease. J. Neural Transm. 2015, 122, 411–417. [Google Scholar] [CrossRef]
- Barone, P.; Antonini, A.; Colosimo, C.; Marconi, R.; Morgante, L.; Avarello, T.P.; Bottacchi, E.; Cannas, A.; Ceravolo, G.; Ceravolo, R.; et al. The PRIAMO study: A multicenter assessment of nonmotor symptoms and their impact on quality of life in Parkinson’s disease. Mov. Disord. 2009, 24, 1641–1649. [Google Scholar] [CrossRef] [PubMed]
- Videnovic, A.; Noble, C.; Reid, K.J.; Peng, J.; Turek, F.W.; Marconi, A.; Rademaker, A.W.; Simuni, T.; Zadikoff, C.; Zee, P.C. Circadian melatonin rhythm and excessive daytime sleepiness in Parkinson disease. JAMA Neurol. 2014, 71, 463–469. [Google Scholar] [CrossRef]
- Guan, D.; Lazar, M.A. Interconnections between circadian clocks and metabolism. J. Clin. Investig. 2021, 131, 463–469. [Google Scholar] [CrossRef]
- Kasukawa, T.; Sugimoto, M.; Hida, A.; Minami, Y.; Mori, M.; Honma, S.; Honma, K.; Mishima, K.; Soga, T.; Ueda, H.R. Human blood metabolite timetable indicates internal body time. Proc. Natl. Acad. Sci. USA 2012, 109, 15036–15041. [Google Scholar] [CrossRef]
- Asher, G.; Gatfield, D.; Stratmann, M.; Reinke, H.; Dibner, C.; Kreppel, F.; Mostoslavsky, R.; Alt, F.W.; Schibler, U. SIRT1 regulates circadian clock gene expression through PER2 deacetylation. Cell 2008, 134, 317–328. [Google Scholar] [CrossRef]
- Brand, M.D.; Orr, A.L.; Perevoshchikova, I.V.; Quinlan, C.L. The role of mitochondrial function and cellular bioenergetics in ageing and disease. Br. J. Dermatol. 2013, 169 (Suppl. S2), 1–8. [Google Scholar] [CrossRef]
- Lebkuchen, A.; Carvalho, V.M.; Venturini, G.; Salgueiro, J.S.; Freitas, L.S.; Dellavance, A.; Martins, F.C.; Lorenzi-Filho, G.; Cardozo, K.H.M.; Drager, L.F. Metabolomic and lipidomic profile in men with obstructive sleep apnoea: Implications for diagnosis and biomarkers of cardiovascular risk. Sci. Rep. 2018, 8, 11270. [Google Scholar] [CrossRef]
- Wu, P.; Wang, W.; Huang, C.; Sun, L.; Wu, X.; Xu, L.; Xiao, P. A rapid and reliable targeted LC-MS/MS method for quantitative analysis of the Tryptophan-NAD metabolic network disturbances in tissues and blood of sleep deprivation mice. Anal. Chim. Acta 2024, 1328, 343125. [Google Scholar] [CrossRef]
- Parekh, P.K.; Ozburn, A.R.; McClung, C.A. Circadian clock genes: Effects on dopamine, reward and addiction. Alcohol 2015, 49, 341–349. [Google Scholar] [CrossRef]
- Rathor, P.; Ch, R. Metabolic Basis of Circadian Dysfunction in Parkinson’s Disease. Biology 2023, 12, 1294. [Google Scholar] [CrossRef]
- Cicero, C.E.; Terravecchia, C.; Tabbi, S.; Garofalo, R.; Luca, A.; Mostile, G.; Donzuso, G.; Contrafatto, D.; Zappia, M.; Nicoletti, A. Exploring the relation between REM sleep behavior disorder onset and striatal dopaminergic dysfunction in Parkinson’s Disease. J. Neurol. 2024, 272, 75. [Google Scholar] [CrossRef] [PubMed]
- Kuhn, D.M.; Arthur, R.E., Jr. L-DOPA-quinone inactivates tryptophan hydroxylase and converts the enzyme to a redox-cycling quinoprotein. Brain Res. Mol. Brain Res. 1999, 73, 78–84. [Google Scholar] [CrossRef]
- Navailles, S.; Bioulac, B.; Gross, C.; De Deurwaerdere, P. Serotonergic neurons mediate ectopic release of dopamine induced by L-DOPA in a rat model of Parkinson’s disease. Neurobiol. Dis. 2010, 38, 136–143. [Google Scholar] [CrossRef]
- Yamashita, M. Potential Role of Neuroactive Tryptophan Metabolites in Central Fatigue: Establishment of the Fatigue Circuit. Int. J. Tryptophan Res. 2020, 13, 1178646920936279. [Google Scholar] [CrossRef]
- Aarsland, D.; Zaccai, J.; Brayne, C. A systematic review of prevalence studies of dementia in Parkinson’s disease. Mov. Disord. 2005, 20, 1255–1263. [Google Scholar] [CrossRef]
- Aarsland, D.; Bronnick, K.; Larsen, J.P.; Tysnes, O.B.; Alves, G.; Norwegian ParkWest Study, G. Cognitive impairment in incident, untreated Parkinson disease: The Norwegian ParkWest study. Neurology 2009, 72, 1121–1126. [Google Scholar] [CrossRef]
- Aarsland, D.; Creese, B.; Politis, M.; Chaudhuri, K.R.; Ffytche, D.H.; Weintraub, D.; Ballard, C. Cognitive decline in Parkinson disease. Nat. Rev. Neurol. 2017, 13, 217–231. [Google Scholar] [CrossRef]
- Aarsland, D.; Batzu, L.; Halliday, G.M.; Geurtsen, G.J.; Ballard, C.; Ray Chaudhuri, K.; Weintraub, D. Parkinson disease-associated cognitive impairment. Nat. Rev. Dis. Primers 2021, 7, 47. [Google Scholar] [CrossRef]
- Hely, M.A.; Reid, W.G.; Adena, M.A.; Halliday, G.M.; Morris, J.G. The Sydney multicenter study of Parkinson’s disease: The inevitability of dementia at 20 years. Mov. Disord. 2008, 23, 837–844. [Google Scholar] [CrossRef]
- Vander Borght, T.; Minoshima, S.; Giordani, B.; Foster, N.L.; Frey, K.A.; Berent, S.; Albin, R.L.; Koeppe, R.A.; Kuhl, D.E. Cerebral metabolic differences in Parkinson’s and Alzheimer’s diseases matched for dementia severity. J. Nucl. Med. 1997, 38, 797–802. [Google Scholar]
- Yong, S.W.; Yoon, J.K.; An, Y.S.; Lee, P.H. A comparison of cerebral glucose metabolism in Parkinson’s disease, Parkinson’s disease dementia and dementia with Lewy bodies. Eur. J. Neurol. 2007, 14, 1357–1362. [Google Scholar] [CrossRef] [PubMed]
- Alza, N.P.; Iglesias Gonzalez, P.A.; Conde, M.A.; Uranga, R.M.; Salvador, G.A. Lipids at the Crossroad of alpha-Synuclein Function and Dysfunction: Biological and Pathological Implications. Front. Cell Neurosci. 2019, 13, 175. [Google Scholar] [CrossRef]
- Dikiy, I.; Eliezer, D. Folding and misfolding of alpha-synuclein on membranes. Biochim. Biophys. Acta 2012, 1818, 1013–1018. [Google Scholar] [CrossRef]
- Burre, J.; Sharma, M.; Sudhof, T.C. Cell Biology and Pathophysiology of alpha-Synuclein. Cold Spring Harb. Perspect. Med. 2018, 8, a024091. [Google Scholar] [CrossRef]
- O’Leary, E.I.; Lee, J.C. Interplay between alpha-synuclein amyloid formation and membrane structure. Biochim. Biophys. Acta Proteins Proteom. 2019, 1867, 483–491. [Google Scholar] [CrossRef]
- Seshadri, S.; Beiser, A.; Selhub, J.; Jacques, P.F.; Rosenberg, I.H.; D’Agostino, R.B.; Wilson, P.W.; Wolf, P.A. Plasma homocysteine as a risk factor for dementia and Alzheimer’s disease. N. Engl. J. Med. 2002, 346, 476–483. [Google Scholar] [CrossRef]
- Ostrakhovitch, E.A.; Tabibzadeh, S. Homocysteine and age-associated disorders. Ageing Res. Rev. 2019, 49, 144–164. [Google Scholar] [CrossRef]
- O’Suilleabhain, P.E.; Sung, V.; Hernandez, C.; Lacritz, L.; Dewey, R.B., Jr.; Bottiglieri, T.; Diaz-Arrastia, R. Elevated plasma homocysteine level in patients with Parkinson disease: Motor, affective, and cognitive associations. Arch. Neurol. 2004, 61, 865–868. [Google Scholar] [CrossRef]
- Zhang, Z.; Li, S.; Wang, S. Application of Periventricular White Matter Hyperintensities Combined with Homocysteine into Predicting Mild Cognitive Impairment in Parkinson’s Disease. Int. J. Gen. Med. 2023, 16, 785–792. [Google Scholar] [CrossRef]
- Zoccolella, S.; dell’Aquila, C.; Abruzzese, G.; Antonini, A.; Bonuccelli, U.; Canesi, M.; Cristina, S.; Marchese, R.; Pacchetti, C.; Zagaglia, R.; et al. Hyperhomocysteinemia in levodopa-treated patients with Parkinson’s disease dementia. Mov. Disord. 2009, 24, 1028–1033. [Google Scholar] [CrossRef]
- Song, I.U.; Kim, J.S.; Park, I.S.; Kim, Y.D.; Cho, H.J.; Chung, S.W.; Lee, K.S. Clinical significance of homocysteine (hcy) on dementia in Parkinson’s disease (PD). Arch. Gerontol. Geriatr. 2013, 57, 288–291. [Google Scholar] [CrossRef] [PubMed]
- Xie, Y.; Feng, H.; Peng, S.; Xiao, J.; Zhang, J. Association of plasma homocysteine, vitamin B12 and folate levels with cognitive function in Parkinson’s disease: A meta-analysis. Neurosci. Lett. 2017, 636, 190–195. [Google Scholar] [CrossRef]
- Perinan, M.T.; Macias-Garcia, D.; Jesus, S.; Martin-Rodriguez, J.F.; Munoz-Delgado, L.; Jimenez-Jaraba, M.V.; Buiza-Rueda, D.; Bonilla-Toribio, M.; Adarmes-Gomez, A.D.; Gomez-Garre, P.; et al. Homocysteine levels, genetic background, and cognitive impairment in Parkinson’s disease. J. Neurol. 2023, 270, 477–485. [Google Scholar] [CrossRef]
- Isobe, C.; Murata, T.; Sato, C.; Terayama, Y. Increase of total homocysteine concentration in cerebrospinal fluid in patients with Alzheimer’s disease and Parkinson’s disease. Life Sci. 2005, 77, 1836–1843. [Google Scholar] [CrossRef]
- Kawahata, I.; Fukunaga, K. Degradation of Tyrosine Hydroxylase by the Ubiquitin-Proteasome System in the Pathogenesis of Parkinson’s Disease and Dopa-Responsive Dystonia. Int. J. Mol. Sci. 2020, 21, 3779. [Google Scholar] [CrossRef]
- Nagatsu, T.; Nakashima, A.; Ichinose, H.; Kobayashi, K. Human tyrosine hydroxylase in Parkinson’s disease and in related disorders. J. Neural Transm. 2019, 126, 397–409. [Google Scholar] [CrossRef]
- Javed, H.; Meeran, M.F.N.; Azimullah, S.; Bader Eddin, L.; Dwivedi, V.D.; Jha, N.K.; Ojha, S. alpha-Bisabolol, a Dietary Bioactive Phytochemical Attenuates Dopaminergic Neurodegeneration through Modulation of Oxidative Stress, Neuroinflammation and Apoptosis in Rotenone-Induced Rat Model of Parkinson’s disease. Biomolecules 2020, 10, 1421. [Google Scholar] [CrossRef]
- Wyse, A.T.S.; Bobermin, L.D.; Dos Santos, T.M.; Quincozes-Santos, A. Homocysteine and Gliotoxicity. Neurotox. Res. 2021, 39, 966–974. [Google Scholar] [CrossRef]
- Dos Santos, T.M.; Ramires Junior, O.V.; Alves, V.S.; Coutinho-Silva, R.; Savio, L.E.B.; Wyse, A.T.S. Hyperhomocysteinemia alters cytokine gene expression, cytochrome c oxidase activity and oxidative stress in striatum and cerebellum of rodents. Life Sci. 2021, 277, 119386. [Google Scholar] [CrossRef]
- Isobe, C.; Abe, T.; Terayama, Y. L-Dopa therapy increases homocysteine concentration in cerebrospinal fluid from patients with Parkinson’s disease. J. Clin. Neurosci. 2010, 17, 717–721. [Google Scholar] [CrossRef]
- Licking, N.; Murchison, C.; Cholerton, B.; Zabetian, C.P.; Hu, S.C.; Montine, T.J.; Peterson-Hiller, A.L.; Chung, K.A.; Edwards, K.; Leverenz, J.B.; et al. Homocysteine and cognitive function in Parkinson’s disease. Park. Relat. Disord. 2017, 44, 1–5. [Google Scholar] [CrossRef]
- Christine, C.W.; Auinger, P.; Forti, E.A.R.; Tat, L.; Cannizzaro, N.; Mustafa, A.; Iyer, J.M.; Oakes, D.; Green, R. Relationships of B12 and Homocysteine with Outcomes in the SURE-PD, SURE-PD3, and STEADY-PDIII Trials. J. Park. Dis. 2024, 14, 1243–1255. [Google Scholar] [CrossRef]
- Rundek, T.; Roy, S.; Hornig, M.; Cheung, Y.K.; Gardener, H.; DeRosa, J.; Levin, B.; Wright, C.B.; Del Brutto, V.J.; Elkind, M.S.; et al. Gut permeability and cognitive decline: A pilot investigation in the Northern Manhattan Study. Brain Behav. Immun. Health 2021, 12, 100214. [Google Scholar] [CrossRef]
- Nie, K.; Li, Y.; Zhang, J.; Gao, Y.; Qiu, Y.; Gan, R.; Zhang, Y.; Wang, L. Distinct Bile Acid Signature in Parkinson’s Disease With Mild Cognitive Impairment. Front. Neurol. 2022, 13, 897867. [Google Scholar] [CrossRef]
- Hipkiss, A.R. On the Relationship between Energy Metabolism, Proteostasis, Aging and Parkinson’s Disease: Possible Causative Role of Methylglyoxal and Alleviative Potential of Carnosine. Aging Dis. 2017, 8, 334–345. [Google Scholar] [CrossRef]
- Luth, H.J.; Ogunlade, V.; Kuhla, B.; Kientsch-Engel, R.; Stahl, P.; Webster, J.; Arendt, T.; Munch, G. Age- and stage-dependent accumulation of advanced glycation end products in intracellular deposits in normal and Alzheimer’s disease brains. Cereb. Cortex 2005, 15, 211–220. [Google Scholar] [CrossRef]
- Munch, G.; Westcott, B.; Menini, T.; Gugliucci, A. Advanced glycation endproducts and their pathogenic roles in neurological disorders. Amino Acids 2012, 42, 1221–1236. [Google Scholar] [CrossRef]
- Vicente Miranda, H.; El-Agnaf, O.M.; Outeiro, T.F. Glycation in Parkinson’s disease and Alzheimer’s disease. Mov. Disord. 2016, 31, 782–790. [Google Scholar] [CrossRef]
- Vicente Miranda, H.; Szego, E.M.; Oliveira, L.M.A.; Breda, C.; Darendelioglu, E.; de Oliveira, R.M.; Ferreira, D.G.; Gomes, M.A.; Rott, R.; Oliveira, M.; et al. Glycation potentiates alpha-synuclein-associated neurodegeneration in synucleinopathies. Brain 2017, 140, 1399–1419. [Google Scholar] [CrossRef]
- Chen, J.; Mooldijk, S.S.; Licher, S.; Waqas, K.; Ikram, M.K.; Uitterlinden, A.G.; Zillikens, M.C.; Ikram, M.A. Assessment of Advanced Glycation End Products and Receptors and the Risk of Dementia. JAMA Netw. Open 2021, 4, e2033012. [Google Scholar] [CrossRef]
- Brakedal, B.; Dolle, C.; Riemer, F.; Ma, Y.; Nido, G.S.; Skeie, G.O.; Craven, A.R.; Schwarzlmuller, T.; Brekke, N.; Diab, J.; et al. The NADPARK study: A randomized phase I trial of nicotinamide riboside supplementation in Parkinson’s disease. Cell Metab. 2022, 34, 396–407.e6. [Google Scholar] [CrossRef]
- Ntetsika, T.; Papathoma, P.E.; Markaki, I. Novel targeted therapies for Parkinson’s disease. Mol. Med. 2021, 27, 17. [Google Scholar] [CrossRef]
- Vickneson, K.; George, J. Xanthine Oxidoreductase Inhibitors. Handb. Exp. Pharmacol. 2021, 264, 205–228. [Google Scholar]
- Tidman, M.M.; White, D.R.; White, T.A. Impact of a keto diet on symptoms of Parkinson’s disease, biomarkers, depression, anxiety and quality of life: A longitudinal study. Neurodegener. Dis. Manag. 2024, 14, 97–110. [Google Scholar] [CrossRef]


| Metabolite | PD Patients/Controls N | PD vs. Healthy Controls (Fold Change) | Biofluid | Method | References | Hoehn and Yahr (H-Y) Scale |
|---|---|---|---|---|---|---|
| Lactate | n = 101/n = 60 | Increased (1.11) | CSF | [53] | 2 | |
| Lactate | n=101/n=60 | Increased (1.3) | CSF | [53] | 3 | |
| Lactate | n = 20/n = 58 | Increased (1.2) | CSF | NMR | [54] | 1–4 |
| Lactate | n = 10 | Decreased (0.8) | CSF | NMR | [55] | 2 |
| Lactate | n = 65/n = 26 | No change | CSF | HPLC | [56] | |
| Lactate | n = 151/n = 177 | Increased (1.25) | plasma | UPLC-MS; LC-MS | [57] | |
| Lactate | n = 20/n = 20 | Increased (1.1) | plasma | GC-MS | [58] | 2 |
| Lactate | n = 17/n = 22 | Increased (2.25) | serum | NMR | [59] | 2 |
| Lactate/N-acetylaspartate | n = 14/n = 13 | Increased (2.2) | The occipital lobe spectra | NMR | [51] | |
| Glucose | n = 20/n-58 | No change | CSF | NMR | [54] | 2 |
| Glucose | n = 10 | Decreased (0.8) | CSF | NMR | [55] | 2 |
| Glucose | n = 48/57 | Decreased (0.6) | CSF | UHPLC-MS | [60] | |
| Glucose | n = 17/n = 22 | Increased (2.6) | serum | NMR | [59] | |
| Glucose | n = 20/n = 20 | Increased (1.1) | plasma | GC-MS | [58] | 2 |
| Pyruvate | n = 65/n = 26 | No changes | CSF | HPLC | [56] | |
| Pyruvate | n = 20/n = 58 | Decreased (0.8) | CSF | [54] | ||
| Pyruvate | n = 151/n = 177 | Increased (1.7) | plasma | UPLC-MS; LC-MS | [57] | |
| Pyruvate | n = 14/n = 65 | No change | urine | GC-MS, LC-MS | [61] | 1 |
| Pyruvate | n = 59/n = 65 | Increased (1.95) | urine | UPLC-MS; LC-MS | [61] | 2–2.5 |
| Pyruvate | n = 19/n = 65 | Increased (1.6) | urine | GC-MS, LC-MS | [61] | 3–4 |
| Citrate | n = 17/n = 22 | Increased (2.95) | serum | NMR | [59] | |
| Succinate | n = 34/n = 31 | Increased (1.4) | plasma | NMR&MS | [62] | |
| Succinate | n = 50/n = 501 | Decreased (0.9) | CSF | UHPLC-MS | [63] | |
| Succinate | n = 14/n = 65 | Increased (1.36) | urine | GC-MS, LC-MS | [61] | 1 |
| Succinate | n = 59/n = 65 | Increased (3.04) | urine | GC-MS; LC-MS | [61] | 2–2.5 |
| Succinate | n = 19/n = 65 | Increased (2.1) | urine | GC-MS, LC-MS | [61] | 3–4 |
| Formic acid | n = 34/n = 31 | Decreased (0.83) | plasma | NMR&MS | [62] | |
| Fructose | n = 44/n = 35 | Increased (1.6) | CSF | GC-MS | [64] | DeNoPa cohort |
| Propionic acid | n = 20/n = 58 | Decreased (0.25) | CSF | NMR | [54] | |
| Mannose | n = 44/n = 35 | Increased (1.25) | CSF | GC-MS | [64] | DeNoPa cohort |
| Mannose | n = 10 | Decreased (0.79) | CSF | NMR | [55] | 2 |
| Mannitol | n = 22/n = 28 | Increased (1.32) | CSF | GC-MS, LC-MS | [65] | |
| Sorbitol | n = 22/n = 28 | Increased (1.42) | CSF | GC-MS, LC-MS | [65] | |
| galactitol | n = 22/n = 28 | Increased (1.26) | CSF | GC-MS, LC-MS | [65] | |
| Glycerol-3-phosphate | n = 22/n = 28 | Increased (1.36) | CSF | GC-MS, LC-MS | [65] | |
| Complex I | n = 20/n = 17 | Decreased (0.35) | Leukocytes | [66] | ||
| Complex IV | n = 20/n = 17 | Decreased (0.4) | Leukocytes | [66] | ||
| Itaconate | n = 282/n = 185 | Decreased (0.79) | serum | LC-HRMS | [67] | |
| Cysteine-S-Sulfate | n = 282/n = 185 | Increased (1.56) | serum | LC-HRMS | [67] | |
| Cysteine-S-Sulfate | n = 28/n = 45 | Increased (1.5) | serum | LC-MS | [68] | 1–3 |
| Cysteine-S-Sulfate | n = 8/n = 45 | Increased (2) | serum | LC-MS | [68] | 4 |
| Metabolite | PD Patients/ Controls N | PD vs. Healthy Controls (Fold Change) | Biofluid | Method | Reference | Hoehn and Yahr (H-Y) Scale |
|---|---|---|---|---|---|---|
| Tryptophan | n = 20/n = 20 | Decreased (0.83) | CSF | GC-MS | [58] | |
| Tryptophan | n = 18/n = 7 | Decreased (0.89) | Serum | UPLC-MS | [120] | 2.9 |
| Tryptophan betain | n = 18/n = 7 | Decreased (0.4) | Serum | UPLC-MS | [120] | 2.9 |
| Serotonin (5-HT) | n = 82/n = 64 | Decreased (0.62) | Plasma | HPLC-ECD | [127] | 1.82 |
| Hydroxyindoleacetic | n = 82/n = 64 | Decreased (0.52) | Plasma | HPLC-ECD | [127] | 1.82 |
| Kynurenine | n = 14/n = 65 | Increased (1.92) | urine | GC-MS, LC-MS | [61] | 1 |
| Kynurenine | n = 59/n = 65 | Increased (3.91) | urine | GC-MS; LC-MS | [61] | 2–2.5 |
| Kynurenine | n = 19/n = 65 | Increased (5.71) | urine | GC-MS, LC-MS | [61] | 3–4 |
Disclaimer/Publisher’s Note: The statements, opinions and data contained in all publications are solely those of the individual author(s) and contributor(s) and not of MDPI and/or the editor(s). MDPI and/or the editor(s) disclaim responsibility for any injury to people or property resulting from any ideas, methods, instructions or products referred to in the content. |
© 2025 by the authors. Licensee MDPI, Basel, Switzerland. This article is an open access article distributed under the terms and conditions of the Creative Commons Attribution (CC BY) license (https://creativecommons.org/licenses/by/4.0/).
Share and Cite
Ostrakhovitch, E.A.; Ono, K.; Yamasaki, T.R. Metabolomics in Parkinson’s Disease and Correlation with Disease State. Metabolites 2025, 15, 208. https://doi.org/10.3390/metabo15030208
Ostrakhovitch EA, Ono K, Yamasaki TR. Metabolomics in Parkinson’s Disease and Correlation with Disease State. Metabolites. 2025; 15(3):208. https://doi.org/10.3390/metabo15030208
Chicago/Turabian StyleOstrakhovitch, Elena A., Kenjiro Ono, and Tritia R. Yamasaki. 2025. "Metabolomics in Parkinson’s Disease and Correlation with Disease State" Metabolites 15, no. 3: 208. https://doi.org/10.3390/metabo15030208
APA StyleOstrakhovitch, E. A., Ono, K., & Yamasaki, T. R. (2025). Metabolomics in Parkinson’s Disease and Correlation with Disease State. Metabolites, 15(3), 208. https://doi.org/10.3390/metabo15030208