
A Study of Volatile Organic Compounds in Patients with Obstructive Sleep Apnea

 , ,
, ,
Abstract
:1. Introduction
2. Method
2.1. Study Population
2.2. PTR-TOF-MS Measurement and Analysis
3. Results
3.1. Study Characteristics
3.2. OSA vs. Control Analysis
3.2.1. Significance Analysis
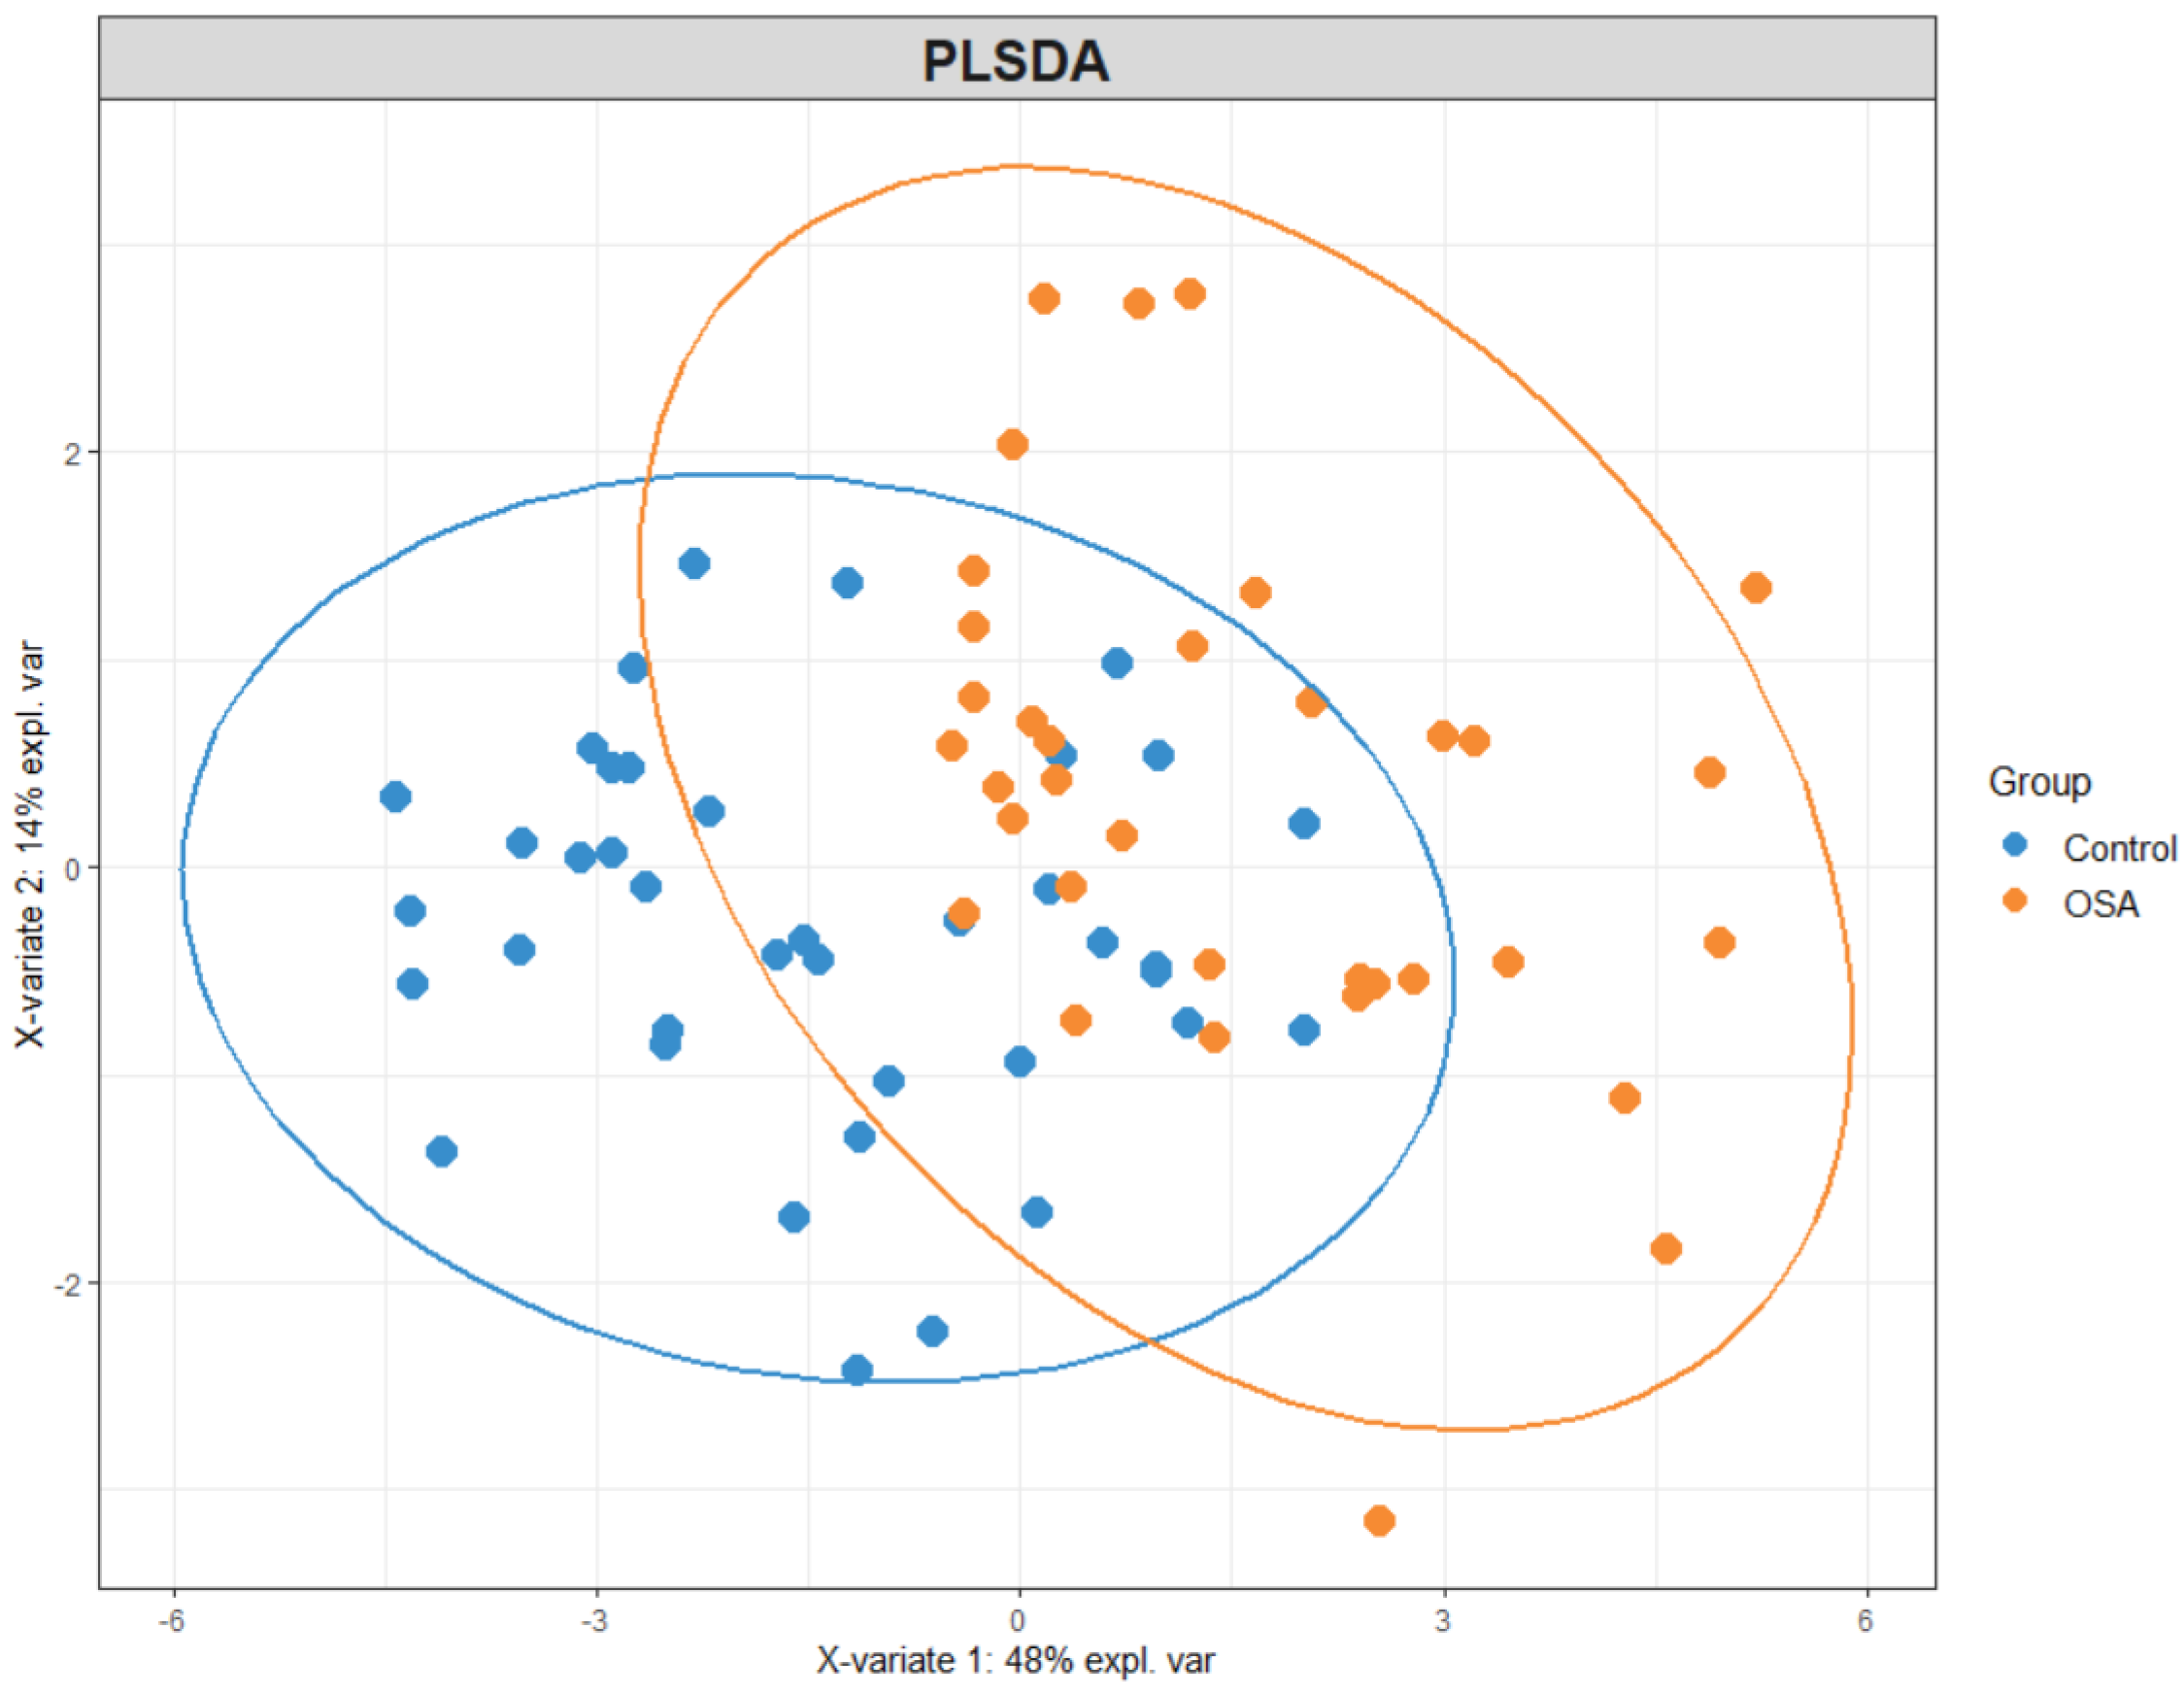
3.2.2. Partial Least Squares Discriminant Analysis (PLS-DA)
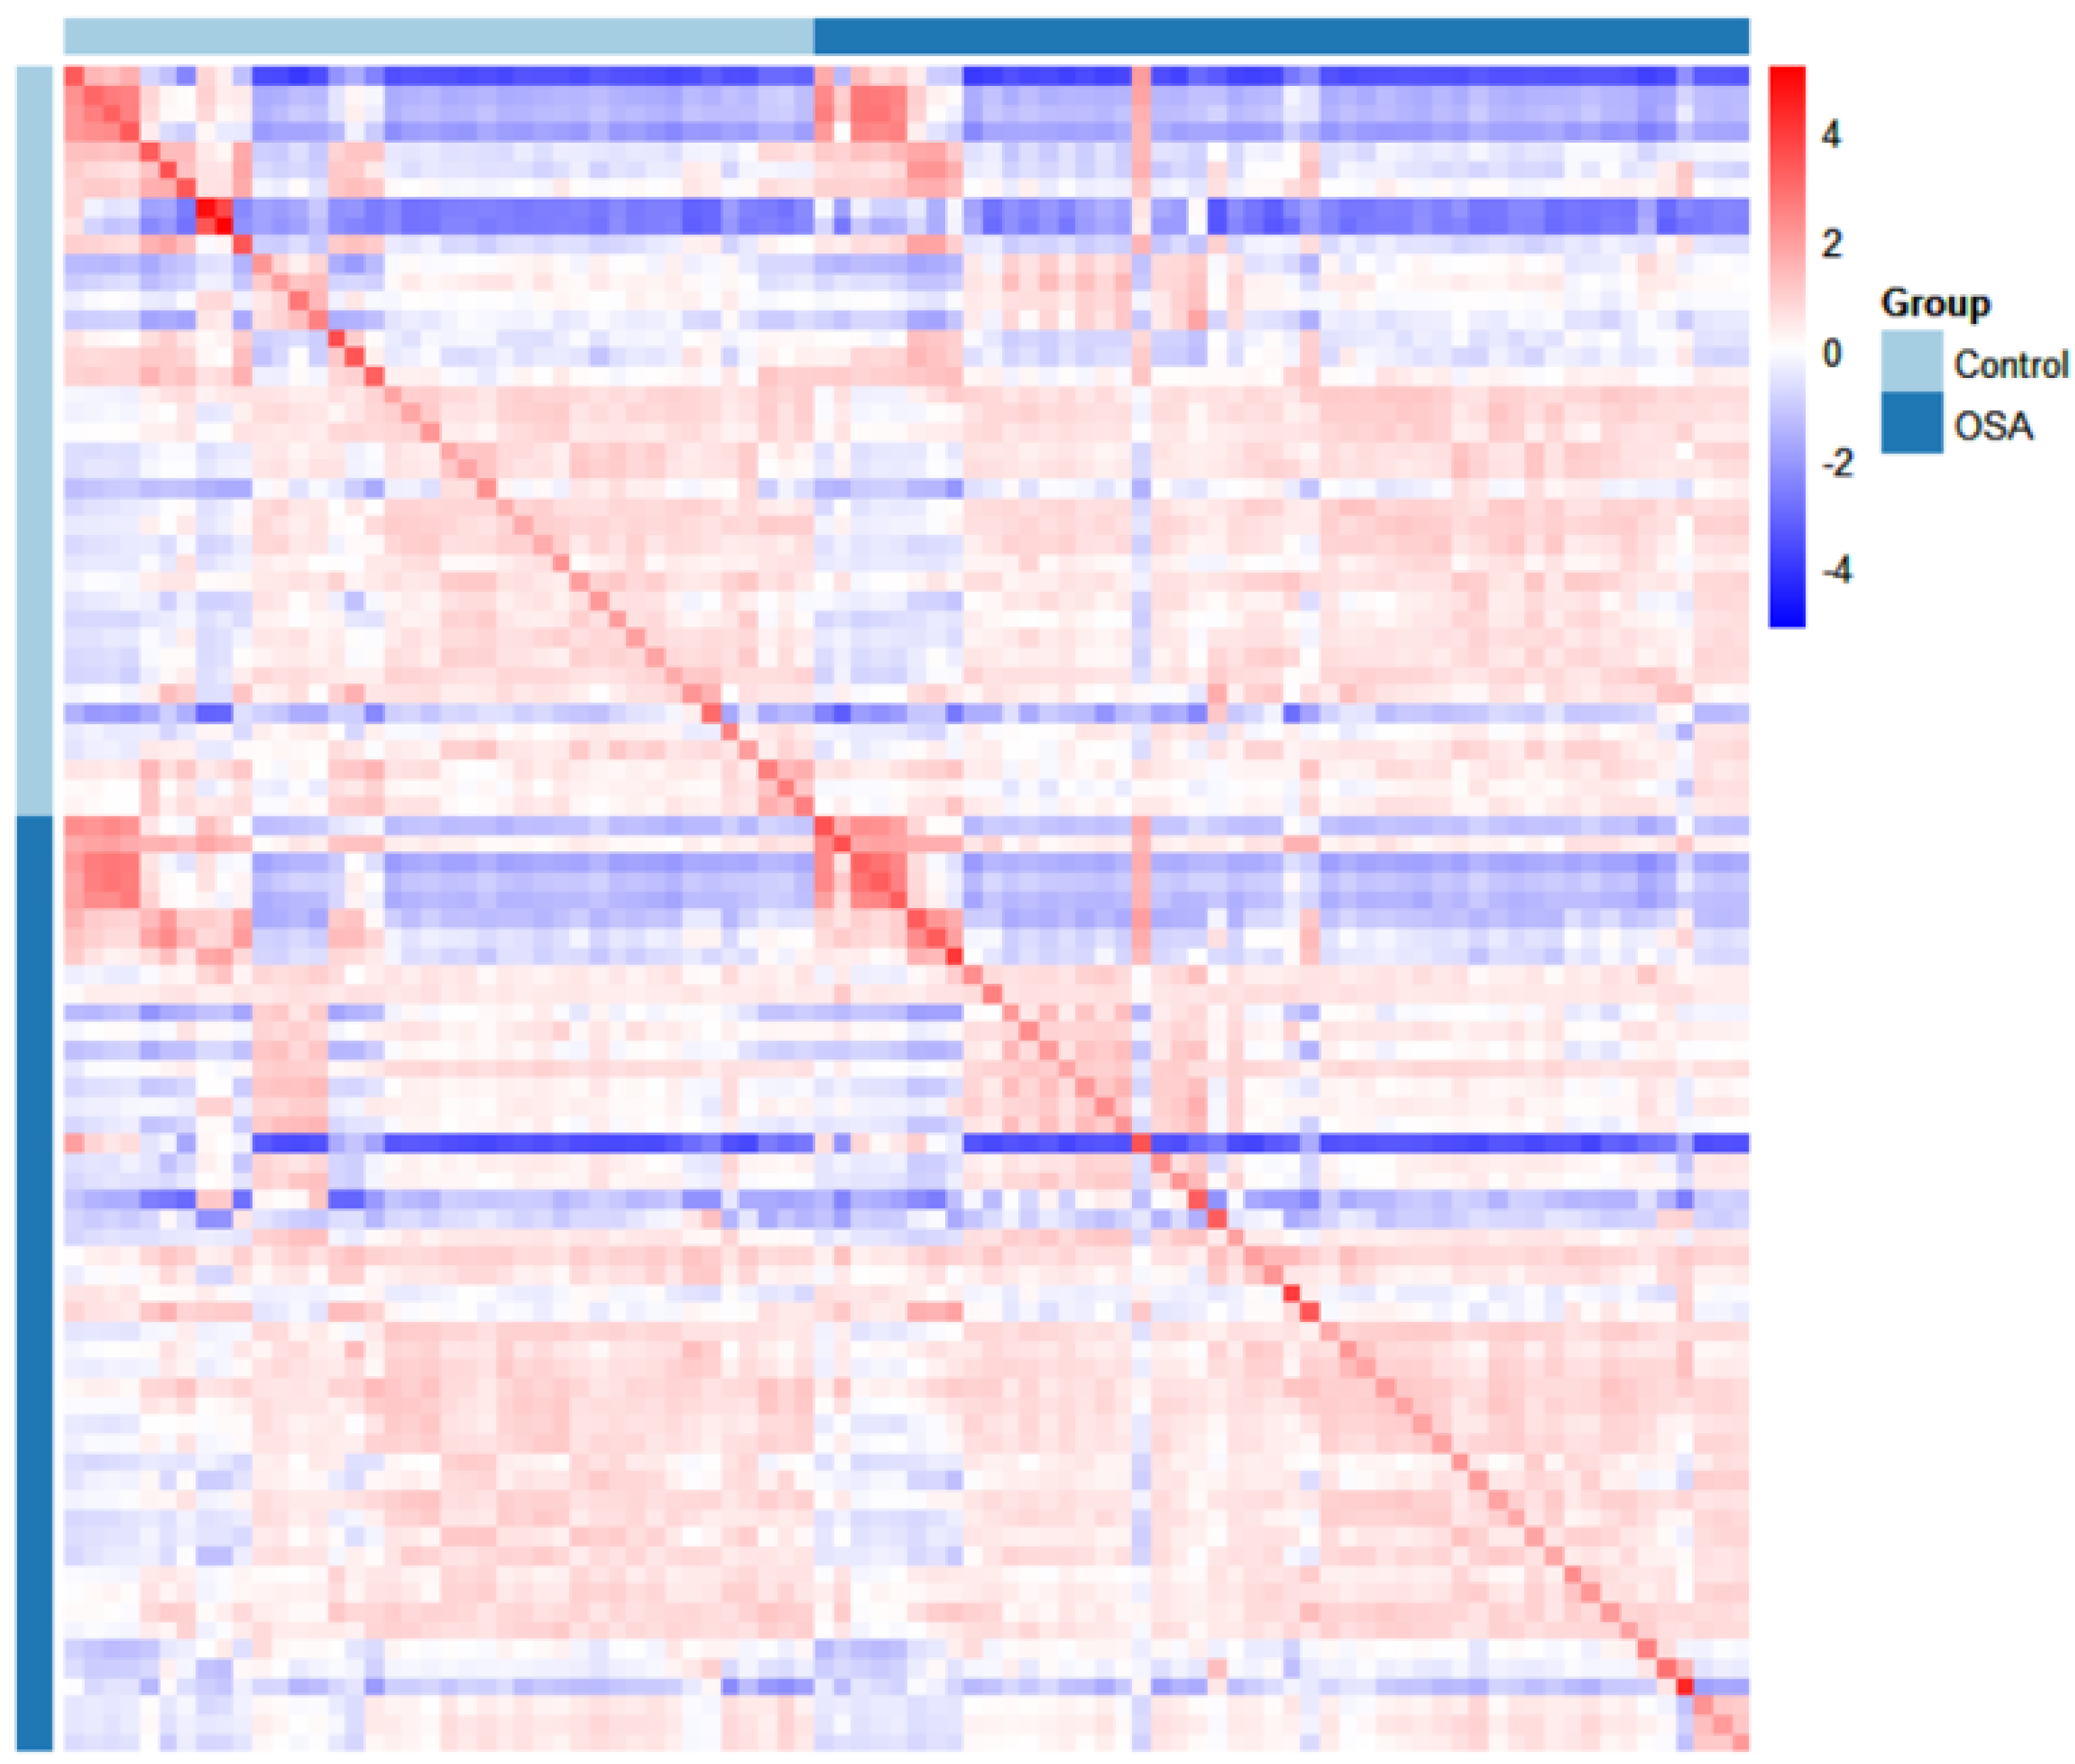
3.2.3. Heatmap Analysis
3.2.4. Correlation Map
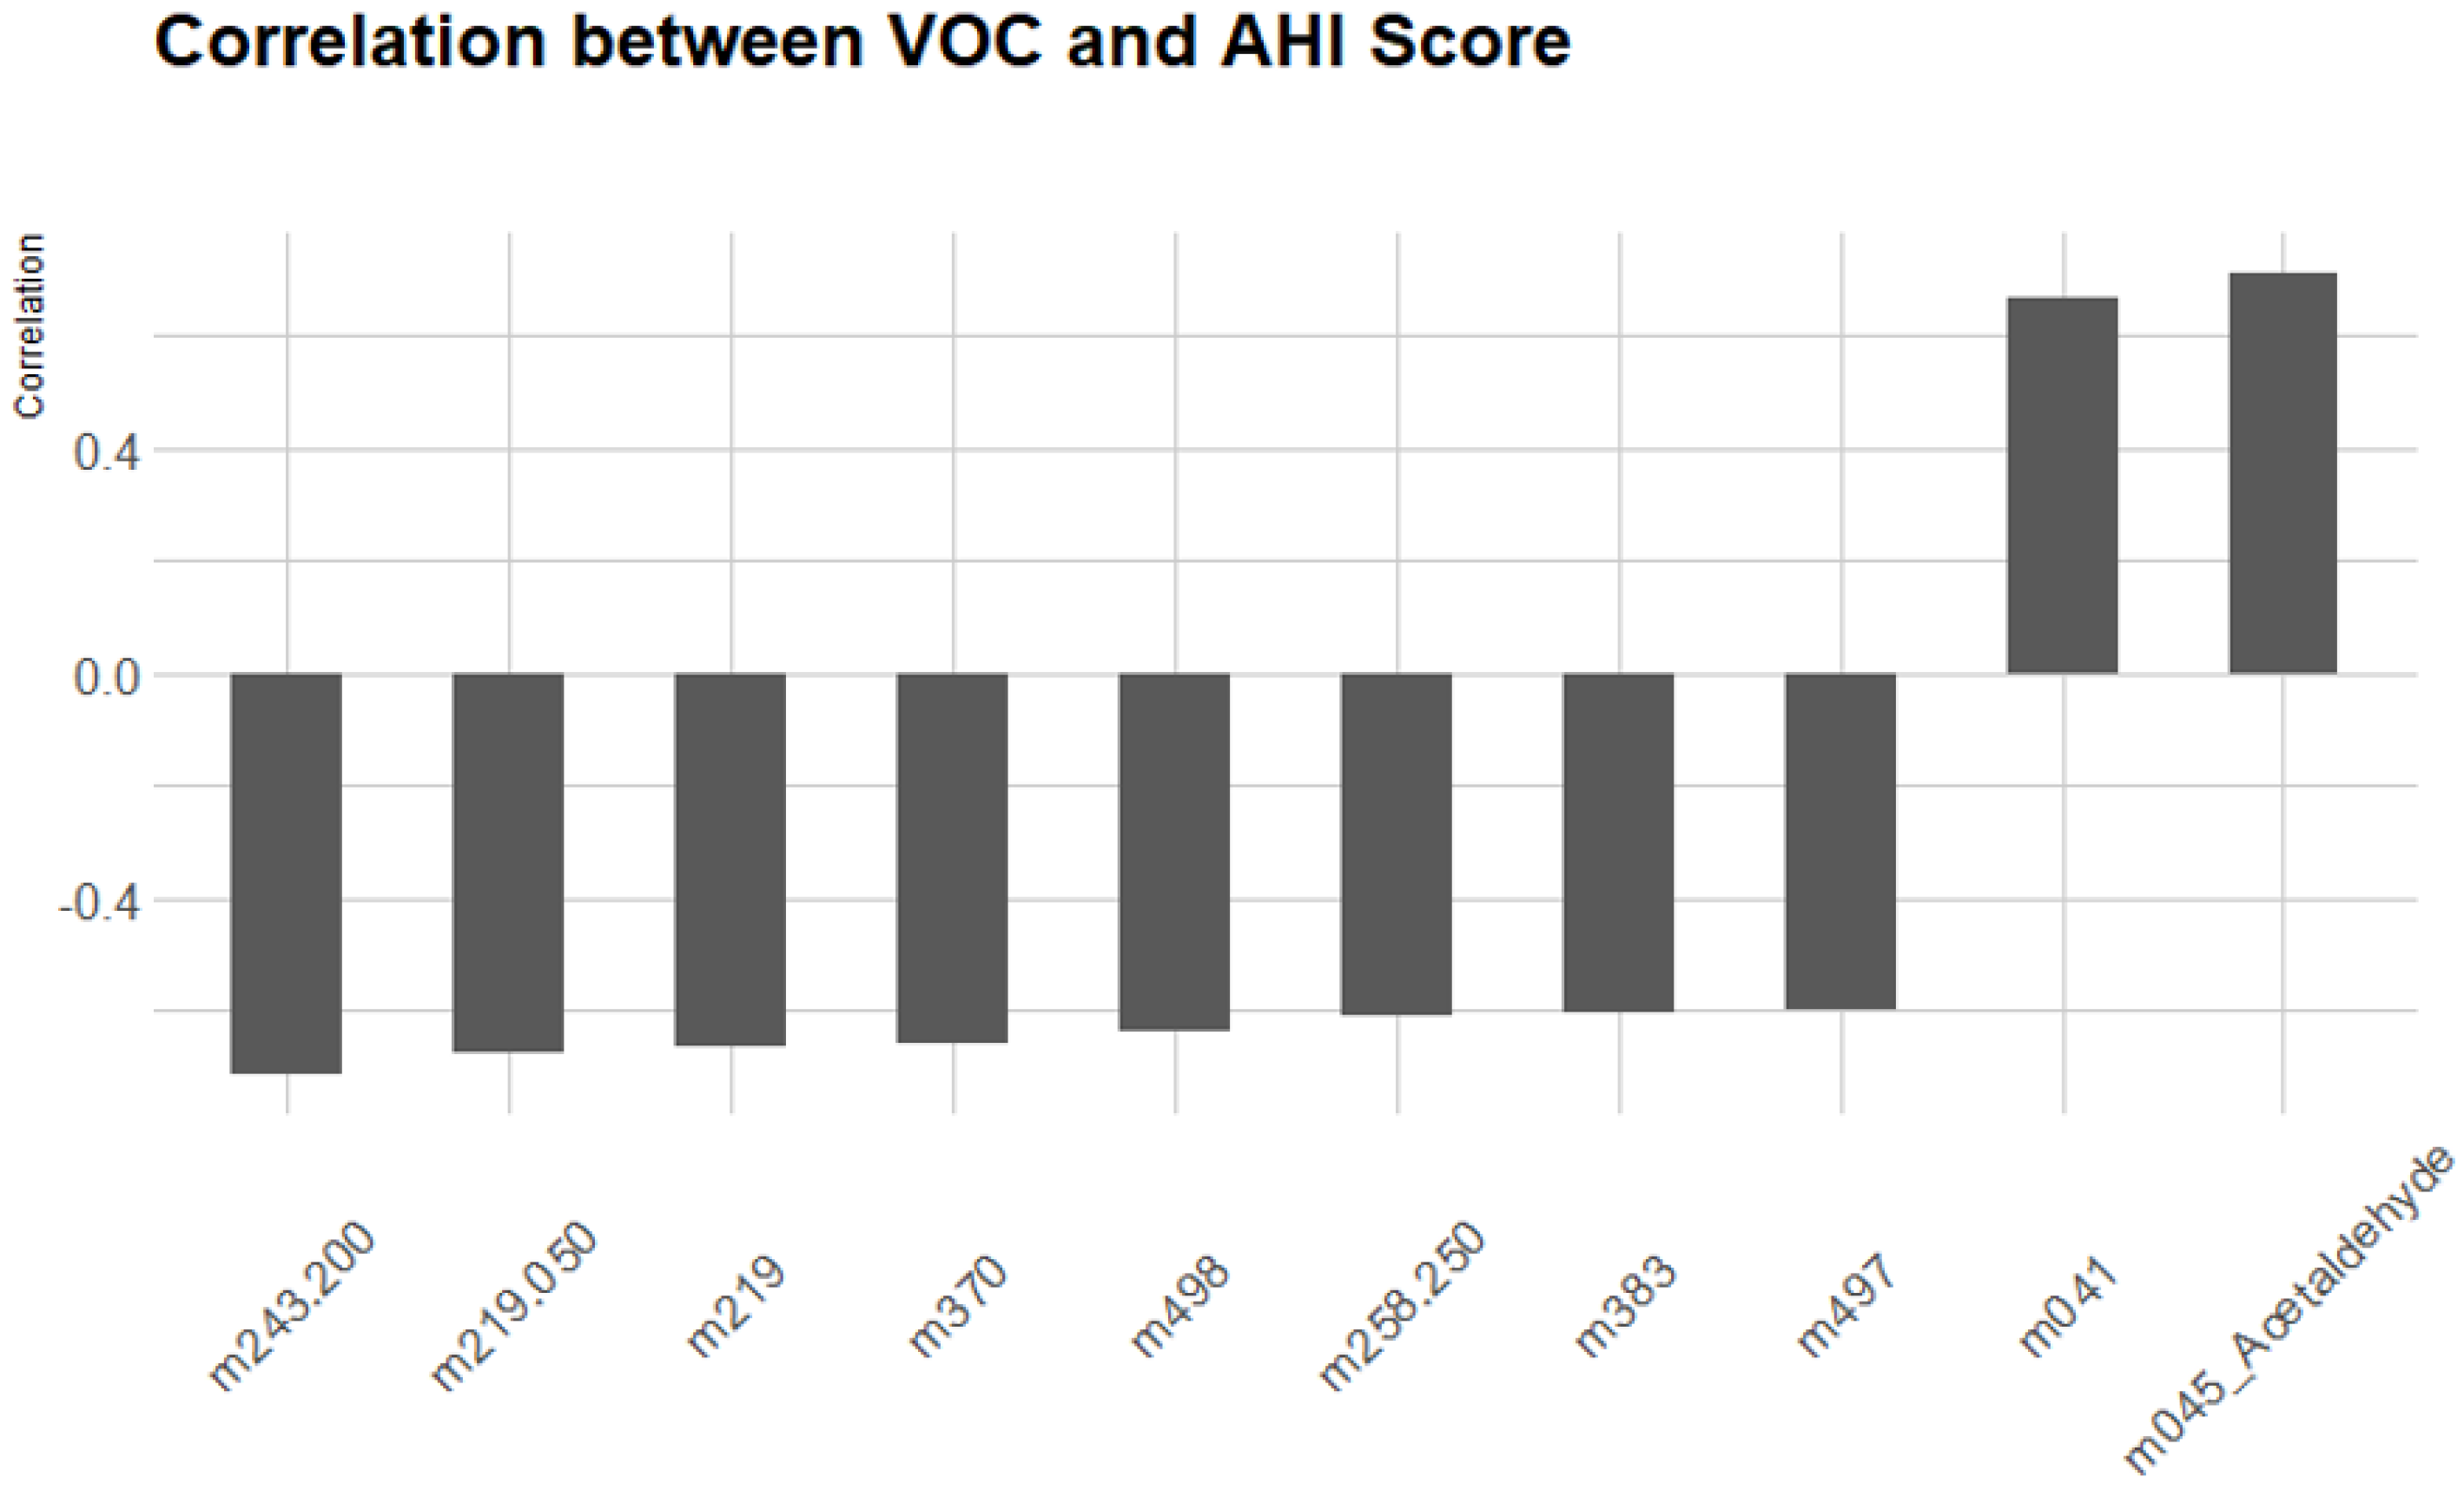
3.2.5. Correlation Between VOCs and AHI Score
4. Discussion
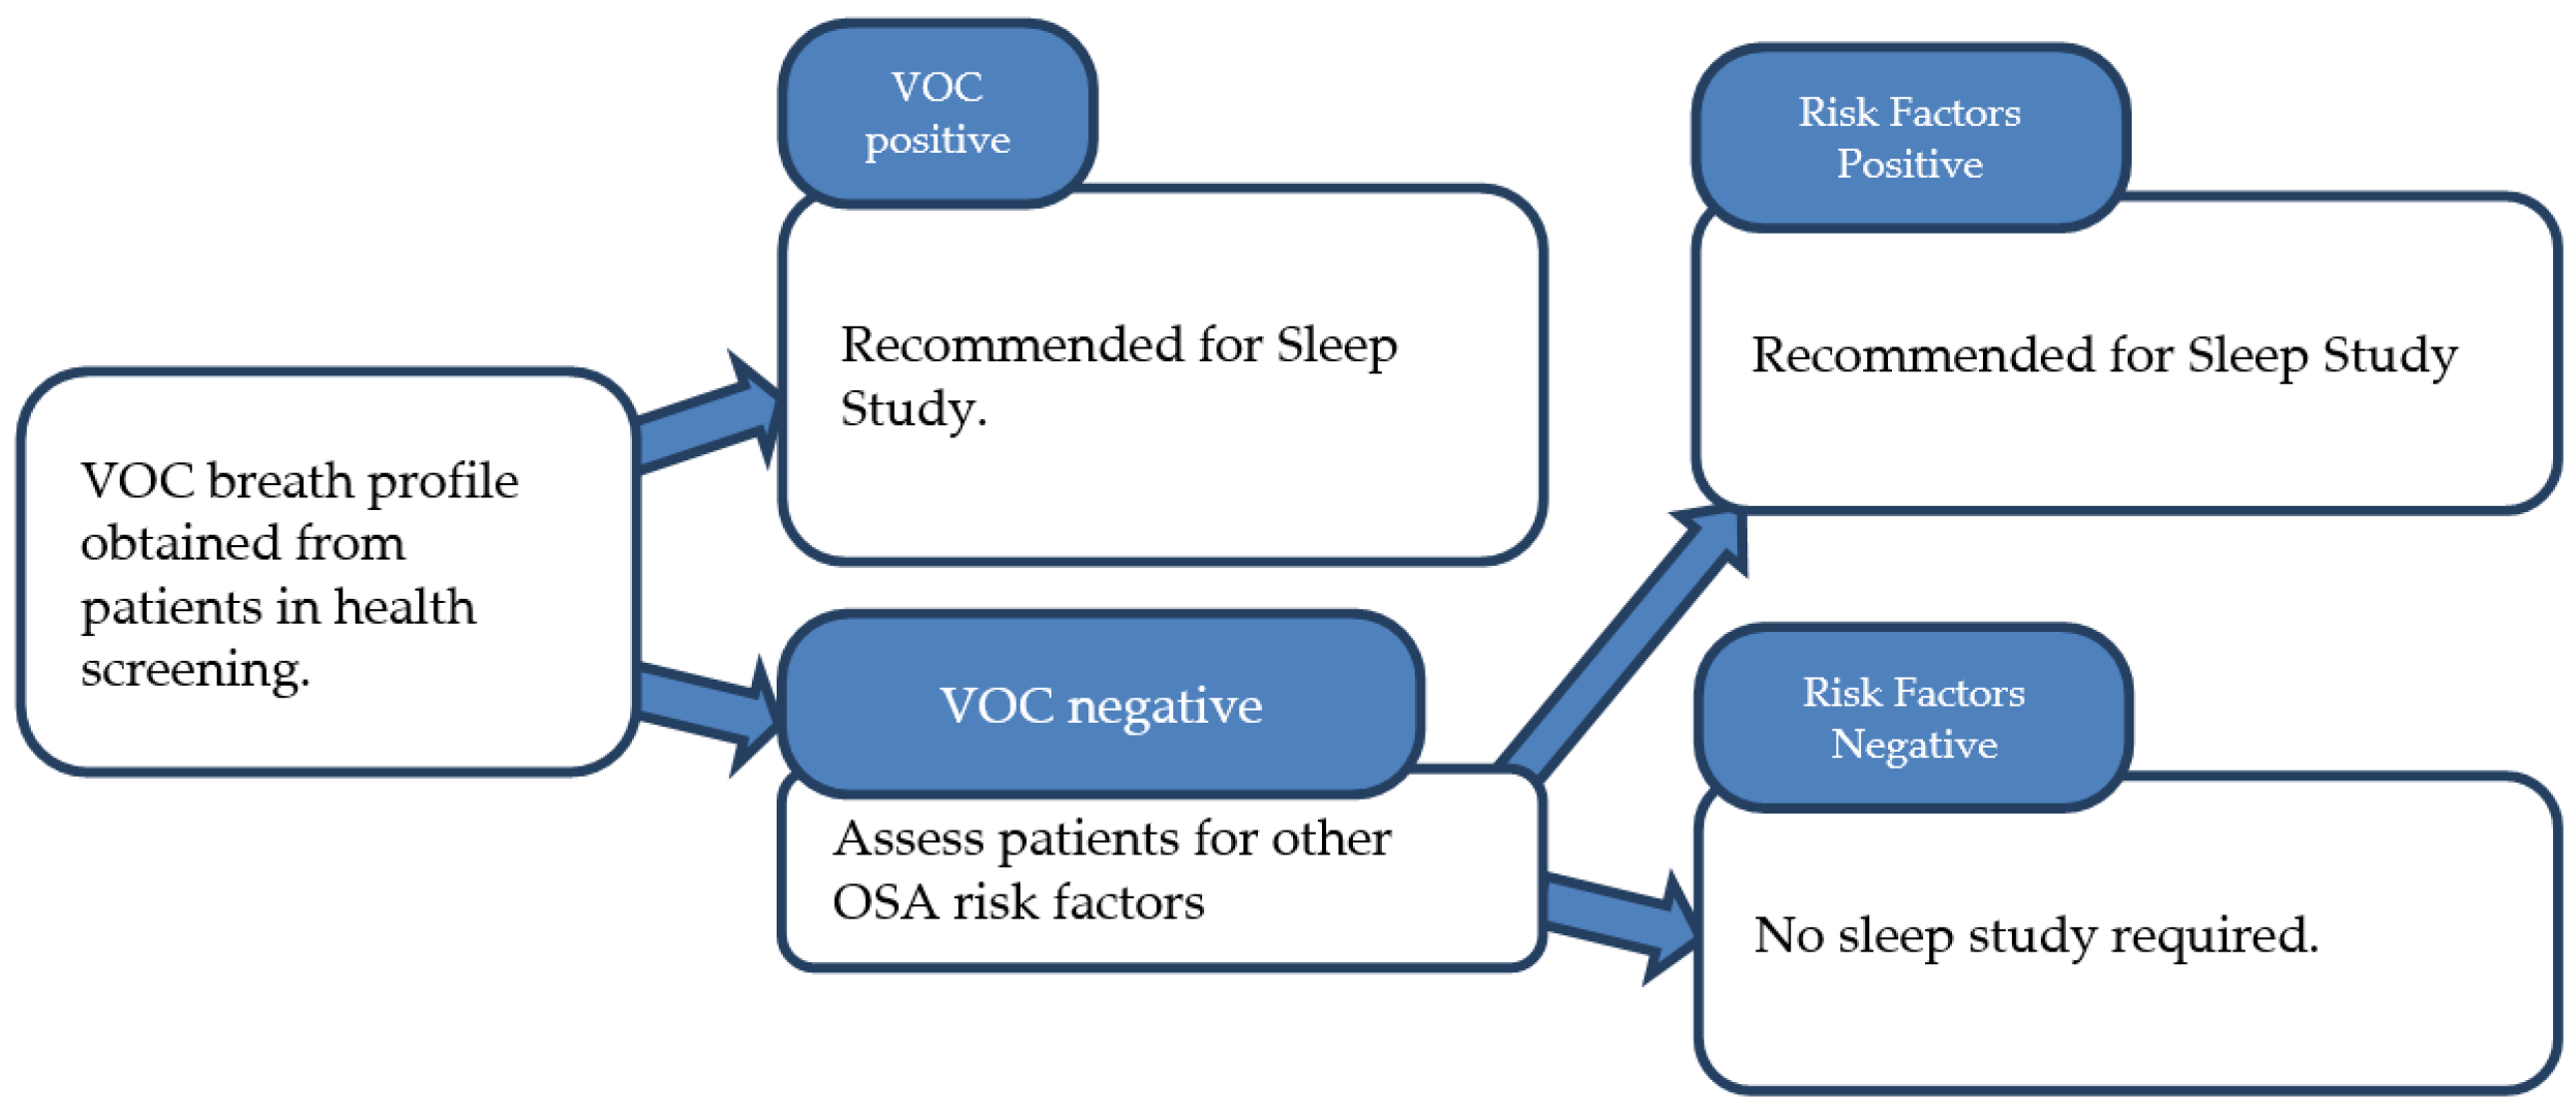
5. Conclusions
Author Contributions
Funding
Institutional Review Board Statement
Informed Consent Statement
Data Availability Statement
Conflicts of Interest
References
- Young, T.; Palta, M.; Dempsey, J.; Skatrud, J.; Weber, S.; Badr, M.S. The occurrence of sleep-disordered breathing among middle-aged adults. N. Engl. J. Med. 1993, 328, 1230–1235. [Google Scholar] [CrossRef] [PubMed]
- Peppard, P.E.; Young, T.; Barnet, J.H.; Palta, M.; Hagen, E.W.; Hla, K.M. Increased prevalence of sleep-disordered breathing in adults. Am. J. Epidemiol. 2013, 177, 1006–1014. [Google Scholar] [CrossRef] [PubMed]
- Young, T.; Peppard, P.E.; Gottlieb, D.J. Risk factors for obstructive sleep apnea in adults. JAMA 2004, 291, 2013–2016. [Google Scholar] [CrossRef] [PubMed]
- Dempsey, J.A.; Veasey, S.C.; Morgan, B.J.; O’Donnell, C.P. Pathophysiology of sleep apnea. Physiol. Rev. 2010, 90, 47–112. [Google Scholar] [CrossRef]
- Mehra, R.; Benjamin, E.J.; Shahar, E.; Gottlieb, D.J.; Nawabit, R.; Kirchner, H.L.; Sahadevan, J.; Redline, S. Association of nocturnal arrhythmias with sleep-disordered breathing: The Sleep Heart Health Study. Am. J. Respir. Crit. Care Med. 2006, 173, 910–916. [Google Scholar] [CrossRef] [PubMed]
- Somers, V.K.; White, D.P.; Amin, R.; Abraham, W.T.; Costa, F.; Culebras, A.; Daniels, S.; Floras, J.S.; Hunt, S.A.; Olson, L.J.; et al. Sleep apnea and cardiovascular disease: An American Heart Association/American College of Cardiology Foundation Scientific Statement. Circulation 2008, 118, 1080–1111. [Google Scholar] [CrossRef]
- Amra, B.; Rahmati, B.; Soltaninejad, F.; Feizi, A. Screening questionnaires for obstructive sleep apnea: An updated systematic review. Oman Med. J. 2018, 33, 184. [Google Scholar] [CrossRef]
- Kim, B.; Lee, E.M.; Chung, Y.S.; Kim, W.S.; Lee, S.A. The utility of three screening questionnaires for obstructive sleep apnea in a sleep clinic setting. Yonsei Med. J. 2015, 56, 684–690. [Google Scholar] [CrossRef] [PubMed]
- Kushida, C.A.; Littner, M.R.; Morgenthaler, T.; Alessi, C.A.; Bailey, D.; Coleman, R., Jr.; Friedman, L.; Hirshkowitz, M.; Kapen, S.; Kramer, M.; et al. Practice parameters for the indications for polysomnography and related procedures: An update for 2005. Sleep 2005, 28, 499–521. [Google Scholar] [CrossRef] [PubMed]
- Tan, H.L.; Kheirandish-Gozal, L.; Gozal, D. Pediatric home sleep apnea testing: Slowly getting there! Chest 2015, 148, 1382–1395. [Google Scholar] [CrossRef] [PubMed]
- Kapoor, M.; Greenough, G. Home sleep tests for obstructive sleep apnea (OSA). J. Am. Board Fam. Med. 2015, 28, 504–509. [Google Scholar] [CrossRef]
- Rosen, I.M.; Kirsch, D.B.; Chervin, R.D.; Carden, K.A.; Ramar, K.; Aurora, R.N.; Kristo, D.A.; Malhotra, R.K.; Martin, J.L.; Olson, E.J.; et al. Clinical use of a home sleep apnea test: An American Academy of Sleep Medicine position statement. J. Clin. Sleep Med. 2017, 13, 1205–1207. [Google Scholar] [CrossRef]
- Davies, S.J.; Španěl, P.; Smith, D. Breath Analysis of Ammonia, Volatile Organic Compounds and Deuterated Water Vapor in Chronic Kidney Disease and during Dialysis. Bioanalysis 2014, 6, 843–857. [Google Scholar] [CrossRef]
- Capone, S.; Tufariello, M.; Forleo, A.; Longo, V.; Giampetruzzi, L.; Radogna, A.V.; Casino, F.; Siciliano, P. Chromatographic Analysis of VOC Patterns in Exhaled Breath from Smokers and Nonsmokers. Biomed. Chromatogr. 2018, 32, e4132. [Google Scholar] [CrossRef] [PubMed]
- Seeman, J.I.; Dixon, M.; Haussmann, H.J. Acetaldehyde in Mainstream Tobacco Smoke: Formation and Occurrence in Smoke and Bioavailability in the Smoker. Chem. Res. Toxicol. 2002, 15, 1331–1350. [Google Scholar] [CrossRef] [PubMed]
- Sharma, A.; Kumar, R.; Varadwaj, P. Smelling the disease: Diagnostic potential of breath analysis. Mol. Diagn. Ther. 2023, 27, 321–347. [Google Scholar] [CrossRef] [PubMed]
- Singh, K.D.; Osswald, M.; Ziesenitz, V.C.; Awchi, M.; Usemann, J.; Imbach, L.L.; Kohler, M.; García-Gómez, D.; Van Den Anker, J.; Frey, U.; et al. Personalised Therapeutic Management of Epileptic Patients Guided by Pathway-Driven Breath Metabolomics. Commun. Med. 2021, 1, 21. [Google Scholar] [CrossRef] [PubMed]
- Saidi, T.; Moufid, M.; De Jesus Beleño-Saenz, K.; Welearegay, T.G.; El Bari, N.; Lisset Jaimes-Mogollon, A.; Ionescu, R.; Bourkadi, J.E.; Benamor, J.; El Ftouh, M.; et al. Non-Invasive Prediction of Lung Cancer Histological Types through Exhaled Breath Analysis by UV-irradiated Electronic Nose and GC/QTOF/MS. Sens. Actuators B Chem. 2020, 311, 127932. [Google Scholar] [CrossRef]
- Raspagliesi, F.; Bogani, G.; Benedetti, S.; Grassi, S.; Ferla, S.; Buratti, S. Detection of Ovarian Cancer through Exhaled Breath by Electronic Nose: A Prospective Study. Cancers 2020, 12, 2408. [Google Scholar] [CrossRef] [PubMed]
- Phillips, M.; Beatty, J.D.; Cataneo, R.N.; Huston, J.; Kaplan, P.D.; Lalisang, R.I.; Lambin, P.; Lobbes, M.B.I.; Mundada, M.; Pappas, N.; et al. Rapid Point-Of-Care Breath Test for Biomarkers of Breast Cancer and Abnormal Mammograms. PLoS ONE 2014, 9, e90226. [Google Scholar] [CrossRef]
- Miller-Atkins, G.; Acevedo-Moreno, L.A.; Grove, D.; Dweik, R.A.; Tonelli, A.R.; Brown, J.M.; Allende, D.S.; Aucejo, F.; Rotroff, D.M. Breath Metabolomics Provides an Accurate and Noninvasive Approach for Screening Cirrhosis, Primary, and Secondary Liver Tumors. Hepatol. Commun. 2020, 4, 1041–1055. [Google Scholar] [CrossRef] [PubMed]
- Carazzone, C.; Rodríguez, J.P.; Gonzalez, M.; López, G.D. Volatilomics of natural products: Whispers from nature. In Metabolomics-Methodology and Applications in Medical Sciences and Life Sciences; IntechOpen: London, UK, 2021. [Google Scholar]
- Finamore, P.; Scarlata, S.; Cardaci, V.; Antonelli Incalzi, R. Exhaled breath analysis in obstructive sleep apnea syndrome: A review of the literature. Medicina 2019, 55, 538. [Google Scholar] [CrossRef]
- Chung, F.; Abdullah, H.R.; Liao, P. STOP-Bang questionnaire: A practical approach to screen for obstructive sleep apnea. Chest 2016, 149, 631–638. [Google Scholar] [CrossRef]
- Johns, M.W. A new method for measuring daytime sleepiness: The Epworth sleepiness scale. Sleep 1991, 14, 540–545. [Google Scholar] [CrossRef] [PubMed]
- Rundo, J.V.; Downey, R., III. Polysomnography. Handb. Clin. Neurol. 2019, 160, 381–392. [Google Scholar] [PubMed]
- Jia, Z.; Patra, A.; Kutty, V.K.; Venkatesan, T. Critical review of volatile organic compound analysis in breath and in vitro cell culture for detection of lung cancer. Metabolites 2019, 9, 52. [Google Scholar] [CrossRef] [PubMed]
- Jia, Z.; Ong, W.Q.; Zhang, F.; Du, F.; Thavasi, V.; Thirumalai, V. A study of 9 common breath VOCs in 504 healthy subjects using PTR-TOF-MS. Metabolomics 2024, 20, 79. [Google Scholar] [CrossRef] [PubMed]
- Herbig, J.; Müller, M.; Schallhart, S.; Titzmann, T.; Graus, M.; Hansel, A. On-line breath analysis with PTR-TOF. J. Breath Res. 2009, 3, 027004. [Google Scholar] [CrossRef] [PubMed]
- Issitt, T.; Wiggins, L.; Veysey, M.; Sweeney, S.T.; Brackenbury, W.J.; Redeker, K. Volatile Compounds in Human Breath: Critical Review and Meta-Analysis. J. Breath Res. 2022, 16, 024001. [Google Scholar] [CrossRef] [PubMed]
- Lindinger, W.; Jordan, A. Proton-transfer-reaction mass spectrometry (PTR–MS): On-line monitoring of volatile organic compounds at pptv levels. Chem. Soc. Rev. 1998, 27, 347–375. [Google Scholar] [CrossRef]
- Matsuse, H.; Fukushima, C.; Shimoda, T.; Asai, S.; Kohno, S. Effects of acetaldehyde on human airway constriction and inflammation. In Proceedings of the Acetaldehyde-Related Pathology: Bridging the Trans-Disciplinary Divide: Novartis Foundation Symposium, London, UK, 5–7 September 2006; Wiley Online Library: Hoboken, NJ, USA, 2006; Volume 285, pp. 97–109. [Google Scholar]
- Stewart, S.A.; Skomro, R.; Reid, J.; Penz, E.; Fenton, M.; Gjevre, J.; Cotton, D. Improvement in obstructive sleep apnea diagnosis and management wait times: A retrospective analysis of a home management pathway for obstructive sleep apnea. Can. Respir. J. 2015, 22, 167–170. [Google Scholar] [CrossRef] [PubMed]
- Kenny, P.P.; Christine, G.G.; David, J.T. A comparison of polysomnography and the WatchPAT in the diagnosis of obstructive sleep apnea. Otolaryngol. Neck Surg. 2007, 137, 665–668. [Google Scholar] [CrossRef] [PubMed]
- Whittle, A.; Finch, S.; Mortimore, I.; MacKay, T.; Douglas, N. Use of home sleep studies for diagnosis of the sleep apnoea/hypopnoea syndrome. Thorax 1997, 52, 1068–1073. [Google Scholar] [CrossRef]
- Hung, C.J.; Kang, B.H.; Lin, Y.S.; Su, H.H. Comparison of a home sleep test with in-laboratory polysomnography in the diagnosis of obstructive sleep apnea syndrome. J. Chin. Med Assoc. 2022, 85, 788–792. [Google Scholar] [CrossRef] [PubMed]
- Massie, F.; Van Pee, B.; Bergmann, J. Correlations between home sleep apnea tests and polysomnography outcomes do not fully reflect the diagnostic accuracy of these tests. J. Clin. Sleep Med. 2022, 18, 871–876. [Google Scholar] [CrossRef]
- Sia, C.H.; Hong, Y.; Tan, L.W.; van Dam, R.M.; Lee, C.H.; Tan, A. Awareness and knowledge of obstructive sleep apnea among the general population. Sleep Med. 2017, 36, 10–17. [Google Scholar] [CrossRef] [PubMed]
- Rao, S.K.; Schilling, T.F.; Sequist, T.D. Challenges in the management of positive fecal occult blood tests. J. Gen. Intern. Med. 2009, 24, 356–360. [Google Scholar] [CrossRef]
- Jia, Z.; Thavasi, V.; Venkatesan, T.; Lee, P. Breath Analysis for Lung Cancer Early Detection—A Clinical Study. Metabolites 2023, 13, 1197. [Google Scholar] [CrossRef] [PubMed]


| Mass resolution | >1500 m/Δm (FWHM) for m/z > 79 |
| Response time | <100 ms |
| Sensitivity | >200 cps/ppbv for m/z 181 |
| Detection limits | <10 pptv for m/z 181 (averaged over 1 min) |
| Linearity range | 10 pptv–1 ppmv |
| Adjustable flow | 50–800 sccm |
| OSA | Control | |
|---|---|---|
| Number | 49 | 40 |
| Age (mean ± SD) | 52.61 ± 11.36 | 43.38 ± 12.70 |
| Gender M/F (%) | 33/16 (67.3%/32.7%) | 24/16 (60.0%/40.0%) |
| AHI (mean ± SD) | 50.98 ± 26.05 | 6.68 ± 3.96 |
| Biomarker (m/z) | p-Value | Compound |
|---|---|---|
| m063 | 0.042 | Ammonium formate |
| m095 | 0.001 | Trifluoro acetonitrile |
| m096 | 0.041 | dichloroethylene |
| m097 | 0.011 | 2,4-hexadienal, 1,3-dimethylpyrazole, or cycloheptene |
| m224 | 0.045 | - |
| m225 | 0.047 | N-hexadecane |
| m355 | 0.025 | - |
| m356 | 0.028 | - |
| m357 | 0.028 | - |
| m371 | 0.048 | - |
| m372 | 0.047 | - |
| m375 | 0.048 | - |
Disclaimer/Publisher’s Note: The statements, opinions and data contained in all publications are solely those of the individual author(s) and contributor(s) and not of MDPI and/or the editor(s). MDPI and/or the editor(s) disclaim responsibility for any injury to people or property resulting from any ideas, methods, instructions or products referred to in the content. |
© 2025 by the authors. Licensee MDPI, Basel, Switzerland. This article is an open access article distributed under the terms and conditions of the Creative Commons Attribution (CC BY) license (https://creativecommons.org/licenses/by/4.0/).
Share and Cite
Gui, C.H.; Jia, Z.; Xing, Z.; Zhang, F.; Du, F.; Tham, A.C.; Lim, M.Y.; Chong, Y.K.; Chew, A.S.Q.; Chong, K.B. A Study of Volatile Organic Compounds in Patients with Obstructive Sleep Apnea. Metabolites 2025, 15, 42. https://doi.org/10.3390/metabo15010042
Gui CH, Jia Z, Xing Z, Zhang F, Du F, Tham AC, Lim MY, Chong YK, Chew ASQ, Chong KB. A Study of Volatile Organic Compounds in Patients with Obstructive Sleep Apnea. Metabolites. 2025; 15(1):42. https://doi.org/10.3390/metabo15010042
Chicago/Turabian StyleGui, Chuan Hao, Zhunan Jia, Zihao Xing, Fuchang Zhang, Fang Du, Alex Chengyao Tham, Ming Yann Lim, Yaw Khian Chong, Agnes Si Qi Chew, and Khai Beng Chong. 2025. "A Study of Volatile Organic Compounds in Patients with Obstructive Sleep Apnea" Metabolites 15, no. 1: 42. https://doi.org/10.3390/metabo15010042
APA StyleGui, C. H., Jia, Z., Xing, Z., Zhang, F., Du, F., Tham, A. C., Lim, M. Y., Chong, Y. K., Chew, A. S. Q., & Chong, K. B. (2025). A Study of Volatile Organic Compounds in Patients with Obstructive Sleep Apnea. Metabolites, 15(1), 42. https://doi.org/10.3390/metabo15010042