


Performance Evaluation of a Novel Non-Invasive Test for the Detection of Advanced Liver Fibrosis in Metabolic Dysfunction-Associated Fatty Liver Disease

 , , , and
Abstract
1. Introduction
2. Materials and Methods
2.1. Study Group
2.2. Laboratory and Imaging Tests
2.3. Non-Invasive Algorithms for Suspected Liver Fibrosis in MAFLD
2.4. Statistical Analysis
2.5. Cost Analysis
3. Results
4. Discussion
5. Conclusions
Supplementary Materials
Author Contributions
Funding
Institutional Review Board Statement
Informed Consent Statement
Data Availability Statement
Conflicts of Interest
References
- Eslam, M.; Newsome, P.N.; Sarin, S.K.; Anstee, Q.M.; Targher, G.; Romero-Gomez, M.; Zelber-Sagi, S.; Wong, V.W.-S.; Dufour, J.-F.; Schattenberg, J.M.; et al. A new definition for metabolic dysfunction-associated fatty liver disease: An international expert consensus statement. J. Hepatol. 2020, 73, 202–209. [Google Scholar] [CrossRef] [PubMed]
- Eslam, M.; Sanyal, A.J.; George, J. International Consensus Panel. MAFLD: A Consensus-Driven Proposed Nomenclature for Metabolic Associated Fatty Liver Disease. Gastroenterology 2020, 158, 1999–2014. [Google Scholar] [CrossRef] [PubMed]
- Gofton, C.; Upendran, Y.; Zheng, M.H.; George, J. MAFLD: How is it different from NAFLD? Clin. Mol. Hepatol. 2023, 29, S17–S31. [Google Scholar] [CrossRef] [PubMed]
- Suwała, S.; Białczyk, A.; Koperska, K.; Rajewska, A.; Krintus, M.; Junik, R. Prevalence and Crucial Parameters in Diabesity-Related Liver Fibrosis: A Preliminary Study. J. Clin. Med. 2023, 12, 7760. [Google Scholar] [CrossRef]
- Vilar-Gomez, E.; Calzadilla-Bertot, L.; Wong, V.W.-S.; Castellanos, M.; Aller-de la Fuente, R.; Metwally, M.; Eslam, M.; Gonzalez-Fabian, L.; Sanz, M.A.-Q.; Conde-Martín, A.F.; et al. Fibrosis severity as a determinant of cause-specific mortality in patients with advanced nonalcoholic fatty liver disease: A multi-national cohort study. Gastroenterology 2018, 155, 443–457. [Google Scholar] [CrossRef]
- European Association for the Study of the Liver (EASL); European Association for the Study of Diabetes (EASD); European Association for the Study of Obesity (EASO). EASL-EASD-EASO Clinical Practice Guidelines for the management of non-alcoholic fatty liver disease. J. Hepatol. 2016, 64, 1388–1402. [Google Scholar] [CrossRef] [PubMed]
- Chalasani, N.; Younossi, Z.; Lavine, J.E.; Charlton, M.; Cusi, K.; Rinella, M.; Harrison, S.A.; Brunt, E.M.; Sanyal, A.J. The diagnosis and management of nonalcoholic fatty liver disease: Practice guidance from the American Association for the Study of Liver Diseases. Hepatology 2018, 67, 328–357. [Google Scholar] [CrossRef]
- Eslam, M.; Sarin, S.K.; Wong, V.W.-S.; Fan, J.-G.; Kawaguchi, T.; Ahn, S.H.; Zheng, M.-H.; Shiha, G.; Yilmaz, Y.; Gani, R.; et al. The Asian Pacific Association for the Study of the Liver clinical practice guidelines for the diagnosis and management of metabolic associated fatty liver disease. Hepatol. Int. 2020, 14, 889–919. [Google Scholar] [CrossRef]
- Pal, S.C.; Méndez-Sánchez, N. Screening for MAFLD: Who, when and how? Ther. Adv. Endocrinol. Metab. 2023, 14, 20420188221145650. [Google Scholar] [CrossRef]
- Sterling, R.K.; Lissen, E.; Clumeck, N.; Sola, R.; Correa, M.C.; Montaner, J.; Sulkowski, M.S.; Torriani, F.J.; Dieterich, D.T.; Thomas, D.L.; et al. Development of a simple noninvasive index to predict significant fibrosis in patients with HIV/HCV coinfection. Hepatology 2006, 43, 1317–1325. [Google Scholar] [CrossRef]
- Vilar-Gomez, E.; Chalasani, N. Non-invasive assessment of non-alcoholic fatty liver disease: Clinical prediction rules and blood-based biomarkers. J. Hepatol. 2018, 68, 305–315. [Google Scholar] [CrossRef] [PubMed]
- Boursier, J.; Guillaume, M.; Leroy, V.; Irlès, M.; Roux, M.; Lannes, A.; Foucher, J.; Zuberbuhler, F.; Delabaudière, C.; Barthelon, J.; et al. New sequential combinations of non-invasive fibrosis tests provide an accurate diagnosis of advanced fibrosis in NAFLD. J. Hepatol. 2019, 71, 389–396. [Google Scholar] [CrossRef]
- Horn, P. NAFLD—Diagnosis, Assessment and Management. Available online: https://www.bsg.org.uk/web-education-articles-list/nafld-diagnosis-assessment-and-management/ (accessed on 1 September 2023).
- Li, W.; Luo, C.; Preference of Joint Detection for Liver Fibrosis. Snibe Reagent Research & Development Center. Available online: http://www.imtec.be/files/images/1594383213_M1001E04-Company%20catalog-191115_ImTec%20test.pdf (accessed on 1 September 2023).
- Available online: https://www.sendspace.com/file/youdbz (accessed on 6 January 2024).
- García-Compeán, D.; Jiménez-Rodríguez, A.R. NAFLD VS MAFLD. The evidence-based debate has come. Time to change? Ann. Hepatol. 2022, 27, 100765. [Google Scholar] [CrossRef] [PubMed]
- Kawaguchi, T.; Tsutsumi, T.; Nakano, D.; Torimura, T. MAFLD: Renovation of clinical practice and disease awareness of fatty liver. Hepatol. Res. 2022, 52, 422–432. [Google Scholar] [CrossRef] [PubMed]
- Bossuyt, P.M.; Reitsma, J.B.; Bruns, D.E.; Gatsonis, C.A.; Glasziou, P.P.; Irwig, L.; Lijmer, J.G.; Moher, D.; Rennie, D.; De Vet, H.C.; et al. STARD 2015: An updated list of essential items for reporting diagnostic accuracy studies. BMJ 2015, 351, h5527. [Google Scholar] [CrossRef] [PubMed]
- European Society of Radiology (ESR); European Federation of Radiographer Societies (EFRS). Patient Safety in Medical Imaging: A joint paper of the European Society of Radiology (ESR) and the European Federation of Radiographer Societies (EFRS). Insights Imaging 2019, 10, 45. [Google Scholar] [CrossRef]
- Cornes, M.; Ibarz, M.; Ivanov, H.; Grankvist, K. Blood sampling guidelines with focus on patient safety and identification—A review. Diagnosis 2019, 6, 33–37. [Google Scholar] [CrossRef]
- Radikova, Z.; Koska, J.; Huckova, M.; Ksinantova, L.; Imrich, R.; Vigas, M.; Trnovec, T.; Langer, P.; Sebokova, E.; Klimes, I. Insulin sensitivity indices: A proposal of cut-off points for simple identification of insulin-resistant subjects. Exp. Clin. Endocrinol. Diabetes 2006, 114, 249–256. [Google Scholar] [CrossRef]
- Petta, S.; Wong, V.W.; Cammà, C.; Hiriart, J.B.; Wong, G.L.; Marra, F.; Vergniol, J.; Chan, A.W.; Di Marco, V.; Merrouche, W.; et al. Improved noninvasive prediction of liver fibrosis by liver stiffness measurement in patients with nonalcoholic fatty liver disease accounting for controlled attenuation parameter values. Hepatology 2017, 65, 1145–1155. [Google Scholar] [CrossRef]
- Cochrane Hepato-Biliary Group; Turankova, T.; Blyuss, O.; Brazhnikov, A.; Svistunov, A.; Gurusamy, K.S.; Pavlov, C.S. Transient elastography with controlled attenuation parameter (CAP) for diagnosis of moderate or severe steatosis in people with suspected non-alcoholic fatty liver disease. Cochrane Database Syst. Rev. 2020, 2020, CD013670. [Google Scholar]
- Wong, V.W.-S.; Vergniol, J.; Wong, G.L.-H.; Foucher, J.; Chan, H.L.-Y.; Le Bail, B.; Choi, P.C.-L.; Kowo, M.; Chan, A.W.-H.; Merrouche, W.; et al. Diagnosis of fibrosis and cirrhosis using liver stiffness measurement in nonalcoholic fatty liver disease. Hepatology 2010, 51, 454–462. [Google Scholar] [CrossRef]
- Salgado, J.F. Transforming the Area under the Normal Curve (AUC) into Cohen’s d, Pearson’s rpb, Odds-Ratio, and Natural Log Odds-Ratio: Two Conversion Tables. Eur. J. Psychol. Appl. Leg. Context 2018, 10, 35–47. [Google Scholar] [CrossRef]
- Rosenberg, W.M.; Voelker, M.; Thiel, R.; Becka, M.; Burt, A.; Schuppan, D.; Hubscher, S.; Roskams, T.; Pinzani, M.; Arthur, M.J.; et al. Serum markers detect the presence of liver fibrosis: A cohort study. Gastroenterology 2004, 127, 1704–1713. [Google Scholar] [CrossRef] [PubMed]
- Angulo, P.; Hui, J.M.; Marchesini, G.; Bugianesi, E.; George, J.; Farrell, G.C.; Enders, F.; Saksena, S.; Burt, A.D.; Bida, J.P.; et al. The NAFLD fibrosis score: A noninvasive system that identifies liver fibrosis in patients with NAFLD. Hepatology 2007, 45, 846–854. [Google Scholar] [CrossRef]
- Anstee, Q.M.; Lawitz, E.J.; Alkhouri, N.; Wong, V.W.-S.; Romero-Gomez, M.; Okanoue, T.; Trauner, M.; Kersey, K.; Li, G.; Han, L.; et al. Noninvasive Tests Accurately Identify Advanced Fibrosis due to NASH: Baseline Data From the STELLAR Trials. Hepatology 2019, 70, 1521–1530. [Google Scholar] [CrossRef] [PubMed]
- National Institute for Health and Care Excellence (NICE). Nonalcoholic Fatty Liver Disease (NAFLD): Assessment and Management. NICE Website. Available online: https://www.nice.org.uk/guidance/ng49 (accessed on 1 September 2023).
- Kang, S.H.; Lee, H.W.; Yoo, J.J.; Cho, Y.; Kim, S.U.; Lee, T.H.; Jang, B.K.; Kim, S.G.; Ahn, S.B.; Kim, H.; et al. KASL clinical practice guidelines: Management of nonalcoholic fatty liver disease. Clin. Mol. Hepatol. 2021, 27, 363–401. [Google Scholar] [CrossRef]
- Petta, S.; Wong, V.W.; Cammà, C.; Hiriart, J.B.; Wong, G.L.; Vergniol, J.; Chan, A.W.; Di Marco, V.; Merrouche, W.; Chan, H.L.; et al. Serial combination of non-invasive tools improves the diagnostic accuracy of severe liver fibrosis in patients with NAFLD. Aliment. Pharmacol. Ther. 2017, 46, 617–627. [Google Scholar] [CrossRef] [PubMed]
- Kanwal, F.; Shubrook, J.H.; Adams, L.A.; Pfotenhauer, K.; Wong, V.W.-S.; Wright, E.; Abdelmalek, M.F.; Harrison, S.A.; Loomba, R.; Mantzoros, C.S.; et al. Clinical Care Pathway for the Risk Stratification and Management of Patients with Nonalcoholic Fatty Liver Disease. Gastroenterology 2021, 161, 1657–1669. [Google Scholar] [CrossRef]
- Rinella, M.E.; Neuschwander-Tetri, B.A.; Siddiqui, M.S.; Abdelmalek, M.F.; Caldwell, S.; Barb, D.; Kleiner, D.E.; Loomba, R. AASLD Practice Guidance on the clinical assessment and management of nonalcoholic fatty liver disease. Hepatology 2023, 77, 1797–1835. [Google Scholar] [CrossRef]
- Tovo, C.V.; Villela-Nogueira, C.A.; Leite, N.C.; Panke, C.L.; Port, G.Z.; Fernandes, S.; Buss, C.; Coral, G.P.; Cardoso, A.C.; Cravo, C.M.; et al. Transient hepatic elastography has the best performance to evaluate liver fibrosis in non-alcoholic fatty liver disease (NAFLD). Ann. Hepatol. 2019, 18, 445–449. [Google Scholar] [CrossRef]
- Vali, Y.; Lee, J.; Boursier, J.; Spijker, R.; Löffler, J.; Verheij, J.; Brosnan, M.J.; Böcskei, Z.; Anstee, Q.M.; LITMUS Systematic Review Team; et al. Enhanced liver fibrosis test for the non-invasive diagnosis of fibrosis in patients with NAFLD: A systematic review and meta-analysis. J. Hepatol. 2020, 73, 252–262. [Google Scholar] [CrossRef]
- Canivet, C.M.; Boursier, J. Screening for Liver Fibrosis in the General Population: Where Do We Stand in 2022? Diagnostics 2022, 13, 91. [Google Scholar] [CrossRef] [PubMed]
- Day, J.W.; Rosenberg, W.M. The enhanced liver fibrosis (ELF) test in diagnosis and management of liver fibrosis. Br. J. Hosp. Med. 2018, 79, 694–699. [Google Scholar] [CrossRef] [PubMed]
- Aleknavičiūtė-Valienė, G.; Banys, V. Clinical importance of laboratory biomarkers in liver fibrosis. Biochem. Med. 2022, 32, 030501. [Google Scholar]
- van Kleef, L.A.; Ayada, I.; Alferink, L.J.M.; Pan, Q.; de Knegt, R.J. Metabolic dysfunction-associated fatty liver disease improves detection of high liver stiffness: The Rotterdam Study. Hepatology 2022, 75, 419–429. [Google Scholar] [CrossRef] [PubMed]
- Kjaergaard, M.; Lindvig, K.P.; Thorhauge, K.H.; Andersen, P.; Hansen, J.K.; Kastrup, N.; Jensen, J.M.; Hansen, C.D.; Johansen, S.; Israelsen, M.; et al. Using the ELF test, FIB-4 and NAFLD fibrosis score to screen the population for liver disease. J. Hepatol. 2023, 79, 277–286. [Google Scholar] [CrossRef]
- Younossi, Z.M.; Felix, S.; Jeffers, T.; Younossi, E.; Nader, F.; Pham, H.; Afendy, A.; Cable, R.; Racila, A.; Younoszai, Z.; et al. Performance of the Enhanced Liver Fibrosis Test to Estimate Advanced Fibrosis among Patients with Nonalcoholic Fatty Liver Disease. JAMA Netw. Open 2021, 4, e2123923. [Google Scholar] [CrossRef] [PubMed]
- Park, H.; Yoon, E.L.; Kim, M.; Lee, J.; Cho, S.; Jun, D.W.; Nah, E.H. Reappraisal of fibrosis-4 index and non-alcoholic fatty liver disease fibrosis score for advanced fibrosis in average-risk population. Front. Med. 2022, 9, 1024836. [Google Scholar] [CrossRef]
- Wu, Y.; Kumar, R.; Huang, J.; Wang, M.; Zhu, Y.; Lin, S. FIB-4 cut-off should be re-evaluated in patients with metabolic associated fatty liver disease (MAFLD). J. Hepatol. 2021, 74, 247–248. [Google Scholar] [CrossRef]
- Mózes, F.E.; Lee, J.A.; Selvaraj, E.A.; Jayaswal, A.N.A.; Trauner, M.; Boursier, J.; Fournier, C.; Staufer, K.; Stauber, R.E.; Bugianesi, E.; et al. Diagnostic accuracy of non-invasive tests for advanced fibrosis in patients with NAFLD: An individual patient data meta-analysis. Gut 2022, 71, 1006–1019. [Google Scholar] [CrossRef]
- Gosalia, D.; Ratziu, V.; Stanicic, F.; Vukicevic, D.; Zah, V.; Gunn, N.; Halegoua-DeMarzio, D.; Tran, T. Accuracy of Noninvasive Diagnostic Tests for the Detection of Significant and Advanced Fibrosis Stages in Nonalcoholic Fatty Liver Disease: A Systematic Literature Review of the US Studies. Diagnostics 2022, 1, 2608. [Google Scholar] [CrossRef] [PubMed]
- Patel, K.; Sebastiani, G. Limitations of non-invasive tests for assessment of liver fibrosis. JHEP Rep. 2020, 2, 100067. [Google Scholar] [CrossRef] [PubMed]
- Zhou, F.; Zhou, J.; Wang, W.; Zhang, X.J.; Ji, Y.X.; Zhang, P.; She, Z.G.; Zhu, L.; Cai, J.; Li, H. Unexpected Rapid Increase in the Burden of NAFLD in China from 2008 to 2018: A Systematic Review and Meta-Analysis. Hepatology 2019, 70, 1119–1133. [Google Scholar] [CrossRef] [PubMed]
- Loomba, R.; Adams, L.A. Advances in non-invasive assessment of hepatic fibrosis. Gut 2020, 69, 1343–1352. [Google Scholar] [CrossRef]
- Stefano, J.T.; Guedes, L.V.; de Souza, A.A.A.; Vanni, D.S.; Alves, V.A.F.; Carrilho, F.J.; Largura, A.; Arrese, M.; Oliveira, C.P. Usefulness of collagen type IV in the detection of significant liver fibrosis in nonalcoholic fatty liver disease. Ann. Hepatol. 2021, 20, 100253. [Google Scholar] [CrossRef]
- Jothimani, D.; Kailaasam, E. Performance of non-invasive markers of liver fibrosis. J. Clin. Exp. Hepatol. 2018, 8, S77. [Google Scholar] [CrossRef]


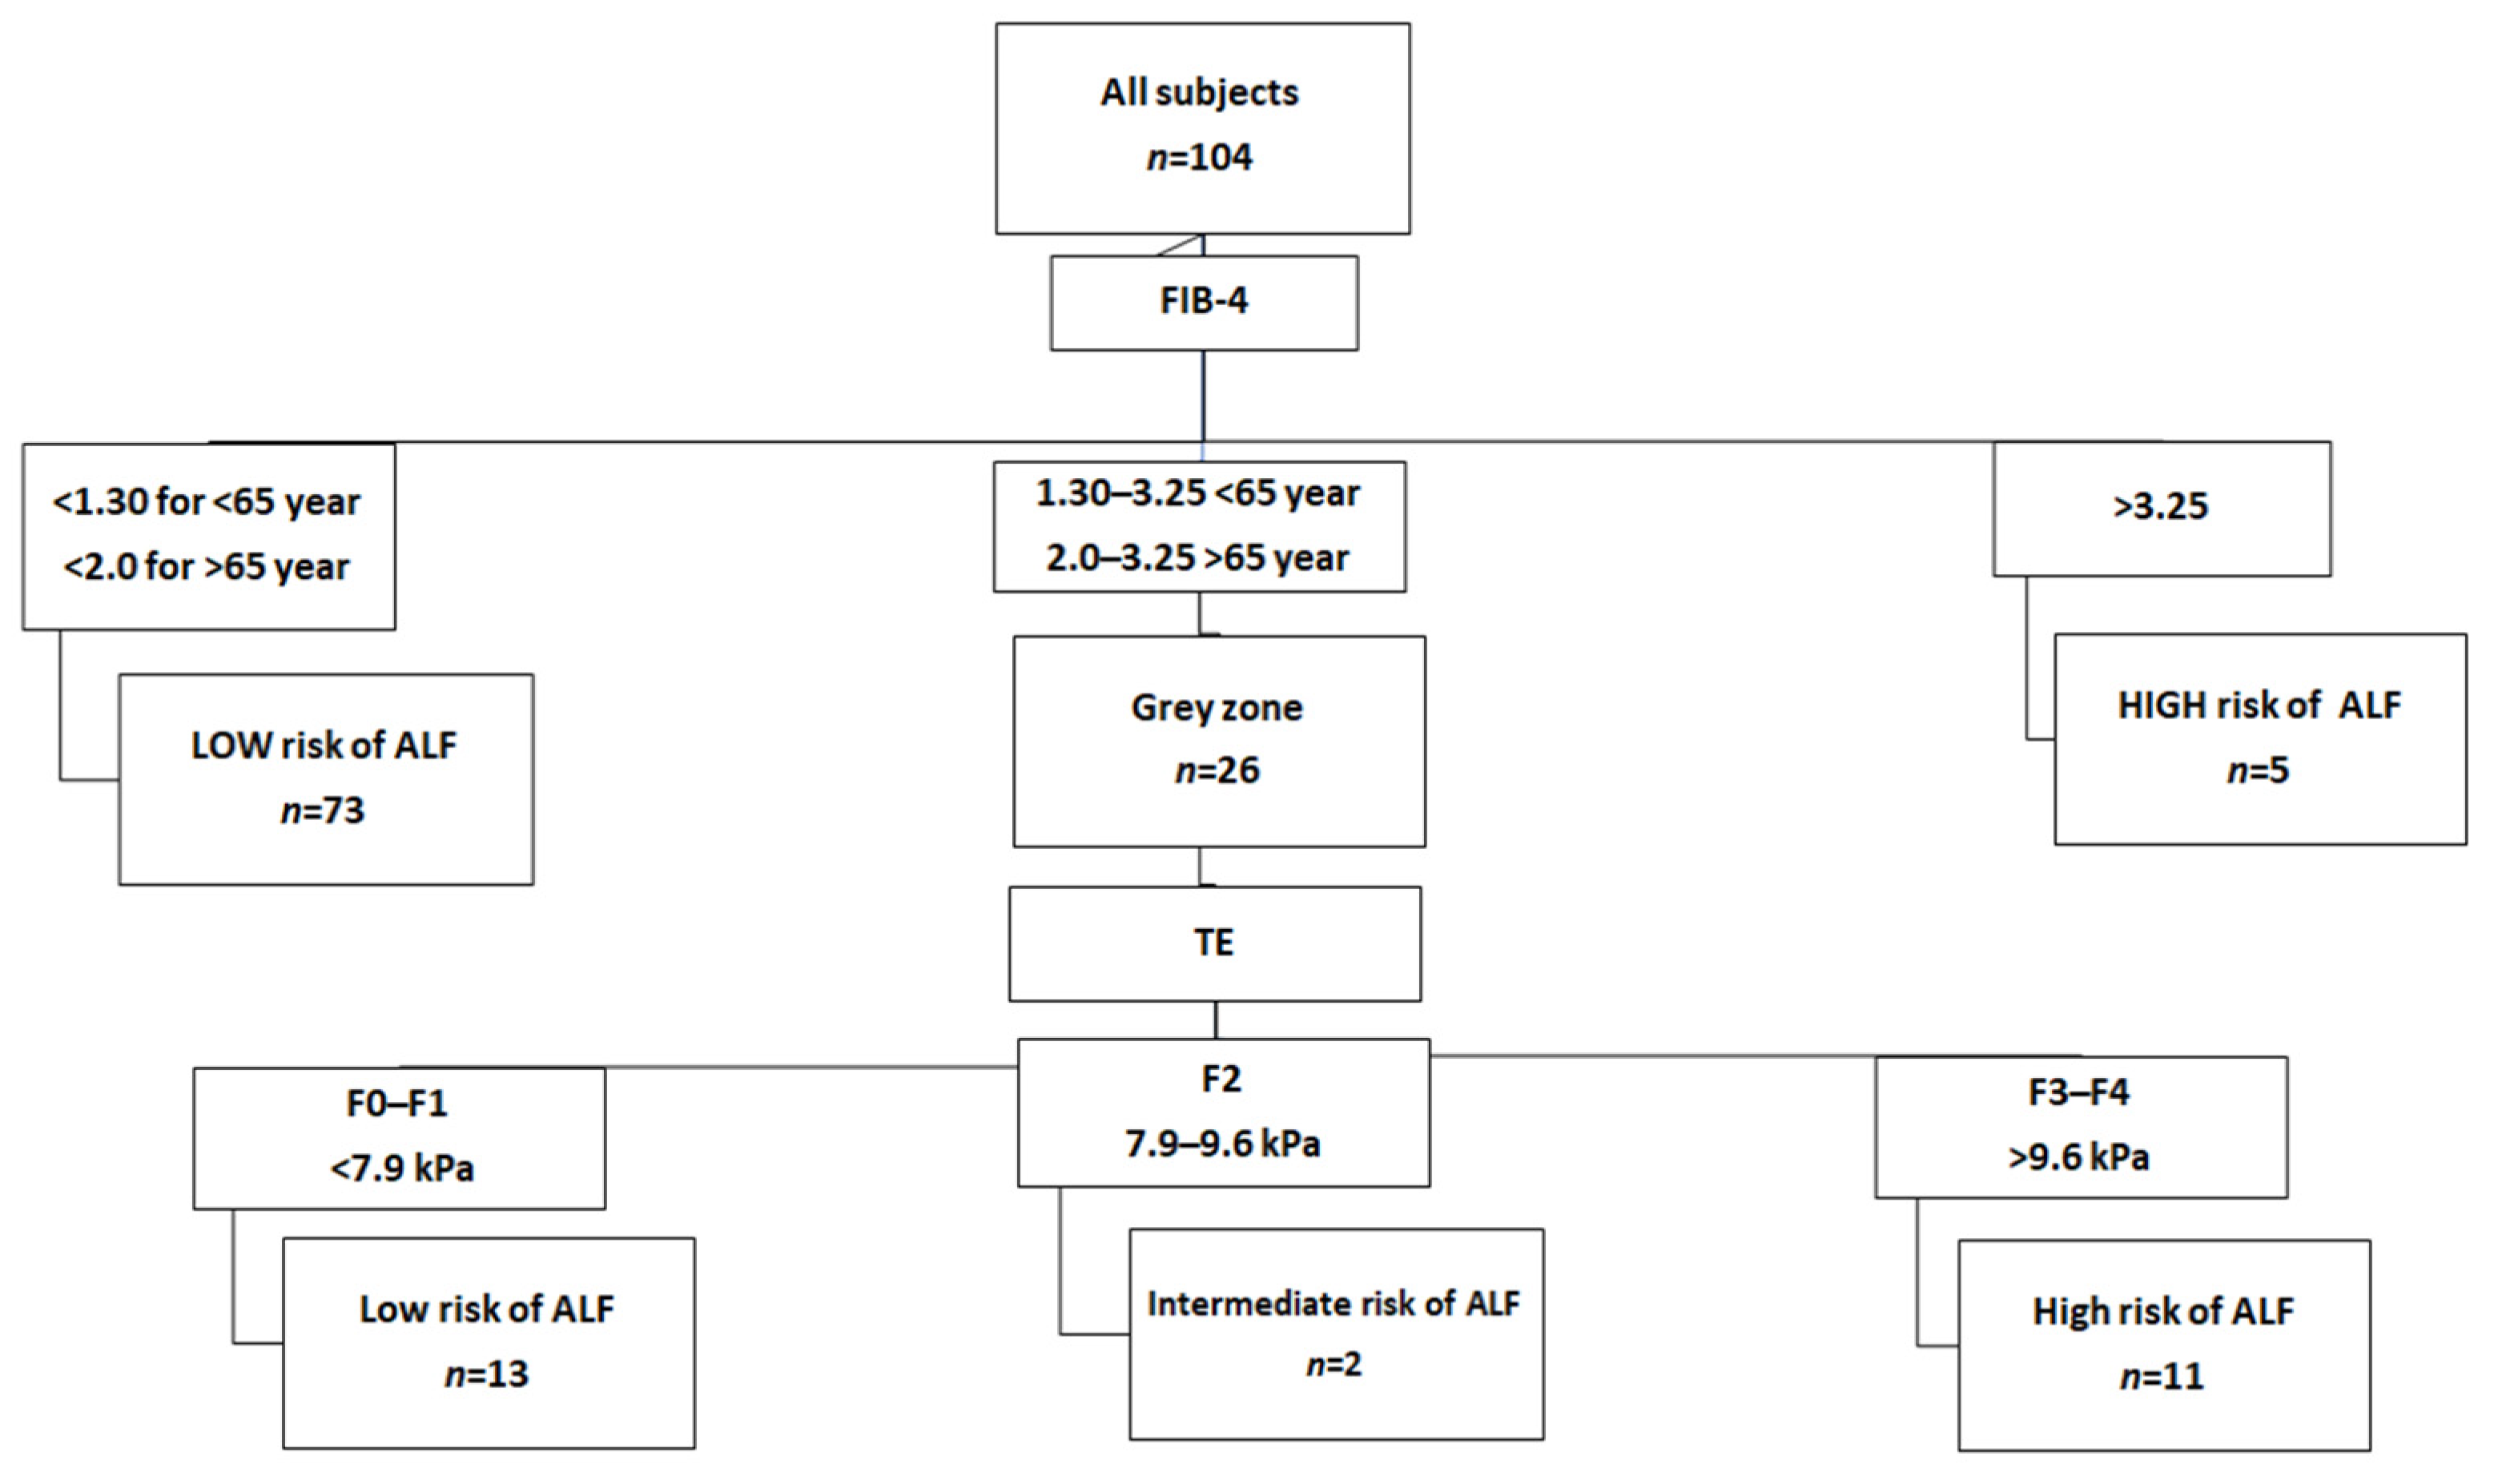
| METAVIR Score | Diagnosis | Fibroscan Cut-Off Values |
|---|---|---|
| F0–F1 | No fibrosis to mild fibrosis—portal fibrosis without septa | <7.9 kPa |
| F2 | Moderate fibrosis—portal fibrosis and few septa | 7.9–9.6 kPa |
| F3–F4 | Severe fibrosis—numerous septa without cirrhosis to Cirrhosis | >9.6 kPa |
| Index | Threshold Value | Interpretation |
|---|---|---|
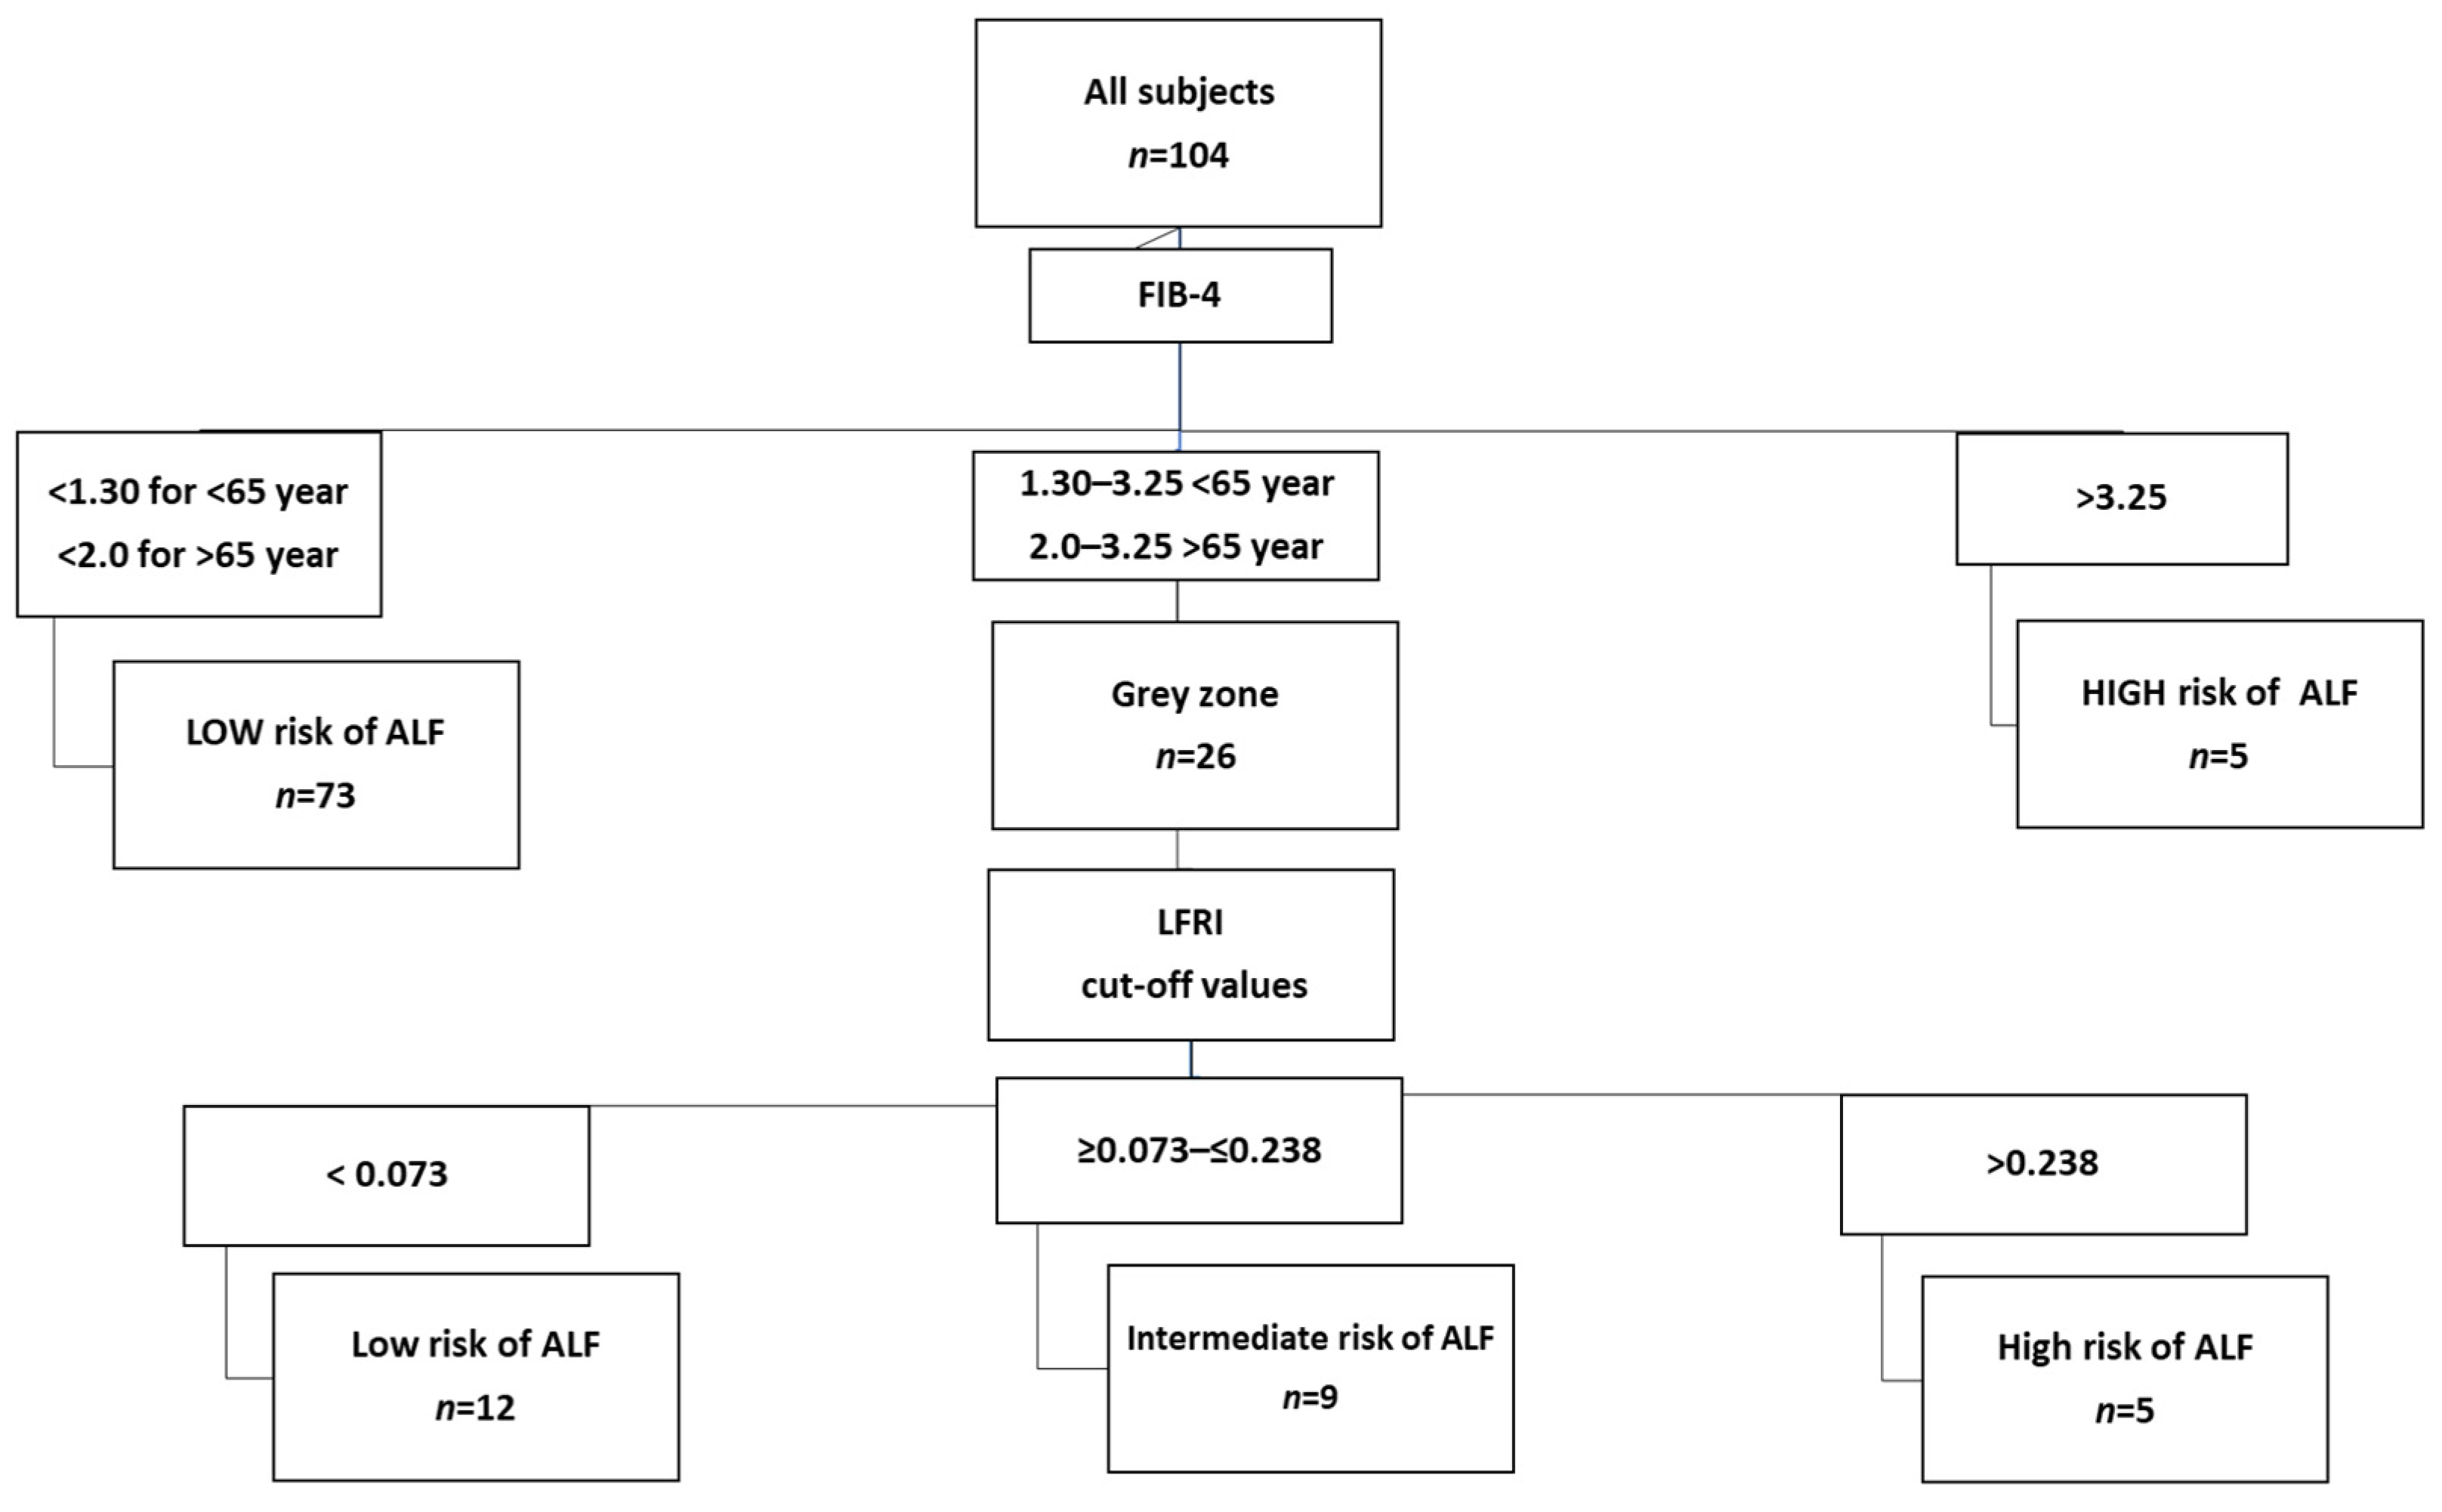
| FIB-4 | <1.30 (<65 years) <2.00 (≥65 years) | Low risk of advanced liver fibrosis |
| 1.30/2.00–3.25 | Grey zone, perform second-line test | |
| >3.25 | High risk of advanced liver fibrosis, refer to hepatologist | |
| LFRI * | <0.028 | Low risk of advanced liver fibrosis |
| ≥0.028–0.362 | Moderate risk of advanced liver fibrosis | |
| >0.362 | High risk of advanced liver fibrosis |
| Variable | Subjects (n = 104) |
|---|---|
| Age (years) | 58 (47–66) |
| Females (%) | 48 |
| BMI (kg/m2) | 31 (28–34) |
| T2D (%) | 58 |
| FPG (mmol/L) | 5.8 (5.2–7.1) |
| HbA1c (mmol/mol) | 40 (34–50) |
| HOMA-IR | 3.2 (1.8–5.1) |
| TC (mg/dL) | 203 (166–228) |
| HDL-C (mg/dL) | 51 (44–61) |
| LDL-C (mg/dL) | 118 (88–145) |
| TG (mg/dL) | 120 (88–173) |
| Non-HDL-C (mg/dL) | 144 (115–172) |
| TB (mg/dL) | 0.66 (0.48–0.87) |
| ALT (U/L) | 26 (20–40) |
| AST (U/L) | 25 (20–34) |
| GGT (U/L) | 26 (19–43) |
| CRP (mg/L) | 2.2 (1.0–3.9) |
| Variable | All Subjects n = 104 |
|---|---|
| FIB-4 | 1.09 (0.77–1.48) |
| LSM/TE (kPa) | 5.4 (4.2–8.1) |
| CAP/TE (dB/m) | 292 (260–325) |
| HA (μg/L) | 58 (52–65) |
| PIIIP (μg/L) | 18 (14–28) |
| CIV (μg/L) | 14 (12–18) |
| LN (μg/L) | 20 (16–24) |
| LFRI | 0.011 (−0.069–0.163) |
Disclaimer/Publisher’s Note: The statements, opinions and data contained in all publications are solely those of the individual author(s) and contributor(s) and not of MDPI and/or the editor(s). MDPI and/or the editor(s) disclaim responsibility for any injury to people or property resulting from any ideas, methods, instructions or products referred to in the content. |
© 2024 by the authors. Licensee MDPI, Basel, Switzerland. This article is an open access article distributed under the terms and conditions of the Creative Commons Attribution (CC BY) license (https://creativecommons.org/licenses/by/4.0/).
Share and Cite
Stefanska, A.; Bergmann, K.; Suwała, S.; Mankowska-Cyl, A.; Kozinski, M.; Junik, R.; Krintus, M.; Panteghini, M. Performance Evaluation of a Novel Non-Invasive Test for the Detection of Advanced Liver Fibrosis in Metabolic Dysfunction-Associated Fatty Liver Disease. Metabolites 2024, 14, 52. https://doi.org/10.3390/metabo14010052
Stefanska A, Bergmann K, Suwała S, Mankowska-Cyl A, Kozinski M, Junik R, Krintus M, Panteghini M. Performance Evaluation of a Novel Non-Invasive Test for the Detection of Advanced Liver Fibrosis in Metabolic Dysfunction-Associated Fatty Liver Disease. Metabolites. 2024; 14(1):52. https://doi.org/10.3390/metabo14010052
Chicago/Turabian StyleStefanska, Anna, Katarzyna Bergmann, Szymon Suwała, Aneta Mankowska-Cyl, Marek Kozinski, Roman Junik, Magdalena Krintus, and Mauro Panteghini. 2024. "Performance Evaluation of a Novel Non-Invasive Test for the Detection of Advanced Liver Fibrosis in Metabolic Dysfunction-Associated Fatty Liver Disease" Metabolites 14, no. 1: 52. https://doi.org/10.3390/metabo14010052
APA StyleStefanska, A., Bergmann, K., Suwała, S., Mankowska-Cyl, A., Kozinski, M., Junik, R., Krintus, M., & Panteghini, M. (2024). Performance Evaluation of a Novel Non-Invasive Test for the Detection of Advanced Liver Fibrosis in Metabolic Dysfunction-Associated Fatty Liver Disease. Metabolites, 14(1), 52. https://doi.org/10.3390/metabo14010052