Correction: Chaby et al. Cross-Platform Evaluation of Commercially Targeted and Untargeted Metabolomics Approaches to Optimize the Investigation of Psychiatric Disease. Metabolites 2021, 11, 609

 ,
,  ,
,  , and
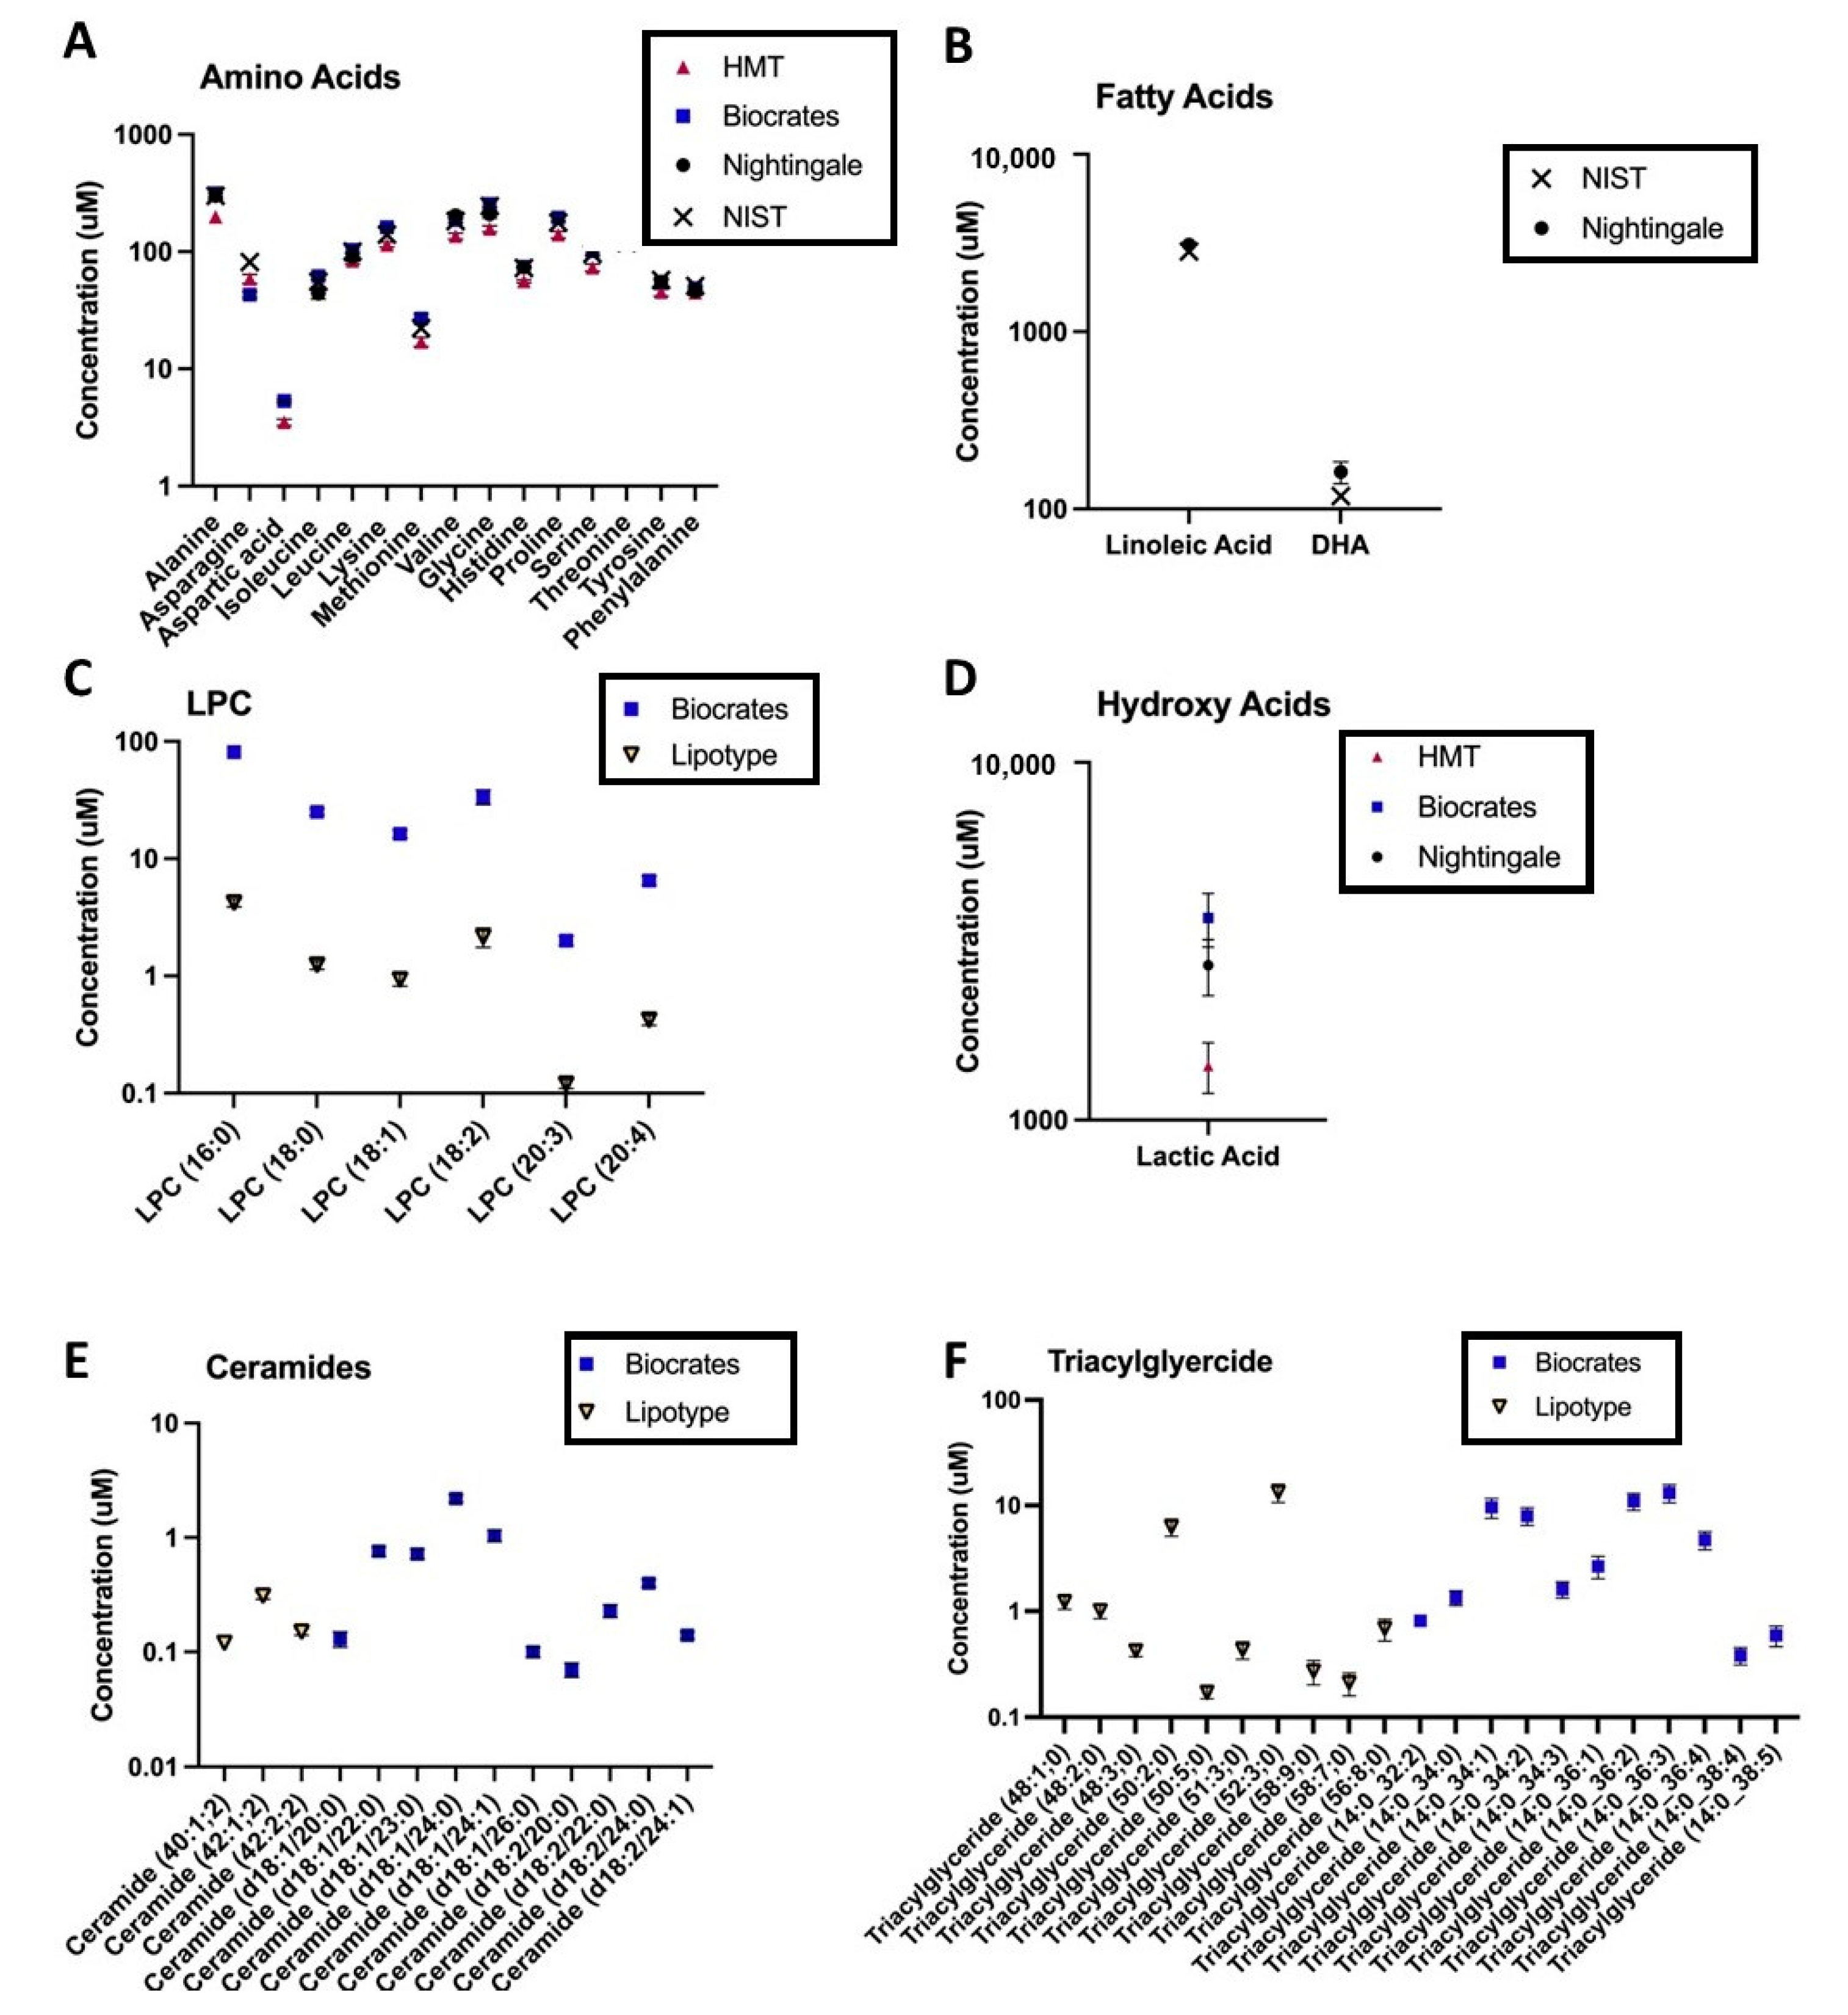
, and Figure Legend
Error in Figure/Table

| Intra-Assay Precision: Shipment 1 | |||||||||||||||||||||
|---|---|---|---|---|---|---|---|---|---|---|---|---|---|---|---|---|---|---|---|---|---|
| PTSD Average CV% | Control Average CV% | Count | Range | SD | PTSD Average CV% | Control Average CV% | Count | SD | PTSD Average CV% | Control Average CV% | Count | SD | PTSD Average CV% | Control Average CV% | Count | SD | PTSD Average CV% | Control Average CV% | Count | SD | |
| Metabolite Class | Biocrates | HMT | Nightingale | Lipotype | Metabolon | ||||||||||||||||
| Acylcarnitines | 10.33 | 9.88 | 14 | 2.07–76.09 | 15.67 | 5.66 | 5.81 | 35 | 7.43 | 9.03 | 8.39 | 21 | 7.70 | ||||||||
| Amino Acids | 3.53 | 8.12 | 40 | 0.87–19.01 | 3.14 | 6.85 | 6.93 | 22 | 2.56 | 2.78 | 6.01 | 9 | 3.76 | 8.84 | 9.56 | 52 | 8.22 | ||||
| Amino Acid Related | 3.44 | 8.71 | 1.73–12.88 | 3.21 | |||||||||||||||||
| Carboxylic Acids | 3.85 | 7.20 | 2 | 2.70–8.02 | 2.25 | 5.10 | 5.62 | 8 | 2.83 | 2.99 | 6.66 | 3 | 2.38 | 11.32 | 9.13 | 101 | 13.59 | ||||
| Cholesteryl ester | 8.46 | 14.69 | 18 | 3.42–48.13 | 8.44 | 4.23 | 13.30 | 13 | 6.84 | 4.63 | 4.00 | 26 | 2.20 | ||||||||
| Diglycerides | 8.46 | 12.28 | 14 | 1.95–36.34 | 7.53 | 4.84 | 9.80 | 2 | 3.38 | 4.29 | 4.00 | 19 | 2.73 | ||||||||
| Diazines | 21.00 | 18.45 | 3 | 21.16 | 15.39 | 13.46 | 5 | 12.60 | |||||||||||||
| Organonitrogen compounds | 7.29 | 9.37 | 13 | 5.02 | 15.55 | 11.3 | 14 | 12.61 | |||||||||||||
| Purine nucleotides | 9.69 | 16.16 | 5 | 9.32 | 14.18 | 12.48 | 10 | 8.09 | |||||||||||||
| Organooxygen compounds | 12.03 | 9.63 | 6 | 7.35 | 1.04 | 6.44 | 2 | 4.07 | 9.19 | 9.90 | 6 | 8.38 | |||||||||
| Hydroxy acids and derivatives | 4.04 | 6.79 | 5 | 2.47 | 0.88 | 3.05 | 1 | NA | 11.28 | 11.80 | 16 | 10.81 | |||||||||
| Keto acids and derivatives | 1.62 | 5.52 | 3 | 2.24 | 4.29 | 26.20 | 2 | 18.87 | 8.35 | 8.18 | 13 | 4.94 | |||||||||
| Ceramides | 6.53 | 8.60 | 25 | 0.59–29.33 | 5.33 | 11.36 | 10.43 | 5 | 4.62 | 5.03 | 6.77 | 2 | 3.06 | 7.22 | 7.10 | 11 | 5.55 | ||||
| Lactosylceramide | 19.98 | 15.25 | 13 | 13.62 | 10.15 | 14.99 | 12 | 10.36 | |||||||||||||
| Glucosylceramide | 21.84 | 19.55 | 13 | 11.15 | |||||||||||||||||
| Dihexosylceramides | 10.30 | 9.78 | 10 | 2.45–34.65 | 7.59 | ||||||||||||||||
| Trihexosylceramides | 14.16 | 17.94 | 6 | 4.69–43.82 | 11.60 | ||||||||||||||||
| Dihydroceramide | 19.07 | 17.15 | 12 | 14.73 | |||||||||||||||||
| Hexosylceramide | 9.56 | 11.32 | 19 | 1.33–27.20 | 5.81 | 6.28 | 8.33 | 12 | 4.34 | ||||||||||||
| Triglycerides | 7.33 | 13.27 | 235 | 0.78–38.42 | 3.72 | 4.88 | 6.49 | 32 | 2.46 | 1.92 | 5.96 | 21 | 2.19 | ||||||||
| Hormones/Steroids | 2.53 | 6.43 | 3 | 1.48–7.15 | 2.34 | 5.88 | 6.28 | 9 | 4.77 | 8.65 | 6.18 | 26 | 3.79 | ||||||||
| Fatty Acids | 8.10 | 8.16 | 7 | 3.63–11.43 | 2.60 | 6.92 | 9.11 | 32 | 4.97 | 27.57 | 3.89 | 2 | 15.39 | 3.58 | 3.53 | 29 | 2.15 | ||||
| Fatty Acyls | 28.92 | 29.75 | 4 | 19.76 | 18.17 | 13.20 | 83 | 12.09 | |||||||||||||
| Biogenic Amines | 4.74 | 10.52 | 3 | 3.19–11.69 | 3.47 | ||||||||||||||||
| Bile Acids | 5.84 | 7.73 | 12 | 2.48–12.04 | 2.77 | 4.66 | 6.47 | 4 | 7.22 | 11.42 | 8.94 | 22 | 6.95 | ||||||||
| Indoles and Derivatives | 3.36 | 10.40 | 3 | 2.69–14.21 | 4.56 | 6.51 | 7.37 | 1 | NA | 7.45 | 5.82 | 9 | 3.97 | ||||||||
| Lysophosphatidyl-cholines (LPC) | 13.05 | 11.32 | 14 | 0.91–36.05 | 10.66 | 3.34 | 3.71 | 27 | 1.69 | 4.38 | 14.44 | 6 | 5.36 | 7.28 | 10.10 | 15 | 5.14 | ||||
| Glycerophosphocholines | 7.09 | 7.76 | 19 | 10.79 | |||||||||||||||||
| Phosphatidyl-cholines (PC) | 7.98 | 9.78 | 73 | 1.78–67.84 | 9.56 | 7.96 | 11.15 | 63 | 5.22 | 8.12 | 5.98 | 18 | 4.44 | ||||||||
| Sphingomyelins | 3.89 | 7.68 | 15 | 1.88–11.73 | 2.64 | 5.79 | 8.62 | 12 | 2.89 | 3.45 | 3.05 | 12 | 1.79 | ||||||||
| Sphingolipids | 14.28 | 13.47 | 12 | 10.86 | 6.13 | 7.79 | 2 | 2.11 | |||||||||||||
| Sphinganine | 6 | ||||||||||||||||||||
| Sphingosine | 11.76 | 12.89 | 6 | 9.48 | |||||||||||||||||
| Glycerophospholipids | 10.41 | 9.67 | 15 | 8.70 | 19.61 | 22.64 | 7 | 16.45 | |||||||||||||
| Glycerolipids (Monoacylglycerol) | 21.69 | 26.95 | 25 | 14.48 | |||||||||||||||||
| Carboximidic acids and derivatives | 4.93 | 4.33 | 1 | NA | 15.21 | 17.34 | 4 | 10.22 | |||||||||||||
| lyso-Phosphatidylethanolamine (LPE) | 10.36 | 8.40 | 22 | 7.95 | 8.83 | 15.24 | 9 | 5.24 | 5.18 | 6.38 | 8 | 4.88 | |||||||||
| Phosphatidylcholine (-ether) (LPC-O) | 13.02 | 16.40 | 41 | 8.64 | |||||||||||||||||
| Phosphatidylethanolamine (PE) | 9.22 | 15.06 | 15 | 6.79 | 4.38 | 8.11 | 12 | 6.46 | |||||||||||||
| Phosphatidylethanolamine (-ether) (LPE-O) | 11.54 | 15.20 | 16 | 7.76 | |||||||||||||||||
| Phosphatidylinositol (LPI) | 7.37 | 8.44 | 14 | 6.05 | 8.95 | 16.88 | 15 | 7.62 | 10.83 | 18.82 | 6 | 8.90 | |||||||||
| Lyso-Phosphatidylserine (LPS) | 11.21 | 15.84 | 7 | 8.97 | |||||||||||||||||
| Glycerophosphoglycerols (LPG) | 9.23 | 10.92 | 14 | 6.71 | |||||||||||||||||
| Vitamins and Cofactors | 1.09 | 10.44 | 1 | NA | 2.37 | 5.87 | 1 | NA | |||||||||||||
| Alkaloids | 4.69 | 13.74 | 1 | NA | 3.86 | 2.48 | 2 | 0.80 | |||||||||||||
| Amine (Oxides) | 6.92 | 8.23 | 1 | NA | 45.46 | 12.49 | 1 | NA | |||||||||||||
| Carbohydrates and Related | 2.50 | 6.33 | 1 | NA | 10.81 | 14.37 | 34 | 13.62 | |||||||||||||
| Cresols | 2.07 | 7.14 | 1 | NA | |||||||||||||||||
| Imidazopyrimidines | 11.35 | 5.44 | 1 | NA | 10.32 | 7.60 | 17 | 8.68 | |||||||||||||
| 5′-deoxyribonucleosides | 19.82 | 18.62 | 1 | NA | 7.84 | 8.63 | 1 | NA | |||||||||||||
| Nucleoside and nucleotide analogues | 13.05 | 3.4 | 1 | NA | |||||||||||||||||
| Pyrimidine nucleosides | 1.33 | 7.94 | 1 | NA | 9.24 | 9.59 | 7 | 7.33 | |||||||||||||
| Pyridines and derivatives | 6.69 | 7.90 | 10 | 5.76 | |||||||||||||||||
| Quinolines and derivatives | 11.85 | 13.64 | 3 | 7.42 | |||||||||||||||||
| Phenols | 9.22 | 4.79 | 3 | 5.40 | |||||||||||||||||
| Prenol lipids | 17.87 | 8.77 | 7 | 8.13 | |||||||||||||||||
| Imidazole ribonucleosides and ribonucleotides | 12.17 | 5.5 | 1 | NA | |||||||||||||||||
| Benzene and substituted derivatives | 12.72 | 9.49 | 14 | 10.36 | |||||||||||||||||
| Phenylpropanoic acids | 6.52 | 5.82 | 9 | 8.63 | |||||||||||||||||
| Tetrapyrroles and derivatives | 3.45 | 11.6 | 2 | 5.43 | |||||||||||||||||
| Cholesterol and derivatives | 7.53 | 9.5 | 2 | 4.40 | |||||||||||||||||
| Non-metal oxoanionic compounds | 2.94 | 3.17 | 2 | 1.81 | |||||||||||||||||
| Organic sulfuric acids and derivatives | 6.1 | 4.03 | 22 | 3.49 | |||||||||||||||||
| Organic sulfonic acids and derivatives | 2.47 | 5.59 | 2 | 3.48 | |||||||||||||||||
| Organic carbonic acids and derivatives | 6.33 | 9.48 | 2 | 3.88 | |||||||||||||||||
| Organic phosphoric acids and derivatives | 9.53 | 7.87 | 1 | NA | |||||||||||||||||
| Benzothiazepines | 2.29 | 6.17 | 2 | 5.83 | |||||||||||||||||
| Bilirubins | 9.03 | 5.41 | 2 | 6.66 | |||||||||||||||||
| Dihydrofurans | 6.94 | 3.07 | 2 | 3.68 | |||||||||||||||||
| Alkyl halides | 2.9 | 3.98 | 2 | 1.49 | |||||||||||||||||
| Sulfinic acids and derivatives | 11.13 | 16.04 | 1 | NA | |||||||||||||||||
| Azoles | 11.11 | 10.6 | 7 | 5.90 | |||||||||||||||||
| Azolidines | 4.34 | 6.92 | 1 | NA | |||||||||||||||||
| Cinnamic acids and derivatives | 4.07 | 13.92 | 1 | NA | |||||||||||||||||
| Peptidomimetics | 20.02 | 14.52 | 1 | NA | |||||||||||||||||
| Piperidines | 14.81 | 16.27 | 1 | NA | |||||||||||||||||
| Pyrrolidines | 4.09 | 5.48 | 1 | NA | |||||||||||||||||
| Coumarins and derivatives | 0 | 14.1 | 1 | NA | |||||||||||||||||
| Inter-assay Precision: Shipment 1 vs. Shipment 2 | |||||||||||||||
|---|---|---|---|---|---|---|---|---|---|---|---|---|---|---|---|
| PTSD Average CV% | Control Average CV% | Standard deviation (SD) | PTSD Average CV% | Control Average CV% | Standard deviation (SD) | PTSD Average CV% | Control Average CV% | Standard deviation (SD) | PTSD Average CV% | Control Average CV% | Standard deviation (SD) | PTSD Average CV% | Control Average CV% | Standard deviation (SD) | |
| Metabolite Class | Biocrates | HMT | Nightingale | Lipotype | Metabolon | ||||||||||
| Acylcarnitines | 7.21 | 11.48 | 2.78 | 12.21 | 12.10 | 8.64 | 15.27 | 13.52 | 9.93 | ||||||
| Amino Acids | 5.88 | 11.95 | 3.57 | 9.10 | 9.79 | 4.02 | 4.80 | 7.37 | 3.48 | 12.84 | 14.21 | 8.03 | |||
| Amino Acid Related | 7.63 | 13.90 | 6.86 | ||||||||||||
| Carboxylic Acids | 7.54 | 13.71 | 4.05 | 10.60 | 8.90 | 5.83 | 5.92 | 7.90 | 1.51 | 15.38 | 13.91 | 12.75 | |||
| Cholesteryl ester | 11.71 | 14.47 | 2.58 | 8.07 | 8.93 | 5.25 | 10.16 | 8.68 | 7.77 | ||||||
| Diglycerides | 17.42 | 22.27 | 10.62 | 9.13 | 13.25 | 6.27 | 10.97 | 10.06 | 4.53 | ||||||
| Diazines | 16.42 | 21.57 | 14.04 | 33.22 | 29.05 | 24.92 | |||||||||
| Organonitrogen compounds | 13.31 | 11.50 | 8.24 | 14.25 | 13.66 | 7.67 | |||||||||
| Purine nucleotides | 30.06 | 38.64 | 18.99 | 11.49 | 11.84 | 5.98 | |||||||||
| Organooxygen compounds | 31.07 | 37.08 | 13.17 | 4.89 | 6.94 | 2.62 | 31.34 | 26.85 | 28.72 | ||||||
| Hydroxy acids and derivatives | 10.88 | 11.10 | 6.05 | 1.88 | 3.57 | NA | 17.76 | 17.90 | 12.03 | ||||||
| Keto acids and derivatives | 14.10 | 16.66 | 2.83 | 10.58 | 19.49 | 9.58 | 15.64 | 13.55 | 8.45 | ||||||
| Ceramides | 16.04 | 19.50 | 8.65 | 11.34 | 15.68 | 4.34 | 6.58 | 6.47 | 0.78 | 10.10 | 7.88 | 4.44 | |||
| Lactosylceramide | 15.32 | 16.79 | 8.06 | 16.61 | 17.51 | 13.28 | |||||||||
| Glucosylceramide | 19.30 | 23.43 | 9.77 | ||||||||||||
| Dihexosylceramides | 11.99 | 17.82 | 5.18 | ||||||||||||
| Trihexosylceramides | 17.08 | 23.39 | 4.52 | ||||||||||||
| Dihydroceramide | 18.63 | 21.21 | 12.20 | ||||||||||||
| Hexosylceramide | 14.23 | 17.72 | 6.01 | 11.44 | 10.57 | 3.49 | |||||||||
| Triglycerides | 15.42 | 19.35 | 7.56 | 8.34 | 6.67 | 2.20 | 9.3 | 7.65 | 2.61 | ||||||
| Hormones/Steroids | 15.59 | 18.54 | 9.04 | 8.08 | 10.35 | 5.86 | 15.39 | 13.53 | 5.84 | ||||||
| Fatty Acids | 13.80 | 18.43 | 7.40 | 24.26 | 27.33 | 33.29 | 53.25 | 9.39 | 26.15 | 6.89 | 6.60 | 3.39 | |||
| Fatty Acyls | 4.21 | 4.99 | NA | 20.94 | 17.94 | 9.44 | |||||||||
| Biogenic Amines | 6.37 | 18.78 | 10.04 | ||||||||||||
| Bile Acids | 21.36 | 23.51 | 28.05 | 5.99 | 10.49 | 10.09 | 21.36 | 20.83 | 11.05 | ||||||
| Indoles and Derivatives | 8.60 | 15.22 | 4.59 | 13.11 | 12.47 | 5.93 | |||||||||
| Lysophosphatidyl-cholines (LPC) | 13.24 | 17.78 | 8.17 | 6.45 | 8.75 | 3.38 | 9.13 | 8.85 | 0.77 | 17.64 | 17.23 | 12.98 | |||
| Glycerophosphocholines | 6.56 | 7.21 | 2.76 | ||||||||||||
| Phosphatidyl-cholines (PC) | 10.11 | 14.43 | 6.97 | 10.24 | 13.18 | 10.69 | 13.65 | 13.98 | 13.68 | ||||||
| Sphingomyelins | 9.34 | 12.99 | 4.28 | 6.16 | 7.19 | 2.09 | 6.51 | 7.58 | 4.35 | ||||||
| Sphingolipids | 20.21 | 20.23 | 10.83 | 9.90 | 12.50 | 1.60 | |||||||||
| Sphinganine | |||||||||||||||
| Sphingosine | 19.34 | 19.49 | 10.01 | ||||||||||||
| Glycerophospholipids | 19.51 | 22.85 | 25.01 | 22.79 | 26.91 | 17.68 | |||||||||
| Glycerolipids (Monoacylglycerol) | 35.32 | 34.69 | 15.53 | ||||||||||||
| Carboximidic acids and derivatives | 23.26 | 3.55 | NA | 12.92 | 17.33 | 5.22 | |||||||||
| lyso-Phosphatidylethanolamine (LPE) | 11.88 | 13.87 | 17.60 | 9.92 | 9.85 | 1.89 | 22.80 | 19.85 | 12.54 | ||||||
| Phosphatidylcholine (-ether) (LPC-O) | 14.35 | 15.00 | 6.39 | ||||||||||||
| Phosphatidylethanolamine (PE) | 12.50 | 14.70 | 6.08 | 12.16 | 12.16 | 8.38 | |||||||||
| Phosphatidylethanolamine (-ether) (LPE-O) | 10.14 | 11.68 | 3.76 | ||||||||||||
| Phosphatidylinositol (LPI) | 9.81 | 10.24 | 6.62 | 13.27 | 13.27 | 7.59 | 39.03 | 49.61 | 11.64 | ||||||
| Lyso-Phosphatidylserine (LPS) | 19.00 | 20.64 | 7.74 | ||||||||||||
| Glycerophosphoglycerols (LPG) | 12.34 | 15.52 | 7.60 | ||||||||||||
| Vitamins and Cofactors | 7.59 | 13.77 | NA | 6.44 | 13.52 | NA | |||||||||
| Alkaloids | 17.05 | 46.83 | 21.81 | ||||||||||||
| Amine (Oxides) | 6.55 | 11.15 | NA | 28.84 | 24.42 | NA | |||||||||
| Carbohydrates and Related | 6.61 | 13.25 | NA | 23.31 | 22.25 | 22.84 | |||||||||
| Cresols | 4.39 | 11.88 | NA | ||||||||||||
| Imidazopyrimidines | 19.81 | 26.41 | 14.25 | ||||||||||||
| 5′-deoxyribonucleosides | 12.33 | 9.07 | 5.31 | 10.04 | 13.25 | NA | |||||||||
| Nucleoside and nucleotide analogues | 44.29 | 15.88 | NA | ||||||||||||
| Pyrimidine nucleosides | 21.49 | 19.06 | 15.04 | ||||||||||||
| Pyridines and derivatives | 11.51 | 11.75 | 5.71 | ||||||||||||
| Quinolines and derivatives | 20.42 | 20.85 | 13.19 | ||||||||||||
| Phenols | 22.06 | 21.35 | 6.87 | ||||||||||||
| Prenol lipids | 16.43 | 13.54 | 6.28 | ||||||||||||
| Imidazole ribonucleosides and ribonucleotides | 7.24 | 7.26 | NA | ||||||||||||
| Benzene and substituted derivatives | 23.37 | 23.26 | 13.29 | ||||||||||||
| Phenylpropanoic acids | 17.47 | 23.77 | 12.32 | ||||||||||||
| Tetrapyrroles and derivatives | 9.73 | 17.57 | 5.40 | ||||||||||||
| Cholesterol and derivatives | 8.27 | 8.43 | 2.92 | ||||||||||||
| Non-metal oxoanionic compounds | 4.07 | 4.04 | 0.41 | ||||||||||||
| Organic sulfuric acids and derivatives | 23.64 | 25.3 | 27.37 | ||||||||||||
| Organic sulfonic acids and derivatives | 7.08 | 10.9 | 6.10 | ||||||||||||
| Organic carbonic acids and derivatives | 7.67 | 9 | 4.39 | ||||||||||||
| Organic phosphoric acids and derivatives | 8.74 | 8.28 | NA | ||||||||||||
| Benzothiazepines | 22.99 | 22.49 | 2.09 | ||||||||||||
| Bilirubins | 10.37 | 13.28 | NA | ||||||||||||
| Dihydrofurans | 10.09 | 6.84 | 2.42 | ||||||||||||
| Alkyl halides | 7.17 | 5.97 | 2.77 | ||||||||||||
| Sulfinic acids and derivatives | 9.57 | 21.87 | NA | ||||||||||||
| Azoles | 17.19 | 12.88 | 7.62 | ||||||||||||
| Azolidines | 14.11 | 17 | NA | ||||||||||||
| Cinnamic acids and derivatives | 48.32 | 49.73 | NA | ||||||||||||
| Peptidomimetics | 22.76 | 21.34 | NA | ||||||||||||
| Piperidines | 53.36 | 63.22 | NA | ||||||||||||
| Pyrrolidines | 10.55 | 13.2 | NA | ||||||||||||
| Coumarins and derivatives | 30.57 | 17.89 | NA | ||||||||||||
| Accuracy (%) | Biocrates | HMT | Nightingale | ||||
|---|---|---|---|---|---|---|---|
| Analyte | NIST Value (uM) | Reported Value (uM) | Percent Difference | Reported Value (uM) | Percent Difference | Reported Value (uM) | Percent Difference |
| Fatty Acids | |||||||
| C18:2 n-6 (Z,Z)-9,12-Octadecadienoic Acid (Linoleic Acid) | 2838 | 2960 | 4.30% | ||||
| C22:6 n-3. (Z,Z,Z,Z,Z,Z)-4,7,10,13,16,19-Docosahexaenoic Acid (DHA) | 118 | 136 | 15.25% | ||||
| Amino Acids | |||||||
| Alanine | 300 | 331 | 10.17% | 211 | −29.61% | 312.246 | 4.08% |
| Glycine | 245 | 288 | 17.72% | 250 | 1.97% | 240.87 | −1.69% |
| Histidine | 72.6 | 80 | 10.08% | 59 | −18.25% | 70.0707 | −3.48% |
| Isoleucine | 55.5 | 66 | 18.92% | 46 | −17.02% | 44.604 | −19.63% |
| Leucine | 100.4 | 114 | 13.05% | 102 | 1.25% | 87.7893 | −12.56% |
| Lysine | 140 | 151 | 7.73% | 129 | −7.60% | ||
| Methionine | 22.3 | 22 | −0.94% | 14 | −38.50% | ||
| Proline | 177 | 199 | 12.30% | 138 | −22.19% | ||
| Serine | 95.9 | 98 | 2.14% | 69 | −27.57% | ||
| Threonine | 119.5 | 127 | 6.10% | 92 | −23.08% | ||
| Tyrosine | 57.3 | 61 | 6.48% | 49 | −13.95% | 61.8318 | 7.91% |
| Valine | 182.2 | 174 | −4.40% | 152 | −16.30% | 185.06 | 1.57% |
| Arginine | 81.4 | 95 | 16.45% | ||||
| Cysteine | 44.3 | 46 | 4.50% | ||||
| Cystine | 7.8 | 8.0 | 2.76% | ||||
| Phenylalanine | 51 | 57 | 12.54% | 47 | −8.27% | 53.0223 | 3.97% |
| Clinical Markers | |||||||
| Creatinine | 60 | 65 | 7.69% | 43 | −28.14% | 58.1642 | −3.06% |
| Glucose | 4560 | 4679.41 | 2.62% | ||||
| Homocysteine | 8.5 | 8.5 | 0.58% | ||||
| Cortisol | 0.23 | 0.19 | −17.92% | ||||
| Cholesterol | 3917 | 3620 | −7.58% | ||||
Text Correction
Reference
- Chaby, L.E.; Lasseter, H.C.; Contrepois, K.; Salek, R.M.; Turck, C.W.; Thompson, A.; Vaughan, T.; Haas, M.; Jeromin, A. Cross-Platform Evaluation of Commercially Targeted and Untargeted Metabolomics Approaches to Optimize the Investigation of Psychiatric Disease. Metabolites 2021, 11, 609. [Google Scholar] [CrossRef] [PubMed]
Disclaimer/Publisher’s Note: The statements, opinions and data contained in all publications are solely those of the individual author(s) and contributor(s) and not of MDPI and/or the editor(s). MDPI and/or the editor(s) disclaim responsibility for any injury to people or property resulting from any ideas, methods, instructions or products referred to in the content. |
© 2023 by the authors. Licensee MDPI, Basel, Switzerland. This article is an open access article distributed under the terms and conditions of the Creative Commons Attribution (CC BY) license (https://creativecommons.org/licenses/by/4.0/).
Share and Cite
Chaby, L.E.; Lasseter, H.C.; Contrepois, K.; Salek, R.M.; Turck, C.W.; Thompson, A.; Vaughan, T.; Haas, M.; Jeromin, A. Correction: Chaby et al. Cross-Platform Evaluation of Commercially Targeted and Untargeted Metabolomics Approaches to Optimize the Investigation of Psychiatric Disease. Metabolites 2021, 11, 609. Metabolites 2023, 13, 933. https://doi.org/10.3390/metabo13080933
Chaby LE, Lasseter HC, Contrepois K, Salek RM, Turck CW, Thompson A, Vaughan T, Haas M, Jeromin A. Correction: Chaby et al. Cross-Platform Evaluation of Commercially Targeted and Untargeted Metabolomics Approaches to Optimize the Investigation of Psychiatric Disease. Metabolites 2021, 11, 609. Metabolites. 2023; 13(8):933. https://doi.org/10.3390/metabo13080933
Chicago/Turabian StyleChaby, Lauren E., Heather C. Lasseter, Kévin Contrepois, Reza M. Salek, Christoph W. Turck, Andrew Thompson, Timothy Vaughan, Magali Haas, and Andreas Jeromin. 2023. "Correction: Chaby et al. Cross-Platform Evaluation of Commercially Targeted and Untargeted Metabolomics Approaches to Optimize the Investigation of Psychiatric Disease. Metabolites 2021, 11, 609" Metabolites 13, no. 8: 933. https://doi.org/10.3390/metabo13080933
APA StyleChaby, L. E., Lasseter, H. C., Contrepois, K., Salek, R. M., Turck, C. W., Thompson, A., Vaughan, T., Haas, M., & Jeromin, A. (2023). Correction: Chaby et al. Cross-Platform Evaluation of Commercially Targeted and Untargeted Metabolomics Approaches to Optimize the Investigation of Psychiatric Disease. Metabolites 2021, 11, 609. Metabolites, 13(8), 933. https://doi.org/10.3390/metabo13080933