Abstract
This study aimed to apply an incremental tethered swimming test (ITT) with workloads (WL) based on individual rates of front crawl mean tethered force (Fmean) for the identification of the upper boundary of heavy exercise (by means of respiratory compensation point, RCP), and therefore to describe oxygen uptake kinetics (VO2k) and time limit (tLim) responses to WL corresponding to peak oxygen uptake (WLVO2peak). Sixteen swimmers of both sexes (17.6 ± 3.8 years old, 175.8 ± 9.2 cm, and 68.5 ± 10.6 kg) performed the ITT until exhaustion, attached to a weight-bearing pulley–rope system for the measurements of gas exchange threshold (GET), RCP, and VO2peak. The WL was increased by 5% from 30 to 70% of Fmean at every minute, with Fmean being measured by a load cell attached to the swimmers during an all-out 30 s front crawl bout. The pulmonary gas exchange was sampled breath by breath, and the mathematical description of VO2k used a first-order exponential with time delay (TD) on the average of two rest-to-work transitions at WLVO2peak. The mean VO2peak approached 50.2 ± 6.2 mL·kg−1·min−1 and GET and RCP attained (respectively) 67.4 ± 7.3% and 87.4 ± 3.4% VO2peak. The average tLim was 329.5 ± 63.6 s for both sexes, and all swimmers attained VO2peak (100.4 ± 3.8%) when considering the primary response of VO2 (A1′ = 91.8 ± 6.7%VO2peak) associated with the VO2 slow component (SC) of 10.7 ± 6.7% of end-exercise VO2, with time constants of 24.4 ± 9.8 s for A1′ and 149.3 ± 29.1 s for SC. Negative correlations were observed for tLim to VO2peak, WLVO2peak, GET, RCP, and EEVO2 (r = −0.55, −0.59, −0.58, −0.53, and −0.50). Thus, the VO2k during tethered swimming at WLVO2peak reproduced the physiological responses corresponding to a severe domain. The findings also demonstrated that tLim was inversely related to aerobic conditioning indexes and to the ability to adjust oxidative metabolism to match target VO2 demand during exercise.
1. Introduction
Swimming tethered by an inelastic wire attached to a resistance, which prevents swimmer displacement in water, has offered a realistic condition to simulate unimpeded swimming (i.e., free condition) [1], therefore enabling the measurements of force during stroke (arms) and kicking (legs) movements [2,3,4,5] as well as the assessment of the physiological responses while simulating incremental or constant exercise modes [6,7,8,9]. From the physiological assessments, the results have demonstrated similarities between tethered and unimpeded swimming conditions with regard to the responses of cardio-circulatory [10] and respiratory [6,11,12] systems, blood lactate concentration [7], and energetics contribution [8].
In spite of these physiological findings, tethered swimming would still need to demonstrate reliability in contextualizing the physiological information during different levels of loads applied to graded swimming intensity, thus ensuring it is validated as an ergometer. In the context of incremental exercise, tethered swimming has been considered a reliable ergometer to ensure the temporal resolution between breath-by-breath pulmonary gas exchange response and loading management during a ramp test, which was designed to define the exercise domains from the assessment of gas exchange threshold (GET), respiratory compensation point (RCP), and peak oxygen uptake (VO2peak) [9,13]. In addition, these studies also demonstrated the representativeness of the VO2 response to different load stimuli based on individual references of maximal tethered force.
In contrast, in the context of constant exercise, there is a lack of information to support the physiological description of rest-to-work transition during tethered swimming, which might be useful to provide the necessary metabolic adjustment to reach muscular energy requirements, as has been observed by means of VO2 kinetics (VO2k) in unimpeded swimming for the characterization of exercise domains [14,15], performance in distance races [16,17,18], exercise tolerance (i.e., time limit) in continuous [19,20,21,22,23] and intermittent trials [24,25], and comparisons to other exercises modes [26]. In fact, there are findings comparing constant exercise performance and blood-lactate response during tethered to unimpeded swimming conditions [7], but the VO2k was not analyzed and therefore not compared. Hence, unsupported by VO2k analysis, the inferences on the respiratory (i.e., gas diffusion), circulatory (i.e., blood perfusion), and metabolic (i.e., aerobic and anaerobic energy sources) responses during tethered swimming are insufficient to recognize whether the underlying physiological process determining muscle tolerance, or its limitations in relation to metabolic acidosis, is not different to the well-described mechanisms for unimpeded swimming.
Therefore, the current study aimed to contribute to the validity of the physiological responses during tethered swimming conditions by defining the severe domain from measurements of pulmonary gas exchange during an incremental ramp test. An additional purpose was to confirm the isocapnic zone boundaries during an incremental ramp test, and hence distinguish the sustainable exercise zone from that associated with fatigue events of metabolic acidosis. The hypothesis was that the profile of VO2 kinetics supports the speculation that time limit and metabolic responses while swimming in tethered conditions assure correspondence with the established physiological responses underlying muscle fatigue in the unimpeded severe domain of swimming. Furthermore, once this speculation is confirmed, it shall be possible to emphasize the specificity of tethered swimming for characterizing the physiological responses determining exercise tolerance in the severe domain.
2. Materials and Methods
2.1. Participants
The eleven male (18.0 ± 4.0 years old, 180.2 ± 6.8 cm height, and 71.8 ± 9.5 kg body weight) and five female (16.8 ± 3.6 years old, 166.2 ± 5.5 cm height, and 61.1 ± 9.8 kg body weight) were all swimmers with at least three years of training. The training plan just before the period of assessment was 31.8 ± 10.9 km per week, which was scheduled with aerobic (64 ± 12%), anaerobic (11.5 ± 4.7%), and other (24.4 ± 8.2%) units throughout the baseline period (14 weeks). Their best unimpeded front crawl performances at 200 m (i.e., a typical middle-distance race) represented 576 ± 136 vs. 504 ± 107 FINA points for male and female swimmers (respectively).
All subjects (and their parents/guardians when <18 years old) received information on the procedures and signed an informed consent form to participate in the study. All research procedures were conducted in accordance with the Declaration of Helsinki, and previously approved by the local University Ethics Committee (CAEE: 02402512.7.0000.5398).
2.2. Experimental Design
To reduce drafting and pacing effects, all swimming tests were performed with no other swimmer(s) in the same or nearby lanes. Swimmers visited the swimming pool to test the maximum force in tethered swimming conditions. After 48 h, the swimmers performed the incremental tethered test (ITT), and thereafter two other tests at constant load, corresponding to the workload (WL) at VO2peak (i.e., WLVO2peak), were performed 48 h after the initial ITT and between each other.
All tests were performed at the same period of the day to avoid circadian interference, in a 25 m swimming pool with controlled water temperature at 28 °C. All procedures were performed in the preparatory phase of the competitive season, and each swimmer concluded the entire protocol in two weeks. A familiarization period with tethered swimming and snorkel apparatus was accomplished before the tests, following previous recommendations [16,24]. The swimmers were instructed to avoid high-intensity training sessions at least 24 h before the testing, to retain their regular nutritional habits, and to avoid alcohol and/or stimulant beverages. The dietary routine was recommended to be unchanged during the experimental analysis.
2.3. Maximal Force Testing in Tethered Swimming
The force produced during tethered swimming was measured with a 500 kgf load cell attached to the swimmers by an inelastic rope. The load cell was previously calibrated for 100 Hz signal acquisition, with smoothing performed by the manufacturer’s software package (N2000PRO, Cefise®, São Paulo, Brazil). Swimmers performed the full front crawl style, trying to displace the body forward as strongly as possible (unsuccessfully) for 30 s (e.g., an all-out bout) for the analysis of force (e.g., mean peaks of force in the 30 s, Fmean), following previous recommendations [9,13]. In summary, these authors [9,13] suggested to consider a baseline (e.g., the force required to align the swimmer horizontally in water and extend the rope system with minimal strain, which should be measured just before the onset of the all-out bout) for the measurement of Fmean. The fractions of Fmean were the WL applied to grade the swimming intensity during each stage of the ITT.
2.4. Incremental Tethered Test (ITT)
Swimmers performed the ITT until voluntary exhaustion attached to a weight-bearing pulley rope system. As previously recommended [9,13], the swimmers were instructed to administer the front crawl with a propelling force to avoid being pulled back or forward as the WL was applied from 30% of Fmean (i.e., =(100%Fmean − baseline load) × 0.3), with increments of 5% per minute. Pulmonary gas exchange was analyzed breath by breath by a portable and automatized metabolic unit (CPET K4b2, Cosmed, Rome, Italy) coupled to a specific snorkel designed and validated for swimming (Cosmed new-AquaTrainer®, Rome, Italy) [27]. Prior to each test, the metabolic unit was calibrated following manufacturer recommendations, and swimmers rested for 10 min by sitting on the edge of the pool for VO2 baseline assessment with the snorkel system.
The breath-by-breath data were smoothed and exported in consecutive 9 s binary averages, and VO2peak was achieved by a well-motivated swimmer by assessing the highest three point rolling average VO2 achieved in spite of the increase in WL [9,13]. The exhaustion during ITT, and consequently the end of the test, was considered the moment during which the propelling force was no longer enough to avoiding swimmers being pulled back, or keep (at least) the head inside the recommended area, despite verbal encouragement. A blood sample (25 µL) was collected in the first minute after the end of the ITT for the analysis of blood lactate concentration ([La−]) just after the exercise (YSL, 2300 STAT, Yellow Springs, OH, USA).
Two researchers assessed the GET and RCP by analyzing the 9 s binary averages for the responses of VE/VCO2, VE/VO2, PetCO2, and PetO2 during ITT. The criteria for GET determination were (1) increase in VE/VO2 and PETO2 and (2) no concomitant changes in VE/VCO2 and PetCO2 responses, under moderate misalignment between VCO2 and VE (hyperventilation) with WL increasing [28,29]. Therefore, GET should demarcate the point during ITT at which VE changes and the VCO2 increases (due to the consequent buffering of metabolic acidosis), which can be observed by an increase in the ratio of both VCO2 and VE to VO2 that causes end-tidal O2 to increase [9]. In turn, the RCP criteria were (1) sustained increase in VE/VO2 and VE/VCO2, (2) decreased PetCO2, and (3) marked hyperventilation process [29]. The WLs corresponding to GET and RCP were defined as the WL just before the step where these thresholds were observed, and the WL corresponding to VO2peak was the lowest step eliciting no further increases in the VO2 response (see text above about VO2peak assessment), which were described as WLGET, WLRCP, and WLVO2peak, respectively. The stroke rate (SR) was calculated using the equation (SR = 60/stroke duration) and expressed in cycles per minute (cycles.min−1).
Heart rate (HR) was recorded with a Polar® sensor (Kempele, Finland) designed for the new-AquaTrainer® system and sampled in synchronization with breath-by-breath measurements.
2.5. Analysis of VO2 Kinetics during Exercise
Two rest exercise transitions at iVO2max were performed until voluntary exhaustion, following the same criteria described above for the characterization of exhaustion in the ITT. The VO2 samples from both transitions were time-aligned, the noise was excluded from each data set, and the transitions for each subject were interpolated second by second to obtain an average, as suggested by Özyener et al. [30]. Since time to exhaustion was not the same when comparing both transitions, the sets of transition values were equalized by the lower time performance at WLVO2peak, which was considered for the analysis of VO2k. The highest tolerance (time) obtained was considered as the time limit (tLim). Blood was sampled in the first minute after the end of each transition for [La−] analysis (following the procedures described above for the ITT).
The mathematical description of VO2k was performed using the residual model from the mono-exponential adjustment with no time delay (TD) response, as previously suggested [31]. Residual analysis was applied to the delimitation of the primary component of VO2, limiting it to the occurrence of the slow component (SC) if it was discernible (i.e., the time period during which there was a difference between the observed and predicted VO2 values, after a period in which they have not successively differed) (Equation (1)) [30]. Subsequently, another mono-exponential with TD (TD1 in Equation (2)) was applied to describe the primary component and to obtain the time constant (τ1) and the amplitude of VO2 (A1). In Equation (2), the cardio-dynamic component was not considered by eliminating the initial 20 s of the VO2 response to exercise.
where VO2b is the baseline of VO2 (i.e., the 10 min averaged value in resting condition before each transition). The physiologically relevant increase in VO2 is the amplitude of the primary component (A1′), which should strictly reflect the kinetics of O2 extraction by skeletal muscle (i.e., A1–VO2b). The SC amplitude was defined as the algebraic difference between VO2 at the time delay of SC occurrence (TD2) and the value at the end of exercise (EEVO2, last 15 s averaged VO2), as measured by Equation (3).
The oxygen deficit (O2df) during primary amplitude response was calculated according to Whipp et al. [32] as O2df = A1·MRT (with MRT—mean response time—calculated from TD1 and τ1 obtained in Equation (1)).
2.6. Statistical Analysis
The values were represented as mean and standard deviation, and were checked for normality by the Shapiro–Wilk test. The adjustments of VO2 and SR with the WL were performed based on the least-squares method, as well as the mono-exponential functions, with and without TD for the analysis of VO2k. The coefficient of variance (R2) was applied to analyze the level of association between the responses of VO2 and SR with the WL during the ITT. The independent t-test verified whether ITT and the constant load test were different with regard to the physiological response by comparing VO2peak vs. EEVO2, as well as [La−] responses. Pearson’s coefficient (r) correlated tLim with the aerobic conditioning variables (VO2peak, WLVO2peak, GET, WLGET, RCP, and WLRCP), as well as with the parameters of VO2k (τ1, A1′, SC and O2df) and [La−] for the analysis of how aerobic conditioning indexes and metabolism responses are related to tolerance. Statistical and mathematical analyses were performed using SPSS 26.0® (SPSS. Inc., Chicago, IL, USA) and OriginPro 8® (Northampton, MA, USA), and the significance level was set at p ≤ 0.05. The sample power was determined with G*Power 3 from data including the Pearson coefficient for the observed correlation to tLim, actual Newton (N) sample, and specifying α = 0.05 [33,34].
3. Results
The mean value of VO2peak obtained during ITT was 3418.5 ± 585.1 mL·min−1 (50.2 ± 6.2 mL·kg−1·min−1), with men attaining 3732.1 ± 396.0 mL·min−1 (52.4 ± 5.2 mL·kg−1·min−1) and women 2728.6 ± 161.7 mL·min−1 (45.4 ± 6.0 mL·kg−1·min−1). The WLVO2peak corresponded to 88.2 ± 13.7 N, 94.5 ± 11.2 N, and 74.3 ± 6.5 N for the group, for males, and for females, respectively. Figure 1 depicts the gas exchange response during the ITT and thresholds determination for a male swimmer. The criteria for maximal exertion during ITT were matched, since the respiratory exchange ratio (1.1 ± 0.1), HR (92.9 ± 4.2% HRmax), and blood lactate concentration (7.3 ± 1.4 mmol·L−1) all characterize a high-intensity aerobic exercise level. The profiles of VO2 and SR response during ITT followed a second-order polynomial pattern, as shown in Figure 2 (Panels A and B for a male swimmer, and Panels C and D for entire group responses). Among the swimmers, Fmean was 2.57 ± 0.58 N·kg−1 (2.73 ± 0.63 N·kg−1 for male and 2.20 ± 0.34 N·kg−1 for female swimmers).
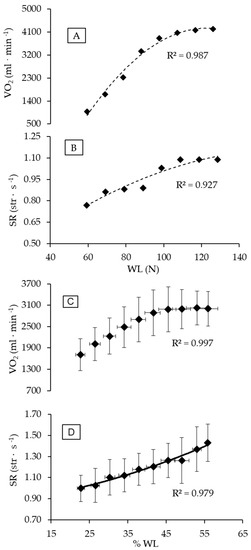
Figure 1.
Individual (A,B) and group (C,D) profiles of VO2 and SR with WL increasing during ITT. The best adjustments were (A) VO2 = −0.7857x2 + 196.89x − 8076.9; (B) SR = −0.00003x2 + 0.0113x + 0.2147; (C) VO2 = −1.5017x2 + 158.18x − 1135.5; and (D) SR = 0.0001x2 + 0.004x + 0.8607. Abbreviations: SR, stroke rate; WL, workload; and ITT, incremental tether test.
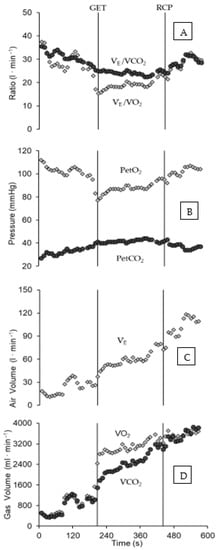
Figure 2.
Gas exchange response during the ITT, demarcating GET and RCP (vertical lines) occurrence for a male swimmer, in accordance with the criteria for the assessment of each threshold. The Panels are depicting the profiles for VE/VCO2 and VE/VO2 vs. time (A), PetO2 and PetCO2 vs. time (B), VE vs. time (C), and VO2 and VCO2 vs. time (D), Abbreviations: GET (gas exchange threshold), RCP (respiratory compensation point), PetCO2 (end-tidal pressure CO2), PetO2 (end-tidal pressure O2), VO2 (O2 uptake), VCO2 (CO2 output), and VE (ventilation, VE/VCO2 (equivalent for VCO2), and VE/VO2 (equivalent for VO2)).
The pulmonary gas exchange response during ITT is shown in Figure 2. The lower and upper limits for the isocapnic zone (GET and RCP) are clearly discernible from the responses of VE/VCO2 (Panel A), PetCO2 (Panel B), and VCO2 (Panel D), all in Figure 2. The GET attained 67.4 ± 7.3% of VO2peak (males: 68.0 ± 8.0%; females: 66.0 ± 6.2%), and RCP was 87.4 ± 3.4% of VO2peak (male: 87.5 ± 3.8%; female: 87.2 ± 2.9 %). The values of WLGET and WLRCP were 63.0 ± 3.7% and 85.2 ± 2.7% of WLVO2peak, respectively. For males, the values of WLGET and WLRCP reached 62.7 ± 4.3% and 85.2 ± 2.9% of WLVO2peak, and in females the WLGET and WLRCP were 63.6 ± 2.3% and 85.3 ± 2.7% of WLVO2peak, respectively.
The VO2peak was attained during transition at WLVO2peak, as observed by the no significant difference to EEVO2 average values (p = 0.96) (Table 1). Therefore, swimmers attained VO2peak during a constant-load test either directly from the response of the A1′ component or by the addition of the SC response. Just one female and three male swimmers showed no SC response, therefore reaching VO2peak from the response of the A1′ component. The response of the A1′ component reached 91.6 ± 6.8% VO2peak (males: 90.6 ± 7.7% VO2peak; females: 93.7 ± 4.0% VO2peak), with the remaining elevation of VO2 response until EEVO2 accounting for SC occurrence. The average tLim during the WLVO2peak was 329.8 ± 63.6 s (male = 314.5 ± 66.8 s and female swimmers = 363.6 ± 44.0 s). In addition, the [La−] during the WLVO2peak test reached average values of 7.4 ± 1.9 mmol·L−1 (males: 7.5 ± 1.8 mmol·L−1 and females: 7.4 ± 2.3 mmol·L−1), which did not differ from the [La−] value after ITT (p = 0.87); and the O2df average value was 1763.6 ± 714.1 mL·min−1 (males: 1987.1 ± 759.3 mL·min−1; females: 1270.2 ± 168.7 mL·min−1).

Table 1.
Table 1. The analysis of VO2k while performing tethered swimming at WLVO2peak.
The EEVO2 showed positive correlations with VO2peak and WLVO2peak (r = 0.98 and 0.89; both at p < 0.01), as well as with O2df (r = −0.61; p = 0.01). Negative correlations were observed for tLim to VO2peak (r = −0.55; p = 0.01), WLVO2peak (r = −0.59; p < 0.01), GET (r = −0.58, p = 0.01), RCP (r = −0.53, p = 0.02), and EEVO2 (r = −0.50, p = 0.03). The level of correlations between tLim and the indexes of aerobic conditioning were associated with sample powers of 75, 82, 76, and 71%, respectively. Therefore, for the actual N = 16, there is a 25 and 18% chance of failing to detect an effect of VO2peak and WLVO2peak on tLim. No other variable correlated to tLim at a significant level, despite SC and A1′ both showing a statistical tendency to correlate with tLim (r = −0.46 and 0.43, at p = 0.09 and 0.10, respectively).
The different profiles of VO2 and tLim responses during swimming performance at WLVO2peak are depicted in Figure 3 (Panels A, B, and C). Panel A shows a female swimmer with long tLim (471 s), fast VO2 response (τ1 = 18.2 s), and reduced SC contribution (9.0%) to EEVO2. In Panel B is a male swimmer with short tLim (288 s), slow VO2 response (τ1 = 45.8 s), and average SC contribution (12.7%) to EEVO2; finally, in Panel C is a male swimmer with average tLim (337 s), slow VO2 response VO2 (τ1 = 30.6 s), and high SC contribution (18.8%) to EEVO2. For the swimmers in Panels A, B, and C, the [La−] was 6.7, 6.9, and 8.2 mmol·L−1, respectively.
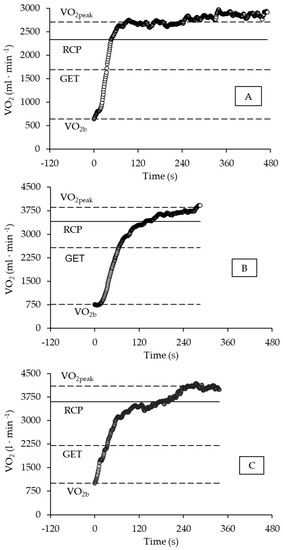
Figure 3.
The profile of VO2 response during the WLVO2max test. Panel (A) depicts a female swimmer, and Panels (B,C) show a male swimmer. See the detailed description in the text. Horizontal lines in each panel indicate (from the bottom to the top) the VO2b (baseline VO2 response), GET (gas exchange threshold), RCP (respiratory compensation point), and VO2peak (peak oxygen uptake).
4. Discussion
The findings corroborate that tethered swimming is suitable as an ergometer for the management of load intensity by means of the individual reference of maximal tethered force, from which a gradual metabolic demand was observed from submaximal to maximal rates with sufficient temporal resolution to identify GET, RCP, and VO2peak, as previously reported [9,13]. In addition, when performing at WLVO2peak, the VO2k response might be considered typical of a severe domain either in unimpeded front crawl swimming [14,15,18,20,21] or another exercise mode [30,35].
Furthermore, the tLim observed while performing at WLVO2peak is in the range of the values reported for unimpeded front crawl swimming at maximal aerobic velocity (314 to 375 s) between swimmers with moderate VO2peak [20,36]. However, even among elite swimmers with high VO2peak (>70 mL·kg−1·min−1), the time limit values at maximal aerobic velocity presented a wide range (188 to 400 s) [21]. Moreover, evidence of the inverse association between time limit and maximal aerobic velocity, which was supported for cycling, running, swimming flume [37], and unimpeded front crawl swimming [25,37,38], with coefficients ranging from r = −0.47 to −0.72, was also found in the current study for tethered swimming. Additionally, the current study demonstrated an inverse association of tLim with other indexes of aerobic conditioning (such as VO2peak, GET, and RCP) and the VO2 elevation at the end of performance (such as EEVO2).
Notably, one of the physiological determinants of exercise tolerance in the severe domain is the aerobic conditioning level, which includes the central (i.e., rate of O2 availability) and peripherical (i.e., velocity of O2 phosphorylation) ability to control the adjustments of oxidative metabolism [23,39,40], and based on which higher and faster responses have been associated with shorter time limits in severe exercise during unimpeded front crawl swimming (r = −0.54 to −0.62) [21,37], cycling (r = −0.46) [23], and running (r = −0.75) [41]. Therefore, this assumption was also supported by the current findings, which contribute to reinforcing (from the negative association of tLim with VO2peak and EEVO2) the need to consider other physiological aspects than the aerobic conditioning level to account for longer exercise tolerance in the severe domain.
In fact, exercising in the severe domain requires the gradual contribution of the finite anaerobic energy reserve in muscle fiber, probably due to the physiological constraints upon continuous increases in blood perfusion, gas diffusion, and mitochondrial function. This assumption associates exhaustion with metabolic acidosis and the depletion of intramuscular substrates [35,39,42,43], and therefore evidences the role of anaerobic capacity in time limit [23,39,40]. Particularly in swimming, another variable to consider is propelling efficiency, which can affect either the energy demand or the source of energy contribution [38,44].
Interestingly, there are still conflicting results on the role of propelling efficiency, as tLim has shown a wide range whatever the training level of swimmers [43,45], which was also evidenced in the current study with tethered swimming (197 to 496 s) when considering the tLim either between the sexes or for each sex as an independent group. In addition, higher boundaries for moderate and heavy domains (e.g., GET and RCP) showed to have a similar effect on time limit to the VO2peak (i.e., shortening the time limit), of which comparable evidence was reported between the time limit and velocity at the anaerobic threshold (r = −0.54 to −0.62) for unimpeded front crawl swimming [21,37].
Thus, the most probable physiological scenario that might be associated with a longer time limit during severe exercise might be characterized by three main physiological responses assessed with the analysis of VO2k: (i) a fast time constant for primary amplitude (A1′) of the projecting VO2 close to the muscle demand, therefore avoiding a high O2 deficit at the beginning of exercise as well as stimulating anaerobic glycolysis early; (ii) enhanced control of the acid–base balance, preventing muscle and blood pH disturbance, as well as fast depletion of intra-muscular substrates; and (iii) ideally having a wide window for SC occurrence, allowing oxidative readjustments before being limited to the attainment of VO2peak, which is inevitable due to the progressive recruitment of fast glycolytic fibers [35,40,46]. The current study was pioneering in applying VO2k to the analysis of time limit during tethered swimming, from which three main responses were distinguished, as discussed below.
First, a longer time limit was observed for a female swimmer (Figure 3, Panel A), which exemplified the effect of the inverse relationship between time limit and WLVO2peak. Her values of WLVO2peak (1.04 N·kg−1) and VO2peak (36.4 mL·kg−1·min−1) were considered low when compared to the mean values for her sex-specific group. Despite being considered, therefore, a non-highly aerobic-conditioned female athlete, the high and fast VO2 primary response (i.e., amplitude, A1′; and time constant, t1) during the rest-to-exercise transition suggested no central or peripheral constrains to the oxidative raise until 99.7% of the predicted demand, hence avoiding earlier metabolic disturbance by reducing the O2 deficit, slow-component contribution, and blood lactate concentration. Thus, this physiological profile corroborated the assumptions that O2 diffusion, capillary perfusion, and mitochondrial function might be determinants of exercise tolerance among athletes with a moderate aerobic conditioning level when performing exercise in the severe domain [35,39,42].
In contrast, a second example observed was the short time limit for a male swimmer (Figure 3, Panel B), which might be an effect of the high values of WLVO2peak (1.47 N·kg−1) and VO2peak (58.8 mL·kg−1·min−1) when compared to the mean values of his sex-specific group. The negative effect on exercise tolerance might be accounted to the high target VO2 demand (high A1′) and the long time taken to be attained (i.e., slow time constant, τ1). Consequently, other physiological responses such as O2 deficit, slow-component contribution, and blood lactate concentration were prematurely enhanced. This situation is poorly tolerated by well-conditioned athletes due to the reduced anaerobic reserve [35,47], therefore corroborating the assumption that work muscle capacity is high among high-level athletes, in whom the ability to adjust the oxidative demand and delay the anaerobic activation to critical levels are limiting factors during high-intensity exercise [39,42].
Finally, the third profile of response observed for another male swimmer (Figure 3, Panel C) exemplifies the effect of superior anaerobic conditioning on time limit. Once again, a swimmer with no high aerobic conditioning level (WLVO2peak = 1.03 N·kg−1, and VO2peak = 47.6 mL·kg−1·min−1) showed reasonable tolerance (tLim > 300 s). The physiological profile accounting to this tolerance highlights the role of anaerobic capacity, as the slow-component contribution and blood lactate concentration should be high (i.e., ~19% and ~8 mmol·L−1, respectively), when the target primary VO2 demand attains a low rate (A1′~84% VO2peak) and its adjustment is similarly low (i.e., τ1~31 s) at the onset of exercise.
In fact, the relationship between the slow component and the cascade of physiological events leading to metabolic acidosis accounts for the activation of rapid glycolytic fibbers [35], which support the association between anaerobic capacity and longer time limit [23]. However, the present study observed no significant correlation between slow-component contribution with time limit or with blood lactate concentration, and therefore was closer aligned with studies showing the lack of correlation [20] than with studies reporting a positive correlation between the slow component and time limit [21,37]. Possibly, this physiological profile was a distinguishable response of the current sample of swimmers, but also indicates the particularity of the effect of the SC phenomena on time limit, which should further consider how each athlete adjusted and tolerated other physiological events taking place simultaneously [35,40].
However, the positive correlations between the slow component and the time limit has been evidenced for performance in maximal aerobic swimming velocity [21,37], suggesting that the larger the window for the SC manifestation, the greater the swimming tolerance should be at such swimming velocities, which is an assumption aligned to the aforementioned physiological profile of response at WLVO2peak. Although the SC is theoretically linked to the ability of fibers to further adjust to the VO2 demand, it is also a response linked with a concomitant increase in the reliance on anaerobic energy sources, which in turn can enhance energy cost and (probably) reduce tolerance among swimmers [20]. Therefore, most of the findings in the current study supported, or at least were aligned to, the metabolic profile of response reported for unimpeded swimming conditions.
However, the same swimmers were not evaluated in both swimming conditions. Thus, this is a limitation of the current study, and hence the direct comparison between both swimming conditions still remains to be analyzed in future studies, as well as whether the improvement of anaerobic conditioning by training with workloads corresponding to a severe domain has an effect on time-limited swimming performance. Moreover, we cannot attribute this physiological profile to a given particularity associated with sex and age group influence on performance ability during high-intensity swimming. For example, the (relative to body weight) energetic cost during short- and middle-distance swimming performance is not related to sex-specific differences in lean mass, nor does it have an influence on the slope (VO2 vs. velocity) of the incremental test in swimming [48]. Finally, there is evidence for the lack of influence of biological age on the association between short-distance swimming velocity and indexes of stroke mechanics and aerobic conditioning level [49], despite absolute (not relative) values of VO2 response showing the tendency to increase with biological age during a one-minute all-out bout of tethered swimming [50].
5. Conclusions
From the results of the incremental tethered test, the assessment of GET and the RCP by means of pulmonary gas exchange analysis was possible, and therefore it was possible to demarcate the domains for moderate, heavy, and severe exercise in tethered swimming conditions. Moreover, during the rest-to-exercise transition at a WL corresponding to VO2peak, it was possible to characterize three main profiles of metabolic processes underlying tolerance in a severe exercise domain by means of VO2 on-kinetics analysis. Indeed, the parameters of VO2k showed responses suggesting that tethered swimming might be reliable to simulate unimpeded front crawl physiological responses either at or around maximal aerobic velocity.
The findings also demonstrated that high tolerance was inversely related to the aerobic conditioning level observed for swimmers, independently of sex. In addition, the ability to adjust oxidative metabolism in order to match the target VO2 demand during exercise also reduced the time limit, which might contribute to increasing oxygen deficit. In turn, while the SC only tends to negatively affect the time limit, some individual responses suggested that this response might be dependent on the ability to tolerate high blood lactate accumulation. However, the magnitude and type of association between anaerobic capacity and time limit in the severe domain still remain to be addressed.
Author Contributions
Conceptualization, D.A.M., M.C.E., E.A.C. and D.M.P.F.; methodology, D.A.M., A.G.M., T.A.F.A., E.A.C. and D.M.P.F.; formal analysis, D.A.M., A.G.M., T.A.F.A., M.C.E., E.A.C. and D.M.P.F.; investigation, D.A.M., A.G.M., T.A.F.A., M.C.E., E.A.C. and D.M.P.F.; supervision, M.C.E., F.J.S., E.A.C. and D.M.P.F.; data curation, D.A.M. and D.M.P.F.; writing—original draft preparation, D.A.M., A.G.M., M.C.E., E.A.C., F.J.S., C.C.F., A.A.P.D., R.A.M.R. and D.M.P.F.; writing—review and editing, D.A.M., A.G.M., M.C.E., F.J.S., E.A.C., C.C.F., A.A.P.D., R.A.M.R., T.A.F.A. and D.M.P.F.; Visualization, D.A.M., A.G.M., T.A.F.A., M.C.E., F.J.S., E.A.C., C.C.F., A.A.P.D., R.A.M.R. and D.M.P.F.; funding acquisition, A.G.M., T.A.F.A., M.C.E., E.A.C. and D.M.P.F. All authors have read and agreed to the published version of the manuscript.
Funding
The authors would like to thank the São Paulo Research Foundation—FAPESP (PROCESS 2016/04544-3) and Coordenação de Aperfeiçoamento de Pessoal de Nível Superior—Brazil (CAPES—Finance Code 001) for the partial financial support. The collaboration of T.A.F.A. and E.A.C was possible thanks to the scholarships granted by CAPES, in the scope of the Program CAPES-PrInt, process number 88887.310463/2018-00, and International Cooperation Project numbers 88887.572557/2020-00 and 88887.310796/2018-00 (scholarships numbers: 88887.580265/2020-00 and 88887.572557/2020-00). This research was also funded by the Foundation for Science and Technology, I.P., Grant/Award Number UIDB/04748/2020, and the Instituto Politécnico de Setúbal.
Institutional Review Board Statement
This study was conducted in accordance with the Declaration of Helsinki and previously submitted and approved by the local University Ethics Committee, under CAEE: 02402512.7.0000.5398.
Informed Consent Statement
All subjects and their parents/guardians (when appropriate) signed an informed consent form prior to participation in the research.
Data Availability Statement
The data that support the findings of this study are available from the last author (dalton.pessoa-filho@unesp.br), upon reasonable request.
Acknowledgments
The authors would like to thank the team of research assistants who helped with data collection for this study as well as all the research participants for their time in completing the study.
Conflicts of Interest
The authors declare no conflict of interest.
References
- Samson, M.; Monnet, T.; Bernard, A.; Lacouture, P.; David, L. Comparative study between fully tethered and free swimming at different paces of swimming in front crawl. Sport. Biomech. 2019, 18, 571–586. [Google Scholar] [CrossRef] [PubMed]
- Morouço, P.; Keskinen, K.L.; Vilas-Boas, J.P.; Fernandes, R.J. Relationship between tethered forces and the four swimming techniques performance. J. Appl. Biomech. 2011, 27, 161–169. [Google Scholar] [CrossRef] [PubMed]
- Amaro, N.; Marinho, D.A.; Batalha, N.; Marques, M.C.; Morouço, P. Reliability of tethered swimming evaluation in age group swimmers. J. Hum. Kinet. 2014, 41, 155–162. [Google Scholar] [CrossRef] [PubMed]
- Yeater, R.A.; Martin, R.B.; White, M.K.; Gilson, K.H. Tethered swimming forces in the crawl, breast and back strokes and their relationship to competitive performance. J. Biomech. 1981, 14, 527–537. [Google Scholar] [CrossRef]
- Dopsaj, M.; Matkovic, I.; Zdravkovic, I. The relationship between 50 m—Freestyle results and characteristics of tethered forces in male sprint swimmers: A new approach to tethered swimming test. Facta Univ. Phys. Edu. Sport. 2000, 1, 15–22. [Google Scholar]
- Pinna, M.; Milia, R.; Roberto, S.; Marongiu, E.; Olla, S.; Loi, A.; Ortu, M.; Migliaccio, G.M.; Tocco, F.; Concu, A.; et al. Assessment of the specificity of cardiopulmonary response during tethered swimming using a new snorkel device. J. Physiol. Sci. 2013, 63, 7–16. [Google Scholar] [CrossRef]
- Pessôa Filho, D.M.; Greco, C.C.; Denadai, B.S. Tether-power at maximal lactate steady-state and endurance indexes of swimming performance. Rev. Bras. Med. Esporte 2014, 20, 359–365. [Google Scholar] [CrossRef]
- Papoti, M.; Da Silva, A.S.R.; Araújo, G.G.; Santiago, V.; Martins, L.E.B.; Cunha, S.A.; Gobatto, C.A. Aerobic and anaerobic performances in tethered swimming. Int. J. Sport. Med. 2013, 34, 712–719. [Google Scholar] [CrossRef]
- Pessôa Filho, D.M.; SiqueiraI, L.O.; Simionato, A.R.; Espada, M.A.; Pestana, D.S.; DiMenna, F.J. A rapidly-incremented tethered-swimming test for defining domain-specific training zones. J. Hum. Kinet. 2017, 57, 117–128. [Google Scholar] [CrossRef]
- Holmér, I. Oxygen uptake during swimming in man. J. Appl. Physiol. 1972, 33, 502–509. [Google Scholar] [CrossRef]
- Bonen, A.; Wilson, B.; Yarkony, M.; Belcastro, A.N. Maximal oxygen uptake during free, tethered, and flume swimming. J. Appl. Physiol. 1980, 48, 232–235. [Google Scholar] [CrossRef] [PubMed]
- Rinehardt, K.F.; Kraemer, R.R.; Gormely, S.; Colan, S. Comparison of maximal oxygen uptakes from the tethered, the 183- and 457-meter unimpeded supramaximal freestyle swims. Int. J. Sport. Med. 1991, 12, 6–9. [Google Scholar] [CrossRef] [PubMed]
- Pessôa Filho, D.M.; Massini, D.A.; SiqueiraI, L.O.; Santos, L.G.A.; Vasconcelos, C.M.T.; Almeida, T.A.F.; Espada, M.A.; Reis, J.F.; Alves, F.B.; DiMenna, F.J. A rapidly incremented tethered-swimming maximal protocol for cardiorespiratory assessment of swimmers. J. Vis. Exp. 2020, 155, e60630. [Google Scholar] [CrossRef]
- Sousa, A.; Vilas-Boas, J.P.; Fernandes, R. VO2 kinetics and metabolic contributions whilst swimming at 95, 100, and 105% of the velocity at VO2max. Biomed Res. Int. 2014, 2014, 675363. [Google Scholar] [CrossRef] [PubMed]
- Pessôa Filho, D.; Alves, F.; Reis, J.; Greco, C.; Denadai, B. VO2 kinetics during heavy and severe exercise in swimming. Int. J. Sport. Med. 2012, 33, 744–748. [Google Scholar] [CrossRef]
- Almeida, T.A.F.; Pessôa Filho, D.M.; Espada, M.A.C.; Reis, J.F.; Simionato, A.R.; Siqueira, L.O.C.; Alves, F.B. VO2 kinetics kinetics and energy contribution in simulated maximal performance during short and middle distance-trials in swimming. Eur. J. Appl. Physiol. 2020, 120, 1097–1109. [Google Scholar] [CrossRef]
- Rodríguez, F.; Lätt, E.; Jürimäe, J.; Maestu, J.; Purge, P.; Rämson, R.; Haljaste, K.; Keskinen, K.; Jürimäe, T. VO2 Kinetics in all-out arm stroke, leg kick and whole stroke front crawl 100-m swimming. Int J Sport. Med. 2015, 37, 191–196. [Google Scholar] [CrossRef]
- Reis, J.; Alves, F.; Bruno, P.; Vleck, V.; Millet, G. Oxygen uptake kinetics and middle-distance swimming performance. J. Sci. Med. Sport. 2012, 15, 58–63. [Google Scholar] [CrossRef]
- Espada, M.C.; Reis, J.F.; Almeida, T.F.; Bruno, P.M.; Vleck, V.E.; Alves, F.B. Ventilatory and physiological responses in swimmers below and above their maximal lactate steady state. J. Strength Cond. Res. 2015, 29, 2836–2843. [Google Scholar] [CrossRef]
- Demarie, S.; Sardella, F.; Billat, V.L.; Magini, W.; Faina, M. The VO2 slow component in swimming. Eur. J. Appl. Physiol. 2001, 84, 95–99. [Google Scholar] [CrossRef]
- Fernandes, R.J.; Cardoso, C.S.; Soares, S.M.; Ascensao, A.; Colaço, P.J.; Vilas-Boas, J.P. Time limit and VO2 slow component at intensities corresponding to VO2max in swimmers. Int. J. Sport. Med. 2003, 24, 576–581. [Google Scholar] [CrossRef]
- Billat, V.L.; Morton, R.H.; Blondel, N.; Berthoin, S.; Bocquet, V.; Koralsztein, J.P.; Barstow, T.J. Oxygen kinetics and modelling of time to exhaustion whilst running at various velocities at maximal oxygen uptake. Eur. J. Appl. Physiol. 2000, 82, 178–187. [Google Scholar] [CrossRef] [PubMed]
- Faina, M.; Billat, V.; Squadrone, R.; Angelis, M. Anaerobic contribution to the time to exhaustion at the minimal exercise intensity at which maximal oxygen uptake occurs in elite cyclist, kaykits and swimmers. Eur. J. Appl. Physiol. Occup. Physiol. 1997, 76, 13–20. [Google Scholar] [CrossRef]
- Almeida, T.A.F.; Pessôa Filho, D.M.; Espada, M.C.; Reis, J.F.; Sancassani, A.; Massini, D.A.; Santos, F.J.; Alves, F.B. Physiological responses during high-intensity interval training in young swimmers. Front. Physiol. 2021, 12, 662029. [Google Scholar] [CrossRef] [PubMed]
- Almeida, T.A.F.; Massini, D.A.; Silva Júnior, O.T.; Venditti Júnior, R.; Espada, M.A.C.; Macedo, A.G.; Reis, J.F.; Alves, F.B.; Pessôa Filho, D.M. Time limit and VO2 kinetics at maximal aerobic velocity: Continuous vs. intermittent swimming trials. Front. Physiol. 2022, 13, 982874. [Google Scholar] [CrossRef] [PubMed]
- Sousa, A.; Figueiredo, P.; Zamparo, P.; Pyne, D.B.; Vilas-Boas, J.P.; Fernandes, R.J. Exercise modality effect on bioenergetical performance at ⩒O2max intensity. Med. Sci. Sport. Exerc. 2015, 47, 1705–1713. [Google Scholar] [CrossRef] [PubMed]
- Baldari, C.; Fernandes, R.J.; Ribeiro, J.; Meucci, M.; Vilas-Boas, J.P.; Guidetti, L. Is the New AquaTrainer® Snorkel Valid for VO2 assessment in swimming? Int. J. Sport. Med. 2013, 34, 336–344. [Google Scholar] [CrossRef]
- Amann, M.; Subudhi, A.; Foster, C. Influence of testing protocol on ventilatory thresholds and cycling performance. Med. Sci. Sport. Exerc. 2004, 36, 613–622. [Google Scholar] [CrossRef]
- Whipp, B.J. Physiological mechanisms dissociating pulmonary CO2 and O2 exchange dynamics during exercise in humans. Exp. Physiol. 2007, 92, 347–355. [Google Scholar] [CrossRef]
- Özyener, F.; Rossiter, H.B.; Ward, S.A.; Whipp, B.J. Influence of exercise intensity on the on- and off-transients kinetics of pulmonary oxygen uptake in humans. J. Physiol. 2001, 533, 891–902. [Google Scholar] [CrossRef]
- DiMenna, F.J.; Jones, A.M. “Linear” versus “Nonlinear” VO2 responses to exercise: Reshaping traditional beliefs. J. Exerc. Sci. Fit. 2009, 7, 67–84. [Google Scholar] [CrossRef]
- Whipp, B.J.; Ward, S.A.; Rossiter, H.B. Pulmonary O2 uptake during exercise: Conflating muscular and cardiovascular responses. Med. Sci. Sport. Exerc. 2005, 37, 1574–1585. [Google Scholar] [CrossRef]
- Faul, F.; Erdfelder, E.; Lang, A.G.; Buchner, A. G*Power 3: A flexible statistical power analysis program for the social, be-havioral, and biomedical sciences. Behav. Res. Methods 2007, 39, 175–191. [Google Scholar] [CrossRef] [PubMed]
- Fritz, C.O.; Morris, P.E.; Richler, J.J. Effect size estimates: Current use, calculations, and interpretation. J. Exp. Psychol. Gen. 2012, 141, 2–18. [Google Scholar] [CrossRef]
- Murgatroyd, S.R.; Ferguson, C.; Ward, S.A.; Whipp, B.J.; Rossiter, H.B. Pulmonary O2 uptake kinetics as a determinant of high-intensity exercise tolerance in humans. J. Appl. Physiol. 2011, 110, 1598–1606. [Google Scholar] [CrossRef]
- Billat, V.; Faina, M.; Sardella, F.; Marini, C.; Fanton, F.; Lupo, S.; Faccini, P.; de Angelis, M.; Koralsztein, J.P.; Dalmonte, A. A Comparison of time to exhaustion at VO2max in élite cyclists, kayak paddlers, swimmers and runners. Ergonomics 1996, 39, 267–277. [Google Scholar] [CrossRef] [PubMed]
- Fernandes, R.J.; Keskinen, K.L.; Colaço, P.; Querido, A.J.; Machado, L.; Morais, P.A. Time limit at VO2max velocity in elite crawl swimmers. Int. J. Sport. Med. 2008, 29, 145–150. [Google Scholar] [CrossRef]
- Fernandes, R.J.; Billat, V.L.; Cruz, A.C.; Colaço, P.J.; Cardoso, C.S.; Vilas-Boas, J.P. Does net energy cost of swimming affect time to exhaustion at the individual’s maximal oxygen consumption velocity? J. Sport. Med. Phys. Fit. 2006, 46, 373. [Google Scholar]
- di Prampero, P.E. Factors limiting maximal performance in humans. Eur. J. Appl. Physiol. 2003, 90, 420–429. [Google Scholar] [CrossRef] [PubMed]
- Jones, A.M.; Vanhatalo, A.; Burnley, M.; Morton, R.H.; Poole, D.C. Critical power: Implications for determination of VO2max and exercise tolerance. Med. Sci. Sport. Exerc. 2010, 42, 1876–1890. [Google Scholar] [CrossRef]
- Billat, V.L.; Lepretre, P.M.; Heubert, R.P.; Koralsztein, J.P.; Gazeau, F.P. Influence of acute moderate hypoxia on time to exhaustion at vVO2max in unacclimatized runners. Int. J. Sport. Med. 2003, 24, 9–14. [Google Scholar] [CrossRef] [PubMed]
- Wagner, P.D. New ideas on limitations to VO2max. Exerc. Sport. Sci. Rev. 2000, 28, 10–14. [Google Scholar] [PubMed]
- Poole, D.C.; Burnley, M.; Vanhatalo, A.; Rossiter, H.B.; Jones, A.M. Critical power: An important fatigue threshold in exercise physiology. Med. Sci. Sport. Exerc. 2016, 48, 2320–2334. [Google Scholar] [CrossRef] [PubMed]
- Toussaint, H.M.; Hollander, A.P. Energetics of competitive swimming. Sport. Med. 1994, 18, 384–405. [Google Scholar] [CrossRef]
- Sousa, A.; Figueiredo, P.; Pendergast, D.; Kjendlie, P.L.; Vilas-Boas, J.P.; Fernandes, R.J. critical evaluation of oxygen-uptake assessment in swimming. Int. J. Sport. Physiol. Perf. 2014, 9, 190–202. [Google Scholar] [CrossRef]
- Billat, V.L.; Mille-Hamard, L.; Demarle, A.; Koralsztein, J.P. Effect of Training in humans on off- and on-transient oxygen uptake kinetics after severe exhausting intensity runs. Eur. J. Appl. Physiol. 2002, 87, 496–505. [Google Scholar] [CrossRef]
- Burnley, M.; Jones, A.M. Oxygen uptake kinetics as a determinant of sports performance. Eur. J. Sport. Sci. 2007, 7, 63–79. [Google Scholar] [CrossRef]
- Massini, D.A.; Almeida, T.A.F.; Vasconcelos, C.M.T.; Macedo, A.G.; Espada, M.A.C.; Reis, J.F.; Alves, F.J.B.; Fernandes, R.J.P.; Pessôa Filho, D.M. Are young swimmers short and middle distances energy cost sex-specific? Front. Physiol. 2021, 12, 796886. [Google Scholar] [CrossRef]
- Sokołowski, K.; Strzała, M.; Stanula, A.; Kryst, Ł.; Radecki-Pawlik, A.; Krężałek, P.; Rosemann, T.; Knechtle, B. Biological age in relation to somatic, physiological, and swimming kinematic indices as predictors of 100 m front crawl performance in young female swimmers. Int. J. Environ. Res. Public Health 2021, 18, 6062. [Google Scholar] [CrossRef]
- Sokołowski, K.; Bartolomeu, R.F.; Barbosa, T.M.; Strzała, M. VO2 kinetics and tethered strength influence the 200-m front crawl stroke kinematics and speed in young male swimmers. Front. Physiol. 2022, 13, 1045178. [Google Scholar] [CrossRef]


Disclaimer/Publisher’s Note: The statements, opinions and data contained in all publications are solely those of the individual author(s) and contributor(s) and not of MDPI and/or the editor(s). MDPI and/or the editor(s) disclaim responsibility for any injury to people or property resulting from any ideas, methods, instructions or products referred to in the content. |
© 2023 by the authors. Licensee MDPI, Basel, Switzerland. This article is an open access article distributed under the terms and conditions of the Creative Commons Attribution (CC BY) license (https://creativecommons.org/licenses/by/4.0/).