
Influence of Vitamin D Status and Supplementation on Metabolomic Profiles of Older Adults


Abstract
1. Introduction
2. Materials and Methods
2.1. Participants and Study Design
2.2. Dietary and Lifestyle Assessment
2.3. Blood Sample Collection and Analysis
2.4. Serum Vitamin D Measurement
2.5. Biomarkers of Metabolic Health
2.6. Metabolomics Analysis
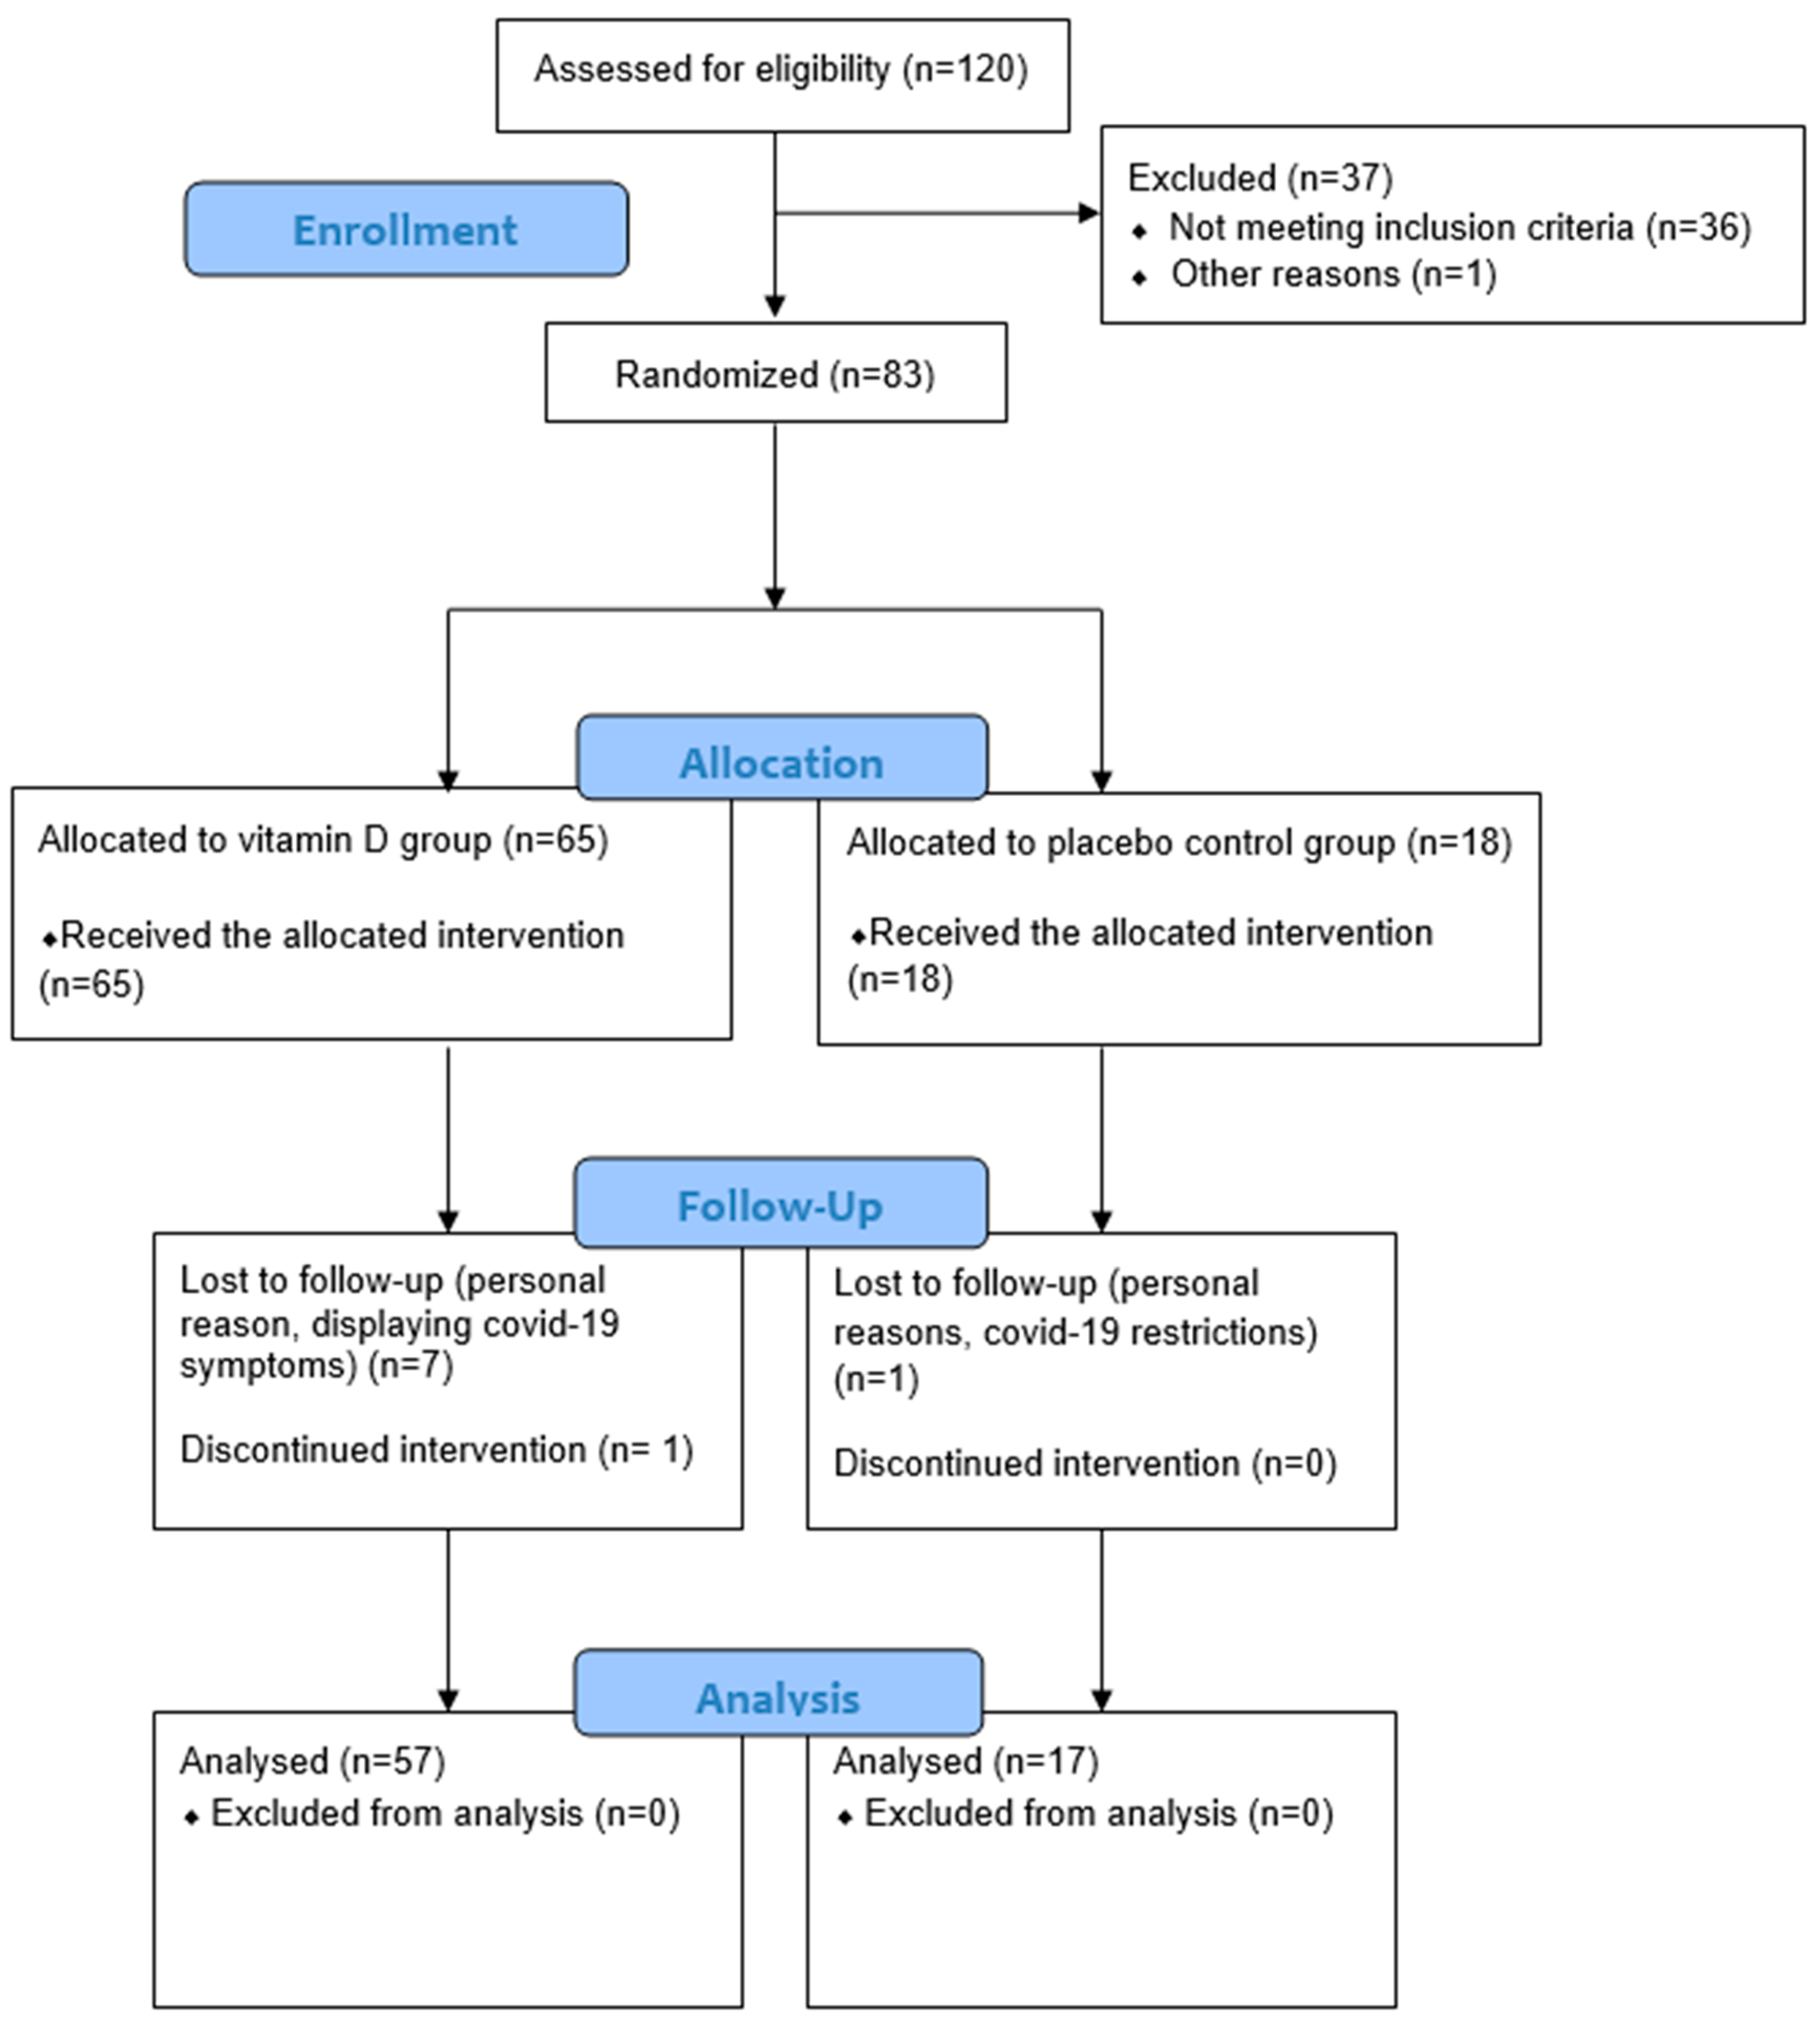
2.7. Participant Flow and Data Collection
2.8. Statistical Analysis
3. Results
3.1. Participant Characteristics
3.2. Baseline Vitamin D and Metabolomic Profiles
3.3. Effect of Vitamin D Supplementation on Metabolomic Profiles
4. Discussion
Supplementary Materials
Author Contributions
Funding
Institutional Review Board Statement
Informed Consent Statement
Data Availability Statement
Acknowledgments
Conflicts of Interest
References
- Brennan, L. Metabolomics in nutrition research—A powerful window into nutritional metabolism. Essays Biochem. 2016, 60, 451–458. [Google Scholar] [CrossRef] [PubMed]
- Emwas, A.H. The strengths and weaknesses of NMR spectroscopy and mass spectrometry with particular focus on metabolomics research. Methods Mol. Biol. 2015, 1277, 161–193. [Google Scholar] [CrossRef] [PubMed]
- Schrimpe-Rutledge, A.; Codreanu, S.G.; Sherrod, S.D.; McLean, J.A. Untargeted Metabolomics Strategies-Challenges and Emerging Directions. J. Am. Soc. Mass Spectrom. 2016, 27, 1897–1905. [Google Scholar] [CrossRef] [PubMed]
- Leung, R.Y.H.; Li, G.H.Y.; Cheung, B.M.Y.; Tan, K.C.B.; Kung, A.W.C.; Cheung, C.L. Serum metabolomic profiling and its association with 25-hydroxyvitamin D. Clin. Nutr. 2020, 39, 1179–1187. [Google Scholar] [CrossRef]
- Prendiville, O.; Walton, J.; Flynn, A.; Nugent, A.P.; McNulty, B.A.; Brennan, L. Classifying Individuals Into a Dietary Pattern Based on Metabolomic Data. Mol. Nutr. Food Res. 2021, 65, 2001183. [Google Scholar] [CrossRef]
- McNamara, A.E.; Walton, J.; Flynn, A.; Nugent, A.P.; McNulty, B.A.; Brennan, L. The Potential of Multi-Biomarker Panels in Nutrition Research: Total Fruit Intake as an Example. Front. Nutr. 2021, 7, 577720. [Google Scholar] [CrossRef]
- O’Sullivan, A.; Gibney, M.J.; Connor, A.O.; Mion, B.; Kaluskar, S.; Cashman, K.D.; Flynn, A.; Shanahan, F.; Brennan, L. Biochemical and metabolomic phenotyping in the identification of a vitamin D responsive metabotype for markers of the metabolic syndrome. Mol. Nutr. Food Res. 2011, 55, 679–690. [Google Scholar] [CrossRef]
- Cheng, D.; Zhao, X.; Yang, S.; Cui, H.; Wang, G. Metabolomic Signature between Metabolically Healthy Overweight/Obese and Metabolically Unhealthy Overweight/Obese: A Systematic Review. Diabetes Metab. Syndr. Obesity Targets Ther. 2021, 14, 991–1010. [Google Scholar] [CrossRef]
- Ross, A.C.; Manson, J.E.; Abrams, S.A.; Aloia, J.F.; Brannon, P.M.; Clinton, S.K.; Durazo-Arvizu, R.A.; Gallagher, J.C.; Gallo, R.L.; Jones, G.; et al. The 2011 report on dietary reference intakes for calcium and vitamin D from the Institute of Medicine: What clinicians need to know. J. Clin. Endocrinol. Metab. 2011, 96, 53–58. [Google Scholar] [CrossRef]
- Park, J.E.; Pichiah, P.B.T.; Cha, Y.-S. Vitamin D and Metabolic Diseases: Growing Roles of Vitamin D. J. Obes. Metab. Syndr. 2018, 27, 223–232. [Google Scholar] [CrossRef]
- Joseph, J.J.; Langan, S.; Lunyera, J.; Kluwe, B.; Williams, A.; Chen, H.; Sachs, M.C.; Hairston, K.G.; Bertoni, A.G.; Hsueh, W.A.; et al. The association of serum vitamin D with incident diabetes in an African American Population. Nutr. Diabetes 2022, 12, 43. [Google Scholar] [CrossRef]
- Yang, J.; Ou-Yang, J.; Huang, J. Low serum vitamin D levels increase the mortality of cardiovascular disease in older adults A dose-response meta-analysis of prospective studies. Medicine 2019, 98, e16733. [Google Scholar] [CrossRef]
- Infante, M.; Ricordi, C.; Sanchez, J.; Clare-Salzler, M.J.; Padilla, N.; Fuenmayor, V.; Chavez, C.; Alvarez, A.; Baidal, D.; Alejandro, R.; et al. Influence of Vitamin D on Islet Autoimmunity and Beta-Cell Function in Type 1 Diabetes. Nutrients 2019, 11, 2185. [Google Scholar] [CrossRef]
- Finkelstein, J.L.; Pressman, E.K.; Cooper, E.M.; Kent, T.R.; Bar, H.Y.; O’Brien, K.O. Vitamin D Status Affects Serum Metabolomic Profiles in Pregnant Adolescents. Reprod. Sci. 2015, 22, 685–695. [Google Scholar] [CrossRef]
- Nelson, S.M.; A Panagiotou, O.; Anic, G.M.; Mondul, A.M.; Männistö, S.; Weinstein, S.J.; Albanes, D. Metabolomics analysis of serum 25-hydroxy-vitamin D in the Alpha-Tocopherol, Beta-Carotene Cancer Prevention (ATBC) Study. Int. J. Epidemiol. 2016, 45, 1458–1468. [Google Scholar] [CrossRef]
- Lasky-Su, J.; Dahlin, A.; Litonjua, A.A.; Rogers, A.J.; McGeachie, M.J.; Baron, R.M.; Gazourian, L.; Barragan-Bradford, D.; Fredenburgh, L.E.; Choi, A.M.K.; et al. Metabolome alterations in severe critical illness and vitamin D status. Crit. Care 2017, 21, 193. [Google Scholar] [CrossRef]
- Huang, M.; Kelly, R.S.; Kachroo, P.; Chu, S.H.; Lee-Sarwar, K.; Chawes, B.L.; Bisgaard, H.; Litonjua, A.A.; Weiss, S.T.; Lasky-Su, J. Plasma 25-Hydroxyvitamin D Concentrations are Associated with Polyunsaturated Fatty Acid Metabolites in Young Children: Results from the Vitamin D Antenatal Asthma Reduction Trial. Metabolites 2020, 10, 151. [Google Scholar] [CrossRef]
- Stepien, M.; Nugent, A.P.; Brennan, L. Metabolic Profiling of Human Peripheral Blood Mononuclear Cells: Influence of Vitamin D Status and Gender. Metabolites 2014, 4, 396–406. [Google Scholar] [CrossRef]
- Bhargava, P.; Fitzgerald, K.C.; Calabresi, P.A.; Mowry, E.M. Metabolic alterations in multiple sclerosis and the impact of vitamin D supplementation. JCI Insight 2017, 2, e95302. [Google Scholar] [CrossRef]
- Alvarez, J.A.; Chong, E.Y.; Walker, D.I.; Chandler, J.D.; Michalski, E.S.; Grossmann, R.E.; Uppal, K.; Li, S.; Frediani, J.K.; Tirouvanziam, R.; et al. Plasma metabolomics in adults with cystic fibrosis during a pulmonary exacerbation: A pilot randomized study of high-dose vitamin D(3) administration. Metabolism 2017, 70, 31–41. [Google Scholar] [CrossRef]
- Bagheri, M.; Djazayery, A.; Qi, L.; Yekaninejad, M.S.; Chamari, M.; Naderi, M.; Ebrahimi, Z.; Koletzko, B.; Uhl, O.; Farzadfar, F. Effectiveness of vitamin D therapy in improving metabolomic biomarkers in obesity phenotypes: Two randomized clinical trials. Int. J. Obes. 2018, 42, 1782–1796. [Google Scholar] [CrossRef] [PubMed]
- Shirvani, A.; Kalajian, T.A.; Song, A.; Allen, R.; Charoenngam, N.; Lewanczuk, R.; Holick, M.F. Variable Genomic and Metabolomic Responses to Varying Doses of Vitamin D Supplementation. Anticancer. Res. 2020, 40, 535–543. [Google Scholar] [CrossRef] [PubMed]
- Bislev, L.S.; Sundekilde, U.K.; Kilic, E.; Dalsgaard, T.K.; Rejnmark, L.; Bertram, H.C. Circulating Levels of Muscle-Related Metabolites Increase in Response to a Daily Moderately High Dose of a Vitamin D3 Supplement in Women with Vitamin D Insufficiency-Secondary Analysis of a Randomized Placebo-Controlled Trial. Nutrients 2020, 12, 1310. [Google Scholar] [CrossRef] [PubMed]
- Amrein, K.; Lasky-Su, J.A.; Dobnig, H.; Christopher, K.B. Metabolomic basis for response to high dose vitamin D in critical illness. Clin. Nutr. 2021, 40, 2053–2060. [Google Scholar] [CrossRef] [PubMed]
- Laird, E.; McNulty, H.; Ward, M.; Hoey, L.; McSorley, E.; Wallace, J.M.W.; Carson, E.; Molloy, A.; Healy, M.; Casey, M.C.; et al. Vitamin D Deficiency Is Associated with Inflammation in Older Irish Adults. J. Clin. Endocrinol. Metab. 2014, 99, 1807–1815. [Google Scholar] [CrossRef]
- Laird, E.; O’Halloran, A.M.; Carey, D.; Healy, M.; O’Connor, D.; Moore, P.; Shannon, T.; Molloy, A.M.; Kenny, R.A. The prevalence of Vitamin D deficiency and the determinants of 25(OH)D concentration in older Irish adults: Data from The Irish Longitudinal Study on Ageing (TILDA). J. Gerontol. A. Biol. Med. Sci 2018, 73, 519–525. [Google Scholar] [CrossRef]
- Scully, H.; Laird, E.; Healy, M.; Walsh, J.B.; Crowley, V.; McCarrol, K. Geomapping Vitamin D Status in a Large City and Surrounding Population-Exploring the Impact of Location and Demographics. Nutrients 2020, 12, 2663. [Google Scholar] [CrossRef]
- Friedewald, W.T.; Levy, R.I.; Fredrickson, D.S. Estimation of the concentration of low-density lipoprotein cholesterol in plasma, without use of the preparative ultracentrifuge. Clin. Chem. 1972, 18, 499–502. [Google Scholar] [CrossRef]
- Foroutan, A.; Fitzsimmons, C.; Mandal, R.; Piri-Moghadam, H.; Zheng, J.; Guo, A.; Li, C.; Guan, L.L.; Wishart, D.S. The Bovine Metabolome. Metabolites 2020, 10, 233. [Google Scholar] [CrossRef]
- Foroutan, A.; Guo, A.C.; Vazquez-Fresno, R.; Lipfert, M.; Zhang, L.; Zheng, J.; Badran, H.; Budinski, Z.; Mandal, R.; Ametaj, B.N.; et al. Chemical Composition of Commercial Cow’s Milk. J. Agric. Food Chem. 2019, 67, 4897–4914. [Google Scholar] [CrossRef]
- Asano, L.; Watanabe, M.; Ryoden, Y.; Usuda, K.; Yamaguchi, T.; Khambu, B.; Takashima, M.; Sato, S.-I.; Sakai, J.; Nagasawa, K.; et al. Vitamin D Metabolite, 25-Hydorxyvitamin D, Regulates Lipid Metabolism by Inducing Degradation of SREBP/SCAP. Cell Chem. Biol. 2017, 24, 207–217. [Google Scholar] [CrossRef]
- Tsutsumi, M.; Alvarez, U.; Avioli, L.V.; Hruska, K.A. Effect of 1,25-dihydroxyvitamin D3 on phospholipid composition of rat renal brush border membrane. Am. J. Physiol. 1985, 249, F117–F123. [Google Scholar] [CrossRef]
- Thompson, V.W.; Deluca, H.F. Vitamin D and phospholipid metabolism. J. Biol. Chem. 1964, 239, 984–989. [Google Scholar] [CrossRef]
- Thomas, R.L.; Jiang, L.; Adams, J.S.; Xu, Z.Z.; Shen, J.; Janssen, S.; Ackermann, G.; Vanderschueren, D.; Pauwels, S.; Knight, R.; et al. Vitamin D metabolites and the gut microbiome in older men. Nat. Commun. 2020, 11, 5997. [Google Scholar] [CrossRef]
- Jang, C.; Chen, L.; Rabinowitz, J.D. Metabolomics and Isotope Tracing. Cell 2018, 173, 822–837. [Google Scholar] [CrossRef]


| Vitamin D-Insufficient (<50 nmol/L) | Vitamin D-Sufficient (≥50 nmol/L) | |||||||||
|---|---|---|---|---|---|---|---|---|---|---|
| Vitamin D | Placebo Control | Vitamin D | Placebo Control | |||||||
| n = 14 | n = 5 | n = 43 | n = 12 | |||||||
| Mean | SE | Mean | SE | p-Value | Mean | SE | Mean | SE | p-Value | |
| Age (years) | 58.0 | 1.7 | 57.6 | 2.9 | 0.88 | 61.9 | 1.3 | 61.3 | 2.3 | 0.81 |
| BMI (kg/m2) | 29.0 | 0.7 | 27.6 | 1.2 | 0.36 | 28.3 | 0.5 | 27.5 | 0.8 | 0.38 |
| BL 25(OH)D (nmol/L) | 33.8 | 2.5 | 38.9 | 4.3 | 0.33 | 71.4 | 0.3 | 70.4 | 4.0 | 0.83 |
| Post 25(OH)D (nmol/L) | 60.1 | 2.9 | 37.3 | 5.0 | 0.001 | 75.0 | 2.0 | 66.8 | 3.5 | 0.05 |
| BL TC (mmol/L) | 4.9 | 0.2 | 4.3 | 0.3 | 0.06 | 5.1 | 0.2 | 5.6 | 0.3 | 0.15 |
| Post TC (mmol/L) | 5.0 | 0.2 | 4.3 | 0.3 | 0.06 | 5.1 | 0.2 | 5.7 | 0.3 | 0.11 |
| BL HDL (mmol/L) | 1.6 | 0.1 | 1.4 | 0.1 | 0.14 | 1.6 | 0.1 | 1.8 | 0.1 | 0.13 |
| Post HDL (mmol/L) | 1.6 | 0.1 | 1.4 | 0.1 | 0.22 | 1.7 | 0.1 | 1.8 | 0.1 | 0.37 |
| BL LDL (mmol/L) | 2.7 | 0.2 | 2.4 | 0.3 | 0.30 | 3.0 | 0.2 | 3.1 | 0.3 | 0.62 |
| Post LDL (mmol/L) | 2.7 | 0.2 | 2.4 | 0.3 | 0.26 | 3.0 | 0.2 | 3.3 | 0.3 | 0.34 |
| BL TRIG (mmol/L) | 1.3 | 0.2 | 1.2 | 0.4 | 0.78 | 1.2 | 0.1 | 1.3 | 0.2 | 0.35 |
| Post TRIG (mmol/L) | 1.3 | 0.2 | 1.3 | 0.3 | 0.88 | 1.1 | 0.1 | 1.3 | 0.2 | 0.36 |
| BL GLUC (mmol/L) | 5.3 | 0.2 | 5.8 | 0.4 | 0.85 | 5.4 | 0.1 | 5.5 | 0.1 | 0.55 |
| Post GLUC (mmol/L) | 5.3 | 0.2 | 5.7 | 0.4 | 0.46 | 5.2 | 0.2 | 6.3 | 0.4 | 0.027 |
| BL CRP (mmol/L) | 2.3 | 0.5 | 1.5 | 0.8 | 0.37 | 2.2 | 0.3 | 1.8 | 0.6 | 0.60 |
| Post CRP (mmol/L) | 2.5 | 0.6 | 1.5 | 1.1 | 0.44 | 2.0 | 0.3 | 1.8 | 0.5 | 0.75 |
| Insufficient | Sufficient | ||||||||
|---|---|---|---|---|---|---|---|---|---|
| (<50 nmol/L) | (≥50 nmol/L) | ||||||||
| n = 19 | n = 55 | GLM ANCOVA | Pearson’s Correlation | ||||||
| Metabolite (µM) | Mean | SE | Mean | SE | p-Value | q-Value | r | p-Value | q-Value |
| Amino acids | |||||||||
| Threonine | 105.6 | 5.2 | 98.4 | 3.0 | 0.22 | 0.61 | −0.260 | 0.039 | 0.43 |
| Leucine | 119.3 | 4.9 | 108.8 | 3.1 | 0.05 | 0.60 | −0.252 | 0.047 | 0.26 |
| Isoleucine | 65.5 | 2.8 | 57.3 | 1.6 | 0.005 | 0.11 | −0.283 | 0.025 | 0.54 |
| Methionine | 23.3 | 0.9 | 21.8 | 0.4 | 0.12 | 0.37 | −0.271 | 0.031 | 0.15 |
| Biogenic Amines | |||||||||
| Acetyl-ornithine | 0.767 | 0.077 | 1.048 | 0.127 | 0.12 | 0.81 | 0.359 | 0.004 | 0.027 |
| Trans-hydroxy-proline | 8.53 | 0.62 | 7.30 | 0.45 | 0.07 | 1.00 | −0.386 | 0.002 | 0.025 |
| Histidines | |||||||||
| Methylhistidine | 8.64 | 1.14 | 12.08 | 1.05 | 0.044 | 0.24 | 0.034 | 0.79 | 0.91 |
| Short chain fatty acids | |||||||||
| Butyric acid | 1.074 | 0.061 | 0.852 | 0.042 | 0.003 | 0.033 | −0.293 | 0.020 | 0.15 |
| Propionic acid | 0.978 | 0.049 | 0.841 | 0.029 | 0.018 | 0.13 | −0.266 | 0.035 | 0.19 |
| Isobutyric acid | 1.321 | 0.070 | 1.062 | 0.040 | 0.002 | 0.044 | −0.370 | 0.003 | 0.06 |
| Hippuric acid | 5.67 | 0.67 | 7.06 | 0.74 | 0.44 | 0.56 | 0.301 | 0.016 | 0.18 |
| Glycerophospholipids | |||||||||
| LYSOC16.0 | 46.1612 | 2.2421 | 53.0679 | 1.5080 | 0.023 | 0.05 | 0.334 | 0.007 | 0.08 |
| LYSOC18.1 | 12.2015 | 0.7658 | 13.7980 | 0.4883 | 0.14 | 0.18 | 0.254 | 0.045 | 0.12 |
| LYSOC18.0 | 13.3603 | 0.6416 | 15.1602 | 0.5183 | 0.08 | 0.12 | 0.300 | 0.017 | 0.08 |
| LYSOC24.0 | 0.0764 | 0.0044 | 0.0850 | 0.0025 | 0.07 | 0.11 | 0.273 | 0.030 | 0.09 |
| LYSOC26.1 | 0.0644 | 0.0041 | 0.0793 | 0.0028 | 0.008 | 0.030 | 0.334 | 0.007 | 0.06 |
| LYSOC26.0 | 0.3970 | 0.0197 | 0.5063 | 0.0166 | 0.001 | 0.017 | 0.334 | 0.007 | 0.05 |
| LYSOC28.1 | 0.2567 | 0.0116 | 0.3179 | 0.0134 | 0.022 | 0.05 | 0.231 | 0.07 | 0.15 |
| LYSOC28.0 | 0.4684 | 0.0285 | 0.5402 | 0.0183 | 0.042 | 0.08 | 0.230 | 0.07 | 0.15 |
| X14.1SMOH | 5.9577 | 0.1863 | 7.0782 | 0.2366 | 0.019 | 0.05 | 0.186 | 0.14 | 0.23 |
| X16.0SM | 99.2598 | 2.9551 | 111.2394 | 2.5620 | 0.010 | 0.034 | 0.234 | 0.06 | 0.16 |
| PC36.0AE | 1.2157 | 0.0385 | 1.5191 | 0.0448 | <0.001 | <0.001 | 0.337 | 0.007 | 0.24 |
| PC36.6AA | 0.7877 | 0.0501 | 1.0911 | 0.0557 | 0.003 | 0.020 | 0.190 | 0.14 | 0.41 |
| PC36.0AA | 6.0304 | 0.2371 | 7.2132 | 0.2011 | 0.002 | 0.017 | 0.279 | 0.027 | 0.07 |
| X22.2SMOH | 12.7172 | 0.4626 | 14.5825 | 0.4303 | 0.024 | 0.05 | 0.172 | 0.18 | 0.28 |
| PC38.6AA | 58.3369 | 4.1387 | 79.2220 | 3.5197 | 0.001 | 0.011 | 0.295 | 0.019 | 0.07 |
| PC38.0AA | 2.6341 | 0.1392 | 3.3977 | 0.1397 | 0.003 | 0.017 | 0.296 | 0.019 | 0.16 |
| PC40.6AE | 3.5294 | 0.1794 | 4.5342 | 0.1984 | 0.006 | 0.026 | 0.274 | 0.030 | 0.09 |
| X24.1SMOH | 2.5160 | 0.1159 | 2.8307 | 0.0783 | 0.039 | 0.08 | 0.198 | 0.12 | 0.21 |
| PC40.6AA | 15.9087 | 1.0491 | 20.7540 | 0.9707 | 0.011 | 0.034 | 0.221 | 0.08 | 0.16 |
| PC40.2AA | 0.3716 | 0.0168 | 0.4461 | 0.0182 | 0.018 | 0.05 | 0.315 | 0.012 | 0.07 |
| PC40.1AA | 0.2617 | 0.0118 | 0.3296 | 0.0143 | 0.003 | 0.015 | 0.335 | 0.007 | 0.12 |
| Acylcarnitines | |||||||||
| C3OH | 0.0245 | 0.0013 | 0.0277 | 0.0007 | 0.028 | 0.16 | 0.134 | 0.29 | 0.84 |
| C6 | 0.0732 | 0.0041 | 0.0887 | 0.0043 | 0.035 | 0.18 | 0.143 | 0.26 | 0.87 |
| C5OH | 0.0323 | 0.0012 | 0.0355 | 0.0008 | 0.024 | 0.16 | 0.206 | 0.11 | 1.00 |
| C5.1DC | 0.0137 | 0.0005 | 0.0153 | 0.0004 | 0.010 | 0.13 | 0.299 | 0.017 | 0.35 |
| C9 | 0.0381 | 0.0047 | 0.0517 | 0.0036 | 0.005 | 0.20 | 0.317 | 0.011 | 0.46 |
| C12 | 0.0918 | 0.0098 | 0.1204 | 0.0079 | 0.017 | 0.14 | 0.206 | 0.11 | 0.87 |
| C14 | 0.0366 | 0.0031 | 0.0474 | 0.0026 | 0.011 | 0.11 | 0.192 | 0.13 | 1.00 |
| C16 | 0.1045 | 0.0064 | 0.1243 | 0.0044 | 0.007 | 0.14 | 0.188 | 0.14 | 0.93 |
| Low Consumers (<5 µg/day) | High Consumers (≥5 µg/day) | ||||||||
|---|---|---|---|---|---|---|---|---|---|
| n = 35 | n = 40 | GLM ANCOVA | Pearson’s Correlation | ||||||
| Metabolite (µM) | Mean | SE | Mean | SE | p-Value | q-Value | r | p-Value | q-Value |
| Amino Acids | |||||||||
| Alanine | 340 | 10 | 378 | 11 | 0.038 | 0.84 | 0.166 | 0.15 | 1.00 |
| Betaine | 34.8 | 1.3 | 36.2 | 1.6 | 0.37 | 0.82 | 0.238 | 0.040 | 0.88 |
| Biogenic Amines | |||||||||
| Trans-hydroxy-proline | 7.64 | 0.60 | 7.29 | 0.47 | 0.43 | 0.76 | 0.248 | 0.032 | 0.45 |
| Short chain fatty acids | |||||||||
| Butyric acid | 1.026 | 0.061 | 0.796 | 0.036 | 0.001 | 0.022 | −0.181 | 0.12 | 0.44 |
| Propionic acid | 0.945 | 0.037 | 0.807 | 0.031 | 0.001 | 0.011 | −0.192 | 0.10 | 0.72 |
| Isobutyric acid | 1.218 | 0.051 | 1.037 | 0.049 | 0.002 | 0.015 | −0.221 | 0.06 | 1.00 |
| Organic acids | |||||||||
| Methylmalonic acid | 0.2075 | 0.0245 | 0.1347 | 0.0095 | 0.007 | 0.039 | −0.195 | 0.09 | 1.00 |
| Glycerophospholipids | |||||||||
| LYSOC17.0 | 0.9392 | 0.0399 | 1.0656 | 0.0544 | 0.020 | 0.10 | 0.292 | 0.011 | 0.38 |
| X14.1SMOH | 6.2794 | 0.2000 | 7.2237 | 0.2910 | 0.004 | 0.14 | 0.109 | 0.35 | 0.67 |
| X16.1SMOH | 3.8978 | 0.1376 | 4.3241 | 0.1696 | 0.027 | 0.11 | 0.142 | 0.22 | 0.70 |
| PC36.6AA | 0.9254 | 0.0641 | 1.1019 | 0.0626 | 0.010 | 0.07 | 0.227 | 0.05 | 0.42 |
| X22.2SMOH | 13.4302 | 0.4098 | 14.8973 | 0.5612 | 0.006 | 0.10 | 0.169 | 0.15 | 0.62 |
| PC38.6AA | 67.2424 | 3.7674 | 82.0791 | 4.5278 | 0.016 | 0.09 | 0.207 | 0.07 | 0.51 |
| PC40.6AE | 3.9610 | 0.1998 | 4.6367 | 0.2450 | 0.009 | 0.08 | 0.254 | 0.028 | 0.48 |
| PC40.6AA | 17.4317 | 0.9263 | 21.9442 | 1.2138 | 0.007 | 0.08 | 0.227 | 0.05 | 0.56 |
| Acylcarnitines | |||||||||
| C3 | 0.2505 | 0.0138 | 0.2859 | 0.0117 | 0.015 | 0.30 | 0.061 | 0.61 | 1.00 |
| C4 | 0.1725 | 0.0100 | 0.2119 | 0.0148 | 0.016 | 0.21 | 0.050 | 0.67 | 1.00 |
| C9 | 0.0412 | 0.0035 | 0.0534 | 0.0045 | 0.005 | 0.20 | 0.083 | 0.48 | 1.00 |
| Insufficient (<50 nmol/L) | Sufficient (≥50 nmol/L) | |||||||||||||
|---|---|---|---|---|---|---|---|---|---|---|---|---|---|---|
| n = 19 | n = 55 | |||||||||||||
| Baseline | Post-Intervention | RM ANCOVA (q-Value) | Baseline | Post-Intervention | RM ANCOVA (q-Value) | |||||||||
| Metabolite (µM) | Mean | SE | Mean | SE | Time | Treatment | T * T | Mean | SE | Mean | SE | Time | Treatment | T * T |
| Amino Acids | ||||||||||||||
| Leucine | 119.3 | 4.9 | 122.3 | 5.9 | 0.33 | 0.83 | 1.00 | 108.8 | 3.1 | 117.5 | 3.5 | 1.00 | 1.00 | 1.00 |
| Betaine | 34 | 2 | 36.5 | 1.9 | 0.26 | 0.68 | 1.00 | 36.1 | 1.2 | 36.1 | 1.3 | 1.00 | 0.82 | 0.10 |
| Taurine | 62.8 | 4.3 | 67.9 | 4.2 | 0.92 | 0.98 | 0.53 | 66.4 | 2.5 | 67.0 | 2.2 | 1.00 | 0.85 | 0.29 |
| Biogenic Amines | ||||||||||||||
| Serotonin | 1.021 | 0.106 | 1.237 | 0.166 | 0.99 | 1.00 | 0.76 | 0.894 | 0.063 | 0.986 | 0.072 | 1.00 | 1.00 | 0.24 |
| Spermidine | 0.238 | 0.008 | 0.242 | 0.007 | 1.00 | 1.00 | 0.14 | 0.241 | 0.004 | 0.234 | 0.004 | 1.00 | 1.00 | 0.77 |
| Organic Acids | ||||||||||||||
| Choline | 9.36 | 0.44 | 9.16 | 0.37 | 0.24 | 1.00 | 1.00 | 9.48 | 0.28 | 9.34 | 0.24 | 1.00 | 1.00 | 0.80 |
| SCFA | ||||||||||||||
| Butyric acid | 1.074 | 0.061 | 0.934 | 0.053 | 0.27 | 1.00 | 1.00 | 0.852 | 0.042 | 0.96 | 0.052 | 1.00 | 1.00 | 0.94 |
| Propionic acid | 0.978 | 0.049 | 0.97 | 0.057 | 0.22 | 1.00 | 0.95 | 0.841 | 0.029 | 1.032 | 0.036 | 1.00 | 0.98 | 0.98 |
| Isobutryic acid | 1.321 | 0.07 | 1.074 | 0.063 | 0.31 | 1.00 | 0.94 | 1.062 | 0.04 | 1.111 | 0.041 | 1.00 | 1.00 | 0.74 |
| Glycerophospholipids | ||||||||||||||
| LYSOC18.1 | 12.2015 | 0.7658 | 13.6343 | 0.9711 | 1.00 | 0.89 | 1.00 | 13.798 | 0.4883 | 14.3698 | 0.5167 | 0.96 | 0.78 | 0.79 |
| LYSOC20.3 | 0.878 | 0.0834 | 1.0139 | 0.1067 | 1.00 | 0.85 | 0.69 | 0.8636 | 0.0568 | 1.0213 | 0.0578 | 0.99 | 1.00 | 0.17 |
| PC32.2AA | 5.8126 | 0.1846 | 5.8335 | 0.3155 | 1.00 | 0.71 | 0.98 | 6.2932 | 0.2394 | 6.0296 | 0.2074 | 1.00 | 0.73 | 0.85 |
| Acylcarnitines | ||||||||||||||
| C0 | 36.2855 | 1.4732 | 35.161 | 1.7376 | 1.00 | 0.66 | 0.97 | 36.2065 | 1.1691 | 35.8572 | 1.0347 | 1.00 | 0.32 | 0.49 |
| C4OH | 0.0421 | 0.0033 | 0.037 | 0.0023 | 0.96 | 0.51 | 0.96 | 0.0462 | 0.0031 | 0.0393 | 0.0018 | 1.00 | 0.29 | 0.53 |
| C9 | 0.0381 | 0.0047 | 0.0356 | 0.004 | 1.00 | 0.65 | 0.96 | 0.0517 | 0.0036 | 0.0503 | 0.0038 | 1.00 | 0.33 | 0.34 |
| C7DC | 0.0651 | 0.0126 | 0.05 | 0.0123 | 1.00 | 0.86 | 0.53 | 0.0708 | 0.0076 | 0.0559 | 0.0074 | 1.00 | 0.31 | 0.79 |
| C10 2 | 0.0615 | 0.0036 | 0.0441 | 0.0026 | 1.00 | 0.81 | 0.50 | 0.0593 | 0.0021 | 0.048 | 0.0019 | 1.00 | 0.73 | 0.78 |
| C12.1 | 0.1112 | 0.0083 | 0.094 | 0.0071 | 1.00 | 0.06 | 0.97 | 0.1331 | 0.007 | 0.1097 | 0.0063 | 1.00 | 0.25 | 1.00 |
| C12 | 0.0918 | 0.0098 | 0.0741 | 0.0063 | 1.00 | 0.06 | 1.00 | 0.1204 | 0.0079 | 0.0978 | 0.008 | 1.00 | 0.27 | 1.00 |
| C14.2 | 0.0518 | 0.0051 | 0.0382 | 0.0032 | 1.00 | 0.06 | 1.00 | 0.0513 | 0.0033 | 0.0454 | 0.0033 | 1.00 | 0.24 | 0.78 |
| C14.1 | 0.146 | 0.0131 | 0.1082 | 0.0092 | 1.00 | 0.05 | 0.97 | 0.1664 | 0.0102 | 0.1335 | 0.009 | 1.00 | 0.98 | 1.00 |
| C14 | 0.0366 | 0.0031 | 0.0315 | 0.0025 | 1.00 | 0.06 | 1.00 | 0.0474 | 0.0026 | 0.0384 | 0.0024 | 1.00 | 0.28 | 0.72 |
| C12DC | 0.0066 | 0.0003 | 0.0062 | 0.0002 | 1.00 | 0.45 | 1.00 | 0.007 | 0.0002 | 0.0062 | 0.0002 | 1.00 | 0.48 | 0.77 |
| C14.1OH | 0.0198 | 0.0016 | 0.0174 | 0.0012 | 1.00 | 0.020 | 1.00 | 0.0214 | 0.0009 | 0.02 | 0.0009 | 1.00 | 0.45 | 0.74 |
| C16.2 | 0.0129 | 0.0009 | 0.0118 | 0.0008 | 1.00 | <0.001 | 1.00 | 0.0135 | 0.0007 | 0.0127 | 0.0006 | 1.00 | 0.25 | 0.83 |
| C16.1 | 0.0453 | 0.0028 | 0.0435 | 0.0026 | 1.00 | 0.040 | 0.96 | 0.0515 | 0.0022 | 0.0465 | 0.002 | 1.00 | 0.25 | 0.82 |
| C16 | 0.1045 | 0.0064 | 0.101 | 0.0068 | 1.00 | 0.11 | 1.00 | 0.1243 | 0.0044 | 0.1108 | 0.0037 | 1.00 | 0.31 | 0.71 |
| C16.2OH | 0.009 | 0.0004 | 0.0099 | 0.0004 | 1.00 | 0.11 | 1.00 | 0.0097 | 0.0003 | 0.0098 | 0.0003 | 1.00 | 0.25 | 0.75 |
| C16.1OH | 0.0141 | 0.0006 | 0.0137 | 0.0008 | 1.00 | 0.13 | 1.00 | 0.0146 | 0.0005 | 0.0144 | 0.0003 | 1.00 | 0.29 | 0.58 |
| C16OH | 0.0082 | 0.0003 | 0.009 | 0.0004 | 1.00 | 0.19 | 0.81 | 0.0086 | 0.0003 | 0.0093 | 0.0003 | 1.00 | 0.29 | 0.76 |
| C18.2 | 0.0592 | 0.0037 | 0.0547 | 0.0037 | 1.00 | 0.17 | 0.78 | 0.0552 | 0.0021 | 0.0521 | 0.0021 | 1.00 | 0.25 | 0.55 |
| C18.1 | 0.1532 | 0.0085 | 0.1424 | 0.0096 | 1.00 | 0.06 | 1.00 | 0.1619 | 0.0062 | 0.143 | 0.0057 | 1.00 | 0.42 | 0.82 |
| C18 | 0.0431 | 0.0029 | 0.0385 | 0.0024 | 1.00 | 0.42 | 0.96 | 0.0504 | 0.0022 | 0.0419 | 0.0014 | 1.00 | 0.99 | 0.70 |
| C18.1OH | 0.0114 | 0.0005 | 0.0128 | 0.0004 | 1.00 | 0.07 | 1.00 | 0.0117 | 0.0004 | 0.0128 | 0.0004 | 1.00 | 0.35 | 0.24 |
| Metabolite | r | p-Value | q-Value |
|---|---|---|---|
| Baseline 25(OH)D and post-intervention metabolite concentrations | |||
| Glycerophospholipids | |||
| LYSOC26.0 | −0.274 | 0.018 | 0.61 |
| Post-intervention 25(OH)D and metabolite concentrations post-intervention | |||
| Amino acids | |||
| Glycine | 0.291 | 0.021 | 0.12 |
| Taurine | 0.294 | 0.019 | 0.14 |
| Glutamic acid | −0.410 | 0.001 | 0.019 |
| Citrulline | 0.337 | 0.007 | 0.08 |
| Biogenic Amines | |||
| Putrescine | 0.325 | 0.009 | 0.13 |
| Methionine sulfoxide | 0.344 | 0.006 | 0.040 |
| Acetyl-ornithine | 0.314 | 0.012 | 0.06 |
| Organic acids | |||
| HPHPA | 0.266 | 0.035 | 0.39 |
| Succinic acid | 0.352 | 0.005 | 0.10 |
| Methylmalonic acid | 0.251 | 0.047 | 0.26 |
| Homovanillic acid | 0.265 | 0.036 | 0.26 |
| Carbohydrates | |||
| Glucose | −0.263 | 0.037 | 1.00 |
| Glycerophospholipids | |||
| PC36.0AA | 0.333 | 0.008 | 0.26 |
| PC38.0AA | 0.303 | 0.016 | 0.18 |
| PC40.2AA | 0.270 | 0.032 | 0.27 |
| PC40.1AA | 0.323 | 0.010 | 0.17 |
| Acylcarnitines | |||
| C3.1 | −0.264 | 0.036 | 1.00 |
| C12 | 0.249 | 0.049 | 0.98 |
| Baseline 25(OH)D and change in metabolite concentrations | |||
| Glycerophospholipids | |||
| LYSOC16.1 | −0.239 | 0.040 | 0.28 |
| LYSOC16.0 | −0.332 | 0.004 | 0.13 |
| LYSOC17.0 | −0.251 | 0.031 | 0.26 |
| LYSOC18.0 | −0.268 | 0.021 | 0.24 |
| LYSOC26.0 | −0.298 | 0.010 | 0.17 |
| Acylcarnitines | |||
| C5.1DC | 0.243 | 0.037 | 0.019 |
| Change in 25(OH)D and change in metabolite concentrations | |||
| Amino Acids | |||
| Tryptophan | 0.230 | 0.048 | 1.00 |
| Glycerophospholipids | |||
| LYSOC16.1 | 0.269 | 0.020 | 0.14 |
| LYSOC16.0 | 0.338 | 0.003 | 0.06 |
| LYSOC17.0 | 0.249 | 0.032 | 0.16 |
| LYSOC18.0 | 0.309 | 0.007 | 0.08 |
| LYSOC20.3 | 0.264 | 0.023 | 0.13 |
| LYSOC26.0 | 0.356 | 0.002 | 0.06 |
| PC40.6AA | 0.271 | 0.020 | 0.17 |
| Acylcarnitines | |||
| C3OH | 0.275 | 0.018 | 0.70 |
Disclaimer/Publisher’s Note: The statements, opinions and data contained in all publications are solely those of the individual author(s) and contributor(s) and not of MDPI and/or the editor(s). MDPI and/or the editor(s) disclaim responsibility for any injury to people or property resulting from any ideas, methods, instructions or products referred to in the content. |
© 2023 by the authors. Licensee MDPI, Basel, Switzerland. This article is an open access article distributed under the terms and conditions of the Creative Commons Attribution (CC BY) license (https://creativecommons.org/licenses/by/4.0/).
Share and Cite
McCourt, A.F.; O’Sullivan, A.M. Influence of Vitamin D Status and Supplementation on Metabolomic Profiles of Older Adults. Metabolites 2023, 13, 166. https://doi.org/10.3390/metabo13020166
McCourt AF, O’Sullivan AM. Influence of Vitamin D Status and Supplementation on Metabolomic Profiles of Older Adults. Metabolites. 2023; 13(2):166. https://doi.org/10.3390/metabo13020166
Chicago/Turabian StyleMcCourt, Aislinn F., and Aifric M. O’Sullivan. 2023. "Influence of Vitamin D Status and Supplementation on Metabolomic Profiles of Older Adults" Metabolites 13, no. 2: 166. https://doi.org/10.3390/metabo13020166
APA StyleMcCourt, A. F., & O’Sullivan, A. M. (2023). Influence of Vitamin D Status and Supplementation on Metabolomic Profiles of Older Adults. Metabolites, 13(2), 166. https://doi.org/10.3390/metabo13020166