Abstract
In response to Iron deprivation and in specific environmental conditions, the cyanobacteria Anabaena flos aquae produce siderophores, iron-chelating molecules that in virtue of their interesting environmental and clinical applications, are recently gaining the interest of the pharmaceutical industry. Yields of siderophore recovery from in vitro producing cyanobacterial cultures are, unfortunately, very low and reach most of the times only analytical quantities. We here propose a four-step experimental pipeline for a rapid and inexpensive identification and optimization of growth parameters influencing, at the transcriptional level, siderophore production in Anabaena flos aquae. The four-steps pipeline consists of: (1) identification of the promoter region of the operon of interest in the genome of Anabaena flos aquae; (2) cloning of the promoter in a recombinant DNA vector, upstream the cDNA coding for the Green Fluorescent Protein (GFP) followed by its stable transformation in Escherichia Coli; (3) identification of the environmental parameters affecting expression of the gene in Escherichia coli and their application to the cultivation of the Anabaena strain; (4) identification of siderophores by the combined use of high-resolution tandem mass spectrometry and molecular networking. This multidisciplinary, sustainable, and green pipeline is amenable to automation and is virtually applicable to any cyanobacteria, or more in general, to any microorganisms.
1. Introduction
Siderophores are low-molecular-weight iron-chelating molecules secreted by microorganisms in response to iron deprivation and responsible for extracellular binding and intracellular uptake of ferric ions [1]. Almost all known bacterial species produce siderophores, which represent the molecules mostly involved in iron scavenging in the microbial world [2]. Several microorganisms can also uptake siderophores from neighbouring species (xenosiderophores) and pressuring producers to biosynthesise new siderophores.
The need to survive in habitual low iron conditions (lakes, rivers, and oceans present iron in nM concentration [3]) has led to the development of these excellent iron chelators, each endowed with peculiar structural features. Many siderophore structures have been isolated from cyanobacteria, with schizokinen from the cyanobacteria Anabaena sp. (PCC-7120) being the first one reported [4]. The overall structure of cyanobacterial siderophores can vary among species; however, the functional groups that chelate ferric iron are relatively conserved and include hydroxamates [5], catecholate [6], carboxylates and alfa-hydroxy-carboxylates, all featuring two oxygen donor atoms incorporated in either linear or cyclic structure [7]. Some siderophores are membrane-anchored amphiphilic molecules, a chemical feature that allows limited diffusion of siderophore–iron complexes [8].
In virtue of their potential environmental and clinical application, siderophores are recently gaining the interest of the pharmaceutical industry. As environmental tools, siderophores could find immediate application in protecting agricultural and aquaculture from metal pollution [9]. As pharmaceuticals, siderophores are effective in inhibiting metalloenzymes [10] and exert an atheroprotective effect in humans [11]. Siderophore-rich functional foods and food additives are under investigation in virtue of their efficacy in reducing iron overload (and the consequent oxidative stress), commonly occurring in people affected by cardiovascular diseases [11,12]. Recently, siderophore-conjugated antibiotics have been under testing to upgrade anti-infective therapy [13].
The different industrial fields interested in siderophores suffer, however, from the low yields of siderophore recovery from in vitro producing microbial cultures. Indeed, most of the times, the yield of siderophore produced in vitro achieves barely analytical quantities. Notwithstanding, yields are greatly improved upon optimization of the microbial growth conditions [14]. Till now, the identification of the ideal physical/chemical parameters for optimal siderophore production has been achieved using the One Strain Many Compounds (OSMAC) protocol [15]. The latter consists in the testing of different growth media to cultivate the siderophore-producing specific strain. Small-scale cultures (20 to 50 mL in volume) are ultimately compared in terms of final yield of siderophore production. The procedure is, however, expensive and time consuming (siderophore production in cyanobacteria requires 30 days of culturing before harvesting) and not suitable for high throughput screening and automation.
We here propose an alternative experimental pipeline to rapidly identify growth parameters influencing and boosting siderophore production. The rationale of this four-step pipeline relies on the fact that: (i) the enzymes responsible for siderophore biosynthesis are most of the time clustered in a unique operon and are thus under the control of a single promoter, and that (ii) these operons are tightly regulated at the transcriptional levels and controlled in many ways (iron availability, product negative feedback, substrate availability, temperature, pH, media composition, culture crowding). The four-step pipeline includes: (1) identification of the promoter region of the operon of interest in the genome of the microorganism; (2) cloning of the promoter in a recombinant DNA vector, upstream of the cDNA coding for the Green Fluorescent Protein (GFP) followed by its stable transformation in Escherichia coli; (3) identification of the growth parameters affecting expression of the gene in Escherichia coli and their application to the cultivation of the Anabaena strain; (4) analyses of the cultures by extraction with organic solvents and dereplication by the combined use of high-resolution tandem mass spectrometry with molecular networking.
With the aim to test our platform, we here describe its application in identifying growth parameters and environmental conditions affecting at the transcriptional level the production of siderophores such as schizokinen, synechobactin A by the cyanobacteria Anabaena flos aquae UTEX1444 (synonym, Anabaena variabilis Kutzing, Anabaena variabilis ATCC 29413, Thrichormus variabilis ATCC 29413, etc.) [16,17,18]. The results of the screening allowed the identification of temperature, pH, osmolarity, as well as iron and citrate concentrations as factors affecting, at the transcriptional level, siderophore production. Similarly, the analysis of the siderophore promoter allowed the identification of an unprecedented citrate responsive element affecting transcription of gene involved in siderophore production in Anabaena flos aquae.
To validate the pipeline, the identified growth parameters are here confirmed in in vitro cultures of Anabaena flos aquae UTEX 1444, with their extracts analysed and siderophores identified using our dereplication strategy based on the LC-HRMS based molecular networking [19].
2. Materials and Methods
2.1. Materials
Bactotryptophan (code 91079-40-2); Bacto yeast (code 8013-01-2); Sodium Chloride (code 7647-14-5); Agar (code 9002-18-0); Calcium Chloride (code 10035-04-8); Isopropanol (code 67-63-0); Ethanol (code 64-17-5); SSC Buffer (code 6135-04-3); Hind III (code 81295-22-9); BGL II (code 81295-12-7); Ammonium Citrate Tribasic (code 3458-72-8); Citric Acid (code 77-92-9); Lysine (code 56-87-1); Ferrous Sulphate (code 7720-78-7) were all from Sigma Aldrich. Glycerol (code 56-81-5); Midiprep Kit, (code K0841); Agarose Gel (code 9012-36-6); Propidium Iodide (code 25535-16-4); DNA Digestion Kit (code AM1907); Ligation Buffer (code IVGN2104) were from Thermo Fischer Scientific. Ampicillin (code 69-52-3) and Tris Acetate Buffer (code 135852-26-5) were from Fischer Scientific; Blue-Orange Loading Dye was from Promega; Miniprep Kit was from Euro genomics and Ferric Chloride (code 7705-08-0) was from Merck Millipore.
2.2. Anabaena flos Aquae Genome Analyses
The genome of Anabaena variabilis ATCC 29,413 was retrieved from GenBank (Accession: CP000117.1, National Library of Medicine, NIH) [20]. The Iuc operon was analysed by means of Operon Mapper [21] to identify operon coordinates, operon–gene pairs, ORF coordinates and predict gene and protein sequences. The promoter region of the Iuc operon was analysed by using the software BacPP [22].
2.3. Bacterial Cultures
Anabaena flos aquae UTEX 1444 gifted by prof. Antonio Pollio (Department of Biology, Unina, Italy) was cultured in FW BG11 medium (freshwater BG11, 1L of the solution contains: Na2EDTA—1 mg, Citric Acid—6 mg, NaNO3- 500 mg, K2HPO43H2O- 40 mg, MgSO4 × 7H2O- 75 mg, CaCl2- 26.4 mg, NaCO3- 17.1 mg, NiSO4 (NH4)2 SO46H2O—250 µL of 0.1 mM stock solution, Na2SeO4—100 µL of 0.1 mM stock solution, Nitsch Solution—1 mL (where 100 mL solution contains: concentrated H2SO4—0.5mL, MnSO4.H2O—2.29 mg, ZnSO4.7H2O—0.5 g, CuSO4.5H2O—15.9 mg, Na2MoO4.2H2O—0.025 g, H3BO3—0.5 g, and, CoCl3.6H2O—0.135 g)) fortified with vitamin mix (100 mL of 10X solution contains: nicotine acid—100 mg, PABA—10 mg, biotin—1 mg, thiamine—251 mg, vitamin B12—1 mg, folic acid—1mg, inositol—1 mg, Calcium-pantothenate—100 mg). Cultures were grown in culture media with six different concentrations of citrate supplemented as sodium citrate. The concentration of sodium citrate was determined by making a series of dilutions from a 100 mM parent solution to get the following concentrations, such as 0 mM (#1); 0.1 mM (#2); 1 mM (#3); 10 mM (#4); 100 mM (#5); and Standard FW BG11 STD (#6). Then, a second serial dilution was made for cultures supplemented of ferric ammonium citrate (concentration from 0 µM to 5 µM). Triplicates of all cultures were cultivated at the temperature of 29˚C for 30 days.
E. coli was grown either in Luria Broth (Bacto tryptone—10 g/L; Bacto yeast—5 g/L; NaCl—10 g/L) or in Minimal Medium (Glucose 1g/L; KH2PO4 10g/L, sodium citrate 0.5 g/L, MgSO4.7H2O 0.1 g/L; (NH4)2 SO4 1g/L), at pH 7.0 (NaOH) at 37 °C with gentle shaking.
2.4. Cloning of Iuc-GFP Vector
The Iuc promoter sequence was produced using synthetic DNA strands produced by Eurofins Genomics. Single strands were annealed in SSC buffer (Sodium Chloride, 0.15 M, and Sodium Citrate, 15 mM at pH 7.0) in a thermocycler (95 °C for 10 min, slowly cooled to 35˚C (Δ = −1 °C/min)). Double strand formation was confirmed by running electrophoresis gel and using single non-annealed filaments as standards. DNA was quantified using Thermo Scientific™ NanoDrop™ Spectrophotometers. The obtained Iuc promoter was then digested with the restriction enzymes BglII and HindIII to generate ends cohesive with the accepting pCDNA3.1 GFP vector. pcDNA3.1(+) eGFP was digested with BglII and HindIII [23]. The digested vector was purified via electrophoresis on a 0.8% Low Melting agarose. Vector and the insert were ligated and transformed in chemically competent E. coli cells. Correctness of cloning and transformation was ensured via sequencing of the transformed DNA.
2.5. Spectrofluorimetric Measurement of GFP Expression
Aliquots (50 µL) of Iuc-GFP expressing E. coli culture were challenged for Iuc promoter activity and GFP expression in a 96 or 354-well black optiplate (Perkin Elmer, Waltham, USA). Intracellular GFP fluorescence was measured in a Perkin Elmer Envision 2105 Multiplate reader (Perkin Elmer) as already reported [24], using the inbuilt monochromator and with the following parameters: λexc = 488 nm, λems = 509 nm, and monochromator cut off 360 nm. After the GFP measurement, aliquots were transferred in transparent Optiplate (Perkin Elmer, Waltham, USA) for nephelometric measurement (λ = 600 nm). This second measurement indicates the total number of bacterial cells in each well and was used for normalization. Normalized GFP expression is reported as the ratio between intracellular GFP fluorescence and absorbance of the culture at 600 nm ± SD. Statistical analysis and p value calculation was performed by means of GraphPad Prism 6.0.
2.6. LC-HRMS and Molecular Networking of the Extracts
LC-HRMS and molecular networking were performed according to [25] with slight modifications. A Thermo LTQ Orbitrap XL high-resolution ESI mass spectrometer coupled to an Agilent model 1100 LC system was used to perform LC-HRMS experiments. A 5-µm Kinetex C18 column (50 × 2.10 mm), maintained at room temperature, was eluted at 200 mL min−1 with H2O (supplemented with 0.1% HCOOH) and MeOH, using gradient elution. The gradient program was as follows: 10% MeOH for 3 min, 10%→100% MeOH for 15 min, 100% MeOH for 12 min. Mass spectra were acquired in positive ion detection mode. Data were collected in the data-dependent acquisition (DDA) mode, in which the fifth most intense ions of a full-scan mass spectrum were subjected to high-resolution tandem mass spectrometry (HRMS/MS) analysis. The m/z range for data-dependent acquisition was set between 150 and 2000 amu. HRMS/MS scans were obtained for selected ions with CID fragmentation, isolation width of 2.0, normalized collision energy of 35, Activation Q of 0.250, and activation time of 30 ms. Data were analysed using Thermo Xcalibur software.
Pre-processing of raw files was performed through MZmine 2.53 [26] The mass detection was performed on raw data and exact masses with mass level 1 and centroided masses with mass level 2, by keeping the noise level at 10,000. Chromatograms were built using an ADAP module with a minimum height of 10,000, and m/z tolerance of 0.01 (or 20 ppm). Peak alignment was performed using the Join aligner algorithm (m/z tolerance at 0.01 (or 10 ppm), absolute RT tolerance at 0.3 min). [M+Na–H], [M+K–H], [M+Mg−2H], [M+NH3], [M-Na+NH4], [M+1, 13C], [M-35Cl+37Cl] +, [M+56Fe-3H]+ adducts were filtered out by setting the maximum relative height at 100%. Peaks without associated MS/MS spectra were finally filtered out from the peak list. Clustered data were then exported to an mgf file for GNPS, while chromatographic data including retention times, peak areas, and peak heights were exported to a csv file. A Feature-Based Molecular Network [27,28] was generated on GNPS’s online platform [29], with the following parameters: the precursor ion mass tolerance was set to 0.05 Da and the MS/MS fragment ion tolerance to 0.05 Da, cosine score above 0.7 and more than 5 matched peaks. For GNPS’s library search, a cosine score of 0.7 and at least 6 matched peaks were set. The molecular network was visualized using Cytoscape software [30].
3. Results
3.1. Identification of the Promoter Region of the Operon Iuc in Anabaena Flos Aquae
We have previously reported that Anabaena flos aquae UTEX 1444 produces a cluster of chemically related siderophores (including schizokinen, rhizobactin 1021, synechobactin, and aerobactin) in a condition of iron limitation [31,32]. Till now, the yield of these siderophores from Anabaena flos aquae has been low [31]. Schizokinen is one of the most structurally well-defined hydroxamate siderophores and is produced by some Anabaena species in freshwater [33]. It is formed when two molecules of N4-hydroxy-1-aminopropane are bound to citrate at positions 1 and 3 of citric acid [5]. Schizokinen is an intermediate of synthesis of another siderophore, rhizobactin 1021, with whom it shares the same enzymatic producing machinery. This latter is also involved in the biosynthesis of the two structurally similar siderophores synechobactin and aerobactin [34,35].
While siderophores are usually produced by non-ribosomal peptide synthetase (NRPS), schizokinen, rhizobactin 1021, synechobactin and aerobactin backbones are assembled by a NRPS-independent siderophore synthetase (NIS) [36]. The NIS biosynthesis pathway for schizokinen involves the proteins IucA and IucC (Figure 1A). IucA catalyses the attachment of the first N-acetyl-N-hydroxylysine to a carboxylic group of citric acid to yield N-citryl-N-acetyl-N-hydroxylysine, whereas IucC catalyses the attachment of the second N-acetyl-N-hydroxylysine to the carboxylic group of N-citryl-N-acetyl-N-hydroxylysine to yield schizokinen [37] (Figure 1A).
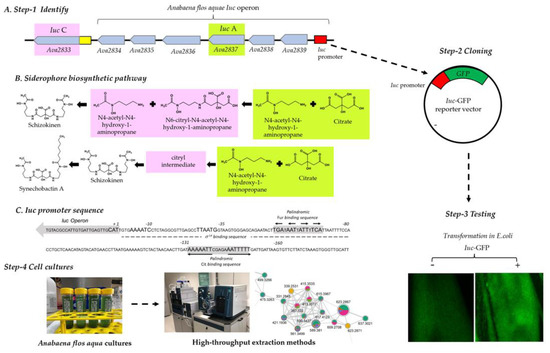
Figure 1.
(A): Description of the four steps of the proposed platform: Step 1: Identification of the operon: the cartoon describes the arrangement of Iuc operon in Anabaena flos aquae UTEX 1444 (namely, A. variabilis ATCC 29413) with the Iuc promoter (red box), IucA (green region) and the IucC (pink region) genes highlighted; Step 2: Cloning of Iuc promoter (red box) upstream of the cDNA coding for GFP (green box) in the reporter vector Iuc-GFP; Step 3: testing of conditions activating GFP expression in transformed Iuc-GFP E. coli. The photographs show E. coli transformed (+) or not (-) with Iuc-GFP growing on agar plate and analysed under a fluorescent microscope; Step 4 analyses of Anabaena flos aquae cultures via dereplication by the combined use of high-resolution tandem mass spectrometry with molecular networking. (B) Biosynthesis reactions leading to schizokinen and synechobactin A with, highlighted in green and pink, those catalysed by IucA and Iuc, respectively. (C) Iuc promoter sequence showing the first ATG (+1) in the Iuc operon and the σ54 binding region. Predicted Fur and Cit binding sequences are highlighted in grey.
The first step of our screening pipeline included the identification of NIS operon in the genome of Anabaena flos aquae UTEX 1444 (namely, A. variabilis ATCC 29413). GenBank allocates the IucA/IucC operon (from locus Ava_2833 to locus Ava_2839, Figure 1A) in a ~12.5 Kb long sequence on the complementary strand of Anabaena chromosome (genomic region 3,506,499 to 3,518,085). The region was analysed with an Operon mapper [38] to identify operons, transcription units and promoter regions. All the transcripts present high similarity to proteins involved in siderophore biosynthesis, as reported in Supplementary Figure S1. The software attributes to the aminoacidic sequences coded by the genes IucA, Ava_2836, Ava_2835 and IucC similarity to proteins involved in the rhizobactin siderophore biosynthesis RhbC (IucA), RhbD (Acetyltransferases, including N-acetylases of ribosomal proteins), RhbE (Lysine/ornithine N-monooxygenase) and RhbF (IucC), respectively [39]. Ava_2839 and Ava_2838 code for an aminobutyrate aminotransferase and a Glutamate decarboxylase, respectively. Ava_2834 was instead found to be similar to a hypothetical protein with unknown function. A single operon is predicted spanning from Ava_2839 to Ava_2834 and includes IucA but not IucC, which, on the contrary, seems to be an independent transcription unit (Figure 1A). The Iuc operon presents a ~670 bp long promoter region allocated upstream of the Ava_2839 coding sequence (Figure 1C). The promoter was analysed in silico with the prediction tool BacPP [40]. The software confirmed the presence in the first 160 bp of the promoter of a binding region for sigma factors σ54 (promoting transcription of genes as consequence of metabolite deprivation) as well as a conserved palindromic binding sequence for Fur proteins [41] (inhibiting transcription of genes in the presence of iron) (Figure 1C).
3.2. Construction of the Reporter Vector for Iuc Promoter Activity
A DNA fragment corresponding to the 160 bp long operon promoter region (genomic region 3,517,420 to 3,517,580) was synthesized in vitro and ligated into the vector pCDNA3.1(+) E-GFP, between restriction sites for the endonucleases BglII and HindIII, to create an expression vector (from now on, referred to as Iuc-GFP (Figure 1A, step 2)). The cloning procedure removed from the vector any other promoter sequence that could have influenced the bacterial expression of GFP. In order to facilitate the cloning process, two flanking regions cohesive to BglII and HindIII were included at the 5′ and 3′ ends of the Iuc promoter, respectively. The Iuc -GFP reporter vector was then transformed in E. coli for the downstream steps of the pipeline (Figure 1A, step 3). Correctness of the DNA sequence was confirmed upon sequencing of the full vector. Compared to untransformed E. coli cells, Iuc-GFP cells were endowed with a brighter intracellular green fluorescence, as shown in the microscopy panel of Figure 1A, suggesting a basal activity of the Iuc promoter in E.coli.
3.3. Screening of the Environmental Conditions Promoting Iuc Promoter Activation
The screening of the growth conditions stimulating Iuc promoter activity in E.coli cells was achieved by measuring E. coli intracellular GFP fluorescence. The multiplate Spectrofluorometer used to measure GFP intensity (see Methods for details) required very small culture volumes (50 μL) and allowed the simultaneous testing of multiple growth parameters with high reproducibility, as a result of the several technical and experimental replicates. We started testing environmental conditions known to stimulate production of secondary metabolites (often produced by bacteria in response to thermic, acid or osmotic stress conditions) as well as substrates of Iuc enzymes (citrate and Lysin). Table 1 reports the tested parameters, the range of testing, the optimal conditions suggested by the screening and the fold induction of GFP fluorescence achieved at the optimal condition compared to the normal growth condition. As result of the screening, we identified optimal GFP expression from Iuc-GFP in E. coli grown in Luria Broth Medium (as well as in Minimal Media): optimal temperature 29 °C, pH 7.5, and supplementation with Glucose (2g/L), NaCl (9.5 g/L), Fe3+ 39.5 μM (or 37 μM Fe2+), 2.6 mM Citrate and 0.75 mg/L of Lysine.

Table 1.
Results of the optimization of GFP expression from the reporter vector Iuc-GFP in E. coli.
In cyanobacteria, the production of siderophore is upregulated under iron limitation. The Iuc operon is transcriptionally regulated by Fe3+ ions, thanks to cis-acting transcription repressors belonging to the Fur family [41]. In the presence of iron, Fur proteins bind and repress the Iuc operon. In a condition of iron limitation, Fur proteins detach from the promoter allowing cyanobacterial RNA polymerase to transcribe the operon. As shown in Figure 1C, detailed analysis of the promoter region of Iuc of Anabaena flos aquae confirmed in this strain the presence of the Fur responsive element. One of the strategies commonly used to increase the yield of in vitro produced siderophore is to cultivate cyanobacteria in iron-depleted media [31]. However, it is notoriously difficult to determine for each specific cyanobacteria the optimal Fe3+ concentration since iron is essential for many other bacterial processes. Indeed, as shown in Figure 2A and Table 1, in our recombinant system, the ability of iron to control the Iuc promoter of Anabaena flos aquae is preserved, with intracellular GFP expression depending on Fe3+ concentration. The relation between Fe3+ concentration and GFP production is described by a bell-shaped curve with optimal Fe3+ concentration for GFP in the micromolar range.
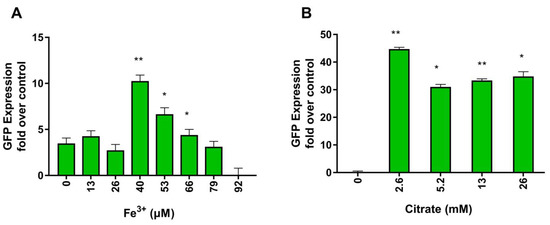
Figure 2.
Activation of the Iuc promoter expressed as GFP expression from Iuc–GFP at the indicated Fe3+ (A) and citrate (B) concentrations. Fold induction refers to intracellular GFP fluorescence measured in E. Coli at the indicated conditions and normalized to GFP fluorescence measured in normal growth condition. Values are reported as mean + S.D. (n = 5 replicates, p value * < 0.05, ** < 0.01).
Citrate is one of the substrates of IucA. As with many other substrates, it is a limiting factor for the activity of the enzyme. However, the results of Table 1 suggest that citrate can as well control the operon Iuc at the transcriptional level, and thus, regulates the expression of IucA. Indeed, as shown in Figure 2B and Table 1, increased concentrations of citrate stimulate Iuc promoter activity and augment GFP expression. There has already been reported the existence of citrate responsive elements in microbial genomes and the existence of regulators of citrate metabolism, like the proteins belonging to the family of Cit promoters [29] from Enterococcus faecalis. In the presence of citrate, Cit proteins bind to cis-acting sequences located upstream of genes and operons, usually those involved in citrate utilization. As shown in Figure 1C, detailed analysis of the promoter region of Iuc revealed the presence of a hypothetical citrate responsive element similar to those recruiting CitO.
3.4. Optimization of Culture Conditions of Anabaena Flos-Aquae UTEX1444 for Siderophore Production
To finally prove the eligibility of our four-step pipeline as a platform to identify the growth condition increasing the yield of siderophores production in Anabaena flos aquae UTEX 1444, we cultivated the strain in different media, modified in accordance with the screening results shown in Table 1. For siderophore identification and quantitation, we used MS-based molecular networking [27], a powerful metabolomic tool that allows a complete metabolic profiling of the species under study. MS-based molecular networking is a robust and less time-consuming bioinformatic tool for MS/MS data analysis and dereplication of complex natural matrixes. It assumes that structurally related compounds share similar fragmentation patterns and provides a visual representation of structural relationships between compounds in the extracts, as revealed by MS/MS data. The MS/MS spectra of the compounds in the extracts are aligned, the peaks in common between the various spectra are identified (the so-called peaks match), and based on the alignments, a score is assigned (cosine score). The higher the scoring, the more similar the spectra are. In a molecular network, each MS/MS spectrum is represented as a node, labelled with the parent mass, and the relatedness between compounds (cosine score) is represented by edges. Molecular networking presents high scalability and it allows an easy evaluation (in a single visual network) of multiple datasets, [42] avoiding a huge amount of complex data, always difficult to manage, as well as the capture and quantification of molecular analogues. Moreover, it enables a facilitated quantitative comparison of the desired metabolites between the samples, dispensing from the laborious peak-by-peak analyses, as in standard LC-MS data.
Differently from E. coli, Anabaena flos aquae UTEX 1444 cultures are usually maintained at 28 to 29 °C and the FWBG11growth medium has a pH of 7.5 and physiological osmolarity. This reveals that the temperature, pH and osmolarity at which this strain grows best already correspond to those leading to the highest transcription of the Iuc operon (according to Table 1). We thus maintained fixed these parameters and modified growth media varying Fe3+ and citrate concentration. Till now [31], the culture medium used for siderophore production was Fe3+deprived and contains 31 μmols/L of citric acid. We thus verified the effect of different iron and citrate concentration on the yields of siderophore produced. As first, six cultures (no added citrate, 0 mM (final (citrate) 31 μM, #1), 0.1 mM ((citrate) 131 μM, #2), 1 mM ((citrate) 1.031 mM #3), 10 mM ((citrate) 10.031 mM, #4), 100 mM ((citrate) 100.031 mM #5), STD ((citrate) 31 μM in the presence of Fe3+, #6) were extracted and analysed through LC-HRMS and molecular networking [31]. In the comprehensive molecular network of Anabaena #1-6 cultures’ extracts (Figure 3 and Figure S2) [43], the arrangement of the cluster containing schizokinen and the known synechobactins A and C14 showed an uneven distribution of such siderophores in the different cultures, with a clear prevalence in those with the lowest concentrations of citrate (31 to 131 µmol of citrate/L) and in the absence of Fe3+.
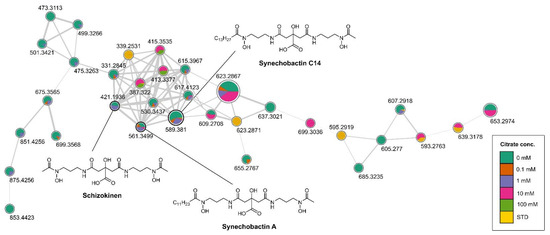
Figure 3.
Cluster containing synechobactins in the molecular network obtained combining the LC-HRMS/MS analyses of all the extracts of #1-6 cultures of Anabaena flos-aquae UTEX 1444. Nodes are labelled with parent mass and are represented as a pie chart with colour coding showing the source culture of the compound ((Citrate) = 0 mM, 0.1 mM, 1 mM, 10 mM, 100 mM, STD, standard citrate concentration). Size of the nodes corresponds to the sum of precursor ion intensities. Edge thickness is related to cosine similarity score.
Combining this information with those coming from our previous study [31], a new set of cultures was prepared, in which the concentration of Fe3+, supplemented as ferric ammonium citrate in FWBG11, has been varied from 0 µM to 5 μM. Taking into account that µM quantities of citrate are necessary to promote synechobactin production (Figure 3), sodium citrate has been supplemented to each of the above cultures in the amount necessary to compensate for the citrate removed with the ferric ammonium salt. The extracts of the above cultures were subjected to LC-HRMS. Figure 4 shows the results of this analysis: at a concentration of 3 μM Fe3+, the production of synechobactin A and synechobactin C14 is sharply increased, confirming the bell-shaped correlation between the amount of Fe3+ and siderophore production suggested by our in vitro pipeline.
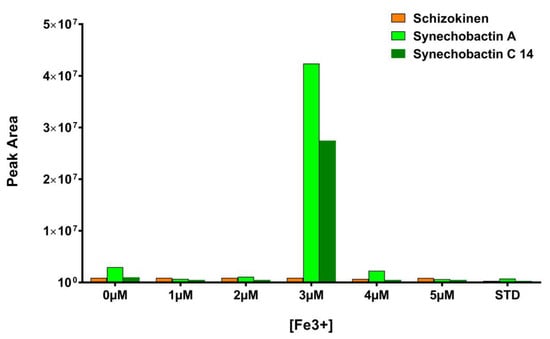
Figure 4.
LC-HRMS quantitation of schizokinen (m/z 421.1936, orange bars), synechobactin A (m/z 561.3499, green bars) and synechobactin C14 (m/z 589.3810, blue bars) in Anabaena flos-aquae UTEX1444 cultures (FWBG) containing 0 μM, 1 μM, 2 μM, 3 μM, 4 μM, 5 μM and 23 μM (STD condition) Fe3+. (Representative of three experiments.)
4. Discussion
Siderophores, bioactive molecules able to chelate iron, are secreted in the environment by microorganisms for iron intracellular uptake and maintenance of cellular homeostasis. They can be used as a greener and sustainable tool for the bioremediation of contaminated ecosystems, as well as in drug discovery.
Scientific advances in culture media formulation and cultural conditions affecting the production of siderophores have been recently summarized by Soares [44]. Optimization of the growth conditions is time consuming, especially for a slow growing microorganism. Siderophores are usually produced and secreted in micromolar quantities with yields affected by different environmental parameters, including iron concentration, carbon and nitrogen source, temperature and aeration [45]. When achieved, optimization has allowed the successful production of siderophore in bioreactors, using Batch Fermentation [46].
Most of the reports available in the literature describe optimization procedures including indirect identification and quantitation of siderophores either via the Chrome Azurely S (CAS) assay or via growth inhibition of iron-dependent parasites by optimized siderophore conditioned media. Despite the difficulty related to optimization, the increased yield of produced siderophores allows, on the one hand, downstream application of these biomolecules, and also reveals new aspects underpinning microbial control of siderophore intracellular production. Nasr Ghazy and Sahar El-Norway were able to optimize siderophore production in six strains of rhizobacteria, measuring the ability of conditioned media to inhibit the growth of the iron-dependent parasite C. maydis in Zea Mayis [47], interestingly, achieving yield promotion of maize plant under laboratory, greenhouse and field conditions. Sasirekha and Srividya [48] optimized siderophore production in cultures of P. aeruginosa using CAS agar plate and proved that metals other than Fe3+ are able to affect yields of siderophore production. Siderophore production was optimized using a microplate CAS shuttle assay also in P. fluorescens, P. putida, B. stabilis and O. oryzae by Murakami et al. [49] P. fluorescens DSM 50090, an industrial relevant strain for siderophore production, was found to produce a high amount of siderophore in a minimal medium containing succinate [50]. Recently, Lemare et al. engineered P. aeruginosa to obtain a strain able to produce the siderophore Pioverdin, even in the presence of iron. This iron-insensitive siderophore-producing mutant will find application in asbestos weathering [51].
While optimization of siderophore production has been achieved in different bacterial strains, scarce information is available on optimization in cyanobacteria. Here, we propose an alternative four-step platform to study and optimize at the transcriptional level growth conditions to increase the production of siderophores in Anabaena. The pipeline is here validated using the reference strain Anabaena flos-aquae UTEX 1444 that was previously shown to produce a cluster of chemically related siderophores (including schizokinen, rhizobactin, synechobactin and aerobactin) in a condition of iron (III) deprivation [31].
Our pipeline offers different advantages compared to the traditional OSMAC approach. The first is the time required for identifying factors affecting siderophore production. Considering the growth time (30 days) of the strain and the necessary culture volume required to yield enough biomass of Anabaena flos aquae (at least 50 mL), the OSMAC strategy is time-consuming and expensive. Here, using smaller culture volume (50 μL) and fast-growing bacteria, our pipeline allowed the fast identification of temperature, pH, osmolarity, iron and citrate concentration as growth factor influencing, at a transcriptional level, the production of siderophore, i.e., schizokinen and synechobactin A and C14. Other advantages of our pipeline include its low cost, its amenability to the high-throughput pipeline and its applicability to a greater number of cyanobacteria.
Furthermore, the use of molecular networking, as a fourth step of the platform, has proved successful in the direct and unambiguous identification of siderophores and their quantification and more rapid than traditional techniques (LC-MS, CAS).
Finally, the pipeline was able to reveal unprecedented aspects of the siderophore transcriptional regulation in Anabaena flos aquae. By identifying citrate (a substrate of siderophore production) as a growth factor influencing at the transcriptional level siderophore production, the pipeline allowed the identification of a citrate responsive element allocated upstream of the Iuc promoter region, giving more insight into the genetic regulation of siderophore production in cyanobacteria and probably in other microorganisms.
Supplementary Materials
The following supporting information can be downloaded at: https://www.mdpi.com/article/10.3390/metabo13020154/s1, Figure S1: Putative enzymatic activities and biosynthetic pathway of schizokinen; Figure S2: LC-HRMS/MS analyses of Anabaena flos aquae extracts.
Author Contributions
Conceptualization, V.C. and M.S.; methodology, M.S., R.T., V.C. and K.K.; software, M.S. and K.K.; investigation, K.K., R.T. and G.E.; resources, V.C. and M.S.; data curation, K.K., R.T. and G.E.; writing—original draft preparation, K.K., M.S. and V.C.; writing—review and editing, V.C. and M.S.; supervision, V.C. and M.S. All authors have read and agreed to the published version of the manuscript.
Funding
This research was funded by the University of Naples Federico II, under 36 cycle PhD in Nutraceuticals, Functional Food and Human Health course at the Department of Pharmacy, Via Domenico Montesano 49, Naples, Italy.
Institutional Review Board Statement
Not applicable.
Informed Consent Statement
Not applicable.
Data Availability Statement
The data presented in this study are available at https://gnps.ucsd.edu/ProteoSAFe/status.jsp?task=53fbad6b425540ceb5eae088aac6ae32.
Conflicts of Interest
The authors declare no conflict of interest.
References
- Wilson, B.R.; Bogdan, A.R.; Miyazawa, M.; Hashimoto, K.; Tsuji, Y. Siderophores in Iron Metabolism: From Mechanism to Therapy Potential. Trends Mol. Med. 2016, 22, 1077–1090. [Google Scholar] [CrossRef]
- Kleinheinz, K.A.; Joensen, K.G.; Larsen, M.V. Applying the ResFinder and VirulenceFinder Web-Services for Easy Identification of Acquired Antibiotic Resistance and E. Coli Virulence Genes in Bacteriophage and Prophage Nucleotide Sequences. Bacteriophage 2014, 4, e27943. [Google Scholar] [CrossRef] [PubMed]
- Jiang, H.-B.; Lou, W.-J.; Ke, W.-T.; Song, W.-Y.; Price, N.M.; Qiu, B.-S. New Insights into Iron Acquisition by Cyanobacteria: An Essential Role for ExbB-ExbD Complex in Inorganic Iron Uptake. ISME J. 2015, 9, 297–309. [Google Scholar] [CrossRef]
- Ferreira, F.; Straus, N.A. Iron Deprivation in Cyanobacteria. J. Appl. Phycol. 1994, 6, 199–210. [Google Scholar] [CrossRef]
- Årstøl, E.; Hohmann-Marriott, M.F. Cyanobacterial Siderophores—Physiology, Structure, Biosynthesis, and Applications. Mar. Drugs 2019, 17, 281. [Google Scholar] [CrossRef] [PubMed]
- Khan, A.; Singh, P.; Srivastava, A. Synthesis, Nature and Utility of Universal Iron Chelator-Siderophore: A Review. Microbiol. Res. 2018, 212–213, 103–111. [Google Scholar] [CrossRef]
- Miethke, M.; Marahiel, M.A. Siderophore-Based Iron Acquisition and Pathogen Control. Microbiol. Mol. Biol. Rev. 2007, 71, 413–451. [Google Scholar] [CrossRef]
- Leventhal, G.E.; Ackermann, M.; Schiessl, K.T. Why Microbes Secrete Molecules to Modify Their Environment: The Case of Iron-Chelating Siderophores. J. R. Soc. Interface 2019, 16, 20180674. [Google Scholar] [CrossRef]
- De Serrano, L.O. Biotechnology of Siderophores in High-Impact Scientific Fields. Biomol. Concepts 2017, 8, 169–178. [Google Scholar] [CrossRef]
- Day, J.A.; Cohen, S.M. Investigating the Selectivity of Metalloenzyme Inhibitors. J. Med. Chem. 2013, 56, 7997–8007. [Google Scholar] [CrossRef]
- Emri, T.; Tóth, V.; Nagy, C.T.; Nagy, G.; Pócsi, I.; Gyémánt, G.; Antal, K.; Balla, J.; Balla, G.; Román, G.; et al. Towards High-Siderophore-Content Foods: Optimisation of Coprogen Production in Submerged Cultures of Penicillium Nalgiovense: Foods with High Siderophore Contents. J. Sci. Food Agric. 2013, 93, 2221–2228. [Google Scholar] [CrossRef] [PubMed]
- Pócsi, I.; Jeney, V.; Kertai, P.; Pócsi, I.; Emri, T.; Gyémánt, G.; Fésüs, L.; Balla, J.; Balla, G. Fungal Siderophores Function as Protective Agents of LDL Oxidation and Are Promising Anti-Atherosclerotic Metabolites in Functional Food. Mol. Nutr. Food Res. 2008, 52, 1434–1447. [Google Scholar] [CrossRef]
- Tonziello, G.; Caraffa, E.; Pinchera, B.; Granata, G.; Petrosillo, N. Present and Future of Siderophore-Based Therapeutic and Diagnostic Approaches in Infectious Diseases. Infect. Dis. Rep. 2019, 11, 8208. [Google Scholar] [CrossRef] [PubMed]
- Ahmed, E.; Holmström, S.J.M. Siderophores in Environmental Research: Roles and Applications: Siderophores in Environmental Research. Microb. Biotechnol. 2014, 7, 196–208. [Google Scholar] [CrossRef] [PubMed]
- Romano, S.; Jackson, S.; Patry, S.; Dobson, A. Extending the “One Strain Many Compounds” (OSMAC) Principle to Marine Microorganisms. Mar. Drugs 2018, 16, 244. [Google Scholar] [CrossRef]
- ACUF—Algal Collection University Federico II—Naples, I. Anabaena Flos-Aquae Healey. Available online: http://www.Acuf.Net/Index.Php?Option=com_content&view=article&id=43:Anabaena-Flos-Aquae-Healey&catid=2&Itemid=127&lang=en&Itemid=113 (accessed on 10 July 2022).
- UTEX. UTEX 1444 Anabaena Flos-Aquae. Available online: Https://Utex.Org/Products/Utex-1444?Variant=30991204089946 (accessed on 1 November 2022).
- BioCyc. Summary of Trichormus Variabilis, Strain ATCC 29413, Version 26.1, Tier 3 Uncurated Database. Available online: Https://Biocyc.Org/Organism-Summary?Object=GCF_000204075 (accessed on 15 August 2022).
- Esposito, G.; Teta, R.; Marrone, R.; De Sterlich, C.; Casazza, M.; Anastasio, A.; Lega, M.; Costantino, V. A Fast Detection Strategy for Cyanobacterial Blooms and Associated Cyanotoxins (FDSCC) Reveals the Occurrence of Lyngbyatoxin A in Campania (South Italy). Chemosphere 2019, 225, 342–351. [Google Scholar] [CrossRef]
- Medicine, N.L.o. Anabaena Variabilis ATCC 29413, Complete Genome. Available online: Https://Www.Ncbi.Nlm.Nih.Gov/Nuccore/CP000117.1 (accessed on 1 November 2022).
- Salamov, V.; Salamov, A. Automatic Annotation of Microbial Genomes and Metagenomic Sequences. In Metagenomics and Its Applications in Agriculture, Biomedicine and Environmental Studies; Nova Science Publishers: Hauppauge, NY, USA, 2020. [Google Scholar]
- Prediction, B.-B.P. Anabaena Variabilis. Available online: Http://Www.Bacpp.Bioinfoucs.Com/Home (accessed on 17 August 2022).
- Riccio, G.; Bottone, S.; La Regina, G.; Badolati, N.; Passacantilli, S.; Rossi, G.B.; Accardo, A.; Dentice, M.; Silvestri, R.; Novellino, E.; et al. A Negative Allosteric Modulator of WNT Receptor Frizzled 4 Switches into an Allosteric Agonist. Biochemistry 2018, 57, 839–851. [Google Scholar] [CrossRef]
- Oliviero, G.; Stornaiuolo, M.; D’Atri, V.; Nici, F.; Yousif, A.M.; D’Errico, S.; Piccialli, G.; Mayol, L.; Novellino, E.; Marinelli, L.; et al. Screening Platform toward New Anti-HIV Aptamers Set on Molecular Docking and Fluorescence Quenching Techniques. Anal. Chem. 2016, 88, 2327–2334. [Google Scholar] [CrossRef]
- Britstein, M.; Devescovi, G.; Handley, K.M.; Malik, A.; Haber, M.; Saurav, K.; Teta, R.; Costantino, V.; Burgsdorf, I.; Gilbert, J.A.; et al. A New N-Acyl Homoserine Lactone Synthase in an Uncultured Symbiont of the Red Sea Sponge Theonella Swinhoei. Appl. Environ. Microbiol. 2016, 82, 1274–1285. [Google Scholar] [CrossRef]
- Katajamaa, M.; Miettinen, J.; Oresic, M. MZmine: Toolbox for Processing and Visualization of Mass Spectrometry Based Molecular Profile Data. Bioinformatics 2006, 22, 634–636. [Google Scholar] [CrossRef]
- Nothias, L.-F.; Petras, D.; Schmid, R.; Dührkop, K.; Rainer, J.; Sarvepalli, A.; Protsyuk, I.; Ernst, M.; Tsugawa, H.; Fleischauer, M.; et al. Feature-Based Molecular Networking in the GNPS Analysis Environment. Nat. Methods 2020, 17, 905–908. [Google Scholar] [CrossRef] [PubMed]
- Teta, R.; Esposito, G.; De Sterlich, C.; Lega, M.; Costantino, V. Early Detection of Cyanobacterial Blooms and Associated Cyanotoxins Using Fast Detection Strategy. J. Vis. Exp. 2021, 168, e61889. [Google Scholar] [CrossRef] [PubMed]
- Wang, M.; Carver, J.J.; Phelan, V.V.; Sanchez, L.M.; Garg, N.; Peng, Y.; Nguyen, D.D.; Watrous, J.; Kapono, C.A.; Luzzatto-Knaan, T.; et al. Sharing and Community Curation of Mass Spectrometry Data with Global Natural Products Social Molecular Networking. Nat. Biotechnol. 2016, 34, 828–837. [Google Scholar] [CrossRef]
- Shannon, P.; Markiel, A.; Ozier, O.; Baliga, N.S.; Wang, J.T.; Ramage, D.; Amin, N.; Schwikowski, B.; Ideker, T. Cytoscape: A Software Environment for Integrated Models of Biomolecular Interaction Networks. Genome Res. 2003, 13, 2498–2504. [Google Scholar] [CrossRef]
- Teta, R.; Esposito, G.; Kundu, K.; Stornaiuolo, M.; Scarpato, S.; Pollio, A.; Costantino, V. A Glimpse at Siderophores Production by Anabaena Flos-aquae UTEX 1444. Mar. Drugs 2022, 20, 256. [Google Scholar] [CrossRef]
- Goldman, S.J.; Lammers, P.J.; Berman, M.S.; Sanders-Loehr, J. Siderophore-Mediated Iron Uptake in Different Strains of Anabaena sp. J. Bacteriol. 1983, 156, 1144–1150. [Google Scholar] [CrossRef] [PubMed]
- Ito, Y.; Butler, A. Structure of Synechobactins, New Siderophores of the Marine Cyanobacterium Synechococcus Sp. PCC 7002. Limnol. Oceanogr. 2005, 50, 1918–1923. [Google Scholar] [CrossRef]
- Guerinot, M.L.; Meidl, E.J.; Plessner, O. Citrate as a Siderophore in Bradyrhizobium Japonicum. J. Bacteriol. 1990, 172, 3298–3303. [Google Scholar] [CrossRef] [PubMed]
- Lynch, D.; O’Brien, J.; Welch, T.; Clarke, P.; ÓCuív, P.; Crosa, J.H.; O’Connell, M. Genetic Organization of the Region Encoding Regulation, Biosynthesis, and Transport of Rhizobactin 1021, a Siderophore Produced by Sinorhizobium Meliloti. J. Bacteriol. 2001, 183, 2576–2585. [Google Scholar] [CrossRef]
- Carroll, C.S.; Moore, M.M. Ironing out Siderophore Biosynthesis: A Review of Non-Ribosomal Peptide Synthetase (NRPS)-Independent Siderophore Synthetases. Crit. Rev. Biochem. Mol. Biol. 2018, 53, 356–381. [Google Scholar] [CrossRef]
- Yang, J.; Banas, V.S.; Patel, K.D.; Rivera, G.S.M.; Mydy, L.S.; Gulick, A.M.; Wencewicz, T.A. An Acyl-Adenylate Mimic Reveals the Structural Basis for Substrate Recognition by the Iterative Siderophore Synthetase DesD. J. Biol. Chem. 2022, 298, 102166. [Google Scholar] [CrossRef] [PubMed]
- Raina, S.; Missiakas, D.; Baird, L.; Kumar, S.; Georgopoulos, C. Identification and Transcriptional Analysis of the Escherichia Coli HtrE Operon Which Is Homologous to Pap and Related Pilin Operons. J. Bacteriol. 1993, 175, 5009–5021. [Google Scholar] [CrossRef] [PubMed]
- Challis, G.L. A Widely Distributed Bacterial Pathway for Siderophore Biosynthesis Independent of Nonribosomal Peptide Synthetases. ChemBioChem 2005, 6, 601–611. [Google Scholar] [CrossRef] [PubMed]
- de Avila e Silva, S.; Echeverrigaray, S.; Gerhardt, G.J.L. BacPP: Bacterial Promoter Prediction—A Tool for Accurate Sigma-Factor Specific Assignment in Enterobacteria. J. Theor. Biol. 2011, 287, 92–99. [Google Scholar] [CrossRef] [PubMed]
- Riediger, M.; Hernández-Prieto, M.A.; Song, K.; Hess, W.R.; Futschik, M.E. Genome-Wide Identification and Characterization of Fur-Binding Sites in the Cyanobacteria Synechocystis Sp. PCC 6803 and PCC 6714. DNA Res. 2021, 28, dsab023. [Google Scholar] [CrossRef]
- Winnikoff, J.R.; Glukhov, E.; Watrous, J.; Dorrestein, P.C.; Gerwick, W.H. Quantitative Molecular Networking to Profile Marine Cyanobacterial Metabolomes. J. Antibiot. 2014, 67, 105–112. [Google Scholar] [CrossRef]
- Networking, G.-G.N.P.S.M. Feature Based Molecular Networking. Available online: Https://Gnps.Ucsd.Edu/ProteoSAFe/Status.Jsp?Task=53fbad6b425540ceb5eae088aac6ae32 (accessed on 17 October 2022).
- Soares, E.V. Perspective on the Biotechnological Production of Bacterial Siderophores and Their Use. Appl. Microbiol. Biotechnol. 2022, 106, 3985–4004. [Google Scholar] [CrossRef]
- Yu, S.; Teng, C.; Bai, X.; Liang, J.; Song, T.; Dong, L.; Jin, Y.; Qu, J. Optimization of Siderophore Production by Bacillus Sp. PZ-1 and Its Potential Enhancement of Phytoextration of Pb from Soi. J. Microbiol. Biotechnol. 2017, 27, 1500–1512. [Google Scholar] [CrossRef]
- Abo-Zaid, G.A.; Soliman, N.A.-M.; Abdullah, A.S.; El-Sharouny, E.E.; Matar, S.M.; Sabry, S.A.-F. Maximization of Siderophores Production from Biocontrol Agents, Pseudomonas Aeruginosa F2 and Pseudomonas Fluorescens JY3 Using Batch and Exponential Fed-Batch Fermentation. Processes 2020, 8, 455. [Google Scholar] [CrossRef]
- Ghazy, N.; El-Nahrawy, S. Siderophore Production by Bacillus Subtilis MF497446 and Pseudomonas Koreensis MG209738 and Their Efficacy in Controlling Cephalosporium Maydis in Maize Plant. Arch. Microbiol. 2021, 203, 1195–1209. [Google Scholar] [CrossRef]
- Sasirekha, B.; Srividya, S. Siderophore Production by Pseudomonas Aeruginosa FP6, a Biocontrol Strain for Rhizoctonia Solani and Colletotrichum Gloeosporioides Causing Diseases in Chilli. Agric. Nat. Resour. 2016, 50, 250–256. [Google Scholar] [CrossRef]
- Murakami, C.; Tanaka, A.R.; Sato, Y.; Kimura, Y.; Morimoto, K. Easy Detection of Siderophore Production in Diluted Growth Media Using an Improved CAS Reagent. J. Microbiol. Methods 2021, 189, 106310. [Google Scholar] [CrossRef] [PubMed]
- Vindeirinho, J.M.; Soares, H.M.V.M.; Soares, E.V. Modulation of Siderophore Production by Pseudomonas Fluorescens Through the Manipulation of the Culture Medium Composition. Appl. Biochem. Biotechnol. 2021, 193, 607–618. [Google Scholar] [CrossRef] [PubMed]
- Lemare, M.; Puja, H.; David, S.R.; Mathieu, S.; Ihiawakrim, D.; Geoffroy, V.A.; Rigouin, C. Engineering Siderophore Production in Pseudomonas to Improve Asbestos Weathering. Microb. Biotechnol. 2022, 15, 2351–2363. [Google Scholar] [CrossRef] [PubMed]


Disclaimer/Publisher’s Note: The statements, opinions and data contained in all publications are solely those of the individual author(s) and contributor(s) and not of MDPI and/or the editor(s). MDPI and/or the editor(s) disclaim responsibility for any injury to people or property resulting from any ideas, methods, instructions or products referred to in the content. |
© 2023 by the authors. Licensee MDPI, Basel, Switzerland. This article is an open access article distributed under the terms and conditions of the Creative Commons Attribution (CC BY) license (https://creativecommons.org/licenses/by/4.0/).