
Analysis of 4-Hydroxyphenyllactic Acid and Other Diagnostically Important Metabolites of α-Amino Acids in Human Blood Serum Using a Validated and Sensitive Ultra-High-Pressure Liquid Chromatography-Tandem Mass Spectrometry Method

 ,
, 
Abstract
:
1. Introduction
2. Materials and Methods
2.1. Chemicals and Reagents
2.2. Serum Sample Collection
2.3. Preparation of Stock and Working Solutions
2.4. Sample Preparation Conditions
2.4.1. Liquid–Liquid Extraction
2.4.2. Protein Precipitation
2.5. UPLC-MS/MS Conditions
2.6. Method Validation
2.6.1. Sensitivity and Selectivity
2.6.2. Linearity and Carry-Over
2.6.3. Accuracy and Precision
2.6.4. Recovery and Matrix Effect
2.6.5. Stability
3. Results
3.1. Selection and Development of the Sample Preparation Conditions
3.2. Validation of the UPLC-MS/MS Method with Protein Precipitation
3.3. Analysis of Serum Samples of the Healthy Volunteers
4. Conclusions
Supplementary Materials
Author Contributions
Funding
Institutional Review Board Statement
Informed Consent Statement
Data Availability Statement
Acknowledgments
Conflicts of Interest
References
- Aronson, J.K.; Ferner, R.E. Biomarkers—A General Review. Curr. Protoc. Pharmacol. 2017, 76, 9.23.1–9.23.17. [Google Scholar] [CrossRef]
- Pierrakos, C.; Velissaris, D.; Bisdorff, M.; Marshall, J.C.; Vincent, J.-L. Biomarkers of sepsis: Time for a reappraisal. Crit. Care 2020, 24, 287. [Google Scholar] [CrossRef] [PubMed]
- Qiu, S.; Cai, Y.; Yao, H.; Lin, C.; Xie, Y.; Tang, S.; Zhang, A. Small molecule metabolites: Discovery of biomarkers and therapeutic targets. Signal Transduct. Target. Ther. 2023, 8, 132. [Google Scholar] [CrossRef] [PubMed]
- Pautova, A.K.; Bedova, A.Y.; Sarshor, Y.N.; Beloborodova, N.V. Determination of Aromatic Microbial Metabolites in Blood Serum by Gas Chromatography–Mass Spectrometry. J. Anal. Chem. 2018, 73, 160–166. [Google Scholar] [CrossRef]
- Pautova, A.K.; Samokhin, A.S.; Beloborodova, N.V.; Revelsky, A.I. Multivariate Prognostic Model for Predicting the Outcome of Critically Ill Patients Using the Aromatic Metabolites Detected by Gas Chromatography-Mass Spectrometry. Molecules 2022, 27, 4784. [Google Scholar] [CrossRef]
- Sorokina, E.; Pautova, A.; Fatuev, O.; Zakharchenko, V.; Onufrievich, A.; Grechko, A.; Beloborodova, N.; Chernevskaya, E. Promising Markers of Inflammatory and Gut Dysbiosis in Patients with Post-COVID-19 Syndrome. J. Pers. Med. 2023, 13, 971. [Google Scholar] [CrossRef]
- Comai, S.; Bertazzo, A.; Brughera, M.; Crotti, S. Tryptophan in health and disease. Adv. Clin. Chem. 2020, 95, 165–218. [Google Scholar] [CrossRef]
- Davidson, M.; Rashidi, N.; Nurgali, K.; Apostolopoulos, V. The Role of Tryptophan Metabolites in Neuropsychiatric Disorders. Int. J. Mol. Sci. 2022, 23, 9968. [Google Scholar] [CrossRef]
- Paeslack, N.; Mimmler, M.; Becker, S.; Gao, Z.; Khuu, M.P.; Mann, A.; Malinarich, F.; Regen, T.; Reinhardt, C. Microbiota-derived tryptophan metabolites in vascular inflammation and cardiovascular disease. Amino Acids 2022, 54, 1339–1356. [Google Scholar] [CrossRef]
- Pautova, A.; Khesina, Z.; Getsina, M.; Sobolev, P.; Revelsky, A.; Beloborodova, N. Determination of Tryptophan Metabolites in Serum and Cerebrospinal Fluid Samples Using Microextraction by Packed Sorbent, Silylation and GC–MS Detection. Molecules 2020, 25, 3258. [Google Scholar] [CrossRef]
- Obrenovich, M.E.; Donskey, C.J.; Schiefer, I.T.; Bongiovanni, R.; Li, L.; Jaskiw, G.E. Quantification of phenolic acid metabolites in humans by LC–MS: A structural and targeted metabolomics approach. Bioanalysis 2018, 10, 1591–1608. [Google Scholar] [CrossRef] [PubMed]
- Sriboonvorakul, N.; Leepipatpiboon, N.; Dondorp, A.M.; Pouplin, T.; White, N.J.; Tarning, J.; Lindegardh, N. Liquid chromatographic–mass spectrometric method for simultaneous determination of small organic acids potentially contributing to acidosis in severe malaria. J. Chromatogr. B 2013, 941, 116–122. [Google Scholar] [CrossRef] [PubMed]
- Zou, B.; Sun, Y.; Xu, Z.; Chen, Y.; Li, L.; Lin, L.; Zhang, S.; Liao, Q.; Xie, Z. Rapid simultaneous determination of gut microbial phenylalanine, tyrosine, and tryptophan metabolites in rat serum, urine, and faeces using LC–MS/MS and its application to a type 2 diabetes mellitus study. Biomed. Chromatogr. 2021, 35, e4985. [Google Scholar] [CrossRef] [PubMed]
- Guo, H.; Jiao, Y.; Wang, X.; Lu, T.; Zhang, Z.; Xu, F. Twins labeling-liquid chromatography/mass spectrometry based metabolomics for absolute quantification of tryptophan and its key metabolites. J. Chromatogr. A 2017, 1504, 83–90. [Google Scholar] [CrossRef]
- Shariati, S.; Yamini, Y.; Darabi, M.; Amini, M. Three phase liquid phase microextraction of phenylacetic acid and phenylpropionic acid from biological fluids. J. Chromatogr. B 2007, 855, 228–235. [Google Scholar] [CrossRef]
- Rubió, L.; Serra, A.; Macià, A.; Borràs, X.; Romero, M.-P.; Motilva, M.-J. Validation of determination of plasma metabolites derived from thyme bioactive compounds by improved liquid chromatography coupled to tandem mass spectrometry. J. Chromatogr. B 2012, 905, 75–84. [Google Scholar] [CrossRef] [PubMed]
- Marklová, E.; Makovičková, H.; Krákorová, I. Screening for defects in tryptophan metabolism. J. Chromatogr. A 2000, 870, 289–293. [Google Scholar] [CrossRef]
- Popov, A.Y.; Blinnikova, Z.K.; Tsyurupa, M.P.; Davankov, V.A. Trace enrichment of phenylcarboxylic acids from a model biological fluid and serum of human blood. J. Sep. Sci. 2019, 42, 2706–2714. [Google Scholar] [CrossRef]
- Letertre, M.P.M.; Myridakis, A.; Whiley, L.; Camuzeaux, S.; Lewis, M.R.; Chappell, K.E.; Thaikkatil, A.; Dumas, M.-E.; Nicholson, J.K.; Swann, J.R.; et al. A targeted ultra performance liquid chromatography—Tandem mass spectrometric assay for tyrosine and metabolites in urine and plasma: Application to the effects of antibiotics on mice. J. Chromatogr. B 2021, 1164, 122511. [Google Scholar] [CrossRef]
- Chen, Y.; Chen, H.; Shi, G.; Yang, M.; Zheng, F.; Zheng, Z.; Zhang, S.; Zhong, S. Ultra-performance liquid chromatography-tandem mass spectrometry quantitative profiling of tryptophan metabolites in human plasma and its application to clinical study. J. Chromatogr. B Anal. Technol. Biomed. Life Sci. 2019, 1128, 121745. [Google Scholar] [CrossRef]
- Wikoff, W.R.; Anfora, A.T.; Liu, J.; Schultz, P.G.; Lesley, S.A.; Peters, E.C.; Siuzdak, G. Metabolomics analysis reveals large effects of gut microflora on mammalian blood metabolites. Proc. Natl. Acad. Sci. USA 2009, 106, 3698–3703. [Google Scholar] [CrossRef] [PubMed]
- Feng, L.; He, Y.-Q.; Xu, G.-H.; Hu, H.; Guo, L.; Wan, Y.-Q. Determination of Tyrosine and Its Metabolites in Human Serum with Application to Cancer Diagnosis. Anal. Lett. 2014, 47, 1275–1289. [Google Scholar] [CrossRef]
- U.S. Department of Health and Human Services, Food and Drug Administration, Guidance for Industry: Bioanalytical Method Validation, May 2018. Available online: https://www.fda.gov/files/drugs/published/Bioanalytical-Method-Validation-Guidance-for-Industry.pdf (accessed on 16 October 2023).
- European Medicines Agency, Science Medicine Health, Guideline on Bioanalytical Method Validation, 21 July 2011. Available online: https://www.ema.europa.eu/en/documents/scientific-guideline/guideline-bioanalytical-method-validation_en.pdf (accessed on 16 October 2023).
- Hughes, A.T.; Milan, A.M.; Shweihdi, E.; Gallagher, J.; Ranganath, L. Method development and validation for analysis of phenylalanine, 4-hydroxyphenyllactic acid and 4-hydroxyphenylpyruvic acid in serum and urine. JIMD Rep. 2022, 63, 341–350. [Google Scholar] [CrossRef] [PubMed]
- Thakare, R.; Chhonker, Y.S.; Gautam, N.; Alamoudi, J.A.; Alnouti, Y. Quantitative analysis of endogenous compounds. J. Pharm. Biomed. Anal. 2016, 128, 426–437. [Google Scholar] [CrossRef] [PubMed]

| Compound | Structure | Abbreviation | Precursor ion | Product ion | ESI | DP (V) * | CE (V) ** | CXP (V) *** |
|---|---|---|---|---|---|---|---|---|
| 4-Hydroxyphenyllactic Acid |  | p-HPhLA | 180.9 | 134.0 | - | −95 | −22 | −7 |
| 119.0 | - | −95 | −24 | −13 | ||||
| 4-Hydroxybenzoic Acid |  | p-HBA | 136.9 | 65.1 | - | −90 | −40 | −9 |
| 93.0 | - | −90 | −22 | −11 | ||||
| 4-Hydroxyphenylacetic Acid |  | p-HPhAA | 150.9 | 79.0 | - | −40 | −24 | −9 |
| 107.0 | - | −40 | −16 | −5 | ||||
| Phenylpropionic Acid |  | PhPA | 148.9 | 105.0 | - | −65 | −22 | −10 |
| 4-Hydroxyphenylpropionic Acid |  | p-HPhPA | 164.9 | 93.0 | - | −70 | −16 | −11 |
| 59.0 | - | −70 | −16 | −9 | ||||
| Phenyllactic Acid | 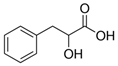 | PhLA | 164.9 | 103.0 | - | −85 | −22 | −13 |
| 73.0 | - | −85 | −24 | −9 | ||||
| 5-Hydroxyindole-3-acetic Acid | 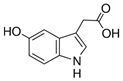 | 5HIAA | 192.0 | 146.1 | + | 96 | 23 | 10 |
| 118.0 | + | 96 | 39 | 14 | ||||
| Indole-3-lactic Acid |  | 3ILA | 206.0 | 118.1 | + | 86 | 50 | 6 |
| 130.1 | + | 86 | 39 | 6 | ||||
| Indole-3-carboxylic Acid |  | 3ICA | 162.1 | 116.0 | + | 80 | 29 | 12 |
| 118.1 | + | 80 | 19 | 14 | ||||
| Indole-3-acetic Acid |  | 3IAA | 176.1 | 130.1 | + | 90 | 52 | 6 |
| 103.0 | + | 90 | 43 | 12 | ||||
| Indole-3-propionic Acid |  | 3IPA | 190.1 | 77.0 | + | 80 | 80 | 10 |
| 103.1 | + | 80 | 47 | 12 | ||||
| Indole-3-acetic Acid-d4 |  | 3IAA-d4 | 180.1 | 133.1 | + | 91 | 23 | 8 |
| 178.0 | 134.1 | - | −85 | −16 | −7 |
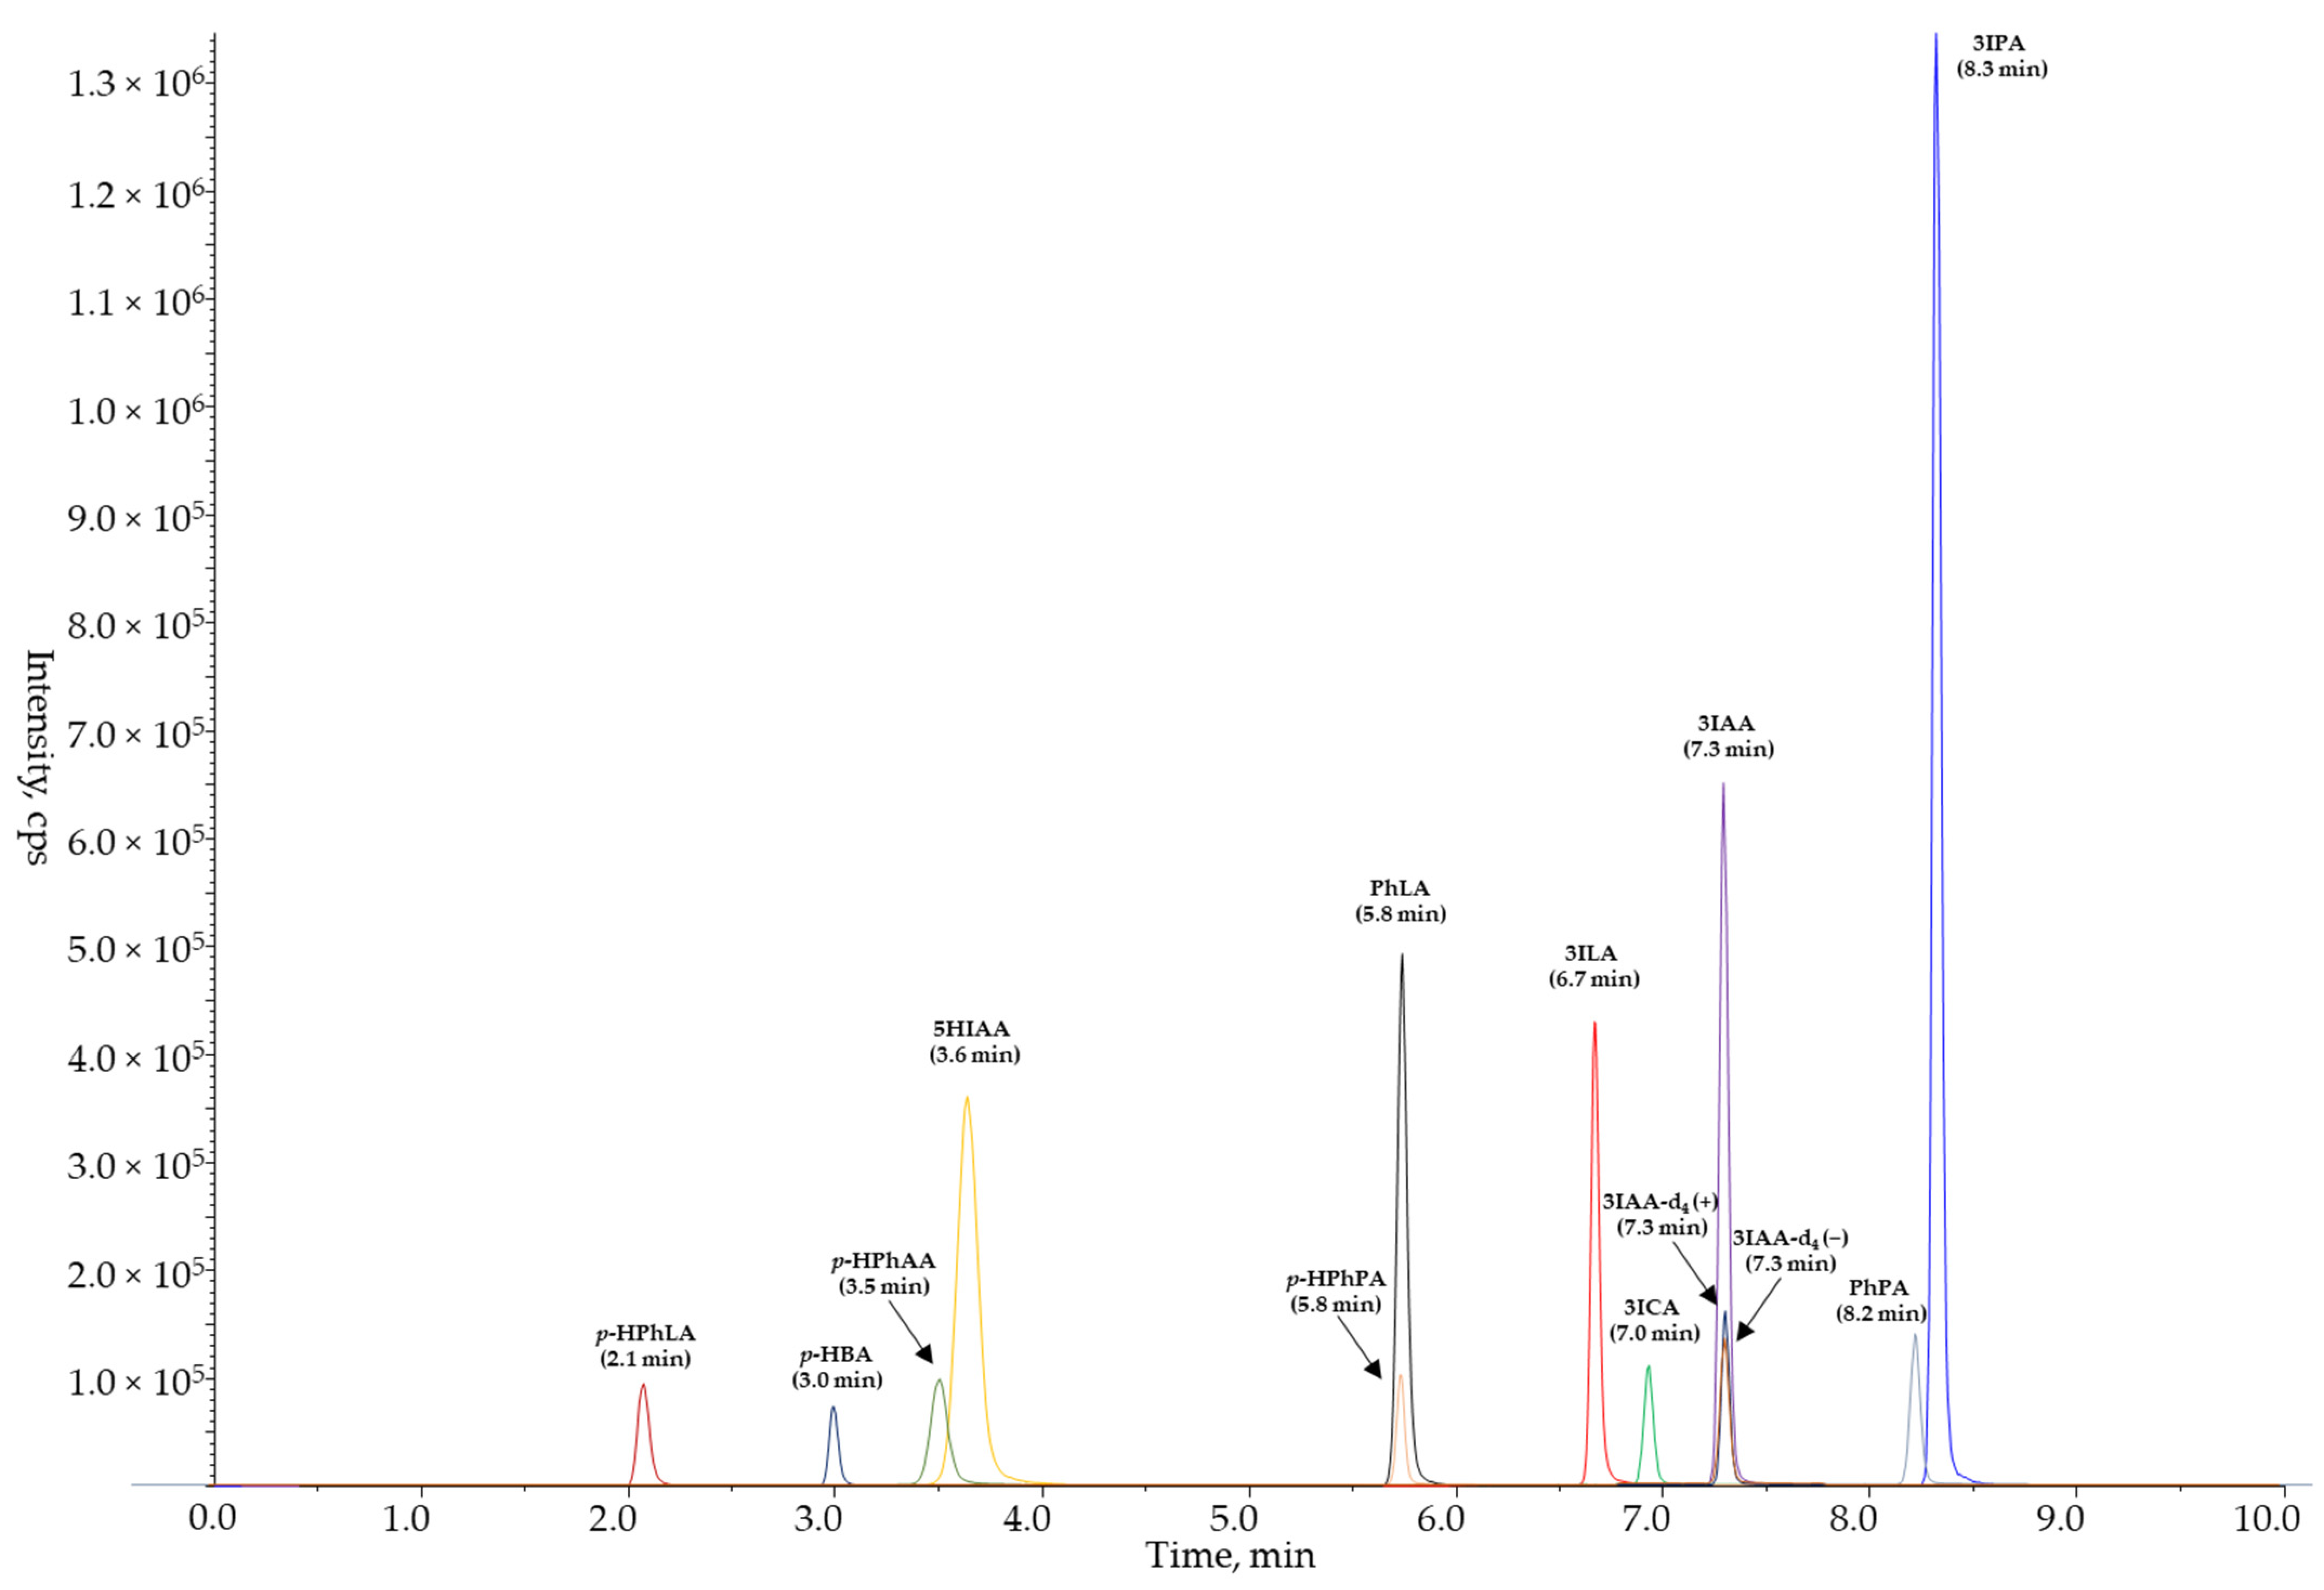
| Compound | Regression Equation | r | LOD (μmol/L) | LLOQ (μmol/L) | ULOQ (μmol/L) | RT (min) |
|---|---|---|---|---|---|---|
| p-HPhLA | y = 0.0281 x − 0.00192 | 0.9993 | 0.03 | 0.25 | 25 | 2.1 |
| p-HBA | y = 0.121 x + 0.00194 | 1.0000 | 0.02 | 0.05 | 5.0 | 3.0 |
| p-HPhAA | y = 0.0399 x + 0.000930 | 1.0000 | 0.08 | 0.25 | 25 | 3.5 |
| PhPA | y = 0.0202 x + 0.00131 | 0.9994 | 0.06 | 0.25 | 25 | 8.2 |
| p-HPhPA | y = 0.0886 x − 0.000787 | 0.9998 | 0.02 | 0.05 | 5.0 | 5.8 |
| PhLA | y = 0.473 x − 0.00294 | 1.0000 | 0.004 | 0.05 | 5.0 | 5.8 |
| 5HIAA | y = 1.67 x + 0.00565 | 0.9991 | 0.003 | 0.02 | 2.0 | 3.6 |
| 3ILA | y = 0.0658 x + 0.00249 | 0.9984 | 0.03 | 0.20 | 20 | 6.7 |
| 3ICA | y = 0.193 x + 0.000938 | 0.9977 | 0.006 | 0.02 | 2.0 | 7.0 |
| 3IAA | y = 0.113 x + 0.000724 | 0.9985 | 0.02 | 0.20 | 20 | 7.3 |
| 3IPA | y = 0.200 x + 0.00559 | 0.9980 | 0.02 | 0.20 | 20 | 8.3 |
| Compound | p-HPhLA | p-HBA | p-HPhAA | PhPA | p-HPhPA | PhLA | 5HIAA | 3ILA | 3ICA | 3IAA | 3IPA |
|---|---|---|---|---|---|---|---|---|---|---|---|
| Median | 1.21 | <0.015 | 0.32 | 0.46 | <0.015 | 0.32 | 0.078 | 1.07 | <0.02 | 1.82 | 1.36 |
| 25% Quartile | 0.96 | <0.015 | <0.25 | 0.27 | <0.015 | 0.25 | 0.064 | 0.84 | <0.006 | 1.51 | 0.77 |
| 75% Quartile | 1.56 | <0.015 | 0.46 | 0.72 | <0.015 | 0.39 | 0.093 | 1.27 | <0.02 | 2.38 | 2.09 |
| Minimum | 0.76 | <0.015 | <0.075 | <0.06 | <0.015 | 0.19 | 0.028 | 0.56 | <0.006 | 0.77 | <0.2 |
| Maximum | 2.41 | 0.14 | 1.43 | 3.94 | 0.12 | 0.66 | 3.5 | 4.5 | <0.02 | 4.81 | 8.08 |
Disclaimer/Publisher’s Note: The statements, opinions and data contained in all publications are solely those of the individual author(s) and contributor(s) and not of MDPI and/or the editor(s). MDPI and/or the editor(s) disclaim responsibility for any injury to people or property resulting from any ideas, methods, instructions or products referred to in the content. |
© 2023 by the authors. Licensee MDPI, Basel, Switzerland. This article is an open access article distributed under the terms and conditions of the Creative Commons Attribution (CC BY) license (https://creativecommons.org/licenses/by/4.0/).
Share and Cite
Sobolev, P.D.; Burnakova, N.A.; Beloborodova, N.V.; Revelsky, A.I.; Pautova, A.K. Analysis of 4-Hydroxyphenyllactic Acid and Other Diagnostically Important Metabolites of α-Amino Acids in Human Blood Serum Using a Validated and Sensitive Ultra-High-Pressure Liquid Chromatography-Tandem Mass Spectrometry Method. Metabolites 2023, 13, 1128. https://doi.org/10.3390/metabo13111128
Sobolev PD, Burnakova NA, Beloborodova NV, Revelsky AI, Pautova AK. Analysis of 4-Hydroxyphenyllactic Acid and Other Diagnostically Important Metabolites of α-Amino Acids in Human Blood Serum Using a Validated and Sensitive Ultra-High-Pressure Liquid Chromatography-Tandem Mass Spectrometry Method. Metabolites. 2023; 13(11):1128. https://doi.org/10.3390/metabo13111128
Chicago/Turabian StyleSobolev, Pavel D., Natalia A. Burnakova, Natalia V. Beloborodova, Alexander I. Revelsky, and Alisa K. Pautova. 2023. "Analysis of 4-Hydroxyphenyllactic Acid and Other Diagnostically Important Metabolites of α-Amino Acids in Human Blood Serum Using a Validated and Sensitive Ultra-High-Pressure Liquid Chromatography-Tandem Mass Spectrometry Method" Metabolites 13, no. 11: 1128. https://doi.org/10.3390/metabo13111128
APA StyleSobolev, P. D., Burnakova, N. A., Beloborodova, N. V., Revelsky, A. I., & Pautova, A. K. (2023). Analysis of 4-Hydroxyphenyllactic Acid and Other Diagnostically Important Metabolites of α-Amino Acids in Human Blood Serum Using a Validated and Sensitive Ultra-High-Pressure Liquid Chromatography-Tandem Mass Spectrometry Method. Metabolites, 13(11), 1128. https://doi.org/10.3390/metabo13111128