
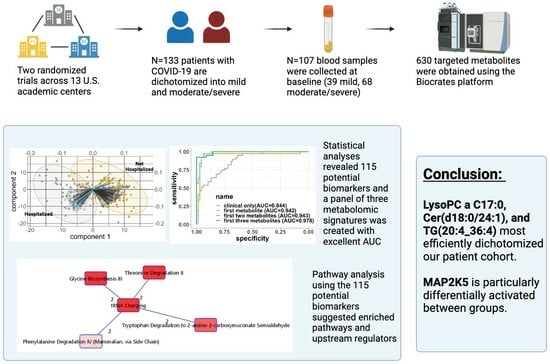
Developing A Baseline Metabolomic Signature Associated with COVID-19 Severity: Insights from Prospective Trials Encompassing 13 U.S. Centers

 , , , , ,
  and
and
Abstract
:
1. Introduction
2. Materials and Methods
2.1. Population
2.2. Primary Outcome
2.3. Metabolomics Data and Preprocessing
2.4. Statistical Analysis
2.4.1. Individual Metabolites Identification
2.4.2. Generation of a Metabolite Signature
2.4.3. Pathway Analysis
3. Results
3.1. Study Population
3.2. Identification of Metabolites with Largest Conditional Effect on Moderate/Severe COVID-19 Infection
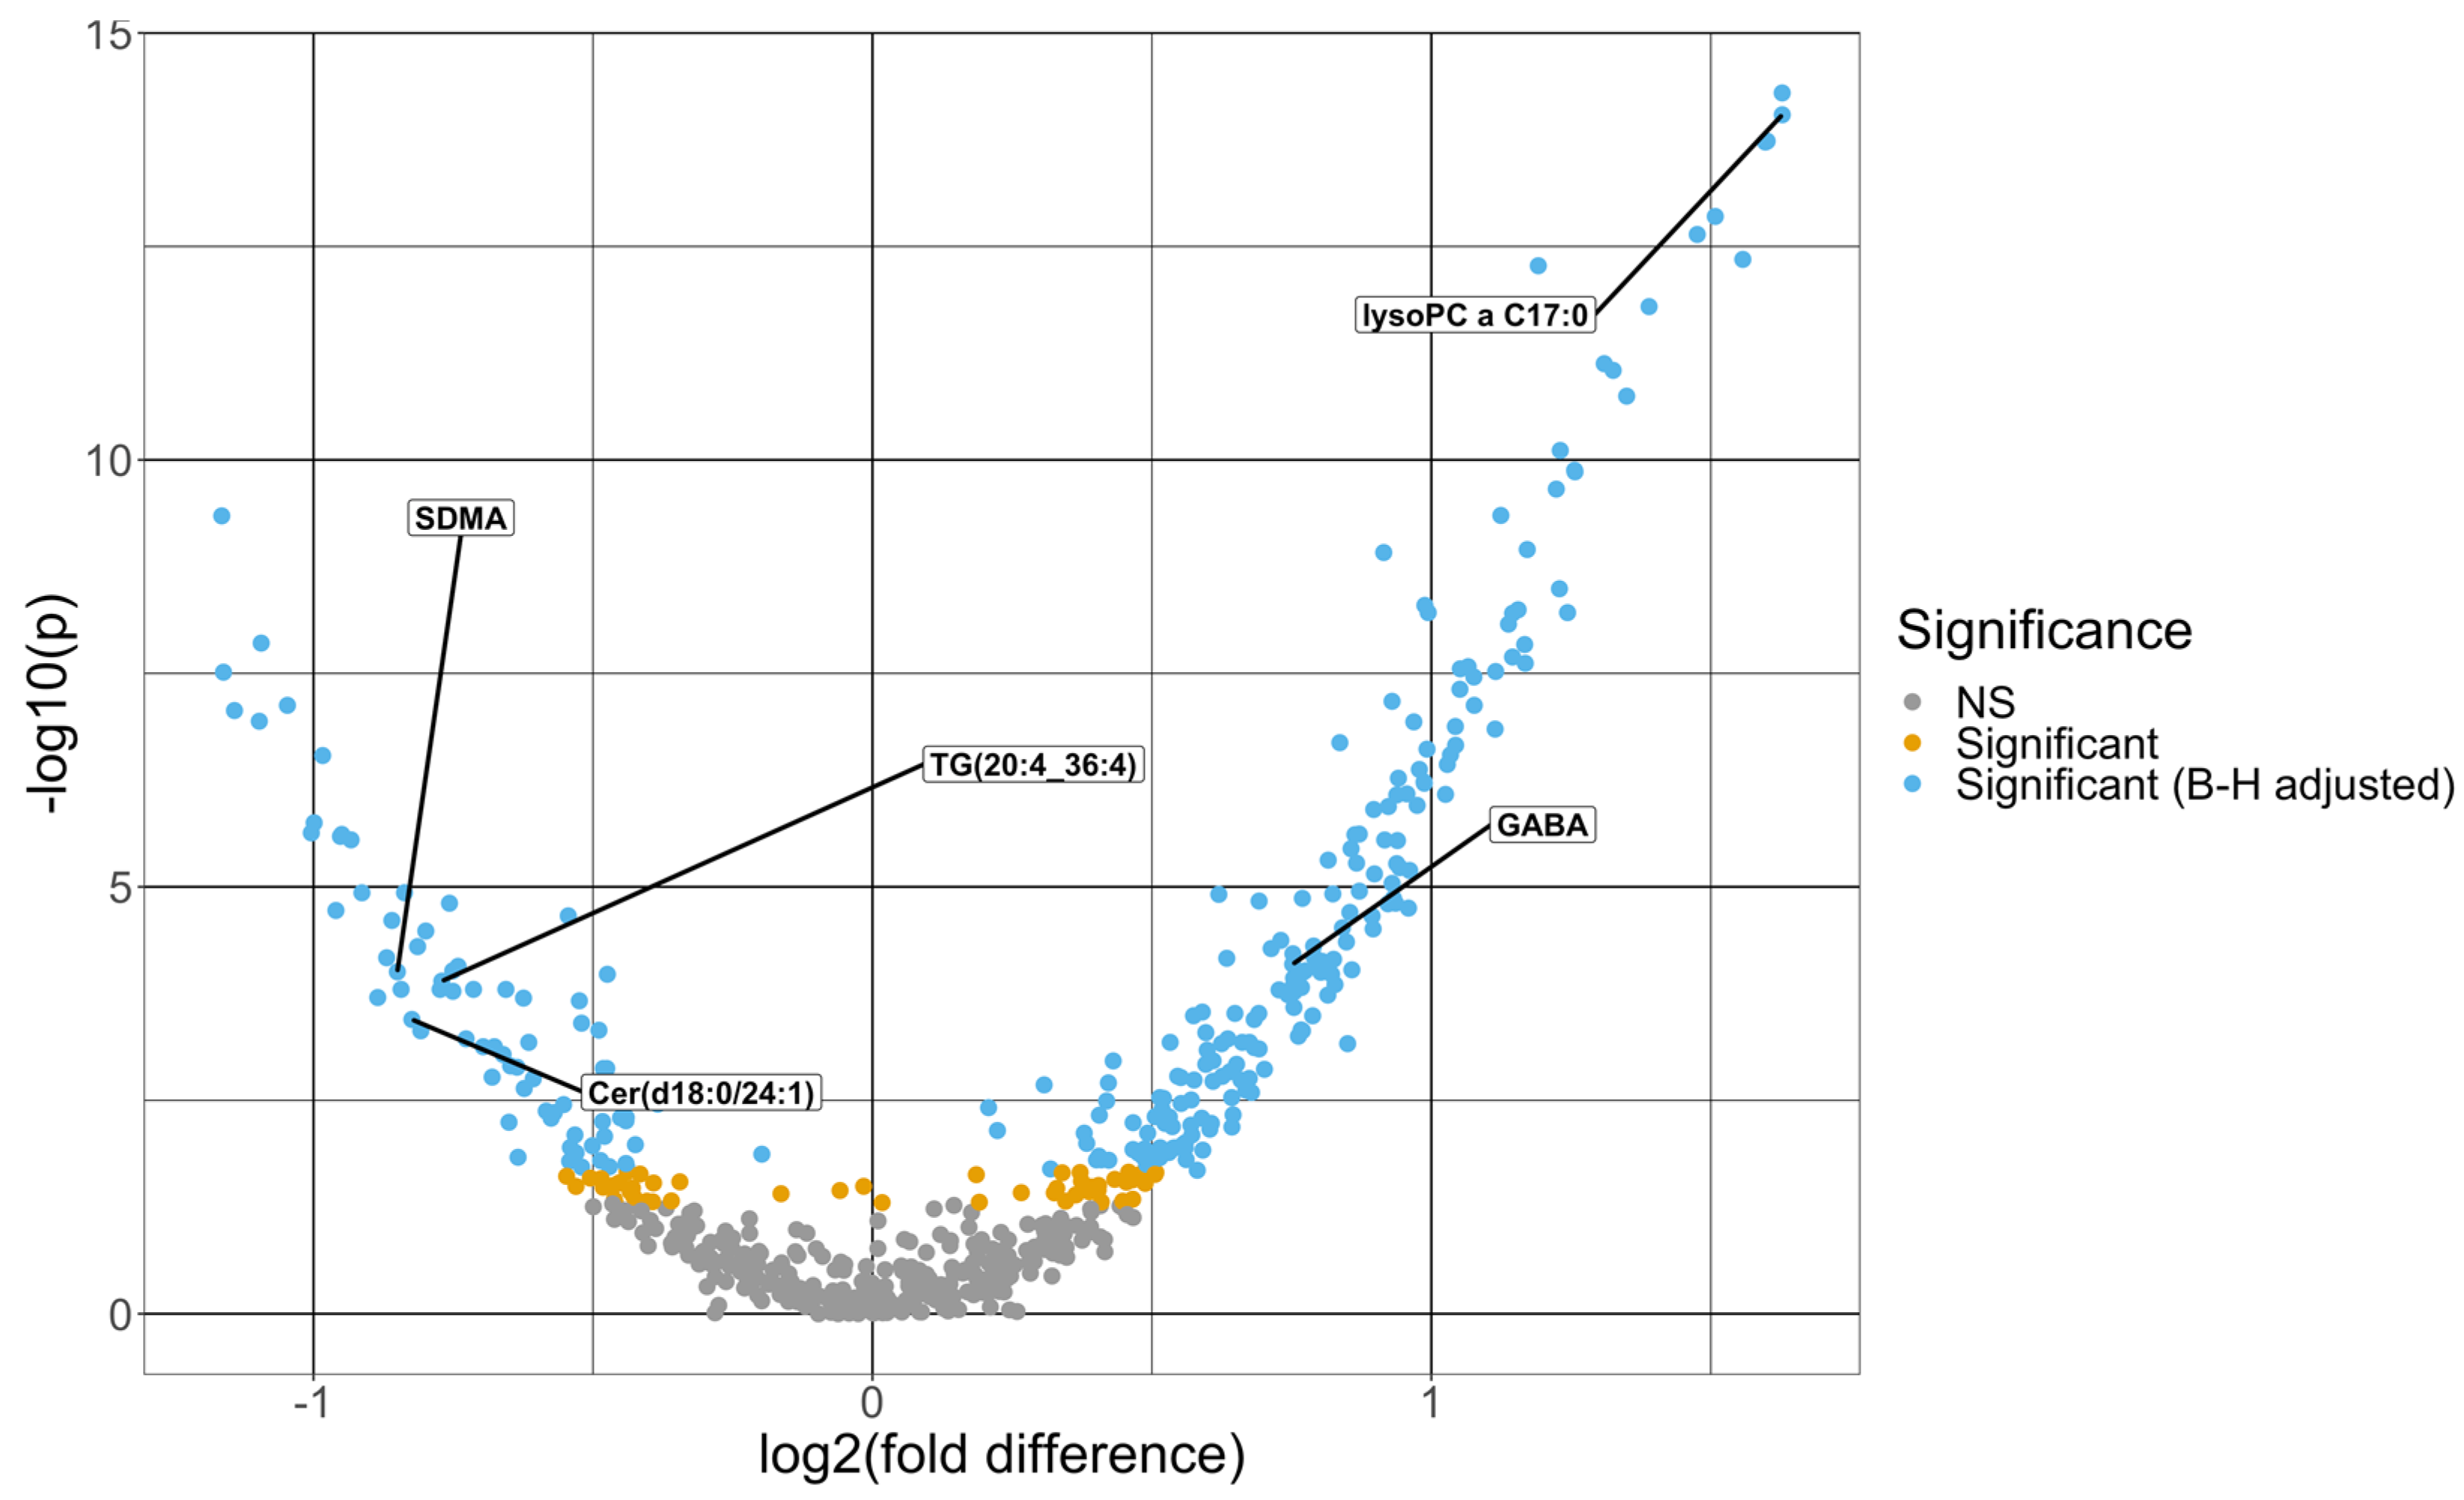
3.2.1. Univariate Analysis
3.2.2. Multivariable Analysis
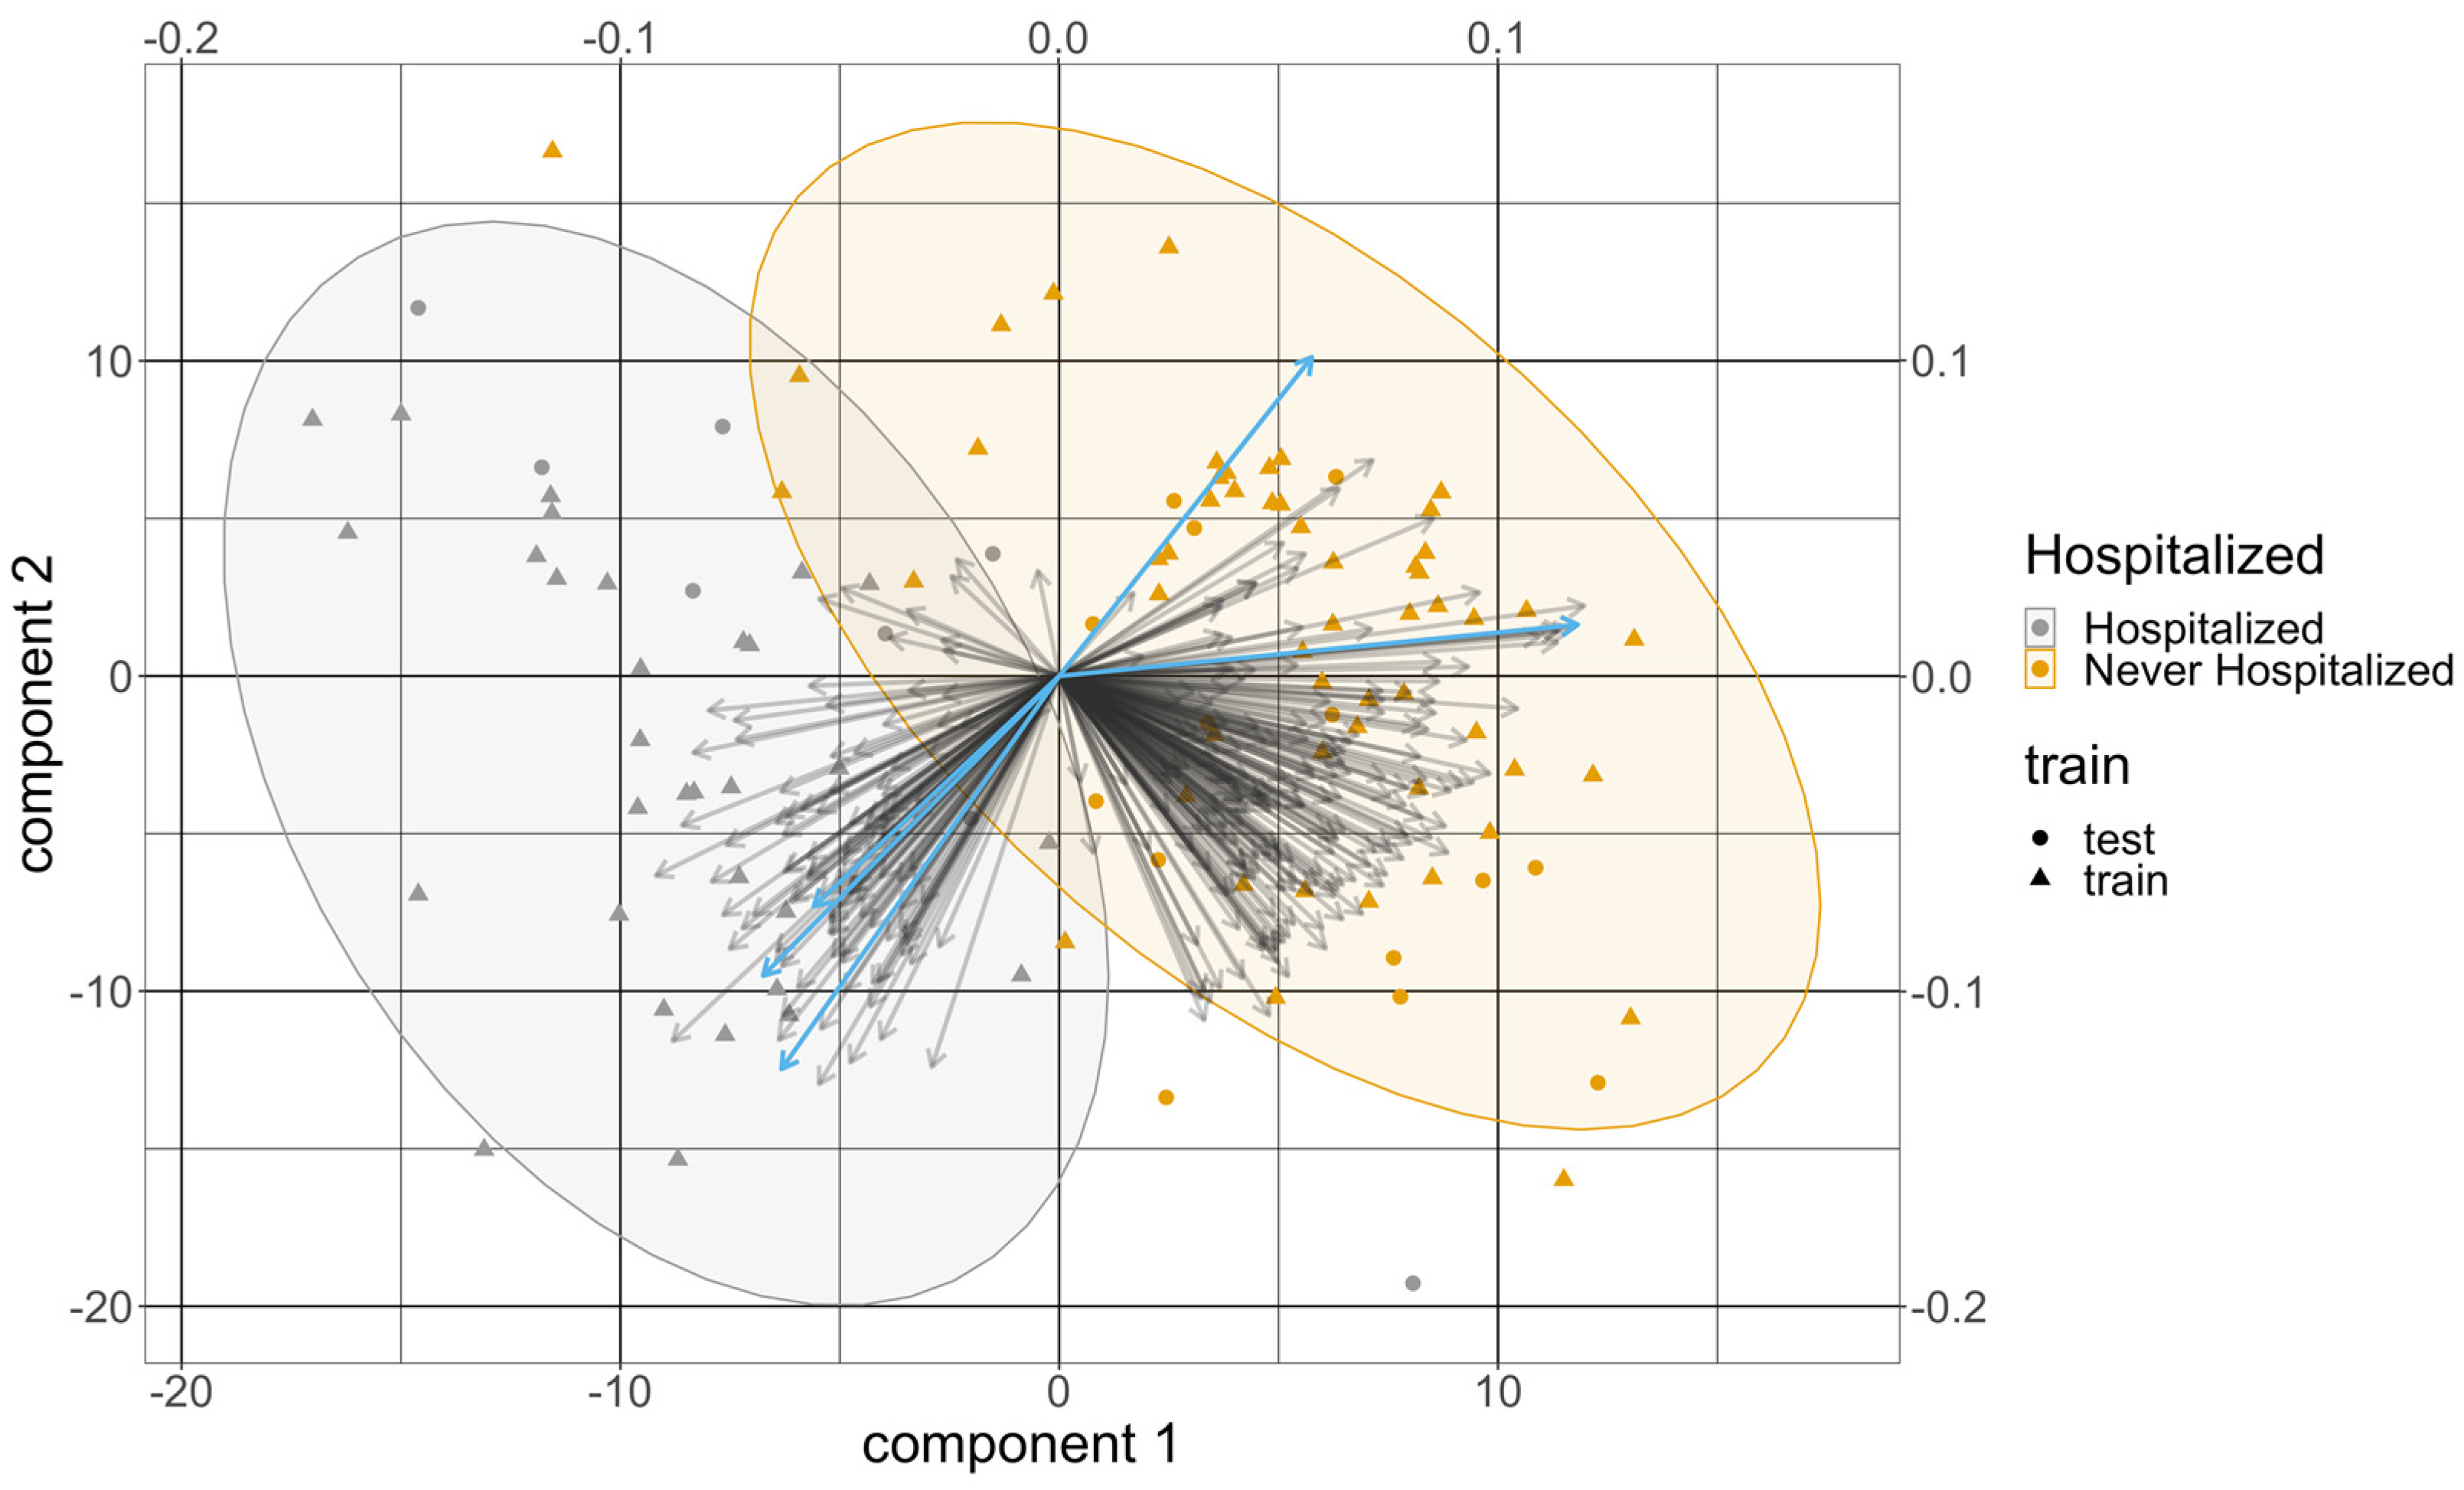
3.2.3. Development of a Baseline Metabolomic Signature
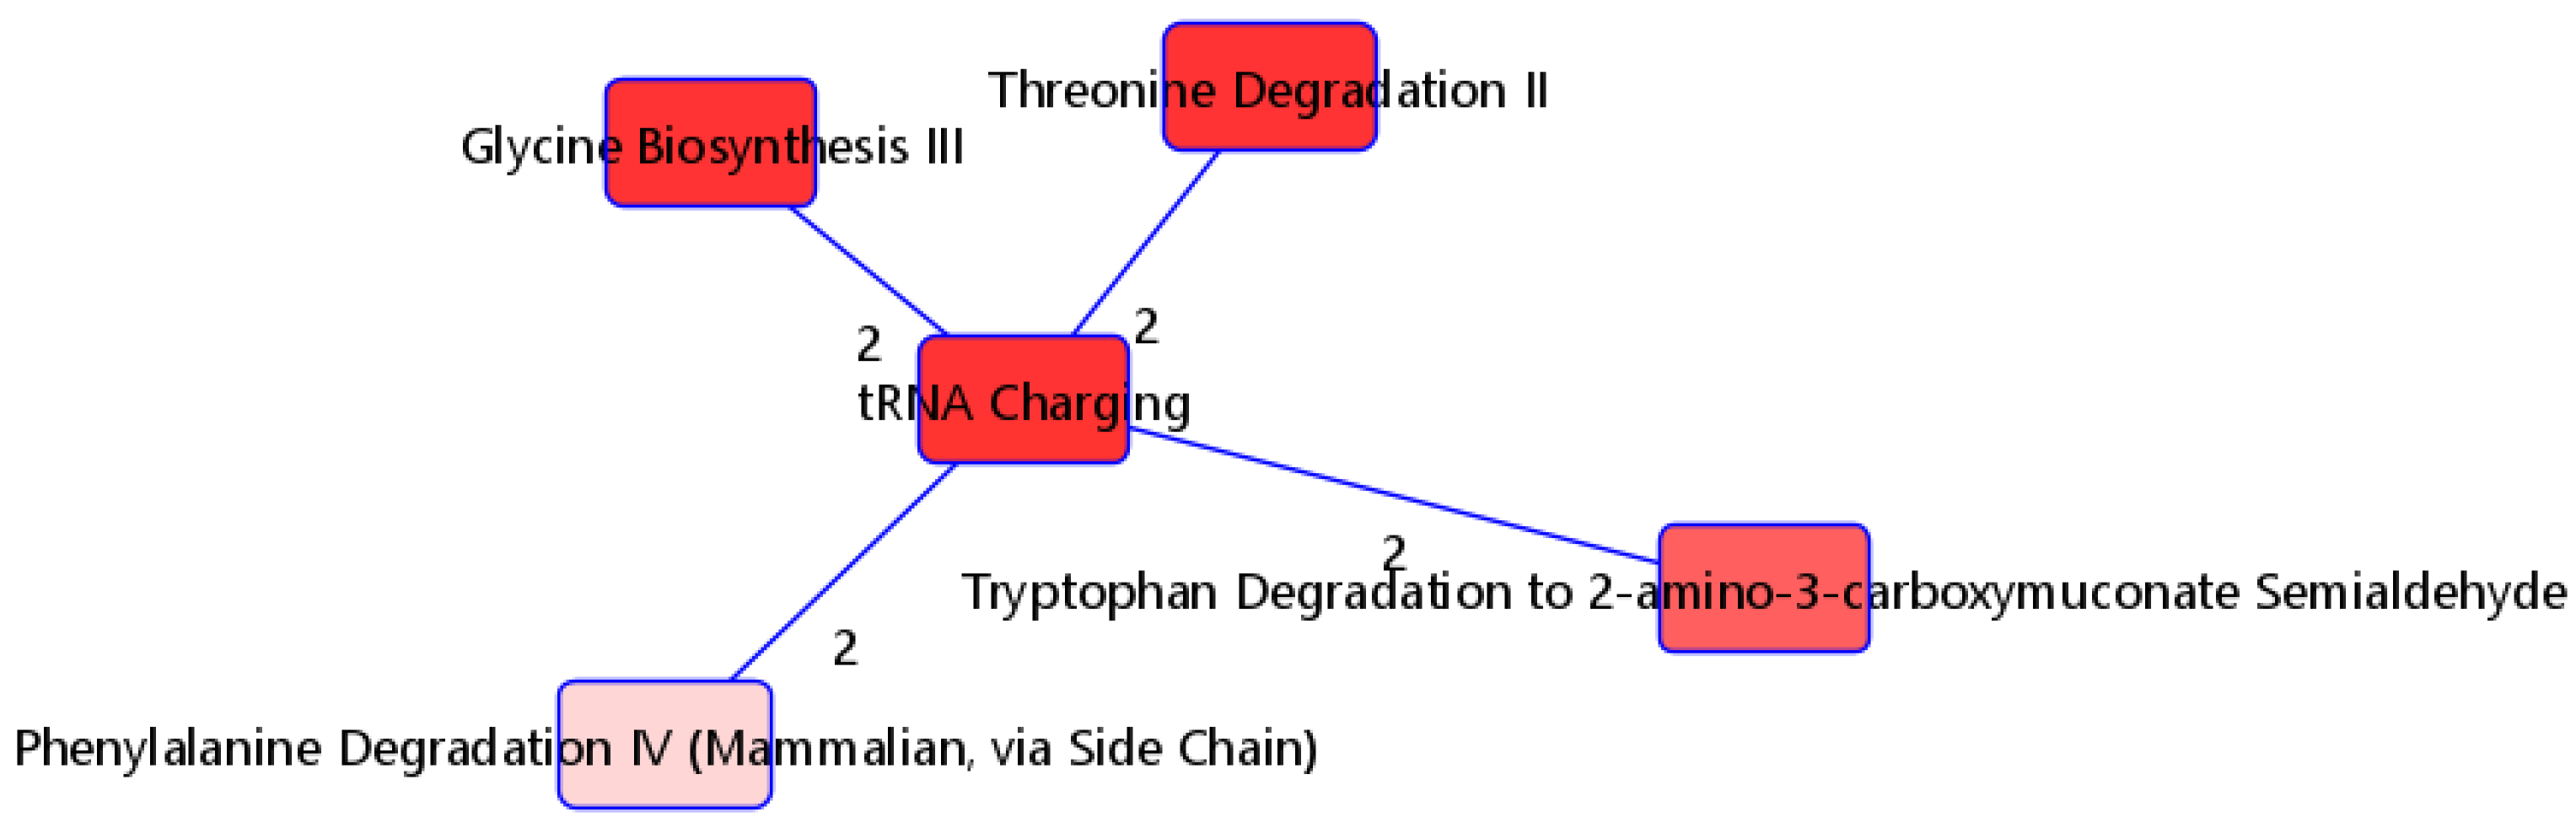
3.3. Pathway Analysis
4. Discussion
5. Conclusions
Supplementary Materials
Author Contributions
Funding
Institutional Review Board Statement
Informed Consent Statement
Data Availability Statement
Acknowledgments
Conflicts of Interest
References
- CDC. Healthcare Workers. Available online: https://www.cdc.gov/coronavirus/2019-ncov/hcp/clinical-care/underlyingconditions.html (accessed on 22 September 2023).
- Rico-Martín, S.; Calderón-García, J.F.; Basilio-Fernández, B.; Clavijo-Chamorro, M.Z.; Sánchez Muñoz-Torrero, J.F. Metabolic Syndrome and Its Components in Patients with COVID-19: Severe Acute Respiratory Syndrome (SARS) and Mortality. A Systematic Review and Meta-Analysis. J. Cardiovasc. Dev. Dis. 2021, 8, 162. [Google Scholar] [CrossRef]
- Makhoul, E.; Aklinski, J.L.; Miller, J.; Leonard, C.; Backer, S.; Kahar, P.; Parmar, M.S.; Khanna, D. A Review of COVID-19 in Relation to Metabolic Syndrome: Obesity, Hypertension, Diabetes, and Dyslipidemia. Cureus 2022, 14, e27438. [Google Scholar] [CrossRef]
- Dissanayake, H. COVID-19 and metabolic syndrome. Best Pract. Res. Clin. Endocrinol. Metab. 2023, 37, 101753. [Google Scholar] [CrossRef]
- Ozturk, A.; Bayraktar, N.; Bayraktar, M.; Ibrahim, B.; Bozok, T.; Resat, C.M. Evaluation of Amino Acid Profile in Serum of Patients with Covid-19 for Providing a New Treatment Strategy. J. Med. Biochem. 2022, 41, 526–533. [Google Scholar] [CrossRef]
- Atila, A.; Alay, H.; Yaman, M.E.; Akman, T.C.; Cadirci, E.; Bayrak, B.; Celik, S.; Atila, N.E.; Yaganoglu, A.M.; Kadioglu, Y.; et al. The Serum Amino Acid Profile in COVID-19. Amino Acids 2021, 53, 1569–1588. [Google Scholar] [CrossRef]
- Martínez-Gómez, L.E.; Ibarra-González, I.; Fernández-Lainez, C.; Tusie, T.; Moreno-Macías, H.; Martinez-Armenta, C.; Jimenez-Gutierrez, G.E.; Vázquez-Cárdenas, P.; Vidal-Vázquez, P.; Ramírez-Hinojosa, J.P.; et al. Metabolic Reprogramming in SARS-CoV-2 Infection Impacts the Outcome of COVID-19 Patients. Front. Immunol. 2022, 13, 936106. [Google Scholar] [CrossRef] [PubMed]
- Thomas, T.; Stefanoni, D.; Reisz, J.A.; Nemkov, T.; Bertolone, L.; Francis, R.O.; Hudson, K.E.; Zimring, J.C.; Hansen, K.C.; Hod, E.A.; et al. COVID-19 Infection Alters Kynurenine and Fatty Acid Metabolism, Correlating with IL-6 Levels and Renal Status. JCI Insight 2020, 5, e140327. [Google Scholar] [CrossRef]
- Ceballos, F.C.; Virseda-Berdices, A.; Resino, S.; Ryan, P.; Martínez-González, O.; Peréz-García, F.; Martin-Vicente, M.; Brochado-Kith, O.; Blancas, R.; Bartolome-Sánchez, S.; et al. Metabolic Profiling at COVID-19 Onset Shows Disease Severity and Sex-Specific Dysregulation. Front. Immunol. 2022, 13, 925558. [Google Scholar] [CrossRef]
- Shen, B.; Yi, X.; Sun, Y.; Bi, X.; Du, J.; Zhang, C.; Quan, S.; Zhang, F.; Sun, R.; Qian, L.; et al. Proteomic and Metabolomic Characterization of COVID-19 Patient Sera. Cell 2020, 182, 59–72.e15. [Google Scholar] [CrossRef] [PubMed]
- D’Amora, P.; Silva, I.D.C.G.; Budib, M.A.; Ayache, R.; Silva, R.M.S.; Silva, F.C.; Appel, R.M.; Júnior, S.S.; Pontes, H.B.D.; Alvarenga, A.C.; et al. Towards Risk Stratification and Prediction of Disease Severity and Mortality in COVID-19: Next Generation Metabolomics for the Measurement of Host Response to COVID-19 Infection. PLoS ONE 2021, 16, e0259909. [Google Scholar] [CrossRef] [PubMed]
- Puskarich, M.A.; Cummins, N.W.; Ingraham, N.E.; Wacker, D.A.; Reilkoff, R.A.; Driver, B.E.; Biros, M.H.; Bellolio, F.; Chipman, J.G.; Nelson, A.C.; et al. A Multi-Center Phase II Randomized Clinical Trial of Losartan on Symptomatic Outpatients with COVID-19. eClinicalMedicine 2021, 37, 100957. [Google Scholar] [CrossRef] [PubMed]
- Puskarich, M.A.; Ingraham, N.E.; Merck, L.H.; Driver, B.E.; Wacker, D.A.; Black, L.P.; Jones, A.E.; Fletcher, C.V.; South, A.M.; Murray, T.A.; et al. Efficacy of Losartan in Hospitalized Patients With COVID-19–Induced Lung Injury: A Randomized Clinical Trial. JAMA Netw. Open 2022, 5, e222735. [Google Scholar] [CrossRef] [PubMed]
- Pearson, K. On the Criterion That a given System of Deviations from the Probable in the Case of a Correlated System of Variables Is Such That It Can Be Reasonably Supposed to Have Arisen from Random Sampling. London Edinb. Dublin Philos. Mag. J. Sci. 1900, 50, 157–175. [Google Scholar] [CrossRef]
- Girden, E. ANOVA; SAGE Publications, Inc.: Thousand Oaks, CA, USA, 1992. [Google Scholar] [CrossRef]
- Mann, H.B.; Whitney, D.R. On a Test of Whether One of Two Random Variables Is Stochastically Larger than the Other. Ann. Math. Stat. 1947, 18, 50–60. [Google Scholar] [CrossRef]
- Ruiz-Perez, D.; Guan, H.; Madhivanan, P.; Mathee, K.; Narasimhan, G. So You Think You Can PLS-DA? BMC Bioinform. 2020, 21, 2. [Google Scholar] [CrossRef]
- Barker, M.; Rayens, W. Partial Least Squares for Discrimination. J. Chemom. 2003, 17, 166–173. [Google Scholar] [CrossRef]
- Krämer, A.; Green, J.; Pollard, J., Jr.; Tugendreich, S. Causal analysis approaches in Ingenuity Pathway Analysis. Bioinformatics 2014, 30, 523–530. [Google Scholar] [CrossRef]
- Rohart, F.; Gautier, B.; Singh, A.; Lê Cao, K.-A. mixOmics: An R Package for ‘omics Feature Selection and Multiple Data Integration. PLoS Comput. Biol. 2017, 13, e1005752. [Google Scholar] [CrossRef]
- Brzyski, D.; Peterson, C.B.; Sobczyk, P.; Candès, E.J.; Bogdan, M.; Sabatti, C. Controlling the Rate of GWAS False Discoveries. Genetics 2017, 205, 61–75. [Google Scholar] [CrossRef]
- Witten, D.; Tibshirani, R. A Comparison of Fold-Change and the t-Statistic for Microarray Data Analysis. Analysis 2007, 1, 1–17. [Google Scholar]
- Law, S.-H.; Chan, M.-L.; Marathe, G.K.; Parveen, F.; Chen, C.-H.; Ke, L.-Y. An Updated Review of Lysophosphatidylcholine Metabolism in Human Diseases. Int. J. Mol. Sci. 2019, 20, 1149. [Google Scholar] [CrossRef] [PubMed]
- Liu, P.; Zhu, W.; Chen, C.; Yan, B.; Zhu, L.; Chen, X.; Peng, C. The Mechanisms of Lysophosphatidylcholine in the Development of Diseases. Life Sci. 2020, 247, 117443. [Google Scholar] [CrossRef]
- Ren, J.; Lin, J.; Yu, L.; Yan, M. Lysophosphatidylcholine: Potential Target for the Treatment of Chronic Pain. Int. J. Mol. Sci. 2022, 23, 8274. [Google Scholar] [CrossRef] [PubMed]
- Xue, M.; Zhang, T.; Cheng, Z.J.; Guo, B.; Zeng, Y.; Lin, R.; Zheng, P.; Liu, M.; Hu, F.; Li, F.; et al. Effect of a Functional Phospholipid Metabolome-Protein Association Pathway on the Mechanism of COVID-19 Disease Progression. Int. J. Biol. Sci. 2022, 18, 4618–4628. [Google Scholar] [CrossRef] [PubMed]
- Jeong, S.; Kim, B.; Byun, D.J.; Jin, S.; Seo, B.S.; Shin, M.H.; Leem, A.Y.; Choung, J.J.; Park, M.S.; Hyun, Y.-M. Lysophosphatidylcholine Alleviates Acute Lung Injury by Regulating Neutrophil Motility and Neutrophil Extracellular Trap Formation. Front. Cell Dev. Biol. 2022, 10, 941914. [Google Scholar] [CrossRef] [PubMed]
- Byeon, S.K.; Madugundu, A.K.; Garapati, K.; Ramarajan, M.G.; Saraswat, M.; Kumar-M, P.; Hughes, T.; Shah, R.; Patnaik, M.M.; Chia, N.; et al. Development of a Multiomics Model for Identification of Predictive Biomarkers for COVID-19 Severity: A Retrospective Cohort Study. Lancet Digit. Health 2022, 4, e632–e645. [Google Scholar] [CrossRef] [PubMed]
- Caterino, M.; Gelzo, M.; Sol, S.; Fedele, R.; Annunziata, A.; Calabrese, C.; Fiorentino, G.; D’Abbraccio, M.; Dell’Isola, C.; Fusco, F.M.; et al. Dysregulation of Lipid Metabolism and Pathological Inflammation in Patients with COVID-19. Sci. Rep. 2021, 11, 2941. [Google Scholar] [CrossRef]
- Drobnik, W.; Liebisch, G.; Audebert, F.-X.; Fröhlich, D.; Glück, T.; Vogel, P.; Rothe, G.; Schmitz, G. Plasma Ceramide and Lysophosphatidylcholine Inversely Correlate with Mortality in Sepsis Patients. J. Lipid Res. 2003, 44, 754–761. [Google Scholar] [CrossRef]
- Park, D.W.; Kwak, D.S.; Park, Y.Y.; Chang, Y.; Huh, J.W.; Lim, C.-M.; Koh, Y.; Song, D.-K.; Hong, S.-B. mpact of Serial Measurements of Lysophosphatidylcholine on 28-Day Mortality Prediction in Patients Admitted to the Intensive Care Unit with Severe Sepsis or Septic Shock. J. Crit. Care 2014, 29, 882.e5–882.e11. [Google Scholar] [CrossRef]
- Cho, W.H.; Yeo, H.J.; Yoon, S.H.; Lee, S.E.; Jeon, D.S.; Kim, Y.S.; Lee, S.J.; Jo, E.J.; Mok, J.H.; Kim, M.H.; et al. Lysophosphatidylcholine as a Prognostic Marker in Community-Acquired Pneumonia Requiring Hospitalization: A Pilot Study. Eur. J. Clin. Microbiol. Infect. Dis. 2015, 34, 309–315. [Google Scholar] [CrossRef]
- Song, J.-W.; Lam, S.M.; Fan, X.; Cao, W.-J.; Wang, S.-Y.; Tian, H.; Chua, G.H.; Zhang, C.; Meng, F.-P.; Xu, Z.; et al. Omics-Driven Systems Interrogation of Metabolic Dysregulation in COVID-19 Pathogenesis. Cell Metab. 2020, 32, 188–202.e5. [Google Scholar] [CrossRef] [PubMed]
- Barberis, E.; Timo, S.; Amede, E.; Vanella, V.V.; Puricelli, C.; Cappellano, G.; Raineri, D.; Cittone, M.G.; Rizzi, E.; Pedrinelli, A.R.; et al. Large-Scale Plasma Analysis Revealed New Mechanisms and Molecules Associated with the Host Response to SARS-CoV-2. Int. J. Mol. Sci. 2020, 21, 8623. [Google Scholar] [CrossRef] [PubMed]
- Wei, J.; Liu, X.; Xiao, W.; Lu, J.; Guan, L.; Fang, Z.; Chen, J.; Sun, B.; Cai, Z.; Sun, X.; et al. Phospholipid Remodeling and Its Derivatives Are Associated with COVID-19 Severity. J. Allergy Clin. Immunol. 2023, 151, 1259–1268. [Google Scholar] [CrossRef] [PubMed]
- López-Hernández, Y.; Oropeza-Valdez, J.J.; Lopez, D.A.G.; Borrego, J.C.; Murgu, M.; Valdez, J.; López, J.A.; Monárrez-Espino, J. Untargeted Analysis in Post-COVID-19 Patients Reveals Dysregulated Lipid Pathways Two Years after Recovery. Front. Mol. Biosci. 2023, 10, 1100486. [Google Scholar] [CrossRef]
- Hannemann, J.; Balfanz, P.; Schwedhelm, E.; Hartmann, B.; Ule, J.; Müller-Wieland, D.; Dahl, E.; Dreher, M.; Marx, N.; Böger, R. Elevated Serum SDMA and ADMA at Hospital Admission Predict in-Hospital Mortality of COVID-19 Patients. Sci. Rep. 2021, 11, 9895. [Google Scholar] [CrossRef]
- Sozio, E.; Hannemann, J.; Fabris, M.; Cifù, A.; Ripoli, A.; Sbrana, F.; Cescutti, D.; Vetrugno, L.; Fapranzi, S.; Bassi, F.; et al. The Role of Asymmetric Dimethylarginine (ADMA) in COVID-19: Association with Respiratory Failure and Predictive Role for Outcome. Sci. Rep. 2023, 13, 9811. [Google Scholar] [CrossRef]
- Jud, P.; Gressenberger, P.; Muster, V.; Avian, A.; Meinitzer, A.; Strohmaier, H.; Sourij, H.; Raggam, R.B.; Stradner, M.H.; Demel, U.; et al. Evaluation of Endothelial Dysfunction and Inflammatory Vasculopathy After SARS-CoV-2 Infection—A Cross-Sectional Study. Front. Cardiovasc. Med. 2021, 8, 750887. [Google Scholar] [CrossRef]
- Masoodi, M.; Peschka, M.; Schmiedel, S.; Haddad, M.; Frye, M.; Maas, C.; Lohse, A.; Huber, S.; Kirchhof, P.; Nofer, J.-R.; et al. Disturbed Lipid and Amino Acid Metabolisms in COVID-19 Patients. J. Mol. Med. 2022, 100, 555–568. [Google Scholar] [CrossRef]
- Takeshita, H.; Yamamoto, K. Tryptophan Metabolism and COVID-19-Induced Skeletal Muscle Damage: Is ACE2 a Key Regulator? Front. Nutr. 2022, 9, 868845. [Google Scholar] [CrossRef]
- Páez-Franco, J.C.; Torres-Ruiz, J.; Sosa-Hernández, V.A.; Cervantes-Díaz, R.; Romero-Ramírez, S.; Pérez-Fragoso, A.; Meza-Sánchez, D.E.; Germán-Acacio, J.M.; Maravillas-Montero, J.L.; Mejía-Domínguez, N.R.; et al. Metabolomics Analysis Reveals a Modified Amino Acid Metabolism That Correlates with Altered Oxygen Homeostasis in COVID-19 Patients. Sci. Rep. 2021, 11, 6350. [Google Scholar] [CrossRef]
- Moens, U.; Kostenko, S.; Sveinbjørnsson, B. The Role of Mitogen-Activated Protein Kinase-Activated Protein Kinases (MAPKAPKs) in Inflammation. Genes 2013, 4, 101–133. [Google Scholar] [CrossRef] [PubMed]
- Wilhelmsen, K.; Xu, F.; Farrar, K.; Tran, A.; Khakpour, S.; Sundar, S.; Prakash, A.; Wang, J.; Gray, N.S.; Hellman, J. Extracellular Signal–Regulated Kinase 5 Promotes Acute Cellular and Systemic Inflammation. Sci. Signal. 2015, 8, ra86. [Google Scholar] [CrossRef] [PubMed]
- Lewis, H.-M.; Liu, Y.; Frampas, C.F.; Longman, K.; Spick, M.; Stewart, A.; Sinclair, E.; Kasar, N.; Greener, D.; Whetton, A.D.; et al. Metabolomics Markers of COVID-19 Are Dependent on Collection Wave. Metabolites 2022, 12, 713. [Google Scholar] [CrossRef] [PubMed]


| Moderate/Severe (n = 39) | Mild (n = 68) | Total (n = 107) | p-Value | |
|---|---|---|---|---|
| Sex | 0.19 | |||
| Male | 27 (69.23%) | 37 (54.41%) | 64 (59.81%) | |
| Age | ||||
| Median [IQR] | 58.00 [48.00, 66.00] | 38.00 [26.00, 51.00] | 47.00 [31.50, 57.00] | <0.001 |
| Race | <0.001 | |||
| Asian | 1 (2.56%) | 3 (4.41%) | 4 (3.74%) | |
| Black or African American | 17 (43.59%) | 3 (4.41%) | 20 (18.69%) | |
| White | 11 (28.21%) | 52 (76.47%) | 63 (58.88%) | |
| Hispanic | 7 (17.95%) | 7 (10.29%) | 14 (13.08%) | |
| Other/unknown | 3 (7.69%) | 3 (4.41%) | 6 (5.61%) | |
| Body mass index (BMI) | 0.004 | |||
| Median [IQR] | 31.96 [26.47, 35.10] | 26.69 [24.24, 31.76] | 28.40 [24.64, 33.04] | |
| Treatment | 0.74 | |||
| Losartan | 21 (53.85%) | 33 (48.53%) | 54 (50.47%) | |
| Diabetes | 0.025 | |||
| No | 29 (74.36%) | 63 (92.65%) | 92 (85.98%) | |
| Yes | 9 (23.08%) | 5 (7.35%) | 14 (13.08%) | |
| Missing | 1 (2.56%) | 0 (0%) | 1 (0.93%) | |
| Coronary artery disease | 0.17 | |||
| No | 37 (94.87%) | 68 (100%) | 105 (98.13%) | |
| Yes | 1 (2.56%) | 0 (0%) | 1 (0.93%) | |
| Missing | 1 (2.56%) | 0 (0%) | 1 (0.93%) | |
| Hypertension | <0.001 | |||
| No | 16 (41.03%) | 62 (91.18%) | 78 (72.90%) | |
| Yes | 22 (56.41%) | 6 (8.82%) | 28 (26.17%) | |
| Missing | 1 (2.56%) | 0 (0%) | 1 (0.93%) | |
| Atrial fibrillation | 0.046 | |||
| No | 34 (87.18%) | 67 (98.53%) | 101 (94.39%) | |
| Yes | 4 (10.25%) | 1 (1.47%) | 5 (4.67%) | |
| Missing | 1 (2.56%) | 0 (0%) | 1 (0.93%) | |
| Pulmonary hypertension | NA | |||
| No | 37 (94.87%) | 68 (100%) | 105 (98.13%) | |
| Missing | 2 (5.13%) | 0 (0%) | 2 (1.87%) | |
| Asthma | 0.74 | |||
| No | 36 (92.31%) | 60 (88.23%) | 96 (89.71%) | |
| Yes | 3 (7.69%) | 8 (11.77%) | 11 (10.29%) | |
| Chronic bronchitis | NA | |||
| No | 38 (97.44%) | 68 (100%) | 106 (99.07%) | |
| Missing | 1 (2.56%) | 0 (0%) | 1 (0.93%) | |
| Chronic obstructive pulmonary disease (COPD) | 0.010 | |||
| No | 34 (87.18%) | 68 (100%) | 102 (95.32%) | |
| Yes | 4 (10.25%) | 0 (0%) | 4 (3.74%) | |
| Missing | 1 (2.56%) | 0 (0%) | 1 (0.93%) | |
| HIV | NA | |||
| No | 38 (97.44%) | 68 (100%) | 106 (99.07%) | |
| Missing | 1 (2.56%) | 0 (0%) | 1 (0.93%) | |
| Uses cigarettes | 0.75 | |||
| No | 37 (94.87%) | 62 (91.18%) | 99 (92.52%) | |
| Yes | 2 (5.13%) | 6 (8.82%) | 8 (7.48%) | |
| Uses vape products | NA | |||
| No | 39 (100%) | 68 (100%) | 107 (100%) |
| Targeted Metabolites | Average VIP | Fold Change Difference | Adjusted p-Value |
|---|---|---|---|
| Lysophosphatidylcholine a C17.0 | 1.82 | 1.63 | 2.86 × 10⁻¹² |
| Lysophosphatidylcholine a C16.1 | 1.82 | 1.63 | 2.86 × 10⁻¹² |
| Lysophosphatidylcholine a C18.0 | 1.79 | 1.60 | 2.98 × 10⁻¹² |
| Lysophosphatidylcholine a C16.0 | 1.78 | 1.60 | 2.98 × 10⁻¹² |
| Lysophosphatidylcholine a C14.0 | 1.74 | 1.56 | 4.03 × 10⁻¹¹ |
| Ceramide (d18.1/24.1) | 1.73 | −1.14 | 1.32× 10⁻⁶ |
| Lysophosphatidylcholine a C18.1 | 1.68 | 1.51 | 1.77 × 10⁻¹¹ |
| Lysophosphatidylcholine a C18.2 | 1.65 | 1.48 | 2.40 × 10⁻¹¹ |
| Lysophosphatidylcholine a C20.3 | 1.55 | 1.39 | 1.12 × 10⁻¹⁰ |
| Cholesteryl ester (14:0) | 1.50 | 1.35 | 9.39 × 10⁻¹⁰ |
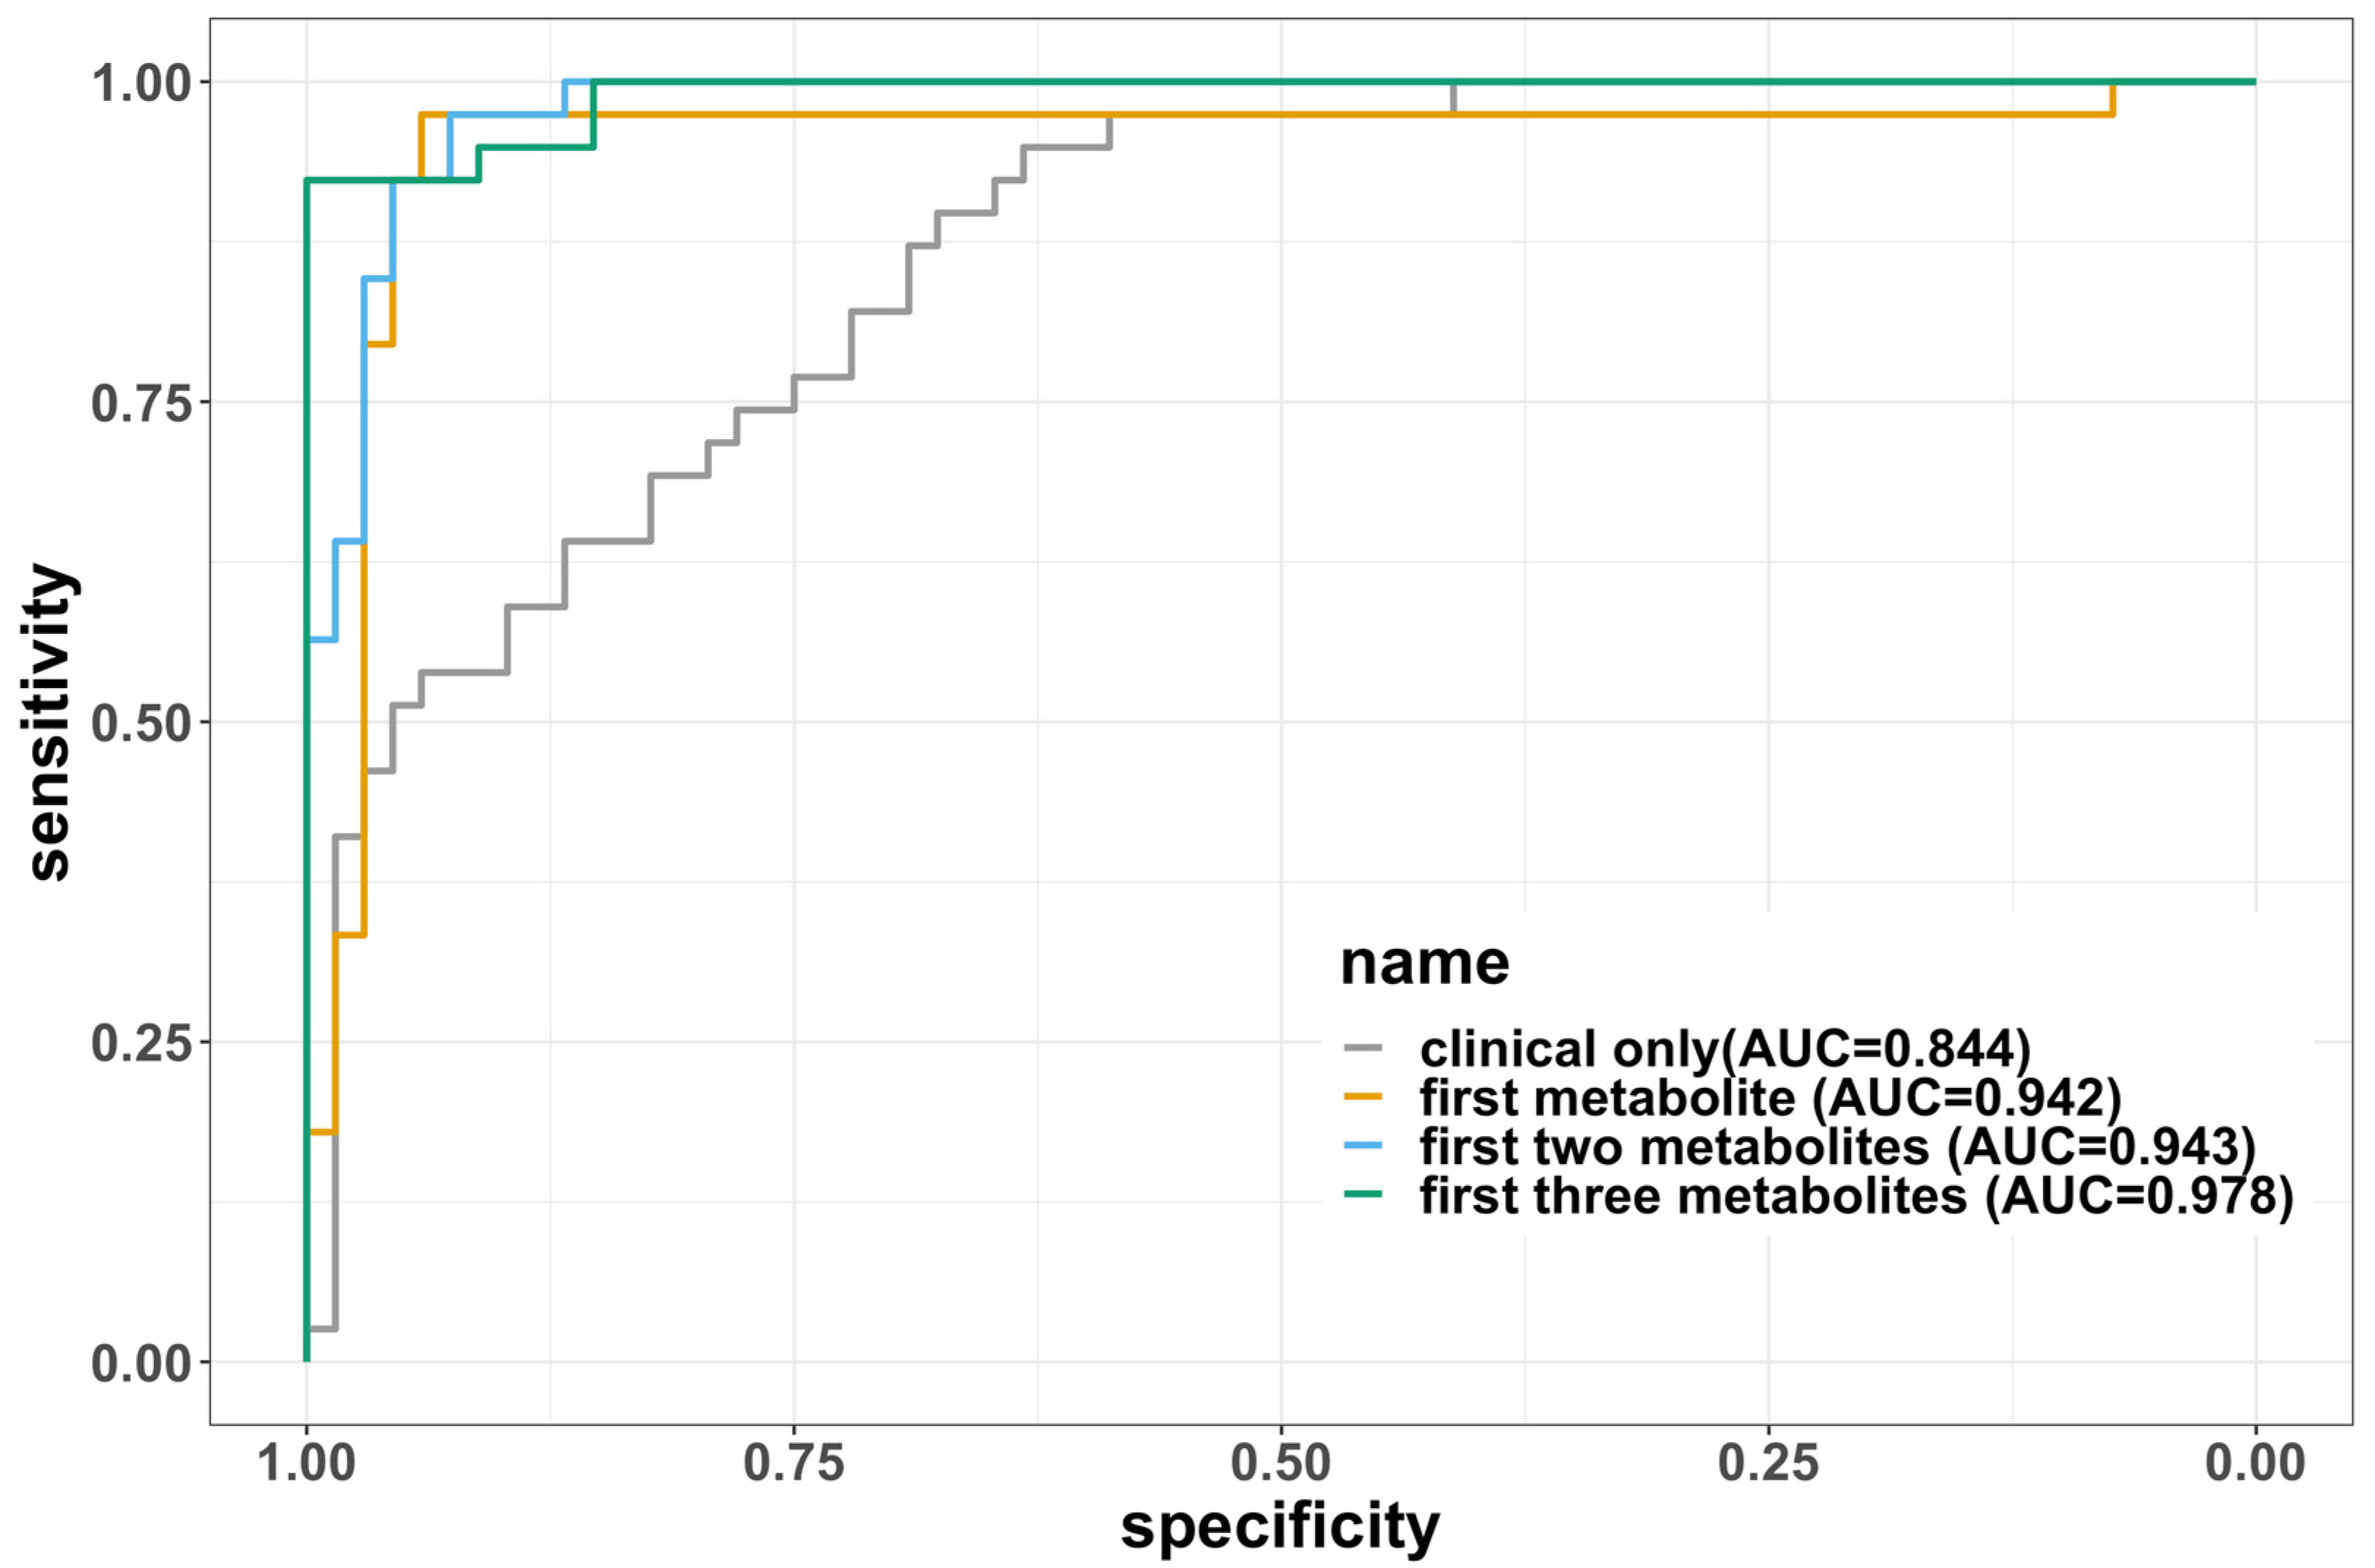
| Variables Included | Error Rate | AUC | Sensitivity | Specificity | F1 |
|---|---|---|---|---|---|
| Clinical only (age, sex, BMI) | 0.265 | 0.844 | 0.800 | 0.628 | 0.789 |
| First metabolite | 0.0668 | 0.942 | 0.946 | 0.911 | 0.947 |
| First two metabolites | 0.09 | 0.967 | 0.933 | 0.87 | 0.929 |
| First three metabolites | 0.0736 | 0.978 | 0.938 | 0.906 | 0.942 |
| (a) | |||||||||||||||||||||||
| Pathway (p-Value) | Molecule | Fold Difference | Adjusted p-Value | ||||||||||||||||||||
| tRNA charging (2.03 × 10⁻⁵) | Glycine | 0.917 | 2.57 × 10⁻⁵ | ||||||||||||||||||||
| L-alanine | 0.961 | 5.32 × 10⁻⁵ | |||||||||||||||||||||
| L-histidine | 1.244 | 1.52 × 10⁻⁷ | |||||||||||||||||||||
| L-phenylalanine | −0.999 | 1.80 × 10⁻⁵ | |||||||||||||||||||||
| L-threonine | 0.894 | 1.47 × 10⁻⁴ | |||||||||||||||||||||
| L-tryptophan | 1.114 | 1.99 × 10⁻⁶ | |||||||||||||||||||||
| Glycine biosynthesis III (1.16 × 10⁻³) | L-alanine | 0.961 | 5.32 × 10⁻⁵ | ||||||||||||||||||||
| Glycine | 0.917 | 2.57 × 10⁻⁵ | |||||||||||||||||||||
| Threonine degradation II (3.94 × 10⁻³) | L-threonine | 0.894 | 1.47 × 10⁻⁴ | ||||||||||||||||||||
| Glycine | 0.917 | 2.57 × 10⁻⁵ | |||||||||||||||||||||
| Tryptophan degradation to 2-amino-3-carboxymuconate semialdehyde (8.23 × 10⁻³) | L-alanine | 0.961 | 5.32 × 10⁻⁵ | ||||||||||||||||||||
| L-tryptophan | 1.114 | 1.99 × 10⁻⁶ | |||||||||||||||||||||
| Phenylalanine degradation IV (mammalian, via side chain) | L-phenylalanine | −0.999 | 1.80 × 10⁻⁵ | ||||||||||||||||||||
| Glycine | 0.917 | 2.57 × 10⁻⁵ | |||||||||||||||||||||
| (b) | |||||||||||||||||||||||
| Predicted upregulators (z-score, p-value of overlap) | HMDBID | Molecule Name | Prediction (based on measurement direction) | Fold Difference | Previous Findings | ||||||||||||||||||
| MAP2K5 (2.646, 3.92 × 10⁻¹¹) | HMDB0060057 | Cholesteryl pentadecanoate | Activated | 1.168 | Upregulates | ||||||||||||||||||
| HMDB0060059 | Cholesteryl margarate | Activated | 0.915 | Upregulates | |||||||||||||||||||
| HMDB0006725 | Cholesteryl myristate | Activated | 1.349 | Upregulates | |||||||||||||||||||
| HMDB0010370 | Cholesteryl octadecatrienoate | Activated | 1.155 | Upregulates | |||||||||||||||||||
| HMDB0000658 | Cholesteryl 9-heaxadecenoate | Activated | 1.025 | Upregulates | |||||||||||||||||||
| HMDB0000610 | Cholesteryl linoleate | Activated | 0.987 | Upregulates | |||||||||||||||||||
| HMDB0000918 | Cholesteryl oleate | Activated | 0.854 | Upregulates | |||||||||||||||||||
| MYC (2.333, 6.43 × 10⁻⁸) | HMDB0006725 | Cholesteryl myristate | Activated | 1.349 | Upregulates | ||||||||||||||||||
| HMDB0000658 | Cholesteryl 9-heaxadecenoate | Activated | 1.025 | ||||||||||||||||||||
| HMDB0006736 | Cholesteryl eicosatrienoate | Activated | 1.034 | Upregulates | |||||||||||||||||||
| HMDB0000610 | Cholesteryl linoleate | Activated | 0.987 | Upregulates | |||||||||||||||||||
| HMDB0010368 | Cholesteryl stearate | Activated | 0.898 | Upregulates | |||||||||||||||||||
| HMDB0000929 | L-tryptophan | Activated | 1.114 | Upregulates | |||||||||||||||||||
| HMDB0000918 | Cholesteryl oleate | Activated | 0.854 | Upregulates | |||||||||||||||||||
| HMDB0000123 | glycine | Activated | 0.917 | Upregulates | |||||||||||||||||||
| HMDB0000220 | Palmitic acid | Inhibited | −0.952 | Upregulates | |||||||||||||||||||
| CD36 (2.219, 2.51 × 10⁻³) | HMDB0010370 | Cholesteryl octadecatrienoate | Activated | 1.155 | Upregulates | ||||||||||||||||||
| HMDB0005435 | triaclyglycerol | Activated | 0.930 | Upregulates | |||||||||||||||||||
| HMDB0000658 | Cholesteryl 9-heaxadecenoate | Activated | 1.025 | Upregulates | |||||||||||||||||||
| HMDB0000610 | Cholesteryl linoleate | Activated | 0.987 | Upregulates | |||||||||||||||||||
| HMDB0000918 | Cholesteryl oleate | Activated | 0.854 | Upregulates | |||||||||||||||||||
Disclaimer/Publisher’s Note: The statements, opinions and data contained in all publications are solely those of the individual author(s) and contributor(s) and not of MDPI and/or the editor(s). MDPI and/or the editor(s) disclaim responsibility for any injury to people or property resulting from any ideas, methods, instructions or products referred to in the content. |
© 2023 by the authors. Licensee MDPI, Basel, Switzerland. This article is an open access article distributed under the terms and conditions of the Creative Commons Attribution (CC BY) license (https://creativecommons.org/licenses/by/4.0/).
Share and Cite
Yang, K.; Kang, Z.; Guan, W.; Lotfi-Emran, S.; Mayer, Z.J.; Guerrero, C.R.; Steffen, B.T.; Puskarich, M.A.; Tignanelli, C.J.; Lusczek, E.; et al. Developing A Baseline Metabolomic Signature Associated with COVID-19 Severity: Insights from Prospective Trials Encompassing 13 U.S. Centers. Metabolites 2023, 13, 1107. https://doi.org/10.3390/metabo13111107
Yang K, Kang Z, Guan W, Lotfi-Emran S, Mayer ZJ, Guerrero CR, Steffen BT, Puskarich MA, Tignanelli CJ, Lusczek E, et al. Developing A Baseline Metabolomic Signature Associated with COVID-19 Severity: Insights from Prospective Trials Encompassing 13 U.S. Centers. Metabolites. 2023; 13(11):1107. https://doi.org/10.3390/metabo13111107
Chicago/Turabian StyleYang, Kaifeng, Zhiyu Kang, Weihua Guan, Sahar Lotfi-Emran, Zachary J. Mayer, Candace R. Guerrero, Brian T. Steffen, Michael A. Puskarich, Christopher J. Tignanelli, Elizabeth Lusczek, and et al. 2023. "Developing A Baseline Metabolomic Signature Associated with COVID-19 Severity: Insights from Prospective Trials Encompassing 13 U.S. Centers" Metabolites 13, no. 11: 1107. https://doi.org/10.3390/metabo13111107
APA StyleYang, K., Kang, Z., Guan, W., Lotfi-Emran, S., Mayer, Z. J., Guerrero, C. R., Steffen, B. T., Puskarich, M. A., Tignanelli, C. J., Lusczek, E., & Safo, S. E. (2023). Developing A Baseline Metabolomic Signature Associated with COVID-19 Severity: Insights from Prospective Trials Encompassing 13 U.S. Centers. Metabolites, 13(11), 1107. https://doi.org/10.3390/metabo13111107